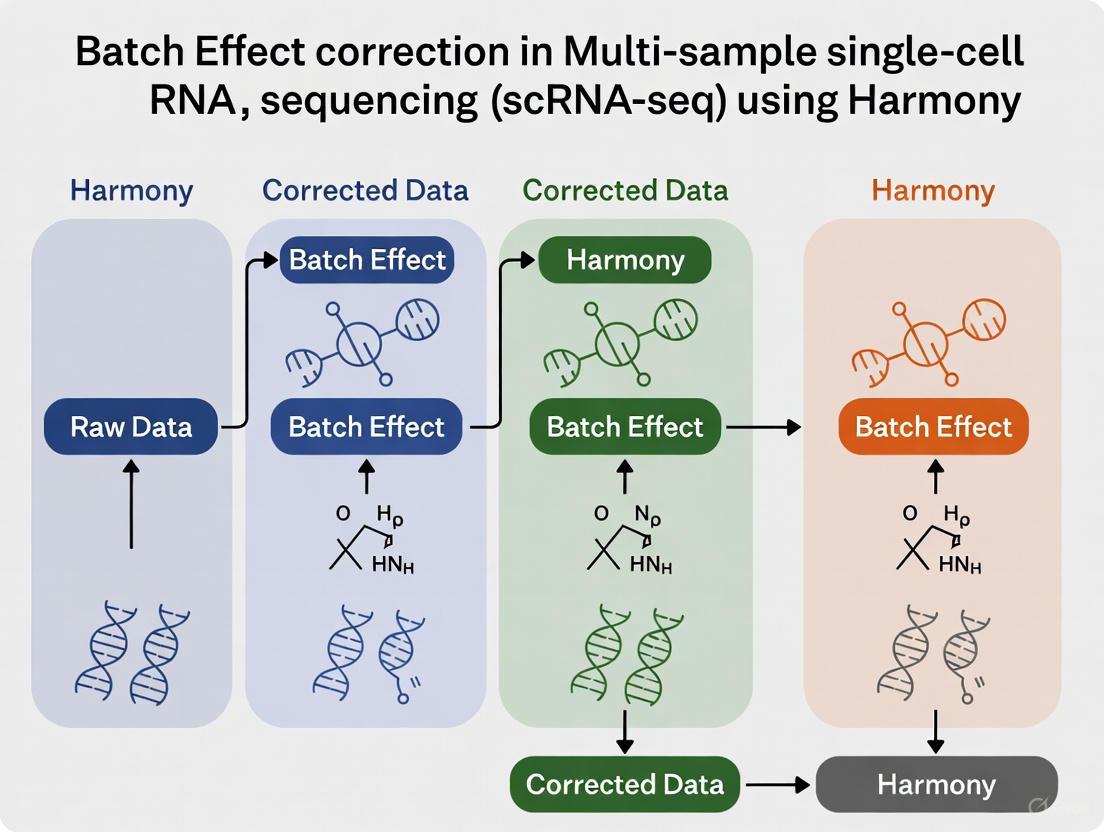
A Comprehensive Guide to Batch Effect Correction in Multi-Sample scRNA-seq Using Harmony
This article provides a complete resource for researchers and scientists performing single-cell RNA sequencing analysis.
A Comprehensive Guide to Batch Effect Correction in Multi-Sample scRNA-seq Using Harmony
Abstract
This article provides a complete resource for researchers and scientists performing single-cell RNA sequencing analysis. It covers the foundational theory of batch effects, a step-by-step practical guide for implementing the Harmony integration algorithm, strategies for troubleshooting and optimizing performance, and a comparative validation against other methods. By synthesizing current benchmarking studies and technical documentation, this guide aims to equip professionals with the knowledge to robustly integrate multi-sample scRNA-seq data, preserve biological variation, and draw accurate conclusions in biomedical and clinical research.
Understanding Batch Effects: The Why and What of scRNA-seq Data Integration
Understanding Batch Effects: Technical Noise vs. Biological Variation
In single-cell RNA sequencing (scRNA-seq) experiments, a "batch effect" refers to technical variation introduced when samples are processed in separate groups or under differing experimental conditions, such as different times, by different personnel, with different reagents, or on different sequencing platforms [1] [2] [3]. These non-biological variations can systematically bias gene expression measurements, confound genuine biological signals, and lead to false discoveries [3] [4].
The core challenge in batch effect correction is distinguishing this technical noise from true biological variation. Technical noise arises from the experimental process, while biological variation stems from the actual cellular differences researchers aim to study, such as different cell types, disease states, or dynamic responses [5].
- Technical Noise: Includes stochastic RNA loss during cell lysis or reverse transcription, amplification bias, differences in capture efficiency between cells, and varying sequencing depths [5] [6].
- Biological Variation: Represents the true heterogeneity in gene expression between different cell types, stochastic allelic expression, and cellular responses to environmental cues [6] [5].
The following table summarizes the key differences and examples.
Table 1: Distinguishing Technical Noise from Biological Variation
| Feature | Technical Noise (Batch Effects) | Biological Variation |
|---|---|---|
| Origin | Differences in experimental handling, reagents, protocols, sequencing runs, or platforms [2] [3] | Underlying biology (e.g., different cell types, cell states, patient-specific genotypes) [6] |
| Impact on Data | Introduces systematic bias that can confound biological analysis; cells cluster by batch rather than cell type [1] [3] | Represents the true signal of interest; cells cluster by type or state [6] |
| Examples | Different lots of enzymes, personnel, day of processing, sequencing depth [2] [7] | Presence of rare cell populations (e.g., tumor cells), dynamic gene expression, alternative splicing [6] |
| Goal of Correction | Remove or minimize this variation to allow for aggregated analysis [1] | Preserve and analyze this variation to answer the biological question [6] |
Frequently Asked Questions (FAQs) on Batch Effects
Q1: What is the difference between data normalization and batch effect correction?
These are distinct but related preprocessing steps [3]:
- Normalization operates on the raw count matrix to correct for cell-specific technical biases such as differences in sequencing depth (total number of reads per cell) and library size. It ensures that expression levels are comparable between cells [3] [4].
- Batch Effect Correction addresses technical variations that arise from processing samples in different batches, such as different sequencing runs, reagents, or laboratories. It typically, though not always, uses a dimensionality-reduced representation of the normalized data to align cells from different batches into a shared space [3].
Q2: How can I detect a batch effect in my scRNA-seq dataset?
You can use both visual and quantitative methods to identify batch effects [3]:
- Visual Methods:
- PCA Plot: Perform Principal Component Analysis (PCA) on the raw data. If the top principal components show clear separation of samples based on their batch label rather than the biological condition, it indicates a strong batch effect [3].
- t-SNE/UMAP Plot: Visualize cell clusters using t-SNE or UMAP. Before correction, cells from the same biological group but different batches often form separate clusters. After successful correction, cells should mix based on biology, not batch [3].
- Quantitative Metrics: Several metrics can quantify the extent of batch effects and the success of correction [3] [4]:
- kBET (k-nearest neighbor batch effect test): Measures if local neighborhoods of cells contain a balanced mix of batches.
- LISI (Local Inverse Simpson's Index): Quantifies batch mixing (higher is better) and cell type separation (higher is better).
- ARI (Adjusted Rand Index) and NMI (Normalized Mutual Information): Measure the similarity of clustering results before and after integration.
Q3: What are the signs of overcorrection in batch effect removal?
Overcorrection occurs when a batch effect method is too aggressive and removes genuine biological variation. Key signs include [3]:
- The loss of expected cell-type-specific markers (e.g., a known T-cell marker is absent in the T-cell cluster).
- Cluster-specific markers consist largely of common housekeeping genes (e.g., ribosomal genes) with widespread high expression.
- A significant overlap in the marker genes identified for different clusters.
- A scarcity of differential expression hits in pathways that are expected to be active given the sample's cell type composition.
Q4: Is batch effect correction the same for scRNA-seq and bulk RNA-seq?
The purpose is the same—to mitigate technical variations—but the algorithms and considerations differ due to the nature of the data [3]. scRNA-seq data is characterized by its high dimensionality (thousands of cells), sparsity (many zero counts), and unique challenges like dropout events. Methods designed for bulk RNA-seq may not scale effectively or handle this sparsity, while scRNA-seq methods may be overly complex for the simpler structure of bulk data [3].
Troubleshooting Guide: Batch Effect Correction with Harmony
Harmony is a widely used algorithm that performs batch correction by iteratively clustering cells in a low-dimensional space (like PCA) and correcting their positions to maximize diversity within each cluster [3] [8]. It is recognized for its ability to integrate datasets effectively while preserving biological variation [8].
Problem: Poor clustering integration after running Harmony. Solution: Follow this systematic troubleshooting workflow.
Problem: Harmony fails to run or produces an error. Solution: This is often related to input data formatting or package installation.
- Action 1: Ensure your input is a dimensionality reduction object (like PCA coordinates) and not the raw count matrix. Harmony corrects embeddings, not counts directly [8] [9].
- Action 2: Confirm that the
meta_dataargument you provide is a data frame containing the batch covariate for each cell. - Action 3: Check that all required packages (
harmony,Rcpp) are correctly installed and updated.
Problem: Biological signal is lost after Harmony integration. Solution: You may be experiencing overcorrection.
- Action 1: Reduce the strength of correction. Adjust the
thetaparameter to a lower value. This parameter controls the diversity clustering; a lowerthetais less aggressive [3]. - Action 2: Validate results by checking for the presence of known canonical cell type markers in your clusters after integration. Their absence is a key sign of overcorrection [3].
- Action 3: Compare your results with a less aggressive method like BBKNN or by simply including batch as a covariate in downstream analyses.
Methodologies & Comparative Analysis
Quantitative Evaluation of Batch Effect Correction Methods
A key part of troubleshooting is selecting the right method. A 2025 evaluation of eight common batch correction methods provides critical insight into their performance, measuring the degree to which they alter data and introduce artifacts during correction [8].
Table 2: Comparative Analysis of scRNA-seq Batch Effect Correction Methods [8]
| Method | Underlying Algorithm | Corrected Object | Key Finding from Evaluation |
|---|---|---|---|
| Harmony | Iterative clustering in PCA space | Embedding | Consistently performed well, introduced minimal artifacts, and was the only method recommended by the study [8]. |
| ComBat | Empirical Bayes, linear model | Count Matrix | Introduced detectable artifacts in the data during correction [8]. |
| ComBat-seq | Negative binomial regression | Count Matrix | Introduced detectable artifacts in the data during correction [8]. |
| Seurat | CCA and MNN (anchors) | Count Matrix / Embedding | Introduced detectable artifacts; can be computationally intensive for large datasets [8] [4]. |
| BBKNN | Batch-balanced k-nearest neighbor graph | k-NN Graph | Efficient, but introduced artifacts and was less effective on complex batch effects [8] [4]. |
| MNN Correct | Mutual Nearest Neighbors | Count Matrix | Performed poorly and often altered the data considerably [8]. |
| LIGER | Integrative Non-negative Matrix Factorization | Embedding | Performed poorly and often altered the data considerably [8]. |
| SCVI | Variational Autoencoder | Embedding / Imputed Counts | Performed poorly and often altered the data considerably [8]. |
Experimental Protocol: Evaluating Batch Correction with Harmony
The following is a detailed protocol for integrating and evaluating datasets using Harmony, based on standard practices [3] [8] [9].
- Preprocessing and Normalization: Begin with the raw count matrix. Perform standard quality control to remove low-quality cells and doublets. Normalize the data to account for sequencing depth (e.g., using log normalization) [4].
- Feature Selection and PCA: Identify highly variable genes. Scale the data and perform Principal Component Analysis (PCA) to obtain a low-dimensional embedding.
- Run Harmony: Use the PCA embedding and a metadata vector specifying the batch for each cell as input for Harmony. Key parameters to consider are
theta(diversity clustering) andlambda(strength of correction). The output is a corrected embedding. - Downstream Analysis and Validation: Use the corrected Harmony embedding for clustering (e.g., Louvain) and visualization (UMAP/t-SNE). Critically evaluate the results:
- Visual Inspection: In the UMAP, cells should cluster by biological type, not by batch.
- Quantitative Metrics: Calculate metrics like LISI or kBET to quantitatively assess batch mixing and biological conservation [4].
- Biological Fidelity: Verify that known cell-type-specific markers are appropriately expressed in the expected clusters.
The Scientist's Toolkit: Essential Research Reagents & Materials
Table 3: Key Reagents and Tools for scRNA-seq and Batch Effect Management
| Item | Function in Experiment | Role in Batch Effect Management |
|---|---|---|
| External RNA Controls (ERCC) | Spike-in RNA molecules added to cell lysate in known quantities [5]. | Serves as an internal standard to empirically model technical noise and capture efficiency across the dynamic range of expression [5]. |
| Unique Molecular Identifiers (UMIs) | Short random barcodes that label individual mRNA molecules during reverse transcription [6]. | Corrects for amplification bias by collapsing PCR duplicates, allowing for more accurate quantification of transcript counts and reducing technical noise [6]. |
| Viability Stain (e.g., DAPI) | Fluorescent dye used to distinguish live from dead cells during cell sorting (FACS) [7]. | Ensures only high-quality, intact cells are selected for sequencing, reducing technical variation from RNA degradation. |
| Cell Hashing Oligos | Antibody-derived tags (ADTs) that label cells from different samples with unique barcodes before pooling [6]. | Allows multiple samples to be multiplexed in a single sequencing library, effectively eliminating batch effects from library prep and sequencing. |
| FACS Pre-Sort Buffer | EDTA-, Mg2+-, and Ca2+-free buffer for resuspending cells before sorting [7]. | Preents carryover of divalent cations that can interfere with reverse transcription, standardizing reaction conditions and reducing batch-to-batch technical variation [7]. |
Troubleshooting Guides
Guide 1: Diagnosing and Resolving Ineffective Batch Correction
Problem: After performing batch correction, cells from different batches still cluster separately in your UMAP/t-SNE visualization.
Diagnosis Steps:
- Assess Integration Metrics: Use quantitative metrics like graph integration local inverse Simpson’s index (iLISI) to evaluate the mixing of batches in local neighborhoods. A low score indicates poor integration [10].
- Check Feature Selection: The selection of Highly Variable Genes (HVGs) is critical. Using too few HVGs may fail to capture sufficient biological signal for effective integration. It is often safer to use more HVGs (e.g., 5,000) than in a standard single-dataset analysis [11].
- Verify Data Preprocessing: Confirm that all datasets were properly normalized (e.g., using
multiBatchNorm()to adjust for differences in sequencing depth) and subset to a common set of features before correction [11].
Solutions:
- Increase Correction Strength: If using a method like Harmony, you can adjust parameters to increase the integration force.
- Switch Methods for Complex Data: For substantial batch effects (e.g., across species or different protocols), simpler methods may be insufficient. Consider advanced deep-learning methods like scVI or scANVI [10] [12].
- Re-evaluate HVGs: Re-run feature selection to include a larger set of HVGs, ensuring markers for dataset-specific subpopulations are retained [11].
Guide 2: Identifying and Correcting Over-Correction
Problem: After batch correction, distinct cell types are artificially merged together.
Diagnosis Steps:
- Visual Inspection: Examine UMAP/t-SNE plots. A clear overlap of samples from very different biological conditions or the merging of known, distinct cell types is a primary indicator of over-correction [13].
- Check Marker Genes: Identify the marker genes for the merged clusters. If a significant portion of these markers are housekeeping genes (e.g., ribosomal genes) with widespread high expression, it suggests biological signal has been erased [13].
- Review Clustering: Perform clustering on the corrected data and check if the resulting clusters contain cells from biologically implausible or overly diverse types [11].
Solutions:
- Reduce Correction Strength: Lower the intensity of the correction parameters (e.g., the
thetaparameter in Harmony, which controls the diversity penalty). - Use a Less Aggressive Method: Methods that are highly effective at removing batch effects can sometimes be too forceful. Try a different algorithm; for instance, if using an adversarial learning model, switch to a method like Harmony or a standard cVAE [10].
- Leverage Cell Type Labels (if available): Some methods, like scANVI, can use prior knowledge of cell type labels to guide the integration and prevent the merging of distinct populations [12].
Guide 3: Handling Unbalanced Sample Designs
Problem: Your experimental batches have imbalanced designs, for example, where one cell type is present in one batch but absent in another, or where cell type proportions vary drastically between batches.
Diagnosis Steps:
- Analyze Cell Type Abundance: Use a method like
scCODAto perform differential abundance testing and identify which cell types have significantly different proportions across your batches [14]. - Visualize Composition: Create bar plots showing the proportion of cells from each batch in every cluster, and vice versa. Clusters dominated by a single batch can indicate either a batch effect or a biologically relevant, batch-specific population [11].
Solutions:
- Choose Robust Methods: Select integration methods that are benchmarked to handle sample imbalance well. Recent studies suggest that scVI and Scanorama are more robust to such imbalances than some other methods [13] [12].
- Avoid Simple Linear Models: Standard linear regression-based batch correction methods (e.g.,
removeBatchEffect) assume the composition of cell populations is the same across batches and can perform poorly with unbalanced data [11] [15]. - Account for Covariates: In downstream differential expression analysis, use statistical models like GLIMES that can account for batch effects and donor-level variation to avoid false discoveries [16].
Frequently Asked Questions (FAQs)
FAQ 1: How can I determine if my data has batch effects that need correction? Before correcting, you should assess whether batch effects are present. Several approaches can help:
- Dimensionality Reduction: Perform PCA, t-SNE, or UMAP on the raw, uncorrected data and color the plots by batch. If cells cluster primarily by batch rather than by expected biological labels (e.g., cell type), a batch effect is likely present [13].
- Clustering: Apply graph-based clustering (e.g., Leiden clustering) to the uncorrected data. If the resulting clusters are predominantly composed of cells from a single batch, this signals a batch effect [11] [13].
- Quantitative Metrics: Use metrics like kBET (k-nearest-neighbor Batch-Effect Test) to quantitatively test for the presence of batch effects beyond visual inspection [12].
FAQ 2: What is the best batch correction method for my single-cell data? There is no single "best" method for all scenarios; the choice depends on your data's complexity and your goal [12]. The table below summarizes the performance of commonly used methods based on recent benchmarks.
| Method | Best For | Key Strengths | Noted Limitations |
|---|---|---|---|
| Harmony [17] | Simple to moderate batch correction tasks; fast runtime [13] [8]. | Fast, accurate, and well-calibrated; consistently performs well in benchmarks [8] [12]. | Less scalable and may be outperformed on very large, complex atlases [13] [12]. |
| Seurat (CCA) [2] | Simple batch correction with similar cell type compositions [12]. | Good performance on simple tasks; widely integrated into a popular toolkit [13] [12]. | Low scalability; can introduce artifacts; struggles with complex integrations [13] [8]. |
| scVI / scANVI [12] | Large, complex datasets; atlas-level integration; substantial batch effects [10] [12]. | High performance on complex tasks; scalable; scANVI can use cell type labels to guide integration [13] [12]. | Requires more data and computational resources; complex to implement [12]. |
| Mutual Nearest Neighbors (MNN) [11] | Foundational method for single-cell data. | Pioneering single-cell specific method; does not require a priori knowledge of cell populations [11]. | Can alter data considerably and introduce artifacts [8]. |
FAQ 3: What are the consequences of ignoring batch effects in downstream differential expression (DE) analysis? Ignoring batch effects can severely confound your DE results:
- False Positives: Genes that are systematically different between batches can be falsely identified as being differentially expressed between biological groups if the groups are confounded with batches [15].
- Loss of Power: Batch effects introduce unwanted technical variation, which can mask true biological differences, making it harder to detect genuinely differentially expressed genes [11] [16].
- Inaccurate Interpretation: The top DE genes may reflect technical variability rather than the biology of interest, leading to incorrect biological conclusions [16]. Using methods like GLIMES, which model batch effects and UMI counts directly, can mitigate these issues [16].
Table 1: Benchmarking Performance of Single-Cell Batch Correction Methods. This table synthesizes results from multiple independent evaluations to guide method selection. A higher score indicates better performance.
| Method | Batch Removal (iLISI) Score | Biological Conservation (NMI) Score | Scalability (Runtime) | Recommended Use Case |
|---|---|---|---|---|
| Harmony | High [8] | High [8] [12] | Fast [13] | Simple to moderate batch effects |
| Scanorama | High [12] | High [12] | Moderate | Complex data integration |
| scVI | High [12] | High [12] | Slow (for small data) / Scalable (for large data) [12] | Large, complex datasets; atlas building |
| Seurat (CCA) | Moderate [12] | Moderate [12] | Slow / Low Scalability [13] | Simple batch correction |
| LIGER | High [13] | Low (can over-correct) [13] [8] | Moderate | Not recommended as top performer [8] |
| BBKNN | Moderate | Moderate | Very Fast [12] | Quick correction on a graph |
Experimental Protocols
Protocol 1: Standard Workflow for Batch Correction with Harmony
Harmony is a widely used and well-regarded method for batch correction. The following protocol outlines its standard implementation [17].
Data Preprocessing:
- Quality Control: Perform QC (filtering cells by gene counts and mitochondrial percentage) on each batch separately [11] [14].
- Normalization: Normalize the raw counts for each cell by its library size and log-transform (e.g.,
log1p). This should be done within each batch [14]. - Feature Selection: Select Highly Variable Genes (HVGs) across all batches. Using ~5000 HVGs is a common and robust starting point [11].
- Scaling: Scale the expression values of the HVGs to have a mean of zero and unit variance.
- Dimensionality Reduction: Perform Principal Component Analysis (PCA) on the scaled data to obtain a low-dimensional embedding.
Running Harmony:
- Input the PCA embedding and a metadata column specifying the batch for each cell into the
HarmonyMatrix()orRunHarmony()function. - Key parameters include
theta(diversity penalty), which controls how strongly to correct, andmax.iter.harmony(maximum number of iterations).
- Input the PCA embedding and a metadata column specifying the batch for each cell into the
Downstream Analysis:
- Use the corrected Harmony embeddings in place of the original PCA embeddings for all subsequent analyses.
- Generate a new UMAP based on the Harmony embeddings to visually assess integration.
- Perform clustering and differential expression analysis using the batch-corrected data.
Protocol 2: A Strategy for Integrating Datasets with Substantial Batch Effects
For challenging integrations (e.g., across species or technologies), a more advanced approach is required [10].
Data Preprocessing and Confirmation:
- Follow the standard preprocessing steps as in Protocol 1.
- Quantitatively confirm the presence of substantial batch effects by measuring the per-cell-type distances between samples from different systems (e.g., human vs. mouse). The distances should be significantly larger between systems than within a system [10].
Method Selection and Execution:
- Choose a method designed for complex integration, such as scVI or the authors' proposed sysVI model, which uses a VampPrior and cycle-consistency constraints [10].
- These are deep learning models that require setting up an AnnData object and training the model for a specified number of epochs.
- The model will learn a batch-corrected, low-dimensional latent representation of the data.
Rigorous Evaluation:
- Beyond visual inspection, use a comprehensive set of metrics to evaluate success.
- Use iLISI to score batch mixing [10].
- Use NMI (Normalized Mutual Information) or other cluster-based metrics to evaluate the preservation of biological cell type structure [10].
- Check for over-correction by ensuring known, distinct cell types do not merge in the corrected space [13].
Signaling Pathways and Workflows
Batch Correction and Evaluation Workflow.
Consequences of Uncorrected Batch Effects.
The Scientist's Toolkit
Table 2: Essential Computational Tools for scRNA-seq Batch Correction.
| Tool / Resource | Function | Key Application |
|---|---|---|
| Harmony [17] | Linear embedding-based batch correction. | Fast and accurate integration for standard batch effects. |
| scVI / scANVI [12] | Deep learning (cVAE) based integration. | Integrating large, complex datasets with substantial batch effects. |
| Seurat [2] | Comprehensive toolkit including CCA-based integration. | A widely used pipeline for end-to-end analysis, including basic integration. |
| Scanpy [8] | Python-based single-cell analysis toolkit. | Provides a environment and wrappers for multiple batch correction methods (BBKNN, Scanorama). |
| scIB [12] | Pipeline for benchmarking batch correction. | Quantitatively evaluating the success of integration using multiple metrics. |
| scCODA [14] | Differential abundance analysis. | Statistically testing for changes in cell type proportions across conditions, accounting for compositionality. |
Core Principles of Harmony
Harmony is an algorithm designed to integrate single-cell RNA sequencing (scRNA-seq) data from different experiments or batches. Its primary goal is to remove technical variations (batch effects) that can confound downstream analysis, while preserving genuine biological variation, such as differences in cell type [8] [18].
The algorithm operates on a principal component analysis (PCA) embedding of the data and corrects batch effects through an iterative process of clustering and linear correction [8] [4]. Unlike methods that alter the original count matrix, Harmony modifies the low-dimensional embedding of cells, which is then used to compute a corrected k-nearest neighbor (k-NN) graph for clustering and visualization [8].
The Harmony Algorithm Workflow
The following diagram illustrates Harmony's iterative process for batch effect correction:
Harmony's Niche in the scRNA-seq Toolbox
Harmony occupies a specific niche within the broader ecosystem of scRNA-seq batch correction tools. The table below summarizes how it compares to other popular methods.
Comparison of Batch Correction Methods
| Method | Input Data | Correction Object | Key Principle | Strengths | Limitations |
|---|---|---|---|---|---|
| Harmony | Normalized count matrix [8] | PCA Embedding [8] | Iterative clustering and linear correction in PCA space [8] | Fast, scalable, well-calibrated, preserves biological variation [8] [18] [4] | Limited native visualization tools [4] |
| Seurat | Normalized count matrix [8] | Count matrix & Embedding [8] | CCA and Mutual Nearest Neighbors (MNN) [19] [2] | High biological fidelity, comprehensive workflow [18] [4] | Computationally intensive for large datasets [4] |
| fastMNN | Normalized count matrix [19] | Low-dimensional embedding [19] | Mutual Nearest Neighbors in PCA space [19] | Returns corrected low-dimensional coordinates [19] | Can introduce artifacts; computationally demanding [8] |
| LIGER | Normalized count matrix [8] | Embedding (Factor loadings) [8] | Integrative non-negative matrix factorization (NMF) & quantile alignment [18] | Distinguishes technical from biological variation [18] | Often alters data considerably; poor calibration [8] |
| BBKNN | k-NN graph [8] | k-NN graph [8] | Batch-balanced k-nearest neighbor graph correction [4] | Computationally efficient, lightweight [4] | Less effective for complex, non-linear batch effects [4] |
| ComBat | Normalized count matrix [8] | Count matrix [8] | Empirical Bayes linear correction [8] | Established method (from bulk RNA-seq) [8] | Introduces artifacts; not designed for scRNA-seq specifics [8] |
Independent benchmark studies have consistently highlighted Harmony's strong performance. One study comparing eight methods found Harmony was the only method that consistently performed well without introducing measurable artifacts into the data [8]. Another large-scale benchmark of 14 methods recommended Harmony, LIGER, and Seurat 3, but noted Harmony's significantly shorter runtime makes it a recommended first choice [18].
Experimental Protocols and Implementation
Standard Workflow for scRNA-seq Data Integration with Harmony
Implementing Harmony typically follows a structured workflow within an R or Python environment. The following diagram outlines the key steps from raw data to integrated analysis:
Detailed Methodology
Data Preprocessing and Normalization
- Begin with a merged Seurat object (in R) or AnnData object (in Python) containing counts from all batches.
- Perform standard normalization, for example using the
LogNormalizemethod in Seurat, which normalizes a cell's gene counts by the total counts for that cell, multiplies by a scale factor (e.g., 10,000), and log-transforms the result [4]. - Identify highly variable genes (HVGs) to focus the subsequent analysis on the most biologically informative features [14].
Dimensionality Reduction and Integration
- Scale the data and perform Principal Component Analysis (PCA) on the normalized and scaled HVGs. The top principal components serve as the input for Harmony [19].
- Run the Harmony integration function (e.g.,
RunHarmonyin R orharmony_integratein scanpy) using the PCA embedding and a metadata column specifying the batch source for each cell [19]. The algorithm will output a corrected embedding.
Downstream Analysis
- Use the Harmony-corrected embedding (e.g.,
harmonyembeddings in the reducedDim slot) to compute a shared nearest neighbor (SNN) graph and perform clustering [19]. - Generate UMAP or t-SNE visualizations based on the corrected embedding to visualize the integrated cell populations [18].
- Conduct differential expression analysis and other biological interpretations on the integrated dataset.
- Use the Harmony-corrected embedding (e.g.,
Key Research Reagent Solutions
The following table lists essential computational "reagents" and their functions for a successful Harmony analysis.
| Resource / Tool | Function | Implementation Example |
|---|---|---|
| Seurat | A comprehensive R toolkit for single-cell genomics data analysis. | Used for data preprocessing, normalization, PCA, and downstream analysis after Harmony integration [19]. |
| Scanpy | A scalable Python toolkit for analyzing single-cell gene expression data. | Used for data preprocessing, normalization, PCA, and downstream analysis in a Python environment [8]. |
| Harmony Package | The core library that performs the batch integration algorithm. | The RunHarmony() function in R or harmony_integrate() in Python is called on a PCA reduction [19]. |
| Highly Variable Genes (HVGs) | A subset of genes with high cell-to-cell variation, likely to contain biologically relevant information. | Selected prior to PCA to reduce noise and computational complexity; improves integration performance [14]. |
| PCA Embedding | A low-dimensional representation of the data that captures the main axes of variation. | Serves as the direct input for the Harmony algorithm [8] [19]. |
Frequently Asked Questions and Troubleshooting
The integration seems to have removed true biological differences between my cell types. What should I do?
This could be a case of over-correction. Harmony is designed to preserve biological variation, but its performance can be influenced by parameter selection. Ensure you are using an appropriate number of highly variable genes (HVGs) before PCA, as this focuses the integration on biologically relevant features [14]. You can also try adjusting the theta parameter in Harmony, which controls the degree of batch correction—a higher theta results in stronger correction, so reducing it might help preserve stronger biological signals [8].
How do I know if my data needs batch correction?
The need for batch correction is often visually apparent in UMAP or t-SNE plots before integration, where cells cluster primarily by batch rather than by cell type [18]. You can also use quantitative metrics like kBET or LISI to statistically assess the level of batch mixing before and after correction [18] [4]. If these metrics indicate significant batch structure (e.g., low batch LISI), correction is warranted.
Harmony is taking a long time to run on my large dataset. Are there any optimizations?
Harmony is generally recognized for its speed and scalability, capable of handling datasets with millions of cells [18] [4]. For very large datasets, ensure you are using the most recent version of the software. You can also try reducing the number of input dimensions (PCA components) provided to Harmony, as this significantly impacts runtime. The authors provide guidance on parameter selection, which can help optimize performance.
Can I use Harmony to project new data into an existing integrated reference?
A potential downside of many batch correction methods, including Harmony, is that the entire integration process typically needs to be repeated when new data is added. The corrected embeddings are tied to the specific set of cells processed, making it challenging to project new cells into an existing reference without re-running the integration [4]. For workflows requiring stable reference embeddings, this is an important consideration.
My downstream clustering results are poor after integration. Is the issue with Harmony?
Poor clustering after integration may not be due to Harmony itself. First, verify the quality of your data preprocessing and normalization. Issues like inadequate quality control (e.g., not removing doublets or low-quality cells) or improper normalization can lead to poor results regardless of the integration method [6] [14]. Ensure that the initial PCA on the unintegrated data shows some biological structure, as Harmony aligns structures that are already present.
## Frequently Asked Questions (FAQs)
Q1: After using Harmony, my batches are well-mixed, but I suspect I may have lost some biological variation. How can I check for this overcorrection?
A1: Overcorrection occurs when a method removes not only technical batch effects but also genuine biological variation. To diagnose this, you can use the Reference-informed Batch Effect Testing (RBET) metric [20]. RBET uses reference genes (e.g., housekeeping genes) that should have stable expression across cell types. A biphasic pattern in RBET scores—where the score first improves and then worsens with increasing correction strength—is a key indicator of overcorrection. In contrast, metrics like LISI or kBET may not detect this biological information loss [20].
Q2: What are the most reliable metrics to get a complete picture of my Harmony integration's success?
A2: A comprehensive evaluation should assess both batch mixing and biological conservation. Rely on a combination of metrics, as no single metric gives the full picture. The table below summarizes the key metrics and their interpretation.
Table 1: Key Metrics for Evaluating scRNA-seq Data Integration
| Category | Metric Name | What It Measures | Interpretation |
|---|---|---|---|
| Batch Mixing | Integration LISI (iLISI) [21] [22] | Effective no. of batches in a cell's neighborhood | Higher scores (>>1) indicate better mixing. |
| Batch Mixing | kBET (k-nearest neighbour batch effect test) [22] [12] | Local batch label distribution vs. global | Lower rejection rates indicate better mixing. |
| Batch Mixing | Batch ASW (Average Silhouette Width) [22] | Compactness of batches based on distance | Scores closer to 1 indicate better mixing. |
| Bio. Conservation | Cell-type LISI (cLISI) [22] [23] | Purity of cell-type labels in a cell's neighborhood | Higher scores indicate better biological preservation. |
| Bio. Conservation | Normalized Mutual Info (NMI) [22] / Adjusted Rand Index (ARI) [22] | Similarity of clustering results to known labels | Scores closer to 1 indicate better label conservation. |
| Bio. Conservation | Isolated Label Scores (F1/ASW) [22] | Preservation of small/rare cell populations | Higher scores indicate rare cell types are conserved. |
| Overcorrection Awareness | RBET (Reference-informed Batch Effect Test) [20] | Batch effect on stably expressed reference genes | A biphasic pattern (score decreases then increases) signals overcorrection. |
Q3: Are the default metrics in the scIB benchmarking pipeline sufficient for evaluating integrations with Harmony?
A3: The standard scIB metrics are a robust foundation but have a known limitation: they may not fully capture intra-cell-type biological variation [24] [25]. For example, subtle differences within a cell type (like a developmental gradient) could be erased during integration without affecting the overall cell-type clustering scores. To address this, an enhanced framework called scIB-E has been proposed, which includes metrics specifically designed to assess the preservation of this fine-grained biological structure [24] [25].
Q4: I need to integrate data from different technologies (e.g., scRNA-seq and snRNA-seq) using a cVAE model. What loss functions help with such substantial batch effects?
A4: For substantial batch effects across different biological or technical systems, standard cVAE models can struggle. Research indicates that simply increasing the strength of the Kullback-Leibler (KL) divergence regularization removes both technical and biological variation indiscriminately, while adversarial learning (ADV) can artificially merge distinct cell types [10]. A more effective approach is the sysVI method, which combines VampPrior (a multimodal prior) with a cycle-consistency (CYC) loss. This combination has been shown to improve batch correction while better preserving biological information in challenging scenarios like cross-species or protocol integration [10].
Q5: How does feature selection impact the performance of integration methods like Harmony?
A5: Feature selection is a critical pre-processing step. Using Highly Variable Genes (HVGs) for integration generally leads to higher-quality results compared to using all features or random genes [23]. The number of selected features also matters; most integration quality metrics show a positive correlation with the number of features (up to a point), while mapping metrics for query-to-reference analysis may show a negative correlation [23]. For best practices, consider using batch-aware HVG selection to mitigate the influence of batch effects during the feature selection process itself [23].
## Experimental Protocols
Protocol 1: Standard Workflow for Evaluating Harmony Integration with scIB Metrics
This protocol outlines the steps to quantitatively assess the success of a Harmony integration using metrics from the scIB benchmarking pipeline [22].
- Input Data Preparation: Start with a pre-processed and normalized single-cell dataset (e.g., a Seurat or Scanpy object) that includes batch and cell-type annotation labels.
- Run Harmony: Perform data integration using Harmony on the PCA cell embeddings.
- Generate Integrated Embedding: Obtain the Harmony-corrected low-dimensional embedding.
- Calculate Metrics:
- For Batch Mixing: Compute iLISI to evaluate the mixing of batches in local neighborhoods.
- For Biological Conservation: Compute cLISI and ARI/NMI to assess the preservation of cell-type labels.
- For Rare Cell Types: Compute Isolated Label F1 score to check if small populations are retained.
- Interpret Results: Compare metric scores against established baselines or pre-integration values. Successful integration is indicated by high iLISI, high cLISI/ARI/NMI, and high Isolated Label F1 scores.
The following diagram illustrates the key decision points and metrics in a standard integration evaluation workflow.
Protocol 2: Advanced Evaluation for Overcorrection with RBET
This protocol uses the RBET framework to detect overcorrection, which is not always captured by standard metrics [20].
- Reference Gene (RG) Selection:
- Strategy 1 (Preferred): Curate a list of experimentally validated, tissue-specific housekeeping genes from published literature.
- Strategy 2 (Default): If validated genes are unavailable, select genes from your dataset that show stable expression both within and across phenotypically different cell clusters.
- Batch Effect Detection on RGs:
- Map the integrated dataset (using the corrected expression matrix) into a 2D space using UMAP.
- Apply the Maximum Adjusted Chi-squared (MAC) statistics to test for batch effect on the reference genes in this low-dimensional representation.
- Interpretation:
- A low RBET score indicates minimal batch effect on the RGs, suggesting successful correction.
- Critically, if the RBET score begins to increase as you strengthen the correction parameters (e.g., increase the number of anchors in Seurat), it signals that biological variation is being erased, i.e., overcorrection is occurring.
Table 2: Key Computational Tools and Metrics for Integration Evaluation
| Tool / Resource Name | Type | Primary Function | Key Feature |
|---|---|---|---|
| Harmony [21] [26] | Integration Method | Corrects batch effects in low-dimensional embeddings. | Fast, linear method; works well on simpler tasks. |
| scIB Python Module [22] | Metric Pipeline | Comprehensive benchmarking of integration methods. | Implements 14 metrics for batch removal and bio-conservation. |
| RBET [20] | Evaluation Metric | Statistical framework for evaluating BEC success. | Sensitive to overcorrection; uses reference genes. |
| scIB-E Framework [24] [25] | Enhanced Metrics | Extended benchmarking for deep learning integrations. | Better captures intra-cell-type biological variation. |
| Highly Variable Genes (HVGs) [23] | Feature Selection | Selects informative genes for integration. | Batch-aware selection improves integration quality. |
| LISI (Local Inverse Simpson's Index) [21] [22] | Evaluation Metric | Measures diversity of batches (iLISI) or cell types (cLISI) in a cell's neighborhood. | Single score that is intuitive to interpret. |
The relationships between different metric types and the biological features they assess are visualized in the following diagram.
Hands-On Integration: A Step-by-Step Harmony Workflow for scRNA-seq Data
FAQs and Troubleshooting Guides
General Principles and Algorithm
What is the core principle behind Harmony's batch effect correction?
Harmony is an algorithm that integrates multiple single-cell RNA-seq datasets by projecting cells into a shared embedding. It works by iteratively clustering cells, calculating dataset-specific correction factors, and adjusting cell coordinates to ensure cells group by biological cell type rather than technical batch origins. This process maximizes dataset diversity within each cluster while preserving biological variation [17] [27] [3].
How do I know if my data needs batch correction before using Harmony?
You can identify batch effects through these methods [3]:
- Visual Inspection: Perform PCA and visualize the top principal components. If cells separate by dataset or batch instead of biological source in the PCA scatter plot, a batch effect is present.
- Clustering Visualization: Create a t-SNE or UMAP plot labeled by batch number. If cells from the same batch cluster together distinctly from cells of other batches, it indicates a batch effect.
- Quantitative Metrics: Use metrics like kBET (k-nearest neighbor batch effect test) or ARI (Adjusted Rand Index) to quantitatively measure batch integration before and after correction.
Data Preprocessing and Input Requirements
What are the precise input requirements for Harmony?
Harmony is highly flexible and can be run in several ways [17] [28] [26]:
- Preferred Input: A matrix of PCA embeddings from principal component analysis (typically the top 20 PCs). When using this input, you must set
do_pca = FALSE. - Alternative Input: A normalized gene expression matrix (e.g., after library size normalization and log transformation). In this case, Harmony will internally scale the data, run PCA, and then perform integration.
- Direct Integration with Pipelines: Harmony can be run directly as part of established workflows like Seurat (using the
RunHarmony()function) and others [17].
What is the recommended preprocessing workflow for my raw count matrix before Harmony?
The industry-standard workflow, as implemented on the 10x Genomics Cloud Analysis platform, involves specific steps and tools [28]:
- Normalization and Variance Stabilization: Use SCTransform (from the Seurat package) on each sample individually. This step normalizes the raw UMI counts, accounts for technical variation, and stabilizes variance across genes.
- Dimensionality Reduction: Perform PCA on the SCTransform-normalized data. Retain the top principal components (e.g., top 20 PCs) for downstream integration.
- Integration: Run Harmony on the PCA embeddings to remove batch-specific effects while preserving biological differences.
What are the common data preparation mistakes that lead to poor Harmony integration?
| Mistake | Consequence | Correction |
|---|---|---|
| Using raw counts as direct input | Poor integration; results dominated by technical noise. | Always normalize (e.g., with SCTransform) and run PCA first. Use PCA embeddings as Harmony input [17] [28]. |
| Incorrectly formatted metadata | Failure to specify batch covariates; no correction is applied. | Ensure metadata is a data frame or vector correctly passed to the group_key_var (or similar) parameter [17]. |
| Insufficient number of PCs | Loss of biological signal; over-correction. | Use a sufficient number of PCs (e.g., 20-50) that capture the majority of variance in the dataset [17]. |
| Integrating datasets with no shared biological cell types | Forced merging of biologically distinct populations; meaningless results. | Perform initial clustering and annotation to confirm overlapping cell types exist across batches [3]. |
Quality Control (QC) and Normalization
How does normalization differ from batch effect correction, and why do I need both?
These are distinct but complementary steps in the data preprocessing pipeline [3]:
| Step | Purpose | Operates On | Mitigates |
|---|---|---|---|
| Normalization | Adjusts for cell-specific technical biases. | Raw count matrix. | Sequencing depth, library size, amplification bias. |
| Batch Effect Correction (Harmony) | Removes sample-specific technical variations. | Reduced dimensions (e.g., PCA). | Different sequencing platforms, reagents, laboratories, or processing times. |
You need both because normalization ensures fair comparisons between individual cells, while batch effect correction ensures fair comparisons across entire samples or experiments.
How can I troubleshoot signs of overcorrection after running Harmony?
Overcorrection occurs when Harmony removes not just technical batch effects but also genuine biological variation. Key signs include [3]:
- Loss of Canonical Markers: The absence of expected cluster-specific markers (e.g., lack of canonical T-cell subtype markers in a dataset known to contain T-cells).
- Non-Informative Markers: A significant portion of your differential expression results comprises genes with widespread high expression (e.g., ribosomal genes) rather than specific cell-type markers.
- Indistinct Clusters: A substantial overlap among markers for different clusters, indicating that biologically distinct populations have been artificially merged.
PCA and Dimensionality Reduction
Why is PCA a critical step before running Harmony?
PCA is critical for two main reasons [17] [27]:
- Dimensionality Reduction: Single-cell data has thousands of genes (features). PCA compresses this information into a smaller set of principal components (PCs) that capture the most significant axes of variation, making the iterative Harmony algorithm computationally tractable.
- Noise Reduction: The top PCs typically capture the strong biological signal and major technical noise, while lower PCs often represent random noise. By selecting only the top PCs, you provide Harmony with a cleaner signal for integration.
How many principal components should I use as input for Harmony?
There is no universal number, but a common range is between 20 and 50 PCs. The exact number depends on the complexity and size of your dataset [17] [28]. You can determine this by:
- Elbow Plot: Using a scree or elbow plot of the standard deviations of the PCs and selecting the point where the curve plateaus.
- Larger Datasets: More complex datasets with many cells and conditions may require more PCs to capture sufficient biological variation.
Workflow and Algorithm Visualization
Harmony Algorithm Workflow
The following diagram illustrates the iterative Harmony algorithm applied to PCA embeddings.
Experimental Protocols and Methodologies
Detailed Protocol: SCTransform + Harmony Pipeline
This protocol outlines the steps for the standard SCTransform and Harmony workflow [28].
1. Input Data Requirements:
- Starting Material: A feature-barcode matrix of raw UMI counts, typically generated from the Cell Ranger pipeline (for 10X Genomics data) or an equivalent technology.
- Data Compatibility: The workflow supports the integration of multiple
.cloupefiles or Seurat objects. Ensure datasets are generated from a consistent transcriptome reference.
2. Normalization with SCTransform:
- Tool: Use the
SCTransform()function in Seurat. - Function: This performs normalization, variance stabilization, and feature selection in one step. It models the raw counts using a regularized negative binomial regression to remove technical variation.
- Key Parameters:
- Variable Features: Set the number of top variable genes to keep (e.g., 3,000). This focuses the analysis on the most informative genes.
- Only Variable Genes: Can be set to
TRUEto exclude non-variable genes, saving memory and computation time.
3. Dimensionality Reduction with PCA:
- Execution: Run PCA on the SCTransform-normalized data using the
RunPCA()function in Seurat. - PC Selection: Determine the number of principal components to retain for downstream analysis (e.g., by an elbow plot). A common practice is to use the first 20-50 PCs.
4. Batch Correction with Harmony:
- Execution in Seurat: Use the
RunHarmony()function, specifying the Seurat object, the group variable (e.g., "batch"), and the PCA reduction to use. - Key Parameters:
group.by.vars: The metadata column(s) containing batch information.max.iter.harmony: The maximum number of iterations to run (default is 10). Increase if the algorithm does not converge.theta: A diversity clustering penalty parameter. Higher values lead to more aggressive correction.
5. Downstream Analysis:
- Clustering and UMAP: Use the corrected Harmony embeddings (accessible via
Embeddings(object, "harmony")) for graph-based clustering and for calculating UMAP/t-SNE plots. Do not use the original PCA embeddings. - Differential Expression: Perform differential expression analysis on the normalized data from SCTransform, using the clusters defined from the Harmony-corrected embeddings.
Research Reagent Solutions
Essential Tools and Packages for Harmony Analysis
The following table details key software tools and their functions required for a typical Harmony workflow [17] [28] [26].
| Tool/Package | Function in Workflow | Key Notes |
|---|---|---|
| Seurat | Comprehensive R toolkit for single-cell analysis. | Provides the framework for data handling, SCTransform, PCA, and running Harmony via RunHarmony() [17] [26]. |
| Harmony | R package for data integration and batch correction. | The core algorithm that integrates datasets. Can be run on PCA embeddings or a normalized matrix [17] [26]. |
| SCTransform | Normalization method within Seurat. | Preferred method for normalization and variance stabilization of raw UMI counts before PCA and Harmony [28]. |
| Cell Ranger | 10X Genomics pipeline for raw data processing. | Generates the initial feature-barcode matrix (raw counts) from sequencing data, which serves as the workflow's input [28]. |
| Loupe Browser | 10X Genomics' visual analysis software. | Used for initial data exploration and filtering of .cloupe files before integration in the Cloud Analysis workflow [28]. |
Frequently Asked Questions
What is Harmony and what does it do? Harmony is an algorithm designed for the fast and accurate integration of single-cell data, such as single-cell RNA sequencing (scRNA-seq) data. Its primary purpose is to remove batch effects, which are technical variations between datasets that can obscure biological signals. Unlike methods that correct the original expression matrix, Harmony operates on a low-dimensional embedding (like PCA), iteratively clustering cells and correcting their positions to align similar cell types across different batches, donors, or technologies [29] [30].
Should I run Harmony before or after clustering? You should run Harmony after performing PCA on your dataset but before downstream analyses like clustering and UMAP visualization. The standard workflow is to use Harmony's corrected PCA embeddings for building neighbor graphs and generating UMAPs, which leads to clusters based on biology rather than batch origin [31] [19].
Can I use Harmony with Seurat?
Yes, Harmony is fully compatible with Seurat. The RunHarmony() function allows you to integrate Harmony directly into your Seurat workflow. After computing PCA using Seurat's functions, you can use RunHarmony() to generate corrected embeddings. For downstream steps like RunUMAP() and FindNeighbors, you should specify reduction = "harmony" to use these corrected coordinates [26].
My Harmony job is running slowly. How can I speed it up?
Performance can be significantly impacted by the underlying numerical libraries. Harmony runs substantially faster with the OPENBLAS library compared to the standard BLAS. If you are using a conda distribution of R, you likely have OPENBLAS. However, for most users, it is recommended to keep multi-threading turned off (ncores = 1), as the default parallelization can sometimes slow things down. For very large datasets (over 1 million cells), you can try gradually increasing the ncores parameter [26].
What are the key parameters to adjust in Harmony? The most common parameters to tune are:
theta: A higher value (e.g., 2) applies greater correction, strengthening batch integration.lambda: A higher value (e.g., 1) increases the diversity of clusters, helping to preserve rare cell types.max.iter.harmony: The maximum number of rounds to run if the algorithm does not converge.
The table below provides a summary of these key parameters.
| Parameter | Default Value | Function | When to Adjust |
|---|---|---|---|
theta |
2 | Controls the diversity penalty and strength of correction. | Increase for stronger batch integration. |
lambda |
1 | Controls the ridge regression penalty, preventing over-correction. | Increase to help preserve rare cell types. |
max.iter.harmony |
10 | Maximum number of rounds to run. | Increase if the algorithm fails to converge. |
ncores |
1 | Number of threads for multi-threaded operations. | Keep at 1 for most datasets; increase for very large datasets (>1M cells). |
What should I do if I get a convergence warning?
If you see a warning that "Harmony did not converge," you should increase the max.iter.harmony parameter (e.g., to 20 or 30) to allow the algorithm more rounds to find a stable solution.
Experimental Protocols and Workflows
Protocol 1: Running Harmony within a Seurat Pipeline
This protocol integrates Harmony into a standard Seurat analysis to align multiple datasets [31] [26] [19].
Setup and Preprocessing: Create your Seurat object, perform standard normalization, and identify variable features.
Scale Data and Run PCA: Scale the data and perform linear dimensionality reduction.
Run Harmony: Integrate the datasets using Harmony. The
group.by.varsparameter should specify the metadata column containing batch information (e.g., "sample").Downstream Analysis: Use the Harmony-corrected embeddings for all subsequent analysis.
Protocol 2: Running Harmony in Standalone R
This protocol outlines how to use Harmony with a standard SingleCellExperiment object, independent of Seurat [19].
Input Preparation: Begin with a SingleCellExperiment object that has already been pre-processed, normalized, and has PCA computed.
Run Harmony: Execute the core Harmony function on the PCA matrix.
Transfer Corrected Embeddings: Store the Harmony output back into your SingleCellExperiment object for downstream tasks.
Downstream Analysis: Proceed with clustering and UMAP using the Harmony-corrected embeddings.
The following diagram illustrates the logical workflow and key decision points for both protocols.
The Scientist's Toolkit: Research Reagent Solutions
The table below lists key software and computational resources essential for running Harmony analyses.
| Resource | Function | Usage in Harmony Workflow |
|---|---|---|
| R (≥ 3.5.0) [32] | The programming language and environment for statistical computing. | The foundational platform required to install and run the Harmony package. |
| harmony R package [32] | The implementation of the Harmony algorithm for data integration. | The core package providing the RunHarmony() and HarmonyMatrix() functions. |
| Seurat (≥ 4.1.1) [32] [31] | A comprehensive R package for single-cell genomics data analysis. | Provides the framework for data handling, preprocessing, and downstream analysis when using the Seurat pipeline. |
| SingleCellExperiment [32] | A S4 class for storing single-cell genomics data. | Serves as a standard container for data in the standalone R workflow. |
| OPENBLAS [26] | An optimized library for numerical linear algebra computations. | Can significantly accelerate Harmony's runtime compared to standard BLAS libraries. |
| Cell Ranger [33] | 10x Genomics' pipeline for processing single-cell data. | Often used for initial data processing (demultiplexing, alignment, counting) before analysis with Harmony in R. |
Frequently Asked Questions
Q1: After running Harmony, my UMAP still shows batch-specific clusters. What should I check?
This typically indicates incomplete integration. First, verify that you are using the Harmony-corrected embeddings (harmony_embeddings) and not the original PCA for your UMAP calculation and downstream clustering [17]. Second, ensure that the group.by.vars parameter correctly specifies your batch covariate. Finally, try increasing the max.iter.harmony parameter to allow the algorithm more iterations to converge [34].
Q2: How do I choose the right resolution parameter for Leiden clustering after integration? The choice of resolution is dataset-specific and controls the coarseness of the clustering. A higher resolution value leads to more clusters [35]. It is best practice to test a range of values (e.g., 0.2, 0.6, 1.0, 1.4) and visualize the results. Use a higher resolution to identify fine-grained subpopulations and a lower resolution to discern broad cell types. The clustering should form biologically plausible groups when compared with known marker genes.
Q3: Why does my UMAP plot look different every time I run it, even with the same Harmony embeddings?
UMAP contains a stochastic step, meaning it incorporates an element of randomness. To ensure reproducible visualizations, you must set a random seed (e.g., set.seed(123)) before executing the UMAP function [36] [37]. Note that while the exact shape of the clusters may vary between runs, the overall global topology and cluster composition should be consistent.
Q4: Should I run clustering before or after data integration with Harmony? You should run clustering after integration. The standard workflow is: 1) Data preprocessing and PCA, 2) Running Harmony on the PCA embeddings to remove batch effects, 3) Performing Leiden clustering on the corrected Harmony embeddings, and 4) Generating a UMAP from the same corrected embeddings for visualization [17] [35] [12]. Clustering on pre-integration data will likely yield clusters confounded by batch effects.
Q5: How can I quantitatively assess if my integration and clustering were successful? Successful integration achieves two goals: good mixing of batches and accurate separation of cell types. You can use metrics like:
- Integration LISI (iLISI): Measures the effective number of datasets in a cell's local neighborhood. Higher values indicate better batch mixing [34].
- Cell-type LISI (cLISI): Measures the effective number of cell types in a cell's local neighborhood. Values close to 1 indicate distinct separation of cell types [34]. Biologically, you should validate clusters using known marker genes to ensure they correspond to meaningful cell states.
Troubleshooting Guide
| Problem | Potential Cause | Solution |
|---|---|---|
| Poor batch mixing | Incorrect covariate specification; too few Harmony iterations. | Double-check group.by.vars; increase max.iter.harmony [17] [34]. |
| Over-correction (biological signal lost) | The specified batch covariate is confounded with a biological variable of interest. | Re-evaluate experimental design; if possible, use a method that allows for guidance with cell type labels [12]. |
| Too few/too many clusters | Suboptimal Leiden resolution parameter. | Run Leiden clustering at multiple resolutions and select the most biologically interpretable one [35]. |
| Disconnected clusters of same cell type | UMAP parameters (like n_neighbors) are set too low, breaking continuous populations. |
Increase the n_neighbors parameter in UMAP to capture more of the global data structure [36]. |
| Low-quality clusters after integration | Clustering was performed on original PCA, not Harmony embeddings. | Ensure all downstream steps (clustering, UMAP) use the corrected embeddings from Harmony [17]. |
Performance Benchmarks and Quantitative Guidance
The following table summarizes key metrics from the Harmony publication, demonstrating its performance on a cell line benchmark dataset [34].
| Metric | Description | Pre-Harmony Value (median) | Post-Harmony Value (median) | Interpretation |
|---|---|---|---|---|
| iLISI (Integration LISI) | Effective number of datasets in a local neighborhood. Scale: 1 (worst) to 2 (best for 2 batches). | 1.01 | 1.59 | Significantly improved batch mixing. |
| cLISI (Cell-type LISI) | Effective number of cell types in a local neighborhood. Scale: 1 (best) to 2 (worst). | 1.00 | 1.00 | Perfect separation of Jurkat and 293T cell types was maintained. |
Experimental Protocols
Protocol 1: Standard Post-Harmony Clustering and Visualization Workflow This protocol details the steps to take after you have obtained a corrected embedding from Harmony [17] [35].
- Input: A Harmony-corrected embedding matrix (
harmony_embeddings). - Construct a k-Nearest Neighbor (KNN) Graph: Use the corrected embeddings as input. A common choice is to use the top 30 principal components from the Harmony output and set
n_neighborsto a value between 5 and 100, depending on dataset size [35]. - Perform Leiden Clustering: Run the Leiden algorithm on the KNN graph. Systematically test resolution parameters.
- Generate UMAP Visualization: Compute UMAP using the same corrected embeddings.
- Validation: Visually inspect UMAPs colored by batch and cluster. Use differential expression to find marker genes for each cluster and annotate cell types.
Protocol 2: Evaluating Integration Success with LISI Metrics To quantitatively reproduce the benchmarks from the Harmony paper, you can calculate LISI metrics [34].
- Requirement: A matrix of cell embeddings (e.g., from Harmony) and accompanying metadata for dataset (batch) and cell type.
- Calculation: The LISI metric calculates the effective number of labels (datasets or cell types) in a local neighborhood of each cell, based on the inverse Simpson's index.
- Interpretation:
- A successful integration will have a high iLISI (close to the theoretical maximum for your number of batches), indicating datasets are well-mixed.
- A successful integration will have a low cLISI (close to 1), indicating that local neighborhoods are pure and contain only one cell type.
Workflow Diagram
The following diagram illustrates the logical sequence of steps for post-integration analysis, highlighting key decision points.
The table below lists key computational tools and their functions in post-Harmony analysis.
| Item | Function in Analysis | Key Parameter(s) to Consider |
|---|---|---|
| Harmony Algorithm [17] [34] | Integrates single-cell datasets by removing batch effects while preserving biological variation. | group.by.vars (batch covariate), max.iter.harmony (iterations) |
| Leiden Algorithm [35] | A graph-based clustering algorithm that identifies communities of cells in the KNN graph. | resolution (controls number/cluster granularity) |
| UMAP [36] | Non-linear dimensionality reduction for visualizing high-dimensional data in 2D/3D. | n_neighbors (balances local/global structure), min_dist |
| LISI Metrics [34] | Quantitative scores to evaluate the success of integration (iLISI) and biological conservation (cLISI). | perplexity (can be set related to dataset size) |
| Scanpy / Seurat [35] [17] | Comprehensive single-cell analysis toolkits that provide pipelines for running Harmony, clustering, and visualization. | Framework-specific parameters for upstream normalization and PCA. |
Frequently Asked Questions (FAQs)
1. What is the primary difference between normalization and batch effect correction? Normalization and batch effect correction address different technical variations. Normalization operates on the raw count matrix to mitigate differences in sequencing depth, library size, and amplification bias across cells. In contrast, batch effect correction typically works on a dimensionality-reduced representation of the data to mitigate variations caused by different sequencing platforms, timing, reagents, or laboratory conditions [3].
2. How can I detect the presence of batch effects in my dataset before correction? You can identify batch effects through both visualization and quantitative metrics:
- Visualization: Perform PCA and visualize the top principal components. Cells grouping by batch rather than biological source indicates a batch effect. Similarly, in a UMAP plot, cells from the same biological group but different batches forming separate clusters suggest a batch effect [3].
- Quantitative Metrics: Metrics like the k-nearest neighbor batch effect test (kBET) and local inverse Simpson's index (LISI) can quantitatively measure the degree of batch separation before correction [18] [3].
3. What are the key signs that my batch correction might be overcorrected? Overcorrection removes biological signal along with technical batch effects. Key signs include [3]:
- Cluster-specific marker genes are dominated by universally highly expressed genes (e.g., ribosomal genes).
- Significant overlap exists between marker genes for different clusters.
- Expected canonical marker genes for known cell types are absent.
- Differential expression analysis fails to yield hits for pathways expected from the experimental conditions.
4. My data comes from multiple samples and conditions. How do I structure the group.by.vars in Harmony to avoid overcorrection?
A common cause of overcorrection is including both the sample identifier (e.g., orig.ident) and the biological condition (e.g., condition) in the group.by.vars parameter. This can cause Harmony to mistakenly remove the biological difference of interest. The best practice is to supply only the technical batch covariates (like sample identifier or processing date) to group.by.vars and not your biological condition of interest [38].
5. Which batch correction methods are recommended for large-scale scRNA-seq datasets? Benchmarking studies have shown that Harmony, LIGER, and Seurat 3 are among the top-performing methods for batch integration. Due to its significantly shorter runtime, Harmony is often recommended as the first method to try [18]. For larger and more complex datasets, scVI and Scanorama also demonstrate strong performance [14].
Troubleshooting Guides
Issue 1: Overcorrection of Biological Signal
Problem: After running Harmony, the UMAP shows that biological groups (e.g., CTRL vs. STIM) have merged when they should be distinct [38].
Solution:
- Check
group.by.vars: Ensure you are only grouping by technical batch variables (like sample ID) and not your biological condition. - Re-run Harmony with corrected parameters. For example, if your metadata has columns
orig.ident(sample ID) andcondition(CTRL/STIM), group only byorig.ident.
Corrected Code Snippet:
Issue 2: Poor Data Quality Obscuring Integration
Problem: Low-quality cells or high ambient RNA contamination prevent effective batch correction.
Solution: Perform rigorous quality control (QC) before integration.
- Calculate QC Metrics: Compute key metrics for each cell [39] [40] [14].
- Filter Cells: Apply thresholds to remove low-quality cells and doublets. Thresholds are experiment-dependent, but common starting points are:
nFeature_RNA > 200 & nFeature_RNA < 2500(Number of genes per cell)percent.mt < 5-10%(Percentage of mitochondrial counts)
Practical Code Snippet (Seurat):
Issue 3: Ineffective Batch Mixing After Harmony
Problem: After running Harmony, batches are still not well-integrated in the UMAP.
Solution:
- Verify Input Data: Ensure data has been normalized (e.g., via
SCTransform) and that highly variable genes have been selected before PCA. - Adjust Harmony Parameters: Increase the
max.iter.harmonyto allow for more convergence iterations. - Evaluate with Metrics: Use quantitative metrics like kBET or LISI on the Harmony embeddings to objectively assess improvement [18] [3].
Practical Code Snippet:
Experimental Protocols & Workflows
Standardized Workflow for Multi-sample scRNA-seq Analysis with Harmony
The following diagram illustrates the core steps for a robust analysis, from raw data to a batch-corrected visualization.
Protocol: Evaluating Batch Correction Efficacy
Objective: To quantitatively and visually assess the success of Harmony integration. Methods:
- Visual Inspection: Compare UMAP plots colored by
batchand bycelltypebefore and after correction. Successful correction shows batches mixed within cell type clusters [3]. - Quantitative Metrics:
- LISI (Local Inverse Simpson's Index): Measures batch mixing (higher LISI is better) and cell type separation (should be maintained or improved). A LISI score close to 1 for batch indicates excellent mixing [18] [3].
- kBET (k-nearest neighbor batch effect test): Tests if local neighborhoods of cells reflect the global batch composition. A lower rejection rate indicates better mixing [18].
- ARI (Adjusted Rand Index): Measures the similarity in cell type clustering before and after correction to ensure biological signals are preserved [18].
Materials:
- Preprocessed and Harmony-corrected Seurat object.
- R packages:
Seurat,Harmony, and metrics calculators (e.g.,lisipackage).
Data Presentation
Table 1: Benchmarking Metrics for Batch Correction Evaluation
This table summarizes key metrics used to evaluate the performance of batch-effect correction methods like Harmony [18] [3].
| Metric Name | Acronym | What It Measures | Interpretation | Ideal Outcome |
|---|---|---|---|---|
| k-nearest neighbor Batch-effect Test | kBET | The degree of batch mixing in local cell neighborhoods. | Lower rejection rate indicates better mixing. | Closer to 0 |
| Local Inverse Simpson's Index | LISI | The effective number of batches or cell types in a local neighborhood. | Higher batch LISI = better mixing. Stable cell type LISI = biology preserved. | Batch LISI closer to total # of batches |
| Adjusted Rand Index | ARI | The similarity of cell type clustering before and after correction. | Higher values indicate cell type identity is better preserved. | Closer to 1 |
| Average Silhouette Width | ASW | How similar a cell is to its own cluster compared to other clusters. | Higher values indicate tighter, more distinct clusters. | Closer to 1 |
Table 2: Troubleshooting Signs of Overcorrection
This table helps diagnose the common problem of overcorrection, where biological signal is erroneously removed [3].
| Observation | Description | Potential Cause |
|---|---|---|
| Non-informative Markers | Cluster-specific marker genes are dominated by universal housekeeping genes (e.g., ribosomal proteins). | Biological signal has been eroded, leaving only technical or ubiquitous expression. |
| Indistinct Clusters | Significant overlap in the marker gene lists between different cell clusters. | Defining biological differences between cell types have been minimized. |
| Lost Canonical Markers | Well-established, expected marker genes for a known cell type are no longer detected. | The biological condition defining that cell type was incorrectly treated as a batch effect. |
| Missing DE Pathways | Differential expression analysis fails to find hits in pathways expected from the experimental design. | The biological response to the experimental condition has been corrected away. |
The Scientist's Toolkit: Research Reagent Solutions
The following table details key computational "reagents" – software tools and packages – essential for performing batch correction with Harmony.
| Tool / Resource | Function | Use Case / Explanation |
|---|---|---|
| Seurat | A comprehensive R toolkit for single-cell genomics. | Provides the primary environment for data manipulation, normalization, PCA, and visualization pre- and post-Harmony [38]. |
| Harmony | An algorithm for integrating single-cell data from multiple experiments. | The core correction tool used to remove technical batch effects while preserving biological variance [18] [41]. |
| DoubletFinder | A doublet detection algorithm. | Identifies and removes multiplets (doublets) from the data, which is a critical QC step before integration to avoid spurious results [14]. |
| SoupX | A tool for ambient RNA correction. | Estimates and subtracts the background pool of ambient RNA molecules, improving data quality prior to batch correction [14]. |
| scVI | A deep generative model for single-cell transcriptomics. | An alternative batch correction method, particularly powerful for very large and complex datasets [14]. |
| LISI/kBET | Quantitative metrics for integration quality. | Used post-correction to objectively evaluate the success of batch mixing and biological preservation [18]. |
Beyond Defaults: Fine-Tuning Harmony Parameters and Overcoming Common Pitfalls
In the context of batch effect correction for multi-sample single-cell RNA sequencing (scRNA-seq) research, Harmony stands as a pivotal integration algorithm. It projects cells from multiple datasets into a shared embedding where cells group by cell type rather than dataset-specific conditions, effectively disentangling biological and technical variation [34]. The power and flexibility of the Harmony method are primarily accessed through its key parameters: theta, lambda, sigma, and nclust. This guide provides a detailed technical explanation of these parameters, supported by troubleshooting advice and practical implementation protocols, to empower researchers in conducting robust integrative analysis.
Core Harmony Parameters
The table below summarizes the four key Harmony parameters, their default values, and their primary functions.
| Parameter | Default Value | Primary Function | Effect of Increasing the Value |
|---|---|---|---|
theta |
2 | Diversity clustering penalty. | Encourages more diverse clusters (i.e., a better mix of datasets within each cluster). [42] [43] [44] |
lambda |
1 | Ridge regression penalty. | Makes correction more conservative and stable, protecting against over-correction. [42] [43] [44] |
sigma |
0.1 | Width of soft kmeans clusters. | Assigns cells to more clusters; creates softer, more probabilistic cluster assignments. [42] [44] |
nclust |
NULL (auto-detected) | Number of clusters in the model. | Directly sets the number of surrogate cell state clusters used for correction. [42] [44] |
Detailed Parameter Mechanics
Theta (θ): Diversity Clustering Penalty: The
thetaparameter directly controls the algorithm's incentive to form clusters that include cells from multiple datasets (or batches). A higherthetavalue applies a stronger penalty to clusters that are dominated by a single batch, thereby pushing the algorithm to create more diverse, well-mixed clusters. Settingtheta = 0disables this diversity encouragement entirely, while values larger than 2 will more aggressively force datasets to mix [42] [43] [44].Lambda (λ): Ridge Regression Penalty: This parameter acts as a regularizer during the cluster-specific correction step. A higher
lambdavalue results in a smaller, more conservative correction, which helps protect subtle biological signals from being erased. Conversely, smaller values oflambda(e.g., 0.1) lead to more aggressive correction, which can be beneficial when batch effects are strong and stubborn. If set toNULL, Harmony will attempt to estimatelambdaautomatically to minimize overcorrection, though this feature was noted to be "still in beta testing" [44] [45].Sigma (σ): Soft Kmeans Width:
Sigmadetermines how "fuzzy" or soft the cluster assignments are. A largersigmavalue means each cell has a non-zero probability of belonging to a wider range of clusters, making the cluster assignments softer. A smallersigmavalue makes the clustering behavior approach that of hard clustering, where a cell belongs to only one cluster. This parameter effectively scales the distance from a cell to cluster centroids during the assignment step [42] [44].Nclust: Number of Clusters: The
nclustparameter defines the number of clusters (k) used in Harmony's soft k-means clustering during each iteration. These clusters serve as surrogate variables for cell types and states. If left unspecified (NULL), Harmony will automatically determine a suitable value, with an internal cap of 200 [43] [44]. Settingnclust = 1reduces the Harmony model to simple linear regression [44].
The Harmony Algorithm Workflow
The following diagram illustrates the iterative Harmony workflow and how the key parameters influence the process.
Troubleshooting Common Harmony Issues
Problem: Incomplete Integration (Datasets Not Mixing Well)
- Symptoms: Cells still separate strongly by batch in the UMAP visualization; low Integration LISI (iLISI) scores [34].
- Potential Causes & Solutions:
- Cause 1:
thetavalue is too low. - Cause 2:
lambdavalue is too high, causing overly conservative correction. - Cause 3: The algorithm is not converging.
- Cause 1:
Problem: Overcorrection (Biological Signals Are Lost)
- Symptoms: Distinct cell types are erroneously mixed together; cell-type LISI (cLISI) score decreases [34].
- Potential Causes & Solutions:
- Cause 1:
lambdavalue is too low. - Cause 2:
thetais set too high, forcing biologically distinct populations to merge.- Solution: Reduce the
thetavalue to focus more on the data's intrinsic structure [43].
- Solution: Reduce the
- Cause 1:
Problem: "Quick-TRANSfer stage steps exceeded maximum" Warning or Failure to Converge
- Symptoms: Warning messages in the R console and the algorithm may not converge within the default number of iterations [27].
- Potential Causes & Solutions:
- Cause 1: The default maximum number of iterations is insufficient.
- Solution: Increase the
max.iter.harmonyparameter (e.g., from 10 to 20 or 30) [42].
- Solution: Increase the
- Cause 2: The clustering step (
max.iter.cluster) is also hitting its limit.- Solution: Increase
max.iter.clusterfrom its default of 20 [42].
- Solution: Increase
- Cause 3: The number of clusters
nclustis inappropriate for the dataset's complexity.- Solution: Manually set
nclustto a value more reflective of the expected number of cell states [44].
- Solution: Manually set
- Cause 1: The default maximum number of iterations is insufficient.
Experimental Protocol: Integrating Multi-Sample scRNA-Seq Data with Harmony
This section provides a detailed methodology for integrating multiple scRNA-seq datasets using Harmony within the Seurat workflow.
Research Reagent Solutions
| Item | Function / Description |
|---|---|
| Seurat R Package | A comprehensive toolkit for single-cell genomics data analysis, used as the primary environment for running Harmony. [42] [46] |
| Harmony R Package | The integration package itself, providing the RunHarmony() function. [44] |
| Single-Cell Expression Matrix | The primary input data, typically a counts matrix where rows are genes and columns are cells. |
| Cell Metadata | A data frame containing cell-level information, including the batch covariate (e.g., sample ID, donor, technology) to be integrated. |
Step-by-Step Procedure
Data Preprocessing and PCA: Begin with standard Seurat preprocessing on the merged dataset from multiple samples. This includes normalization, identification of highly variable features, and scaling. Finally, perform Principal Components Analysis (PCA) to obtain the initial low-dimensional embedding.
Run Harmony Integration: Execute the
RunHarmonyfunction, specifying the PCA reduction as input and the metadata column containing batch information. Adjust core parameters based on initial diagnostics.Downstream Analysis and Visualization: Use the integrated Harmony embedding for subsequent analysis, such as UMAP visualization and clustering. It is critical to use the Harmony reduction, not the original PCA, for these steps.
Validation: Assess integration quality by checking that batches are well-mixed within cell type clusters on the UMAP. For a quantitative assessment, calculate metrics like Local Inverse Simpson's Index (LISI) [34].
Frequently Asked Questions
1. What is dataset imbalance in single-cell genomics, and why is it problematic for integration? Dataset imbalance occurs when there are significant differences in the number of cell types present, the number of cells per cell type, and/or cell type proportions across the samples or batches you wish to integrate. This is common in fields like cancer biology due to intra-tumoral and intra-patient heterogeneity. During integration, this imbalance can cause loss of biological signal and alter the interpretation of downstream analyses, as methods may over-correct or incorrectly align cell populations that are underrepresented in one batch with dominant populations in another [47] [13].
2. How can I detect if my dataset is imbalanced before integration? You can assess imbalance by examining your data's metadata and visualizations:
- Cell Counts per Sample/Batch: Create a table or bar plot showing the total number of cells per sample or batch. A large variance indicates potential imbalance.
- Cell Type Proportions: For each sample or batch, calculate the proportion of each cell type. Visualize this using stacked bar plots. A cell type that is abundant in one batch but rare or absent in another is a clear sign of imbalance [47].
- Diagnostic Plots: Before integration, project your data using PCA or UMAP colored by batch and by cell type. If the data separates strongly by batch, but you also know that cell type compositions are very different, you should proceed with caution [13].
3. Which integration methods are more robust to cell-type imbalance? Benchmarking studies have evaluated this specific challenge. A 2024 study found that sample imbalance substantially impacts downstream analyses across many common techniques [47]. The selection of a method should be guided by the specific imbalance in your data. The table below summarizes key findings from recent benchmarks.
Table 1: Benchmarking of Integration Methods in Challenging Scenarios
| Method | Reported Performance in Standard Benchmarks | Considerations for Imbalanced Datasets |
|---|---|---|
| Harmony | Often recommended for good performance and fast runtime [8] [13]. | Can be a good choice, but performance may be less scalable for very large, complex atlases [13]. |
| scANVI | Ranked highly in comprehensive benchmarks [13]. | May perform well but was not specifically highlighted in the latest imbalance benchmarks. |
| cVAE-based models (e.g., sysVI) | Popular for scalability and handling non-linear effects [10]. | Standard cVAE struggles; new approaches like sysVI (using VampPrior & cycle-consistency) are proposed for substantial batch effects and imbalance [10] [48]. |
| Adversarial Learning (e.g., GLUE) | Among the best in some benchmarks [10]. | Prone to mixing embeddings of unrelated cell types when proportions are unbalanced across batches [10] [48]. |
| KL Regularization Tuning | A common tuning parameter in cVAE models [10]. | Not recommended for imbalance; removes biological and technical variation indiscriminately, leading to information loss [10] [48]. |
4. I've integrated my data, but distinct cell types are now clustered together. What happened? This is a classic sign of over-correction [13]. The integration method has been too aggressive and has "corrected" away not just the technical batch effects, but also genuine biological differences between cell types. This often occurs when correcting for a batch variable that is confounded with biological state or when using a method that is too strong for the level of imbalance in your data. If you see a complete overlap of samples from very different biological conditions, you should suspect over-correction [13].
5. How should I design my experiment to minimize issues from dataset imbalance? The most effective way to increase power and robustness is to increase the number of independent experimental units (e.g., individuals or samples) [49]. For a cell-type-specific analysis, having more individuals is more impactful than sequencing more cells per individual. Power analyses suggest that sample sizes greater than 20 individuals yield good power, with marginal gains beyond 100 cells per individual per cell type [49].
Troubleshooting Guides
Guide 1: Diagnosing and Solving Over-Correction
Symptoms:
- Distinct cell types are clustered together on the UMAP after integration [13].
- A complete overlap of samples from very different biological conditions [13].
- Cluster-specific markers are comprised of generic, highly expressed genes (e.g., ribosomal genes) [13].
Solutions:
- Re-run integration with a less aggressive method. If you used a method with adjustable strength parameters, reduce the correction strength.
- Switch methods. Refer to Table 1 and try a method known for better biological preservation. Harmony or sysVI may be preferable to adversarial methods in imbalanced scenarios [8] [10].
- Validate with known markers. After integration, check the expression of well-established cell-type-specific marker genes across the clusters to ensure they are still distinct.
Guide 2: Handling Severe Cell-Type Imbalance
Scenario: A cell type is abundant in Batch 1 but is very rare or absent in Batch 2.
Solutions:
- Use a guided integration approach. Some methods allow for "anchors" or partial sharing of information. You can specify that only certain cell types should be integrated across batches.
- Consider a two-step approach. First, identify and isolate the common cell types between batches and integrate them. Then, handle the unique cell populations separately.
- Employ a method designed for substantial batch effects. Newer methods like sysVI are specifically designed to handle challenging integration tasks, such as across species or technologies, which often involve inherent imbalance [10] [48].
Experimental Protocols for Evaluation
Protocol 1: Systematically Evaluating Integration Success
To objectively determine if your integration worked well, employ the following metrics and visualizations [13]:
- Batch Mixing Metric: Calculate the local inverse Simpson's Index (iLISI). This score measures the diversity of batches in the local neighborhood of each cell. A higher iLISI score indicates better batch mixing [10] [48].
- Biological Preservation Metric: Calculate a metric like Normalized Mutual Information (NMI). This compares the cell identity clusters from your integrated data to the ground-truth cell type annotations. A higher NMI indicates better preservation of biological cell type structure [10] [48].
- Visual Inspection: Create UMAP plots colored by batch and by cell type. A successful integration will show:
- Colored by Batch: Good mixing of cells from different batches, with no separate clusters based on batch.
- Colored by Cell Type: Tight, distinct clusters for each cell type.
Table 2: Key Metrics for Evaluating Data Integration
| Metric Name | What It Measures | How to Interpret the Result |
|---|---|---|
| iLISI | Batch mixing in local cell neighborhoods. | Higher score = Better batch effect removal. |
| NMI | Similarity between clustering results and known cell labels. | Higher score = Better preservation of biological variation. |
| Visual (UMAP) | Qualitative assessment of mixing and clustering. | Mixed batches & distinct cell clusters = Successful integration. |
Protocol 2: A Generalized Workflow for Integrating Imbalanced Data
The following diagram outlines a logical workflow for approaching the integration of imbalanced datasets, incorporating the troubleshooting steps and evaluations described above.
The Scientist's Toolkit
Table 3: Essential Research Reagents & Computational Tools
| Tool / Reagent | Function / Purpose | Context in Integration |
|---|---|---|
| Harmony | Batch effect correction algorithm. | Corrects embeddings using soft k-means; recommended for good performance and speed [8] [13]. |
| sysVI | A cVAE-based integration method. | Designed for datasets with substantial batch effects and imbalance using VampPrior and cycle-consistency [10] [48]. |
| Seurat | A comprehensive R toolkit for single-cell genomics. | Provides a framework for the entire analysis workflow, including several integration methods [50]. |
| SCANPY | A comprehensive Python toolkit for single-cell genomics. | The Python alternative to Seurat, providing similar preprocessing and integration capabilities [8]. |
| GLMM / MAST with RE | Statistical models for differential expression. | Used after integration; properly accounts for within-individual correlation to avoid pseudoreplication bias [49]. |
| iLISI / NMI Scores | Quantitative integration metrics. | Used to objectively evaluate the success of batch mixing and biological preservation post-integration [10] [48]. |
FAQ: Harmony Performance and Scalability
Harmony is designed for computational efficiency and can integrate extremely large datasets on standard computer hardware.
*Key Performance Metrics for Harmony*
| Dataset Size | Harmony Runtime | Memory Usage | Hardware Requirements |
|---|---|---|---|
| 30,000 cells | ~4 minutes | 0.9 GB | Personal computer |
| 125,000 cells | Information missing | 30-50x less memory than competitors | Personal computer |
| 500,000 cells | ~68 minutes | 7.2 GB | Personal computer |
| ~1,000,000 cells | Feasible | Feasible | Personal computer [34] |
Independent benchmarking studies have confirmed that Harmony's runtime and memory usage scale well, making it one of the few tools capable of handling datasets of 10^6 cells on a personal computer [34] [18]. Its runtime is reported to be 30 to 200 times faster than other common methods like MultiCCA and MNN Correct [34].
How does Harmony's performance compare to other batch correction tools?
Benchmarking studies that comprehensively compare multiple algorithms consistently rank Harmony as a top-performing method, especially when balancing integration quality with computational cost [18].
*Comparative Performance of Batch Correction Algorithms*
| Algorithm | Key Strength | Scalability Limitation | Benchmark Conclusion |
|---|---|---|---|
| Harmony | Fast runtime, low memory usage, good biological preservation | Recommended first choice due to speed and accuracy [18] | |
| Seurat 3 | High biological fidelity | Computationally intensive, memory-intensive for large datasets [18] [4] | Recommended alternative [18] |
| LIGER | Handles biological and technical variation | Recommended alternative [18] | |
| Scanorama | Good performance on mid-size datasets | Struggled with memory beyond 125,000 cells [34] | Not top-ranked for largest scales [34] [18] |
| BBKNN | Fast and lightweight | Less effective on complex non-linear batch effects [4] | Not top-ranked for largest scales [18] |
| MNN Correct | Pioneering mutual nearest neighbors approach | Does not scale well to very large datasets [18] | Not top-ranked for largest scales [34] [18] |
Why is Harmony so computationally efficient?
Harmony's efficiency stems from its algorithmic design, which operates in a low-dimensional space [34].
- Dimensionality Reduction: Harmony does not use the high-dimensional gene expression matrix directly. Instead, it starts with a low-dimensional embedding of cells, such as Principal Components Analysis (PCA) [34].
- Iterative Clustering and Correction: In this PCA space, Harmony uses a novel soft-clustering algorithm to group cells. It then calculates cluster-specific linear correction factors and applies a cell-specific correction based on these cluster memberships. This process iterates until convergence [34]. Working in a reduced-dimensional space and avoiding complex, high-dimensional calculations is the key to its speed and low memory footprint.
What should I do if Harmony is running slowly or crashing?
If you encounter performance issues, consider the following troubleshooting steps:
- Check Input Data Type: Ensure you are providing Harmony with a pre-computed low-dimensional embedding (like PCA), not the high-dimensional count matrix. Using the full count matrix will severely impact performance [34].
- Verify Hardware: Confirm that your computer has sufficient available RAM. While Harmony is efficient, extremely large datasets still require adequate memory. Refer to the table above for memory estimates.
- Review Software Pipeline: Make sure you are using Harmony within a well-optimized pipeline (e.g., Seurat or Scanpy) and that data has been properly preprocessed (normalized, scaled, and PCA performed).
- Simplify the Problem: If working with an exceptionally large dataset (many millions of cells), consider whether the analysis can be broken down by cell type or other biological groups before integration.
| Tool or Resource | Function in Batch Correction Research |
|---|---|
| Harmony Algorithm | The core method for integrating multiple single-cell datasets by removing dataset-specific effects while preserving biological variation [34]. |
| Reference Materials | Commercially available or well-characterized biological samples (e.g., from the Quartet Project) profiled across batches to objectively measure and correct for technical variation [51] [52]. |
| Local Inverse Simpson's Index (LISI) | A quantitative metric used to benchmark correction quality. It measures both batch mixing (iLISI) and cell-type separation (cLISI) [34] [18]. |
| Seurat/Scanpy Ecosystems | Comprehensive software toolkits used for standard single-cell preprocessing (normalization, PCA) before and after applying Harmony integration [34]. |
| k-nearest neighbor Batch Effect Test (kBET) | Another statistical metric used alongside LISI to assess the local mixing of batches after correction [18] [4]. |
Experimental Protocol: Benchmarking Harmony's Performance
Objective: To quantitatively assess the runtime, memory usage, and integration efficacy of the Harmony algorithm on a large-scale single-cell RNA sequencing dataset.
Materials:
- Hardware: Standard personal computer or server with monitored RAM and CPU.
- Software: R or Python environment with Harmony installed (via its R package or within Seurat/Scanpy).
- Dataset: A large, multi-batch scRNA-seq dataset (e.g., from a public repository like the Human Cell Atlas).
Methodology:
Data Preprocessing:
- Input: Start with a combined gene expression count matrix from multiple batches.
- Normalization: Normalize the data for sequencing depth using a standard method (e.g., log-normalization in Seurat).
- Feature Selection: Identify highly variable genes.
- Scaling: Scale the data to regress out sources of variation like mitochondrial percentage.
- PCA: Perform Principal Component Analysis to create the low-dimensional embedding that will serve as the direct input for Harmony [34].
Harmony Integration:
- Input: Provide the PCA embedding and a batch covariate (e.g., dataset ID) to the Harmony integration function.
- Run: Execute the function, optionally using a system monitoring tool to track runtime and memory usage in real-time.
Performance and Efficacy Assessment:
- Computational Resources: Record the total runtime and maximum memory usage.
- Integration Metric: Calculate the Local Inverse Simpson's Index (LISI) on the integrated embedding.
- Use iLISI to measure the effective number of datasets in a local neighborhood (higher iLISI = better batch mixing).
- Use cLISI to measure cell-type purity in a local neighborhood (lower cLISI = better biological preservation) [34].
- Visualization: Generate UMAP plots colored by batch and by cell type, both before and after integration, to visually confirm the quantitative results.
This protocol, derived from the foundational Harmony publication and independent benchmarks, provides a standardized way to validate its performance claims for your specific dataset [34] [18].
Question
When using the Harmony algorithm for batch effect correction on multi-sample single-cell RNA-seq data, my integration workflow fails to produce a properly mixed embedding. The convergence plot indicates potential issues, and the final UMAP shows strong batch-specific clusters rather than biologically meaningful groupings. What does a problematic convergence plot look like, and what steps can I take to resolve poor mixing?
Answer
Poor mixing in Harmony integration occurs when the algorithm fails to adequately correct for technical batch effects, resulting in separated clusters that correspond to batches rather than biological cell types. This guide will help you diagnose and resolve these issues through proper interpretation of Harmony's convergence plots and implementation of proven troubleshooting strategies.
Understanding Harmony's Convergence Plots
Harmony uses a iterative process to integrate cells across datasets. The convergence plot visualizes this process, displaying the cost function value against the number of rounds completed [8].
The diagram below illustrates the logical relationship between plot patterns and integration status.
Interpreting Convergence Plot Patterns:
| Plot Pattern | Interpretation | Impact on Integration |
|---|---|---|
| Rapid decrease followed by plateau | Normal convergence | Optimal - proceed with analysis [8] |
| High plateau with minimal decrease | Inadequate integration | Poor batch mixing - requires parameter adjustment |
| Oscillating cost values | Instability in integration process | Inconsistent results - check data quality and parameters |
| Early stopping before convergence | Maximum iterations too low | Incomplete integration - increase max.iter.harmony |
Troubleshooting Poor Mixing: A Systematic Approach
Follow this structured workflow to diagnose and resolve Harmony integration issues.
Verify Input Data Quality
Before adjusting Harmony parameters, ensure your single-cell data meets quality standards:
Critical QC Metrics and Thresholds:
| QC Metric | Recommended Threshold | Rationale | Impact on Harmony |
|---|---|---|---|
| Cells with high mitochondrial % | Variable by cell type; use multivariate approaches like SampleQC [53] | Excludes apoptotic cells | Poor QC artificially separates cell types |
| Minimum genes per cell | Typically 100-600 genes [54] | Filters empty droplets | Insufficient data points hinder integration |
| Minimum counts per cell | Typically 200-500 UMIs [54] | Ensures adequate sequencing depth | Sparse data difficult to align |
| Doublet rate | Use Scrublet or DoubletFinder [55] | Removes multiplets | Doublets create artificial populations |
Implementation:
Adjust Harmony Parameters for Improved Convergence
When data quality is adequate, optimize these key Harmony parameters:
Harmony Parameter Optimization Guide:
| Parameter | Default Value | Adjustment for Poor Mixing | Biological Rationale |
|---|---|---|---|
| max.iter.harmony | 10 | Increase to 20-50 | Allows more iterations for difficult datasets |
| lambda (θ) | Diversity penalty: 1 | Increase to 2-5 for stronger batch correction | Balances integration strength vs. biological preservation |
| tau | 0 | Set to 1 for protection of small populations | Prevents over-correction of rare cell types |
| epsilon.cluster | 0.0001 | Decrease to 0.00001 for finer convergence | Increases precision of cluster alignment |
Implementation:
Evaluate Biological vs. Technical Variation
Determine whether separated clusters represent true biological variation or residual batch effects:
Differential Abundance Analysis Protocol:
- Perform differential abundance testing between conditions within cell types
- Calculate composition changes using pseudo-bulk approaches [56]
- Validate with known biological markers unrelated to batch effects
- Compare with ground truth when available (e.g., spike-in controls)
Implementation:
Research Reagent Solutions for scRNA-seq Batch Correction:
| Resource Category | Specific Tools | Function in Workflow |
|---|---|---|
| Batch Correction Algorithms | Harmony, Seurat, BBKNN, scVI [57] | Remove technical variation while preserving biology |
| QC Frameworks | SampleQC [53], Scater [55], SeuratQC | Multivariate quality control across samples |
| Differential Analysis | edgeR [56], DESeq2, pseudobulk approaches | Identify true biological signals post-integration |
| Visualization Platforms | Scanpy [57], Seurat [2], Scater | Diagnostic plotting and result interpretation |
| Multiplexing Technologies | Cell Hashing, MULTI-seq, Genetic multiplexing [58] | Sample pooling to reduce technical batch effects |
Validation Framework for Successful Integration
After addressing convergence issues, verify that Harmony has preserved biological variation while removing technical artifacts:
- Cluster coherence: Same cell types should cluster together regardless of batch origin
- Marker expression: Known cell type markers should show consistent expression across batches
- Differential expression: Biological differences between conditions should be detectable
- Dimensionality reduction: UMAP/t-SNE should reveal biologically meaningful structures
Harmony has been shown to outperform other methods like MNN, SCVI, and LIGER in comparative studies, particularly in its ability to correct batch effects without introducing substantial artifacts [8]. When properly calibrated, it robustly integrates complex multi-sample experiments while preserving subtle biological signals essential for drug development and clinical research applications.
How Does Harmony Compare? A Rigorous Look at Performance and Artifacts
In single-cell RNA sequencing (scRNA-seq) analysis, batch effects are systematic technical variations that can obscure true biological signals. These effects arise from differences in sequencing platforms, reagents, laboratories, or protocols across samples [22] [3]. Data integration methods are computational tools designed to remove these unwanted variations, allowing researchers to combine multiple datasets for a unified analysis. This is a critical step for large-scale atlas projects and multi-sample studies, enabling the identification of cell populations and biological patterns that are consistent across different batches [12].
This guide benchmarks five popular integration methods—Harmony, MNN, BBKNN, Seurat, and SCVI—providing a clear comparison of their performance, ideal use cases, and practical protocols to help you select and implement the right method for your research.
The following table summarizes the performance of the five key integration methods based on comprehensive benchmarking studies.
| Method | Performance & Ideal Use Cases | Key Strengths | Key Limitations |
|---|---|---|---|
| Harmony [43] [8] [12] | Best for simple to moderate batch correction tasks; excels in runtime and calibration. | Fast; well-calibrated (minimizes artifacts); robust performance on simpler tasks; good scalability. | Performance can be less optimal on highly complex integration tasks [22]. |
| Mutual Nearest Neighbors (MNN) [22] [8] [12] | A pioneering linear embedding method. | Foundational approach for cross-batch cell matching. | Can alter data considerably, creating artifacts; performance often outperformed by newer methods [8]. |
| BBKNN (Batch-Balanced k-NN) [22] [8] [12] | Best for fast, graph-based correction in large datasets. | Extremely fast; good for large datasets where a corrected graph is sufficient. | Only corrects the k-NN graph, not the underlying expression values; may introduce artifacts [8]. |
| Seurat [22] [13] [12] | Best for simple integration tasks with consistent cell type compositions. | Consistently high performance on simple tasks; uses Canonical Correlation Analysis (CCA). | Low scalability for large or complex tasks; can merge biologically distinct cell types in complex scenarios [22]. |
| SCVI (sc Variational Inferer) [22] [8] [12] | Best for complex, large-scale integration tasks (e.g., atlas-level data). | Excellent on complex tasks; scalable to very large datasets (millions of cells); models count data. | High computational resource requirements; can alter data considerably if not properly calibrated [8]. |
Note on scANVI: While not included in the main comparison, scANVI (a extension of SCVI that uses cell type labels) was identified as a top-performing method in complex integration tasks in a major benchmark [22] [12]. If you have preliminary cell type annotations, scANVI is a strong candidate.
Frequently Asked Questions
What is the main difference between batch correction and data integration?
In scRNA-seq analysis, these terms are often used interchangeably, but a distinction can be made based on complexity [12]:
- Batch Correction: Addresses technical variations between samples within the same experiment, where cell identity compositions are expected to be consistent and batch effects are often linear.
- Data Integration: Deals with more complex, often nested, batch effects between different datasets. These datasets may be generated with different protocols, and cell identities may not be fully shared across batches.
How do I know if my data has a batch effect?
You can detect batch effects both visually and quantitatively [3] [13]:
- Visual Inspection: Perform PCA or UMAP on your raw data and color the cells by batch. If cells cluster primarily by their batch origin instead of by biological cell type or condition, a batch effect is likely present.
- Quantitative Metrics: Use metrics like the k-nearest-neighbor Batch Effect Test (kBET) or the Average Silhouette Width (ASW) batch score. These metrics statistically assess the degree of mixing between batches [22].
What are the signs of over-correction?
Over-correction occurs when a batch effect removal method also removes genuine biological variation. Key signs include [3] [13]:
- Clustering of distinct cell types: Biologically distinct cell types are merged into the same cluster in the UMAP after integration.
- Loss of marker genes: Canonical cell type-specific markers are no longer detected as differentially expressed after integration.
- Non-specific markers: Cluster-specific markers become dominated by universally highly expressed genes (e.g., ribosomal genes).
When should I use Harmony over SCVI?
- Choose Harmony for simpler, smaller-scale integration tasks (e.g., integrating a few samples from the same tissue) due to its speed, ease of use, and reliability [8] [12].
- Choose SCVI for large, complex integration tasks (e.g., building a cross-tissue or cross-species atlas) where scalability and handling of deep complexity are required [22] [14].
Step-by-Step Experimental Protocols
Protocol 1: Data Integration with Harmony
This protocol outlines how to run Harmony integration within a typical scRNA-seq analysis workflow, for example, using the Giotto Suite in R [43].
Workflow Diagram: Harmony Integration Protocol
- Load and Join Datasets: Load your individual samples as Giotto objects and combine them using
joinGiottoObjects(), ensuring to specify alist_IDcolumn that records the batch origin of each cell [43]. - Filter and Normalize: Filter out low-quality cells (e.g., based on the number of genes detected and mitochondrial counts) and normalize the raw counts to account for differences in library size [43] [14].
- Run PCA: Perform Principal Component Analysis (PCA) on the normalized data to obtain a low-dimensional embedding. This PCA matrix will serve as the input for Harmony [43].
- Check for Batch Effects: Visualize the PCA results, coloring cells by the
list_ID(batch). Observe if cells separate by batch, confirming the need for integration [43]. - Run Harmony: Execute the
runGiottoHarmony()function, specifying the PCA embedding and the batch covariate (list_ID). Key parameters to tune include:theta: Diversity clustering penalty. Increase to push for more balanced cluster compositions.lambda: Ridge regression penalty. Increase for more conservative correction with higher stability.plot_convergence: Set toTRUEto monitor the algorithm's convergence [43].
- Re-cluster and Visualize: Use the corrected Harmony embedding to build a new nearest-neighbor graph and perform clustering (e.g., Leiden clustering). Generate a new UMAP based on the corrected graph. Cells should now cluster by cell type rather than by batch [43].
Protocol 2: Benchmarking Multiple Integration Methods
This protocol describes how to compare the performance of different integration methods on your specific dataset, using the scIB Python pipeline [22] [12].
Workflow Diagram: Method Benchmarking Protocol
- Preprocess Data: Standardize your dataset by applying consistent filtering, normalization, and highly variable gene (HVG) selection across all batches to be integrated [22].
- Run Multiple Integrators: Apply several integration methods (e.g., Harmony, SCVI, Scanorama, Seurat) to the preprocessed data. Tools like the
scIBpipeline can help manage these runs [22]. - Apply Evaluation Metrics: Use a comprehensive set of metrics to evaluate each method's output. These metrics fall into two categories:
- Batch Removal: Quantifies how well technical variation was removed. Metrics include kBET (rejection rate) and LISI (iLISI score) [22].
- Biological Conservation: Measures how well true biological variation was preserved. Metrics include ARI/NMI (cluster label conservation) and cell-type ASW (cell type separation) [22].
- Compare and Select Method: The
scIBpipeline calculates an overall score, often a weighted mean of all metrics (e.g., 40% batch removal, 60% bio-conservation). Select the method with the best overall performance for your specific dataset and downstream analysis [22].
The Scientist's Toolkit: Key Research Reagents & Solutions
The following table lists essential computational "reagents" used in scRNA-seq data integration.
| Item / Resource | Function in Experiment |
|---|---|
| Anndata Object | A standard Python data structure for storing single-cell data (count matrices, embeddings, and metadata) that is compatible with most integration tools [12]. |
| Highly Variable Genes (HVGs) | A subset of genes with high cell-to-cell variation, used as input for many integration methods to improve signal-to-noise ratio and computational efficiency [22] [12]. |
| Cell Type Annotations | Labels assigning cell identity (e.g., "T-cell", "hepatocyte"). Some methods (e.g., scANVI) can use these to better guide the integration and conserve biological structure [22]. |
| Reference Dataset | A set of cells (e.g., from a control sample or a public atlas) used for normalization and as a reference point during the integration of query datasets [59]. |
| scIB Python Module | A dedicated benchmarking pipeline that provides standardized metrics and workflows to objectively evaluate and compare integration methods on your own data [22]. |
Troubleshooting Guides & FAQs
Frequently Asked Questions
Q1: What is the primary risk of applying batch effect correction to scRNA-seq data? The primary risk is the introduction of artifacts—unwanted alterations to the underlying biological signal. A 2025 study evaluating eight common methods found that many are poorly calibrated, and the correction process itself can create measurable artifacts that distort the data. Over-correction can dampen or erase genuine biological variation, such as subtle differences between cell subtypes, leading to false conclusions [8].
Q2: Which batch correction method is recommended to minimize artifacts? Current evidence suggests Harmony is the most robust choice. Independent benchmarking has shown that Harmony is the only method among eight widely used tools that consistently performs well and does not introduce detectable artifacts in tests. Other methods, including MNN, SCVI, LIGER, ComBat, and Seurat, were found to introduce measurable artifacts during the correction process [8].
Q3: How can I quantitatively measure the success of batch correction in my experiment? You can use specific metrics designed to evaluate integration quality. The Local Inverse Simpson's Index (LISI) is a powerful objective metric. It comes in two forms:
- Integration LISI (iLISI): Measures the effective number of datasets in a cell's local neighborhood. Higher scores indicate better dataset mixing [34].
- Cell-type LISI (cLISI): Measures the purity of cell types in a local neighborhood. A score near 1 indicates that neighborhoods contain only one cell type, showing biological signal is preserved [34]. Other useful metrics include the k-nearest neighbor Batch Effect Test (kBET) and the Entropy of Batch Mixing [4].
Q4: My data looks over-corrected after integration. What should I do? Over-correction often results from applying a method that is too aggressive for your data. To mitigate this:
- Re-run integration with Harmony, as it has been shown to better preserve biological variation [8].
- Strategically select Highly Variable Genes (HVGs) for the integration, removing genes that are strong drivers of batch effects before correction [4].
- Validate using the LISI metrics to ensure cell-type separation (cLISI) remains high while batch mixing (iLISI) improves [34].
Q5: How do I handle integrating new data into an existing, batch-corrected reference? This is a key limitation of many correction methods. Corrected embeddings are typically tied to the specific cells used in the original analysis. If you need to add new data, you will likely need to repeat the entire batch correction process from scratch, including the new and old datasets together. Platforms that facilitate interactive workflows and careful feature selection can make this process more manageable [4].
Troubleshooting Common Problems
Problem: Poor Mixing of Batches After Correction
- Symptoms: Cells from different experimental batches still form separate clusters in a UMAP or t-SNE plot.
- Potential Causes & Solutions:
- Cause 1: Strong batch effects are overwhelming the correction method.
- Solution: Use a method demonstrated to handle strong batch effects, like Harmony, which uses iterative clustering and linear correction to integrate across complex experimental designs [34].
- Cause 2: The data has not been properly normalized before correction.
- Solution: Ensure you have performed appropriate normalization (e.g., log normalization, SCTransform) to adjust for technical biases like sequencing depth before attempting batch correction [4].
- Cause 1: Strong batch effects are overwhelming the correction method.
Problem: Loss of Biological Variation (Over-Correction)
- Symptoms: Biologically distinct cell types or subtypes have merged together in the integrated embedding.
- Potential Causes & Solutions:
- Cause 1: The chosen correction method is too aggressive.
- Solution: Switch to a method known for preserving biological variation. Research has indicated that Harmony successfully maintains separation of cell types (e.g., Jurkat vs. 293T cells) while mixing datasets, as quantified by a cLISI score remaining at 1.0 [34].
- Cause 2: The parameters for the correction method are set too stringently.
- Solution: Refer to the method's documentation (e.g., Harmony's
RunHarmonyfunction) and adjust the strength of correction parameters. Using the default parameters is often a good starting point [17].
- Solution: Refer to the method's documentation (e.g., Harmony's
- Cause 1: The chosen correction method is too aggressive.
Quantitative Data on Method Performance
The following table summarizes key findings from a 2025 benchmark study that assessed the artifact-inducing potential of various batch correction methods [8].
Table 1: Artifact Introduction by Batch Correction Methods
| Method | Introduces Artifacts? | Performance Summary |
|---|---|---|
| Harmony | No | Consistently performed well in all tests; the only method recommended as it did not alter data in the absence of batch effects. |
| ComBat | Yes | Introduces artifacts that could be detected in the testing setup. |
| ComBat-seq | Yes | Introduces artifacts that could be detected in the testing setup. |
| Seurat | Yes | Introduces artifacts that could be detected in the testing setup. |
| BBKNN | Yes | Introduces artifacts that could be detected in the testing setup. |
| MNN | Yes | Performed poorly, often altering the data considerably. |
| SCVI | Yes | Performed poorly, often altering the data considerably. |
| LIGER | Yes | Performed poorly, often altering the data considerably. |
Experimental Protocols for Artifact Assessment
Protocol 1: Using a "Pseudobatch" to Test for Artifacts
This protocol tests whether a batch correction method alters data in the absence of real batch effects, which is a key sign of poor calibration [8].
- Data Preparation: Start with a single, homogeneous scRNA-seq dataset that has no major batch effects.
- Create Pseudobatches: Randomly split the cell barcodes into two groups (e.g., "pseudobatch A" and "pseudobatch B"). This simulates a scenario where there is no true technical variation to correct.
- Apply Batch Correction: Run the batch correction method of choice (e.g., Harmony, Seurat), providing the pseudobatch labels as the batch covariate.
- Measure Artifacts: Quantify the changes induced by the correction:
- Compare k-NN graphs before and after correction.
- Examine clustering to see if the correction artificially separated or merged cell populations.
- Perform differential expression analysis between clusters post-correction; a well-calibrated method should not induce false differential expression.
- Interpretation: If the method significantly changes the k-NN structure, clustering, or induces spurious differential expression, it is introducing artifacts.
Protocol 2: Quantifying Correction with LISI Metrics
This protocol provides a quantitative framework for evaluating batch correction outcomes using the LISI metric [34].
- Generate an Embedding: From your normalized count matrix, generate a low-dimensional embedding (e.g., PCA) of the cells.
- Run Batch Correction: Apply your chosen integration method (e.g., Harmony) to the PCA embedding to obtain a corrected embedding.
- Calculate LISI Scores:
- For each cell in the corrected embedding, calculate its iLISI score using the dataset-of-origin labels. A high average iLISI indicates good batch mixing.
- For each cell, calculate its cLISI score using the cell-type labels. A low average cLISI (close to 1) indicates good biological signal preservation.
- Benchmark Performance: Compare the pre- and post-correction LISI scores. A successful correction will show a strong increase in iLISI with little to no change in cLISI. The ideal is maximum integration (high iLISI) with maximum accuracy (low cLISI) [34].
Workflow Visualization
The following diagram illustrates the logical workflow for assessing artifacts in batch effect correction, as described in the protocols above.
Diagram 1: A workflow for assessing artifacts introduced by batch effect correction methods.
The Scientist's Toolkit
Table 2: Essential Research Reagent Solutions for scRNA-seq Batch Correction
| Item | Function/Brief Explanation |
|---|---|
| Harmony (R Package) | The primary algorithm for integration; corrects low-dimensional embeddings (like PCA) to mix datasets while preserving cell types [17] [8]. |
| Seurat (R Toolkit) | A comprehensive scRNA-seq analysis suite that can be used for preprocessing (normalization, PCA) and provides a wrapper function (RunHarmony) to execute Harmony within its workflow [2] [17]. |
| Scanpy (Python Toolkit) | A Python-based alternative for single-cell analysis, useful for preprocessing and supporting other correction methods like BBKNN [4]. |
| LISI Metric | A quantitative score used to objectively measure the success of integration (iLISI for batch mixing) and accuracy (cLISI for cell-type separation) [34]. |
| UMAP | A visualization tool for creating 2D or 3D plots of high-dimensional single-cell data, essential for visually assessing batch mixing and cluster integrity before and after correction [17] [4]. |
| Highly Variable Genes (HVGs) | A subset of genes that show high cell-to-cell variation, typically used as input for dimensionality reduction and integration to reduce noise and computational load [4]. |
| PCs (Principal Components) | The low-dimensional embedding (typically from PCA) that serves as the direct input for the Harmony algorithm, representing the major axes of variation in the data [17] [34]. |
Frequently Asked Questions (FAQs)
Q1: What does "preserving biology" mean in the context of scRNA-seq batch effect correction?
In batch effect correction, "preserving biology" refers to the method's ability to remove technical variation while retaining true biological signals. This includes maintaining the natural structure of inter-gene correlations, preserving differential expression patterns between cell types, and conserving the relative ranking of gene expression levels within cells. Over-correction occurs when these biological relationships are disrupted during the technical batch effect removal process [60] [61].
Q2: Why is evaluating inter-gene correlation important after using Harmony?
Inter-gene correlation analysis reveals whether biological relationships between genes have been maintained after integration. Harmony outputs an integrated embedding rather than a corrected count matrix, which means direct evaluation of gene-gene relationships in its output isn't feasible [60]. However, you can assess whether Harmony has preserved biological structure by using downstream analyses that depend on conserved gene relationships, such as pathway analysis or cell type identification using marker genes.
Q3: My integrated data shows good batch mixing but poor cell type separation. What might be wrong?
This indicates potential over-correction, where biological signal has been removed along with batch effects. This is a known challenge with some mixing-loss-based methods, including strongly regularized applications of Harmony [61]. To address this:
- Adjust Harmony's parameters (such as
taufor diversity clustering) - Ensure you're using appropriate dimensionality reduction inputs
- Validate with known cell type markers pre- and post-integration
- Consider trying anchor-based methods like Seurat for your specific data context [12] [62]
Q4: How can I quantitatively measure biological conservation after integration?
Several metrics specifically evaluate biological conservation:
- Cell-type LISI (cLISI): Measures cell type separation in local neighborhoods [34]
- Average Silhouette Width (ASW): Assesses cluster compactness and separation [60]
- Adjusted Rand Index (ARI): Quantifies clustering accuracy against known labels [60]
- Biological conservation score: Combined metrics evaluating preservation of biological variance [61]
Table 1: Key Metrics for Evaluating Biological Conservation in Integrated Data
| Metric | Optimal Value | What It Measures | Interpretation |
|---|---|---|---|
| Cell-type LISI (cLISI) | Close to 1 | Separation of cell types in local neighborhoods | Higher values indicate better cell type separation |
| Biological Conservation Score | 0-1 (higher better) | Preservation of biological variance | Composite of ARI, NMI, ASW_cell, cLISI |
| Adjusted Rand Index (ARI) | 0-1 (higher better) | Cluster accuracy against reference labels | Measures concordance with known cell types |
| Average Silhouette Width (ASW) | -1 to 1 (higher better) | Cluster compactness and separation | Measures how well cells fit their assigned clusters |
Troubleshooting Guides
Problem: Loss of Rare Cell Populations After Integration
Symptoms:
- Rare cell types present in individual batches disappear in integrated data
- Distinct cell subpopulations merge into broader clusters
- Marker genes for rare populations show decreased expression post-integration
Solutions:
- Method Selection: Choose methods specifically designed for heterogeneous datasets. Deep learning approaches like scVI and scANVI often perform better for complex integration tasks with rare cell types [12] [25].
Parameter Adjustment: For Harmony, increase the
tauparameter to preserve more dataset-specific structure, which can help maintain rare populations [63].Validation Strategy:
- Perform differential expression analysis pre- and post-integration
- Check expression levels of known rare cell type markers
- Use metrics specifically designed for rare cell type detection [61]
Problem: disrupted inter-gene correlations
Symptoms:
- Gene-gene relationships that were strong in individual batches weaken after integration
- Pathway analysis results differ significantly between pre- and post-integration data
- Biological interpretation becomes challenging due to altered gene relationships
Solutions:
- Evaluation Protocol:
- Select significantly correlated gene pairs within cell types before integration
- Calculate correlation coefficients for these same pairs after integration
- Compare using metrics like Root Mean Square Error (RMSE) and Pearson correlation [60]
Method Consideration:
- Some methods like ComBat and order-preserving approaches specifically maintain inter-gene correlations
- For Harmony, since it outputs embeddings, assess biological conservation through downstream functional analysis [60]
Experimental Design:
- Include positive control genes with known strong correlations
- Validate with orthogonal biological knowledge about pathway relationships
Problem: Inconsistent Differential Expression Results
Symptoms:
- Different significantly expressed genes identified pre- and post-integration
- Effect sizes for known differentially expressed genes change substantially
- Biological conclusions vary depending on whether integrated or non-integrated data is used
Solutions:
- Conserved Markers Analysis: Use approaches like Seurat's
FindConservedMarkers()function, which performs differential expression testing for each dataset/group and combines p-values using meta-analysis methods [62].
Benchmarking Framework:
- Establish ground truth using known differentially expressed genes
- Calculate precision and recall for identification of these genes post-integration
- Use area under ROC curve (AUC-ROC) to quantify performance [64]
Statistical Validation:
- Compare p-value distributions pre- and post-integration
- Check consistency of fold-change directions and magnitudes
- Validate with external datasets or bulk RNA-seq when available
Experimental Protocols
Protocol 1: Evaluating Inter-Gene Correlation Preservation
Purpose: Quantify how well batch correction methods maintain gene-gene relationships within cell types.
Materials:
- scRNA-seq dataset with known cell type annotations
- Computational environment with R/Python and necessary packages
- Batch correction tools (Harmony, Seurat, scVI, etc.)
Procedure:
- Pre-processing: Identify cell types with sufficient cells (>30 cells per type) in both reference and query batches [60].
Gene Selection: Select significantly correlated gene pairs within each cell type, focusing on genes whose average expression exceeds the overall average expression across all cells [60].
Correlation Testing: Perform one-sided correlation tests for each gene pair across different batches, requiring same correlation direction in both batches and Benjamini-Hochberg adjusted p-values <0.05 [60].
Quantitative Evaluation:
- Calculate Pearson correlation for significant gene pairs before and after correction
- Compute evaluation metrics: RMSE, Pearson correlation, and Kendall correlation between pre- and post-correlation values [60]
- Compare methods using these metrics across multiple cell types
Expected Output: Quantitative assessment of correlation structure preservation across different batch correction methods.
Protocol 2: Standard Harmony Integration Workflow with Biological Validation
Purpose: Implement Harmony batch correction while monitoring biological conservation.
Materials:
- Seurat object containing multiple batches/datasets
- Cell type annotations (if available)
- Known marker genes for key cell populations
Procedure:
- Data Preprocessing:
Harmony Integration:
Downstream Analysis:
Biological Validation:
- Compare clustering results with known cell type annotations
- Use
FindConservedMarkers()to identify robust cell type markers - Perform differential expression analysis between conditions within cell types [62]
Validation Metrics: Calculate cLISI, ARI, and ASW scores to quantify biological conservation.
Research Reagent Solutions
Table 2: Essential Computational Tools for Evaluating Biological Conservation
| Tool/Resource | Function | Application in Biological Conservation |
|---|---|---|
| Harmony | Batch effect correction | Integrates datasets while preserving biological variation through cluster-specific corrections [34] [17] |
| Seurat | scRNA-seq analysis | Provides integration pipelines and conserved marker detection functions [62] |
| scIB | Integration benchmarking | Quantitative evaluation of batch correction and biological conservation metrics [12] [25] |
| LISI metrics | Neighborhood diversity assessment | Measures effective number of datasets (iLISI) or cell types (cLISI) in local neighborhoods [34] |
| scVI/scANVI | Deep learning integration | Probabilistic modeling that handles complex batch effects while preserving biology [12] [25] |
Workflow Diagrams
Biological Conservation Evaluation Workflow
Inter-gene Correlation Evaluation Protocol
Frequently Asked Questions (FAQs)
FAQ 1: Why should I choose Harmony over other batch effect correction methods for my immunology study?
Harmony is recommended because it is specifically designed to handle the complex batch effects often found in single-cell genomics data from multiple samples. Independent comparative studies have found that Harmony consistently performs well, effectively removing batch effects while preserving meaningful biological variation, such as the delicate differences between immune cell subtypes. Unlike methods like MNN, SCVI, and LIGER, which can introduce measurable artifacts into the data, Harmony is well-calibrated and alters the underlying data less drastically during the correction process [8]. This is crucial in immunology and toxicology where accurately identifying true cell populations is paramount.
FAQ 2: What type of input data does Harmony require?
Harmony works on a low-dimensional embedding of your single-cell data, most commonly the Principal Component Analysis (PCA) embeddings. It does not directly correct the original count matrix. Instead, it integrates the data by correcting these embeddings, which are then used for downstream analyses like clustering and UMAP visualization [8] [17] [26]. You should start with a normalized (and often log-transformed) gene expression matrix, perform PCA to get the initial embeddings, and then use these as input for Harmony.
FAQ 3: How do I integrate Harmony into my existing Seurat workflow?
Integrating Harmony into a Seurat workflow is straightforward and requires minimal changes:
- After normalizing and scaling your data, run PCA as you normally would in Seurat.
- Instead of proceeding directly to clustering or UMAP, run the
RunHarmony()function on your Seurat object, specifying the PCA embeddings and the batch variable (e.g.,group.by.vars = "batch"). - For all downstream analyses that would normally use the PCA embeddings (like running UMAP or finding neighbors), use the corrected Harmony embeddings instead [17] [26].
Example code snippet:
FAQ 4: Can Harmony integrate data based on more than one batch covariate?
Yes. Harmony can integrate over multiple covariates simultaneously. You can specify a vector of column names from your metadata to the group.by.vars parameter. For example, to integrate by both "donor" and "sequencing_run", you would use group.by.vars = c("donor", "sequencing_run") [17].
FAQ 5: After running Harmony, my clusters are still somewhat batch-specific. What should I check?
This could be due to several factors. First, verify that the strength of the batch effect is not overwhelming compared to the biological signal. Second, review the parameters you used for Harmony, particularly the theta parameter, which controls the degree of correction. A higher theta value results in stronger integration. You may need to adjust this parameter for your specific dataset. Finally, ensure that the batch effect you are trying to correct is indeed technical and not confounded with a strong biological effect [8].
Troubleshooting Guides
Issue 1: Poor Mixing of Batches After Integration
Problem: After running Harmony and visualizing the data with UMAP, cells from different batches still form separate clusters instead of mixing appropriately.
| Possible Cause | Diagnostic Steps | Recommended Solution |
|---|---|---|
| Strong Batch Effect | Check the pre-correction PCA/UMAP. If batches are completely separate, the effect is very strong. | Increase Harmony's theta parameter to apply a stronger correction force [17]. |
| Incorrect Embedding Use | Confirm that downstream steps (clustering, UMAP) are using the Harmony embeddings, not the original PCA. | In Seurat, specify reduction = "harmony" in functions like RunUMAP() and FindNeighbors() [26]. |
| Biological Confounding | Check if the "batch" is perfectly correlated with a biological variable (e.g., all healthy cells from one donor, all diseased from another). | Harmony may be correctly preserving a biological difference. Consider if integration across this variable is appropriate for your research question [8]. |
Issue 2: Loss of Biological Variation After Correction
Problem: After batch correction, distinct cell types that were separate before correction have now merged into a single cluster.
| Possible Cause | Diagnostic Steps | Recommended Solution |
|---|---|---|
| Over-correction | Inspect the expression of canonical marker genes for the lost cell type. If their expression is diminished, over-correction is likely. | Decrease the theta parameter in Harmony to perform a more gentle correction and better preserve biological variance [8]. |
| Insufficient PCs | Ensure that a sufficient number of principal components (PCs) were used as input to Harmony. | Rerun Harmony, increasing the dims.use parameter to include more PCs that may capture the biological signal. |
Issue 3: Long Run Times or Performance Issues
Problem: Harmony is taking an exceptionally long time to run on a large dataset.
| Possible Cause | Diagnostic Steps | Recommended Solution |
|---|---|---|
| Large Dataset Size | Note the number of cells in your dataset. Performance scales with the number of cells. | For very large datasets (>1 million cells), consider using the ncores parameter to allow for parallelization. Start with a small number of cores and gradually increase to assess benefit [26]. |
| BLAS Library | Check your R configuration. R distributions with OPENBLAS are typically faster for Harmony than those with default BLAS. | If possible, use an R distribution linked to OPENBLAS for better performance with Harmony [26]. |
The following table summarizes key findings from a systematic evaluation of batch correction methods, highlighting why Harmony is often the recommended choice.
| Method | Correction Object | Key Finding / Artifact Introduction | Recommendation for Toxicology/Immunology |
|---|---|---|---|
| Harmony | Embedding | Consistently performs well. Alters data less and introduces fewer artifacts [8]. | Recommended for use. Preserves biological variation critical for identifying immune cell states. |
| Combat | Count Matrix | Introduces detectable artifacts [8]. | Use with caution, as artifacts may confound subtle toxicological responses. |
| MNN | Count Matrix | Performs poorly, often alters data considerably [8]. | Not recommended for complex immunology datasets. |
| SCVI | Embedding / Count Matrix | Performs poorly, often alters data considerably [8]. | Not recommended for complex immunology datasets. |
| LIGER | Embedding | Performs poorly, often alters data considerably [8]. | Not recommended for complex immunology datasets. |
| Seurat | Count Matrix / Embedding | Introduces detectable artifacts [8]. | Use with caution, as artifacts may confound subtle toxicological responses. |
Standard Protocol for Applying Harmony in a Toxicology Context
This protocol is adapted for a study investigating, for example, the effects of a toxicant like arsenic on immune cells in the lung, using multiple samples [65] [66].
- Data Pre-processing & QC: Begin with the raw count matrix. Perform standard quality control: remove cells with high mitochondrial gene counts (indicating apoptosis or broken membranes), an unusually low number of genes, or an outlier number of total counts (which can indicate doublets) [55].
- Normalization and Scaling: Normalize the count data for sequencing depth (e.g., using log normalization) and scale the genes to have a mean of zero and variance of one.
- Dimensionality Reduction (PCA): Perform linear dimensionality reduction via Principal Component Analysis (PCA) on the scaled data. The top principal components (PCs) will be used as input for Harmony.
- Harmony Integration: Run the Harmony algorithm on the PCA cell embeddings, specifying the metadata column that contains the batch information (e.g.,
batch = c("Sample_1", "Sample_2", "Sample_3")). - Downstream Analysis: Use the corrected Harmony embeddings for all subsequent analysis.
- Clustering: Build a shared nearest neighbor graph and identify cell clusters using the Harmony embeddings.
- Non-linear Visualization: Compute UMAP or t-SNE embeddings based on the Harmony-corrected PCA space to visualize integrated cells.
- Differential Expression: Identify differentially expressed genes between clusters (to define cell types) or between conditions within a cell type (to study toxicant effects) [67].
Workflow Diagram
The Scientist's Toolkit: Key Research Reagents & Materials
The following table details essential computational tools and resources used in a typical scRNA-seq analysis pipeline that incorporates Harmony.
| Item | Function / Purpose | Example / Note |
|---|---|---|
| Cell Ranger | Raw data processing pipeline; performs barcode demultiplexing, genome alignment, and quantification to produce a count matrix [55]. | 10x Genomics platform. |
| Seurat | A comprehensive R toolkit for single-cell genomics data analysis. Provides an integrated environment for QC, normalization, PCA, and downstream analysis [17]. | Harmony can be run directly within the Seurat workflow via RunHarmony(). |
| Scanpy | A scalable Python toolkit for analyzing single-cell gene expression data. Similar in scope to Seurat [8]. | Harmony is also accessible through Scanpy. |
| Harmony | The algorithm for integrating single-cell data from multiple experiments by correcting low-dimensional embeddings [8] [17]. | Available as a standalone R package or integrated into Seurat and Scanpy. |
| UCSC Cell Browser | A tool for visualizing single-cell cluster data [67]. | Useful for sharing and exploring results. |
| Single-Cell Reference Atlases | Curated collections of scRNA-seq data from specific tissues or organisms, used for automated cell-type annotation [65] [66]. | Leveraging these can accelerate cell identity prediction in toxicology studies. |
Conclusion
Harmony stands out as a robust, well-calibrated method for batch effect correction in scRNA-seq data, effectively removing technical variation while minimizing the introduction of artifacts that can distort biological interpretation. Its computational efficiency makes large-scale integration feasible, and its flexible parameter set allows adaptation to diverse experimental designs. However, users must remain vigilant of dataset imbalance and carefully validate results. Future directions will likely focus on tighter integration with automated cell typing, multi-omic data fusion, and enhanced methods for correcting complex biological covariates, further solidifying the role of integrated single-cell analysis in translational research and therapeutic development.
References
- 1. A novel batch-effect correction method for scRNA-seq data ... [https://pmc.ncbi.nlm.nih.gov/articles/PMC10914288/]
- 2. Batch Effect Correction [https://www.10xgenomics.com/analysis-guides/introduction-batch-effect-correction]
- 3. Batch Effect in Single-cell RNA-seq: Frequently Asked ... [https://www.elucidata.io/blog/batch-effect-in-single-cell-rna-seq-frequently-asked-questions-and-answers]
- 4. Batch effect correction and normalization of scRNA-Seq data [https://www.nygen.io/resources/blog/batch-effect-normalization-techniques-scrna-seq]
- 5. Characterizing noise structure in single-cell RNA-seq ... [https://www.nature.com/articles/ncomms9687]
- 6. Challenges in Single-Cell RNA Seq Data Analysis & ... [https://www.elucidata.io/blog/challenges-and-solutions-in-single-cell-rna-seq-data-analysis]
- 7. 5 tips for successful single-cell RNA-seq [https://www.takarabio.com/about/bioview-blog/tips-and-troubleshooting/5-tips-to-make-your-single-cell-rna-seq-experiments-a-success?srsltid=AfmBOopNgB2WFn8Wyn-evB4WUPnkHWFmsrP2aKJdXM2EjeA2k5Lmo-B7]
- 8. Batch correction methods used in single-cell RNA sequencing ... [https://pmc.ncbi.nlm.nih.gov/articles/PMC12315870/]
- 9. 6.4 Batch Effect Correction wtih Harmony [https://www.archrproject.com/bookdown/batch-effect-correction-wtih-harmony.html]
- 10. Integrating single-cell RNA-seq datasets with substantial ... [https://bmcgenomics.biomedcentral.com/articles/10.1186/s12864-025-12126-3]
- 11. Chapter 1 Correcting batch effects | Multi-Sample Single- ... [https://bioconductor.org/books/3.14/OSCA.multisample/integrating-datasets.html]
- 12. 12. Data integration [https://www.sc-best-practices.org/cellular_structure/integration.html]
- 13. 4 Handy Tips For Correcting Batch Effects | ScRNA-seq ... [https://www.pythiabio.com/post/4-handy-tips-for-correcting-batch-effects-scrna-seq-analysis-101]
- 14. Unique challenges and best practices for single cell ... [https://pmc.ncbi.nlm.nih.gov/articles/PMC11027889/]
- 15. Methods that remove batch effects while retaining group ... [https://pmc.ncbi.nlm.nih.gov/articles/PMC4679072/]
- 16. Exploring and mitigating shortcomings in single-cell ... [https://genomebiology.biomedcentral.com/articles/10.1186/s13059-025-03525-6]
- 17. Quick start to Harmony [https://portals.broadinstitute.org/harmony/articles/quickstart.html]
- 18. A benchmark of batch-effect correction methods for single-cell ... [https://genomebiology.biomedcentral.com/articles/10.1186/s13059-019-1850-9]
- 19. 8 Batch effect correction | Analysis workflow for IMC data [https://bodenmillergroup.github.io/IMCDataAnalysis/batch-effects.html]
- 20. Reference-informed evaluation of batch correction for ... [https://www.nature.com/articles/s42003-025-07947-7]
- 21. Harmony-based data integration for distributed single-cell ... [https://pmc.ncbi.nlm.nih.gov/articles/PMC12513639/]
- 22. Benchmarking atlas-level data integration in single-cell ... [https://www.nature.com/articles/s41592-021-01336-8]
- 23. Feature selection methods affect the performance of scRNA ... [https://pmc.ncbi.nlm.nih.gov/articles/PMC11978513/]
- 24. Benchmarking deep learning methods for biologically ... [https://pmc.ncbi.nlm.nih.gov/articles/PMC12636214/]
- 25. Benchmarking deep learning methods for ... - Genome Biology [https://genomebiology.biomedcentral.com/articles/10.1186/s13059-025-03869-z]
- 26. immunogenomics/harmony: Fast, sensitive and accurate ... [https://github.com/immunogenomics/harmony]
- 27. Getting started with harmony - davetang.github.io [https://davetang.github.io/muse/harmony.html]
- 28. Normalization and Batch Correction for Data Integration [https://www.10xgenomics.com/support/software/cloud-analysis/latest/tutorials/CA-normalization-batch-correction]
- 29. Flexible comparison of batch correction methods for single ... [https://pmc.ncbi.nlm.nih.gov/articles/PMC8053088/]
- 30. Fast, Sensitive, and Accurate Integration of Single Cell Data [https://portals.broadinstitute.org/harmony/]
- 31. Introduction to scRNA-seq integration • Seurat [https://satijalab.org/seurat/archive/v4.3/integration_introduction]
- 32. CRAN: Package harmony - R Project [https://cran.r-project.org/package=harmony]
- 33. Answering Your Questions About Sample Multiplexing for ... [https://www.10xgenomics.com/blog/answering-your-questions-about-sample-multiplexing-for-single-cell-gene-expression]
- 34. Fast, sensitive, and accurate integration of single cell data ... [https://pmc.ncbi.nlm.nih.gov/articles/PMC6884693/]
- 35. 10. Clustering [https://www.sc-best-practices.org/cellular_structure/clustering.html]
- 36. What is a UMAP plot? [https://www.scdiscoveries.com/blog/knowledge/what-is-a-umap-plot/]
- 37. Chapter 4 Dimensionality reduction | Basics of Single-Cell ... [https://bioconductor.org/books/3.15/OSCA.basic/dimensionality-reduction.html]
- 38. in Batch - Correction : How to Preserve Biological... scRNA seq [https://github.com/immunogenomics/harmony/issues/270]
- 39. 6. Quality Control [https://www.sc-best-practices.org/preprocessing_visualization/quality_control.html]
- 40. Data analysis guidelines for single-cell RNA-seq in ... [https://pmc.ncbi.nlm.nih.gov/articles/PMC9716519/]
- 41. Hands-on: Multi - sample with batch and... correction Harmony [https://training.galaxyproject.org/training-material/topics/single-cell/tutorials/scatac-batch-correction-snapatac2/tutorial.html]
- 42. single cell integration — RunHarmony • Harmony harmony [https://portals.broadinstitute.org/harmony/reference/RunHarmony.html]
- 43. Batch effect removal with Harmony [https://giottosuite.com/articles/harmony.html]
- 44. Help for package harmony [https://cran.r-project.org/web/packages/harmony/refman/harmony.html]
- 45. RunHarmony function [https://www.rdocumentation.org/packages/harmony/versions/1.2.4/topics/RunHarmony]
- 46. Integration — HarmonyIntegration • Seurat Harmony [https://satijalab.org/seurat/reference/harmonyintegration]
- 47. Imbalanced single-cell data integration leads to loss of ... [https://www.nature.com/articles/s41587-023-02114-x]
- 48. Integrating single-cell RNA-seq datasets with substantial ... [https://pmc.ncbi.nlm.nih.gov/articles/PMC12577435/]
- 49. A practical solution to pseudoreplication bias in single-cell ... [https://www.nature.com/articles/s41467-021-21038-1]
- 50. A practical guide for single-cell transcriptome data analysis ... [https://www.sciencedirect.com/science/article/pii/S0168010225000653]
- 51. Correcting batch effects in large-scale multiomics studies ... [https://pmc.ncbi.nlm.nih.gov/articles/PMC10483871/]
- 52. Protein-level batch-effect correction enhances robustness ... [https://www.nature.com/articles/s41467-025-64718-y]
- 53. SampleQC: robust multivariate, multi-cell type, multi-sample ... [https://genomebiology.biomedcentral.com/articles/10.1186/s13059-023-02859-3]
- 54. The Beginner's Guide to Single-Cell RNA-seq Data Analysis [https://www.pythiabio.com/post/the-beginners-guide-to-single-cell-rna-seq-data-analysis-essential-plot-types]
- 55. Current best practices in single‐cell RNA‐seq analysis [https://pmc.ncbi.nlm.nih.gov/articles/PMC6582955/]
- 56. Chapter 14 Multi-sample comparisons [https://bioconductor.org/books/3.12/OSCA/multi-sample-comparisons.html]
- 57. Top 10 Bioinformatics Tools for scRNA-seq in 2025 [https://neovarsity.org/blogs/top-bioinformatics-tools-for-scrna-seq]
- 58. Sample-multiplexing approaches for single-cell sequencing [https://pmc.ncbi.nlm.nih.gov/articles/PMC11073057/]
- 59. Benchmarking scRNA-seq copy number variation callers [https://www.nature.com/articles/s41467-025-62359-9]
- 60. An order-preserving batch-effect correction method based ... [https://pmc.ncbi.nlm.nih.gov/articles/PMC12207412/]
- 61. Partially characterized topology guides reliable anchor-free ... [https://www.nature.com/articles/s42003-025-07988-y]
- 62. Introduction to scRNA-seq integration [https://satijalab.org/seurat/articles/integration_introduction]
- 63. Harmony batch correction for integration of snATAC-seq ... [https://github.com/satijalab/seurat/discussions/4423]
- 64. Denoising single-cell RNA-seq data with a deep learning- ... [https://pmc.ncbi.nlm.nih.gov/articles/PMC12629073/]
- 65. Advancing immunotoxicology with single-cell sequencing [https://www.sciencedirect.com/science/article/abs/pii/S2468202024000032]
- 66. Application of Single Cell Methods in Immunometabolism ... [https://pmc.ncbi.nlm.nih.gov/articles/PMC11290472/]
- 67. scRNA Visualization - GDC Docs - National Cancer Institute [https://docs.gdc.cancer.gov/Data_Portal/Users_Guide/scRNA/]