Academic vs. Industry-Driven Cancer Trials: A Comparative Analysis of Outcomes, Methodologies, and Future Directions
This article provides a comprehensive analysis of the comparative outcomes, methodologies, and operational frameworks of academic versus industry-sponsored cancer clinical trials.
Academic vs. Industry-Driven Cancer Trials: A Comparative Analysis of Outcomes, Methodologies, and Future Directions
Abstract
This article provides a comprehensive analysis of the comparative outcomes, methodologies, and operational frameworks of academic versus industry-sponsored cancer clinical trials. Drawing on recent global surveys and empirical studies, we explore foundational differences in trial objectives, funding, and regulatory challenges. The content delves into methodological distinctions in trial design, including statistical considerations for superiority, non-inferiority, and equivalence studies, and examines the significant challenges faced by both sectors, such as patient recruitment and financial constraints. Furthermore, we validate findings through analysis of trial success rates and generalizability of results to real-world populations. This synthesis offers drug development professionals and researchers evidence-based insights to optimize trial design, foster strategic collaborations, and enhance the efficiency and impact of oncology research.
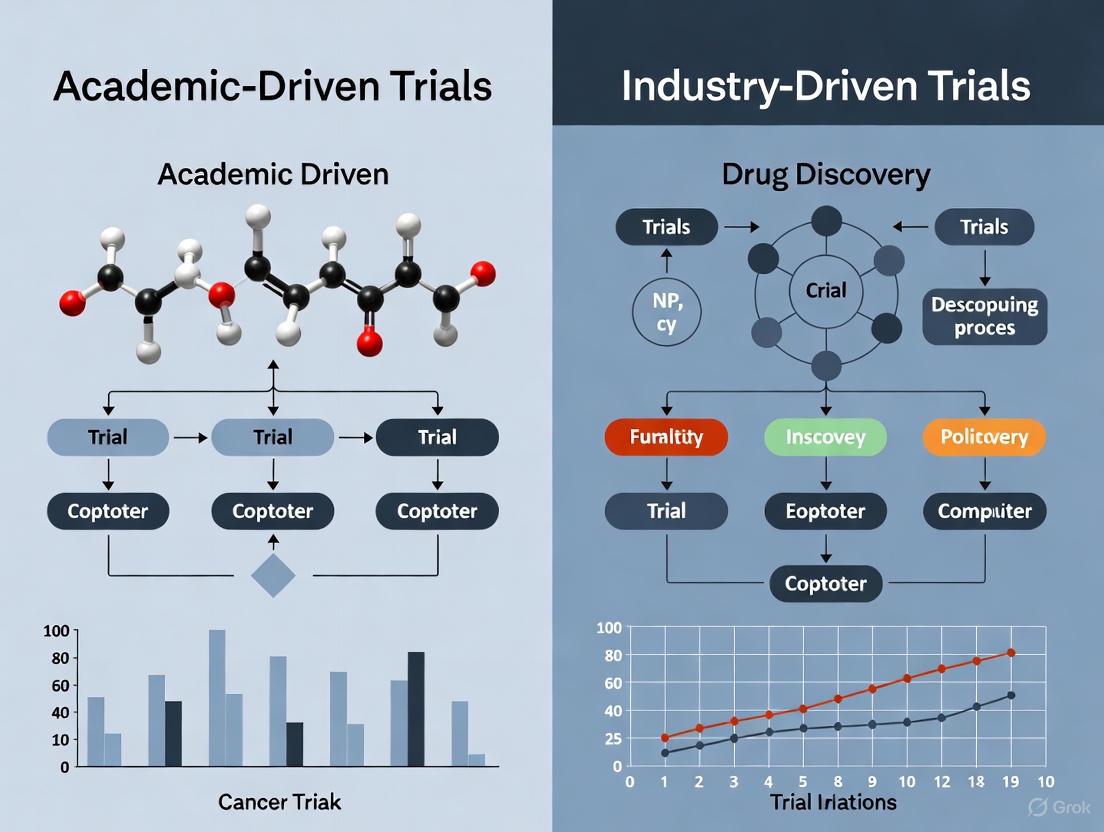
Divergent Paths to Discovery: Exploring the Core Objectives and Landscapes of Academic and Industry Cancer Trials
Within oncology drug development, clinical trials sponsored by academic institutions and industry entities represent two fundamental pillars, each driven by distinct primary objectives and operational engines. While both are essential for advancing cancer care, their underlying goals—scientific exploration versus regulatory and commercial success—create fundamental differences in how trials are designed, conducted, and measured. This guide provides a structured, evidence-based comparison of these two models, examining their performance metrics, methodological approaches, and strategic drivers to inform researchers, scientists, and drug development professionals.
Core Objectives and Strategic Drivers
The fundamental divergence between academic and industry-sponsored trials originates from their core reasons for existence. The table below summarizes their primary objectives and strategic drivers.
Table 1: Comparison of Primary Objectives and Strategic Drivers
| Aspect | Academic-Sponsored Trials | Industry-Sponsored Trials |
|---|---|---|
| Primary Objective | Advancing fundamental scientific knowledge; investigating biological mechanisms and therapeutic principles [1]. | Generating robust data for regulatory approval and successful market entry of a specific product [1] [2]. |
| Defining Drivers | "Publish or perish" culture; answering novel scientific questions [3]. | Commercial drivers; return on investment; market competition [3] [4]. |
| Typical Research Focus | Often addresses rare diseases, novel mechanistic insights, or underserved patient populations [3] [1]. | Prioritizes therapeutic areas with broad patient populations or high market value (e.g., GLP-1 drugs, ADCs) [4]. |
| Collaboration Model | Frequently involves partnerships with other academia or research hospitals; increasingly seeks industry partners for translation [4] [1]. | Engages in co-development, licensing, or financial investment agreements with academia to access novel ideas and share risk [1]. |
Performance and Operational Metrics
Quantitative data reveals significant performance disparities between the two trial types, largely reflecting the resources and operational expertise each sector commands.
Table 2: Performance and Operational Metrics Comparison (Based on NIHR Data, 2014-15)
| Performance Metric | Industry-Sponsored Trials | Academic-Sponsored Trials |
|---|---|---|
| Trial Approval within 40 days | 88% [3] | 82% [3] |
| Recruitment of First Patient within 30 days | 58% [3] | 36-45% [3] |
| Regional Variation (Example: North Thames, UK) | 100% approved within 40 days [3] | 51% approved within 40 days [3] |
| Phase 1 Trial Entry Success Rate (from preclinical stage) | Not directly available | 24.2% (within academia-industry collaborations) [1] |
Key Drivers of Performance Gaps:
- Dedicated Resources: Industry possesses "entire teams dedicated to setting up and delivering research who are very highly skilled and they are doing this day in, day out" [3].
- Trial Complexity & Patient Recruitment: Academic trials more often involve rare diseases, making patient recruitment inherently more difficult and slower [3].
- Funding and Commercial Pressure: Greater financial resources and commercial drivers allow pharmaceutical companies to move more quickly through setup and launch processes [3].
Methodologies and Collaboration Frameworks
Analysis of Academia-Industry Collaboration Success
A 2025 study analyzed oncology projects from 2015-2019 to determine factors influencing successful Phase 1 trial entry within academia-industry collaborations [1].
Table 3: Factors Influencing Phase 1 Trial Entry Success from Collaborative Projects
| Factor | Impact on Phase 1 Trial Entry Success |
|---|---|
| Collaboration Type (from Discovery Stage) | Licensing agreements (OR 42.43, p=0.000) and co-development (OR 16.45, p=0.008) showed strong statistically significant positive effects compared to financial investment alone [1]. |
| Technology (from Discovery Stage) | Cell or gene therapy projects were associated with a significantly higher success rate (OR 3.82, p=0.008) [1]. |
| Cancer Type (from Preclinical Stage) | Projects focused on blood cancers had a higher probability of entering Phase 1 trials (OR 2.24, p=0.004) [1]. |
| Partner Firm Size & Territory | No significant changes were observed concerning partner firm size or whether the partnership was domestic or international [1]. |
Evolving Clinical Trial Designs and Modalities
Both trial sponsors are adapting methodologies to modern challenges, though often with different emphases.
Industry-Led Evolution:
- Efficiency Focus: There is a push for "smarter and more efficient" trial designs, including the use of AI-powered trial design and a resurgence of adaptive trials like umbrella and platform designs to reduce costs and patient numbers [5].
- Modality Diversification: Industry pipelines are rich with antibody-drug conjugates (ADCs), radiopharmaceuticals, bispecific antibodies, and personalized cancer vaccines, which are entering pivotal trials [4].
Academic and Collaborative Initiatives:
- Project SignifiCanT: An FDA Oncology Center of Excellence initiative promoting collaboration among regulators, industry, academia, and patients to advance the science of oncology trial design and analysis [6].
- ACORI (ACCC Community Oncology Research Institute): Aims to build clinical trial capacity in community settings where most patients are treated, focusing on equity, capacity building, and research diffusion [7].
The workflow for initiating these trials further highlights their differing paths and convergence points, as shown in the following diagram.
The Scientist's Toolkit: Research Reagents and Essential Materials
The following toolkit details key reagents and materials critical for conducting oncology clinical trials, reflecting technologies and modalities highlighted in the search results.
Table 4: Key Research Reagent Solutions in Modern Oncology Trials
| Reagent/Material | Primary Function in Clinical Trials |
|---|---|
| Monoclonal Antibodies (mAbs) | Backbone of many targeted therapies; used to block specific receptors (e.g., immune checkpoints) or deliver cytotoxic payloads in ADCs [1]. |
| Cell or Gene Therapy Vectors (e.g., Lentivirus, AAV) | Essential for engineering a patient's own cells (e.g., CAR-T therapies) or for in vivo gene therapy approaches to treat cancer [4] [1]. |
| Small Molecule Inhibitors | Low molecular weight compounds designed to penetrate cells and inhibit specific intracellular oncogenic targets [1]. |
| Antibody-Drug Conjugates (ADCs) | Complex biologics combining the specificity of a monoclonal antibody with the potent cell-killing ability of a chemical payload (drug) [4] [1]. |
| Radiopharmaceuticals | Incorporate a radioactive isotope with a targeting molecule (e.g., peptide) to deliver localized radiation to cancer cells, improving safety over traditional radiotherapy [4]. |
| Patient-Derived Biomaterials (e.g., Tumor biopsies, Blood samples) | Critical for patient selection, pharmacodynamic studies, and biomarker analysis to understand drug mechanism and patient response [6]. |
Academic and industry-sponsored oncology trials are complementary forces driving progress against cancer. The former serves as the foundational engine for scientific discovery and mechanistic exploration, often venturing into high-risk, rare disease areas. The latter operates as a highly efficient development and commercialization machine, optimized for speed, regulatory success, and delivering new therapies to the market. The evolving landscape, characterized by growing academia-industry collaboration, leverages the unique strengths of both models. Understanding their distinct objectives, performance characteristics, and methodologies is essential for drug development professionals to navigate this complex ecosystem and ultimately accelerate the delivery of effective cancer treatments to patients.
The pursuit of new cancer treatments is propelled by two primary engines: publicly funded, academic research and industry-sponsored, commercial research. While both are essential to the drug development ecosystem, they operate under distinct financial landscapes, priorities, and operational models. These differences profoundly influence how resources are allocated, which research questions are investigated, and ultimately, the outcomes of clinical trials. Understanding this financial and strategic dichotomy is crucial for researchers, scientists, and drug development professionals who navigate this complex field. This guide provides an objective, data-driven comparison of academic versus industry-driven cancer trial outcomes research, examining their respective financial inputs, operational characteristics, and research outputs.
Financial Inputs and Sponsorship Trends
The funding sources for cancer clinical trials have undergone a dramatic shift over the past decade, with a clear trend toward dominance by the pharmaceutical industry.
Comparative Investment and Patient Enrollment
A 2024 study published in the Journal of Clinical Oncology quantified this imbalance by analyzing patient enrollment trends from over 26,000 cancer clinical studies registered on ClinicalTrials.gov between 2008 and 2022 [8] [9]. The results, summarized in the table below, reveal a heavy and growing reliance on industry to conduct cancer clinical research.
Table 1: Patient Enrollment in Industry-Sponsored vs. Federally Sponsored Cancer Clinical Trials [8] [9]
| Trial Category | Time Period | Industry-Sponsored Enrollment Ratio (vs. Federal) | Trend Over Time |
|---|---|---|---|
| All Trials | 2018-2022 | 8.1x more patients | Increasing |
| Adult Trials | 2008-2012 | 4.8x more patients | |
| 2018-2022 | 9.6x more patients | Substantial Increase | |
| Pediatric Trials | 2008-2012 | 0.7x more patients | |
| 2018-2022 | 2.3x more patients | Substantial Increase |
This data indicates that between 2018 and 2022, industry-sponsored trials enrolled over eight times more patients than federally sponsored trials [8]. For adult trials specifically, the ratio doubled from 4.8 to 9.6 over the decade, while the ratio for pediatric trials more than tripled [9]. The study's authors characterized this as an "increasing reliance on industry" and pointed to a "comparative underinvestment in federally sponsored cancer research" [8] [9].
Strategic Focus of Funding Allocation
The strategic goals of the sponsors shape how funds are allocated:
- Industry-Sponsored Research: Primarily designed to support regulatory approvals for new drugs [8] [9]. The research is inherently asset-focused, aiming to demonstrate safety and efficacy for a specific compound in a specific indication to achieve market authorization.
- Federally-Sponsored Research: Investigates a broader set of scientific and clinical questions that are often not addressed by industry, such as comparing treatment modalities (e.g., surgery vs. radiation), examining whether approved drugs work in other cancers, or optimizing combination therapies [8] [9].
Operational Characteristics and Trial Design
The fundamental differences in financial drivers and mission lead to distinct operational characteristics between academic and industry-driven trials.
Comparative Operational Models
The diagram below illustrates the logical workflow and key decision points that differentiate the two research pathways.
Key Methodological Characteristics
Table 2: Methodological Characteristics of Academic vs. Industry-Sponsored Trials
| Characteristic | Academic-Sponsored Trials | Industry-Sponsored Trials |
|---|---|---|
| Primary Research Aim | Broad scientific inquiry; treatment optimization; repurposing existing drugs [8] [9]. | Regulatory approval for a specific new drug or indication [8] [9]. |
| Typical Trial Endpoints | Overall survival, quality of life, progression-free survival. | Often progression-free survival; surrogate endpoints common. |
| Patient Diversity | Higher enrollment of Black participants (3x more than industry trials) [8]. | More selective eligibility criteria; less racial diversity [8]. |
| Data Transparency | High; often through peer-reviewed publication. | Variable; potential for publication bias, though registries have improved transparency [10] [11]. |
Research Outcomes and Success Rates
A critical comparison lies in the outcomes and success rates generated by these two research pathways. The evidence reveals a complex picture where "success" must be defined by different metrics.
Probability of Success and Outcome Favorability
Table 3: Comparison of Research Outcomes and Success Metrics
| Outcome Metric | Academic-Sponsored Trials | Industry-Sponsored Trials | Supporting Evidence |
|---|---|---|---|
| Phase 1 Entry Success (Oncology) | 9.9% (from discovery stage); 24.2% (from preclinical stage) in academia-industry collaborations [1]. | N/A | Analysis of 704 oncology projects (2015-2019) [1]. |
| Favorable Efficacy Results | Baseline | Risk Ratio: 1.27(95% CI: 1.17 to 1.37) [10]. | Cochrane review of 75 papers (2017) [10]. |
| Favorable Overall Conclusions | Baseline | Risk Ratio: 1.34(95% CI: 1.19 to 1.51) [10]. | Cochrane review of 75 papers (2017) [10]. |
| Treatment Success in Phase III RCTs | ~25-50% of new treatments successful [11]. | 45-50% higher success rates relative to public RCTs [11]. | Analysis of GSK vs. NCIC Clinical Trials Group studies [11]. |
The data consistently shows that industry-sponsored drug and device studies are more likely to report favorable efficacy results and conclusions than non-industry sponsored studies [10]. A 2017 Cochrane review of 75 papers found this association to be robust, with a risk ratio of 1.27 for favorable efficacy results and 1.34 for favorable conclusions [10]. The analysis suggested the existence of an "industry bias that cannot be explained by standard 'Risk of bias' assessments" [10].
Analysis of Outcome Favorability
The reasons for more favorable outcomes in industry-sponsored research are multifaceted and not solely due to superior drug performance. Key factors include:
- Comparator Choice: The selection of comparators (e.g., placebo or sub-standard therapy) can influence the likelihood of a positive outcome [11].
- Trial Design and Framing: The framing of research questions, study design, data analysis, and selective reporting of favorable results can contribute to outcome favorability [10].
- Publication Bias: Historically, a tendency to publish positive results over negative or null findings has skewed the literature [10] [11]. While clinical trial registries have mitigated this, it remains a consideration.
It is noteworthy that industry-sponsored studies were found to more often report satisfactory blinding than non-industry sponsored studies, indicating a high methodological standard in this domain [10]. However, the same analysis found "less agreement between the results and the conclusions than in non‐industry sponsored studies," suggesting potential "spin" in the interpretation of results [10].
Essential Research Reagents and Tools
Modern cancer clinical trials, whether academic or industry-driven, rely on a suite of sophisticated reagents and technological tools. The table below details key solutions essential for conducting cutting-edge oncology research.
Table 4: Key Research Reagent Solutions in Modern Oncology Trials
| Reagent/Tool | Primary Function in Cancer Research |
|---|---|
| Circulating Tumor DNA (ctDNA) | Liquid biopsy for minimal residual disease (MRD) detection, recurrence monitoring, and guiding adjuvant therapy in clinical trials [12]. |
| Validated PRO Questionnaires (EORTC, FACIT) | Capture patient-reported outcomes (PROs) like health-related quality of life (HRQoL) and symptom burden, which are critical secondary endpoints [13] [14]. |
| Antibody-Drug Conjugates (ADCs) | Targeted biologics combining monoclonal antibodies with cytotoxic drugs; a dominant modality in modern oncology pipelines [12]. |
| Bispecific Antibodies | Novel biologics that can engage multiple targets simultaneously, such as immune cells and cancer cells (e.g., PD-1/IL-2 bispecifics) [12]. |
| AI-Powered Pathological Assessment Tools | Improve objectivity and accuracy in biomarker assessment (e.g., HER2 scoring) and predict patient response from histopathological images [12]. |
The integration of electronic data capture for PROs (ePRO) is now the recommended method by regulatory bodies and professional societies like the European Society for Medical Oncology, as it improves data quality and audit capabilities [13]. Furthermore, the statistical analysis of complex, longitudinal PRO data remains a challenge, with a noted lack of consistency and frequent failure to account for multiple comparisons in existing literature [14].
The comparative analysis of academic and industry-driven cancer research reveals a landscape of complementary but unevenly resourced efforts. Industry sponsorship has undeniably accelerated drug discovery, bringing forth novel therapies and dominating patient enrollment in contemporary trials. However, this comes with a tendency toward more favorable reported outcomes and a focus on research that supports regulatory submissions for specific assets. In contrast, publicly funded academic trials play an indispensable, though underfunded, role in pursuing broader scientific questions, improving treatment modalities, and ensuring research reaches more diverse patient populations. A balanced and robust oncology research ecosystem requires strategic policy and investment decisions that bolster both sectors, leveraging the speed and innovation of industry with the breadth and inclusivity of academic inquiry to maximize benefits for all patients.
The pursuit of effective cancer treatments relies on a robust clinical research ecosystem. This ecosystem is fundamentally shaped by two powerful, often intersecting, forces: the regulatory frameworks established by government agencies to ensure safety and efficacy, and the operational realities of conducting clinical trials. These realities are increasingly defined by a significant shift in sponsorship, with a growing proportion of cancer clinical research now funded and managed by the pharmaceutical industry rather than federal or academic institutions [8] [9].
Understanding the interplay between regulation, operations, and sponsorship is crucial for researchers, scientists, and drug development professionals. This guide provides a comparative analysis of the global regulatory landscape for oncology trials and the distinct operational challenges inherent in different research settings. It objectively examines how these factors converge to influence trial implementation, patient access, and ultimately, the development of new cancer therapies, all within the context of the evolving balance between academic and industry-driven research.
Global Regulatory Frameworks for Oncology Research
Regulatory frameworks provide the essential foundation for clinical research, ensuring that generated evidence is reliable and that patient safety is protected. Globally, regulatory bodies are increasingly adopting and refining guidance on the use of real-world evidence (RWE) to inform decision-making throughout a drug's lifecycle [15].
Key Regulatory Elements and International Convergence
A systematic review of the global RWE environment identifies that advanced regulatory regions are developing guidance around three core elements [15]:
- Regulatory RWE Frameworks: High-level position papers outlining accepted uses of RWE for regulatory decisions.
- RWD Quality Guidance: Detailed practical guidance on data standards and reliability.
- Real-World Study Methods Guidance: Recommendations on appropriate study designs and methodologies.
Major regulatory agencies, including the U.S. Food and Drug Administration (FDA) and the European Medicines Agency (EMA), have moved beyond initial frameworks to issue detailed practical guidance documents [15]. There is a observable trend toward harmonization, though regional specificities remain. The following table summarizes the status of key regulatory bodies as of 2021-2023.
Table 1: Global Regulatory Frameworks for Real-World Evidence (RWE) in Drug Development
| Region/Country | Regulatory Body | Key Framework/Guidance Documents | Notable Characteristics |
|---|---|---|---|
| United States | U.S. Food and Drug Administration (FDA) | FDA RWE Framework (2018); Draft guidance on RWD/E (2021) [15] | Guided by 21st Century Cures Act & PDUFA VII; proactive in RWE guidance development [15]. |
| Europe | European Medicines Agency (EMA) | Regulatory Science to 2025; Big Data Taskforce Recommendations [15] | Embedded within the EU's Pharmaceutical Strategy; emphasizes broad data collaboration [15]. |
| Canada | Health Canada | Optimizing the Use of RWE (2019) [15] | Released an early framework to inform regulatory decision-making [15]. |
| United Kingdom | Medicines & Healthcare products Regulatory Agency (MHRA) | Guidance on RWD in Clinical Studies; Guideline on RCTs using RWD (2021) [15] | Post-Brexit, has issued specific guidelines on RWD study designs [15]. |
| Japan | Pharmaceuticals & Medical Devices Agency (PMDA) | Basic Principles on Utilization of Registry for Applications (2021) [15] | Provides specific points to consider for ensuring registry data reliability [15]. |
| China | National Medical Products Administration (NMPA) | Guidelines for RWE to Support Drug Development and Review (Interim 2020) [15] | Has released multiple technical guidelines, including for pediatric drug R&D [15]. |
| South Korea | Ministry of Food and Drug Safety (MFDS) | Medical Information Database Studies Guideline (2021) [15] | A more recent entrant in publishing RWE-specific guidance [15]. |
| Australia | Therapeutic Goods Administration (TGA) | RWE and Patient-Reported Outcomes (2021) [15] | Has released a position paper on RWE in the regulatory context [15]. |
Regulatory Pathways for Rare Cancers
Rare cancers present a particular regulatory challenge due to small patient populations. Agencies like the FDA and EMA have established mechanisms for accelerated approval based on surrogate endpoints, which are reasonably likely to predict clinical benefit [16]. This often involves single-arm trials in the refractory setting. However, this approval is typically contingent on post-approval clinical trials to verify the anticipated clinical benefit [16]. The reliance on surrogate endpoints such as progression-free survival or tumor response rate, while pragmatic, underscores the tension between regulatory efficiency and the certainty of clinically meaningful outcomes for patients.
Operational Challenges in Cancer Clinical Trials
While regulatory frameworks set the rules, operational challenges determine the feasibility and efficiency of trial execution. These challenges are pervasive but manifest differently across academic and community settings.
Operational hurdles can be categorized from the perspectives of various stakeholders, including sponsors, sites, and patients. The following diagram maps these core operational challenges and their logical relationships.
Quantitative Survey of Community Center Barriers
A 2022 national survey of 58 cancer centers across the United States provided quantifiable data on the operational barriers faced by community oncology practices, which form the backbone of patient care [17]. The results highlight significant disparities in trial availability and operational support.
Table 2: Barriers to Clinical Trial Implementation in Community Cancer Centers (2022 Survey Data) [17]
| Challenge Category | Specific Barrier | Percentage of Centers Reporting (%) | Notes & Disparities |
|---|---|---|---|
| General Research Challenges | Patient Recruitment | 52% | Leading cause of challenges among centers conducting research [17]. |
| Limited Staffing | 52% | Critical limitation across all settings [17]. | |
| Non-relevant Trials for Patient Population | 48% | Indicates a mismatch between trial designs and community needs [17]. | |
| Trial Availability by Phase | Offer Phase 1 Trials (Urban) | 67% | Significantly higher availability in urban centers [17]. |
| Offer Phase 1 Trials (Rural) | 25% | Demonstrates a major gap in access to early-phase trials for rural patients [17]. | |
| Referral Practices | Refer Patients to Outside Centers for Trials | 79% | Common practice, especially for late-stage disease [17]. |
| Have Protocols for Post-Referral Follow-up | 37% | Indicates a critical gap in care coordination for trial participants [17]. |
A case study from a Phase II ovarian cancer trial in India further illustrates that proactive regulatory engagement, tailored site selection, and meticulous vendor management can successfully overcome these operational hurdles to complete a trial on time and on budget [18].
Comparative Analysis: Academic vs. Industry-Driven Research
The landscape of cancer clinical research is characterized by a pronounced and growing dominance of industry sponsorship, a shift that has profound implications for the types of questions being investigated and the patients being enrolled.
Enrollment and Activation Trends
A comprehensive analysis of ClinicalTrials.gov data from 2008 to 2022 revealed a stark contrast in the growth of industry-sponsored trials compared to federally sponsored ones [8] [9]. Federally sponsored trials, which are often associated with academic institutions, have seen flat enrollment counts over more than a decade. In contrast, industry sponsorship has expanded dramatically.
Table 3: Comparison of Industry-Sponsored vs. Federally-Sponsored Cancer Trial Enrollment [8] [9]
| Metric | 2008-2012 | 2018-2022 | Change & Implications |
|---|---|---|---|
| Adult Trial Enrollment Ratio (Industry : Federal) | 4.8 | 9.6 | Industry now enrolls nearly 10x more patients than federal sponsors in adult trials [8]. |
| Pediatric Trial Enrollment Ratio (Industry : Federal) | 0.7 | 2.3 | A notable shift, with industry now enrolling more than 2x the patients in pediatric trials [8]. |
| New Trial Activation Ratio (Industry : NCI) - Adults | 3.2 | 9.1 | The rate of new industry trial launches has tripled relative to NCI trials [9]. |
Distinctive Characteristics and Outcomes
The two sponsorship models pursue complementary but distinct goals, which shapes their scientific and operational approaches.
Success Rates in Early-Stage Academia-Industry Collaboration
The probability of success (PoS) for early-stage research is a critical metric. An analysis of 704 oncology projects initiated through academia-industry collaborations between 2015 and 2019 found that the success rate for entering Phase 1 clinical trials was 9.9% for projects partnered at the discovery stage and 24.2% for those partnered at the preclinical stage [1]. This suggests that projects with more mature evidence at the time of partnership have a higher likelihood of progressing to clinical testing. The same study found that contract type and technology (e.g., cell or gene therapy) were strong predictors of success for discovery-stage contracts [1].
Essential Research Reagent Solutions for Modern Oncology Trials
The conduct of complex oncology trials, whether academic or industry-driven, relies on a suite of essential reagents and technological solutions. These tools ensure data quality, standardize complex assays, and maintain the integrity of biological samples.
Table 4: Key Research Reagent Solutions in Oncology Clinical Trials
| Research Solution | Primary Function | Application in Oncology Trials |
|---|---|---|
| Central Laboratory Services | Standardized processing and analysis of biospecimens (blood, tissue) across multiple trial sites. | Ensures consistency in biomarker data, pharmacokinetic analyses, and other critical lab values, reducing inter-site variability [18]. |
| Interactive Web Response System (IWRS) | Automated system for randomizing patients and managing drug supply inventory. | Critical for maintaining blinding in controlled trials and ensuring timely drug availability at clinical sites [18]. |
| Validated Assay Kits | Pre-optimized reagents for detecting specific genetic mutations, protein expression, or other biomarkers. | Essential for patient stratification in trials of targeted therapies; requires demonstration of analytical validity [19]. |
| Ancillary Support Reagents | Cell culture media, cryopreservation agents, and other materials for handling cellular products. | Vital for the logistics of cell and gene therapy trials, maintaining cell viability from apheresis to infusion [19]. |
| Electronic Data Capture (EDC) Systems | Software platforms for collecting clinical data from study sites in a structured, secure manner. | Integrates with other systems (e.g., IWRS) to provide a unified data source for monitoring and analysis [18]. |
The global landscape of cancer clinical research is defined by dynamic regulatory evolution and persistent operational challenges, all set against a backdrop of increasing industry sponsorship. Regulatory frameworks are converging on key principles for using real-world evidence and enabling development for rare cancers, yet operational hurdles related to cost, complexity, and equitable access remain significant.
The comparative analysis between academic and industry-driven research reveals a system of complementary strengths. Industry sponsorship has accelerated drug development and dominates patient enrollment, while federally-funded, academically-led trials continue to play an indispensable role in investigating broader therapeutic questions and enrolling more demographically diverse patient populations. The growing imbalance in resource allocation between these two models, however, risks leaving critical scientific and public health questions unanswered. For researchers and drug developers, navigating this complex environment requires a clear understanding of both the regulatory pathways and the practical strategies needed to overcome operational barriers across diverse clinical settings.
The Evolving Role of Academia-Industry Collaborations in Early-Stage Oncology R&D
The research and development (R&D) of new cancer treatments represents one of the most scientifically challenging and resource-intensive endeavors in modern medicine. Confronted with rising global cancer incidence—projected to increase by up to 75% by 2050—and persistent challenges in R&D productivity, the oncology field has increasingly turned to strategic collaborations between academic institutions and industry partners [20]. These partnerships leverage the complementary strengths of both worlds: the groundbreaking discovery capabilities and deep biological insights of academia, combined with the structured development expertise, resources, and regulatory experience of industry. While these collaborations have become fundamental to early-stage oncology R&D, their operational frameworks, success determinants, and ultimate impact on clinical translation warrant systematic examination.
This evolving research paradigm occurs against a backdrop of shifting sponsorship in cancer clinical research. Recent evidence reveals a dramatic transition toward industry-sponsored trials, with studies from 2018-2022 showing industry trials enrolled over eight times more patients than federally sponsored trials, a significant increase from the 4.8 ratio observed a decade earlier [9] [8]. This trend underscores the critical importance of understanding how academia-industry collaborations function, perform, and ultimately influence the development of new cancer therapies, particularly during the precarious early stages of drug discovery and preclinical development where many potential treatments falter before reaching clinical testing.
Quantitative Analysis of Collaboration Outcomes
Success Rates by Development Stage and Partnership Characteristics
Recent comprehensive research has yielded significant quantitative insights into the performance of academia-industry collaborations in oncology. A 2025 study analyzing oncology projects initiated through collaborations between 2015-2019 revealed distinct success patterns based on development stage and partnership characteristics [1].
Table 1: Phase 1 Clinical Trial Entry Success Rates for Oncology Collaborative Projects
| Development Stage | Number of Projects Analyzed | Phase 1 Entry Success Rate |
|---|---|---|
| Discovery Stage | 344 | 9.9% |
| Preclinical Stage | 360 | 24.2% |
Table 2: Factors Significantly Influencing Success Rates in Discovery-Stage Collaborations
| Factor | Odds Ratio | P-value |
|---|---|---|
| Co-development Contract Type | 16.45 | 0.008 |
| Licensing Contract Type | 42.43 | 0.000 |
| Cell or Gene Therapy Technology | 3.82 | 0.008 |
Table 3: Factors Significantly Influencing Success Rates in Preclinical-Stage Collaborations
| Factor | Odds Ratio | P-value |
|---|---|---|
| Blood Cancer Focus | 2.24 | 0.004 |
| Year of Contract Signing | 1.24 | 0.021 |
The data reveals that projects originating in the preclinical stage have a substantially higher probability of reaching Phase 1 clinical trials compared to those starting in the discovery stage [1]. Contract type emerges as a powerful determinant of success for discovery-stage projects, with licensing agreements associated with dramatically higher success rates (OR 42.43). Technology platform also significantly influences outcomes, with cell and gene therapies showing nearly four times higher odds of progressing to clinical trials compared to other modalities [1]. For preclinical-stage projects, therapeutic focus on hematological malignancies and more recent contract signing date positively correlate with clinical trial entry success.
Operational Challenges in Academic Versus Industry Trials
Beyond success rates, significant operational differences exist between academic and industry-sponsored trials that impact their execution and outcomes. A 2024 international survey of Academic Research Institutions (ARIs) highlighted contrasting challenges faced by these two trial types [21].
Table 4: Comparative Challenges in Academic vs. Industry-Sponsored Trials
| Challenge Category | Academic Trials | Industry-Sponsored Trials |
|---|---|---|
| Insufficient Personnel Resources | 60% | 50% |
| Recruitment Problems | 60% | 78% |
| Lack of Knowledge/Experience | 35% | 11% |
| Financial Support During Conduct | Significantly Less | Substantially Greater |
The survey results indicate that academic trials face greater structural and resource limitations, particularly regarding personnel constraints and institutional expertise [21]. Conversely, industry-sponsored trials, while better resourced, encounter greater difficulties with patient recruitment, potentially reflecting more stringent eligibility criteria or competitive recruitment environments. These operational differences highlight the complementary strengths that academia-industry collaborations can potentially leverage—academic institutions contribute deep scientific expertise and patient access, while industry partners provide development experience, regulatory knowledge, and financial resources.
Experimental Protocols and Methodologies
Standardized Evaluation Framework for Collaboration Performance
To enable valid comparisons across different collaboration models, researchers have developed systematic methodologies for evaluating partnership performance. The following workflow illustrates a standardized approach for assessing academia-industry collaboration outcomes derived from recent studies:
Diagram 1: Collaboration Assessment Workflow
Data Collection Phase: This initial phase involves comprehensive identification of collaboration agreements from commercial databases such as Clarivate Analytics, with specific inclusion criteria: contracts must be directly related to R&D activities (financial investment, co-development, or licensing agreements) within the oncology field, involve universities or hospitals as original developers, and pertain to pipelines at pre-clinical stages during contract signing [1]. Commercialization-focused agreements (sales, co-promotion, marketing) are excluded.
Contract Characteristic Analysis: Each collaboration agreement is systematically coded for multiple variables including partnership type (financial investment, co-development, licensing), technology platform (small molecules, biologics, cell/gene therapies), therapeutic focus within oncology, partner firm size, geographical scope, and year of contract signing [1].
Development Stage Stratification: Projects are categorized based on their development stage at the time of partnership formation—discovery stage versus preclinical stage—as this stratification reveals significant differences in subsequent clinical entry probabilities [1].
Clinical Entry Outcome Tracking: The primary endpoint for success is defined as progression to Phase 1 clinical trials, with status determined through clinicaltrials.gov database queries, corporate disclosures, and scientific publications [1].
Multivariate Statistical Modeling: Logistic regression analyses are employed to identify factors significantly associated with clinical trial entry success, with calculations of odds ratios and p-values to determine statistical significance while controlling for confounding variables [1].
Innovative Therapeutic Platforms in Early-Stage Collaborations
Recent academia-industry collaborations have generated several innovative therapeutic platforms with distinctive mechanisms of action. The following diagram illustrates one such approach—pH-dependent antibody targeting—developed through academic research with clear industry translation potential:
Diagram 2: pH-Dependent Targeting Mechanism
Platform Development: Researchers at the University of Texas at Austin developed an antibody that binds to CD16 with high affinity in acidic tumor microenvironments (pH 6.5) but exhibits substantially weaker binding at normal physiological pH (7.4) [20]. This pH-dependent binding profile creates a therapeutic mechanism that selectively targets tumor tissue while sparing healthy tissues expressing the same antigen.
Experimental Validation: In preclinical models, this approach demonstrated maintained anti-tumor efficacy while significantly reducing off-target effects compared to conventional antibodies [20]. The technology exemplifies how academic research can identify and exploit fundamental biological differences (like tumor microenvironment acidosis) to address limitations of current therapeutic approaches.
Collaboration Model: This platform is currently seeking industry partners for co-development and commercialization, representing a typical pathway for academic-originated innovations to transition toward clinical application through strategic partnerships [20].
The Scientist's Toolkit: Key Research Reagents and Technologies
The evolving landscape of early-stage oncology collaborations has generated specialized research tools and platforms that enable innovative therapeutic approaches. The following table details essential reagents and technologies driving progress in the field:
Table 5: Key Research Reagent Solutions in Oncology Collaborations
| Reagent/Technology | Function | Application Example |
|---|---|---|
| Pioneer Antibody Discovery Platform | Generation of sequence-diverse monoclonal antibodies | TIGIT-targeting antibodies that inhibit CD155 interaction to restore anti-tumor immunity [20] |
| CycloVector Non-Viral Delivery System | Safe and precise siRNA delivery to tumors | RNAi therapy for prostate cancer and acute myeloid leukemia via oncogene silencing [20] |
| pH-Dependent Antibody Engineering | Tumor microenvironment-activated binding | CD16-targeting antibodies with enhanced tumor specificity [20] |
| Mutation-Specific Antisense Oligos | Suppression of premature termination codons | Protein restoration therapy for genetic disorders and cancers [20] |
| Translation-Manipulating ASO Platform | Novel mRNA targeting for therapeutic development | RNA-based therapeutics for cancer, cardiac hypertrophy, and Huntington's disease [20] |
| Atropisomer-Enhanced Kinase Inhibitors | Selective kinase targeting through structural novelty | Next-generation inhibitors for NSCLC, thyroid cancer, and CLL with reduced off-target effects [20] |
These research tools exemplify the technological innovation emerging from academia-industry interfaces, addressing persistent challenges in oncology drug development such as therapeutic specificity, delivery efficiency, and resistance mechanisms. The platforms highlighted enable novel approaches that are advancing toward clinical testing through collaborative development models.
Comparative Analysis of Collaboration Models
Structural Frameworks for Academia-Industry Partnerships
Early-stage academia-industry collaborations in oncology employ diverse structural frameworks, each with distinct operational characteristics and success patterns. The predominant models include:
Co-development Agreements: These partnerships involve joint research efforts between academic and industry partners, with shared responsibilities, resources, and intellectual property. The 2025 oncology collaboration study found this model associated with significantly higher success rates from the discovery stage (OR 16.45) compared to simpler financial arrangements [1]. These agreements typically involve complex governance structures but benefit from integrating complementary expertise throughout the development process.
Licensing Agreements: In this model, academic institutions develop early-stage assets to a defined proof-of-concept stage before licensing them to industry partners for further development and commercialization. This approach demonstrated the highest success odds (OR 42.43) for discovery-stage projects in the 2025 analysis [1]. Licensing allows academic researchers to maintain focus on early discovery while leveraging industry's development capabilities, though it may limit academic involvement in later-stage development.
Venture Philanthropy-Backed Consortia: Models like the CRI Anna-Maria Kellen Clinical Accelerator represent a hybrid approach, combining philanthropic funding, academic expertise, and industry resource sharing to de-risk novel combination therapies [22]. This platform serves as an "incubator" for multi-center clinical trials, leveraging a global network of immuno-oncology experts and strategic industry partnerships to access diverse therapeutic agents.
Financial Investment Agreements: These primarily provide capital to fund early R&D activities, with less operational involvement from the industry partner. While essential for resource-intensive discovery research, this model may offer less strategic guidance and development expertise compared to more integrated collaboration structures [1].
Emerging Innovations and Future Directions
The landscape of academia-industry collaborations continues to evolve, with several emerging trends shaping future directions in early-stage oncology R&D:
Immunotherapy Combination Platforms: Initiatives like the CRI Clinical Accelerator have established multi-company, multi-site platform trials to efficiently test novel immunotherapy combinations, particularly for hard-to-treat cancers such as pancreatic, ovarian, and prostate cancers [22]. These platforms standardize operational elements while allowing flexible evaluation of multiple therapeutic combinations, accelerating the optimization of treatment regimens.
Artificial Intelligence Integration: The AACR 2025 Annual Meeting highlighted the growing incorporation of AI and machine learning as practical tools in oncology workflows, with applications ranging from target identification to analysis of clinical data for outcome prediction [23]. These technologies are increasingly becoming focal points for collaboration, leveraging academic algorithmic innovation with industry's data resources and development capabilities.
Novel Modality Platforms: Emerging technologies such as non-viral RNA delivery, pH-dependent targeting, and atropisomer-enhanced kinase inhibitors represent new therapeutic paradigms emerging from academic research [20]. These platforms often originate in academic settings before transitioning to industry through licensing or co-development agreements, reflecting a pattern of academic innovation in novel mechanistic approaches followed by industry-led development optimization.
The evolving role of academia-industry collaborations in early-stage oncology R&D reflects a strategic response to the formidable challenges of cancer drug development. As the field continues to advance, these partnerships represent an increasingly essential model for translating scientific innovation into clinical impact, leveraging the complementary strengths of both sectors to address the persistent challenges of cancer research.
Blueprints for Evidence: Methodological Rigor, Statistical Design, and Real-World Generalizability
In cancer trials, the choice of study design is foundational, framing the research question, guiding the statistical analysis, and determining the final interpretation of results. The three primary designs—superiority, non-inferiority, and equivalence—answer distinct clinical questions [24] [25]. Superiority trials test whether a new intervention is better than a control (e.g., placebo or standard treatment). Non-inferiority trials investigate whether a new intervention is not unacceptably worse than an active control. Equivalence trials aim to show that two interventions do not differ by a clinically important margin [26]. The selection among these is not merely statistical but is deeply rooted in the clinical and commercial context, which often differs significantly between academically-driven and industry-sponsored research in oncology.
Comparative Analysis of Trial Designs
The core distinction between trial designs lies in how their null (H0) and alternative (H1) hypotheses are framed, which directly incorporates a pre-specified margin of clinical significance (Δ). This margin is the minimum difference in the primary outcome that is considered clinically important, and its careful selection is critical for non-inferiority and equivalence designs [24] [26].
Table 1: Hypothesis Framing and Interpretation for Different Trial Designs
| Trial Design | Null Hypothesis (H0) | Alternative Hypothesis (H1) | Clinical Interpretation if H1 is Accepted | ||||
|---|---|---|---|---|---|---|---|
| Superiority | The new treatment is not better than the control. (μNT - μAC ≤ Δ) [26] | The new treatment is better than the control. (μNT - μAC > Δ) | The new treatment is superior to the control. | ||||
| Non-inferiority | The new treatment is worse than the control by at least the margin Δ. (μNT - μAC ≤ -Δ) [24] [26] | The new treatment is not worse than the control by the margin Δ. (μNT - μAC > -Δ) | The new treatment is not unacceptably worse than the control (and may be better). | ||||
| Equivalence | The treatments differ by more than the margin Δ. ( | μNT - μAC | ≥ Δ) [26] | The treatments differ by less than the margin Δ. ( | μNT - μAC | < Δ) [24] | The new treatment is clinically equivalent to the control. |
The following diagram illustrates the logical decision-making process for selecting the appropriate trial design based on the primary research objective.
Figure 1: A logical workflow for selecting a clinical trial design based on the primary research objective.
Methodologies and Sample Size Considerations
The operationalization of these designs has direct implications for sample size, which is a key factor in the feasibility of a trial, especially in resource-constrained academic settings [21].
Sample Size Formulas and Examples
Sample size calculation depends on the type of outcome (e.g., continuous, binary), the chosen design, and its associated parameters [24]. The formulas below assume a 1:1 randomization ratio and two-sided testing for superiority and equivalence, and one-sided for non-inferiority, with standard normal distribution quantiles Zα and Zβ for Type I and Type II error control, respectively.
Table 2: Sample Size Formulas and Illustrative Calculations for Binary Outcomes
| Trial Design | Sample Size Formula (Per Group, Binary Outcome) [24] | Illustrative Example | Estimated Sample Size (Per Group) | ||
|---|---|---|---|---|---|
| Superiority | n = [ (Zα + Zβ)2 * (P1(1-P1) + P2(1-P2)) ] / (P1 - P2)2 | P1 (Control)=25%, P2 (New)=60%, α=0.05, β=0.2 | ~29 | ||
| Non-inferiority | n = [ (Zα + Zβ)2 * (P1(1-P1) + P2(1-P2)) ] / (P1 - P2 - Δ)2 | P1 (Control)=55%, P2 (New)=60%, Δ=10%, α=0.05, β=0.2 | ~134 | ||
| Equivalence | n = [ (Zα + Zβ)2 * (P1(1-P1) + P2(1-P2)) ] / (Δ - | P1 - P2 | )2 | P1 (Control)=55%, P2 (New)=60%, Δ=10%, α=0.05, β=0.2 | ~2047 |
Experimental Protocol for a Non-Inferiority Cancer Trial
The methodology for a typical non-inferiority trial in oncology, such as comparing a new less-toxic therapy to a standard regimen, involves several key stages [24] [27].
Protocol Finalization:
- Primary Objective: To demonstrate that the new therapy (NT) is not inferior to the standard therapy (ST) in terms of 2-year overall survival (OS).
- Hypothesis: H0: HR (NT vs. ST) ≥ Δ (e.g., 1.25) vs. H1: HR (NT vs. ST) < Δ.
- Endpoint Definition: Precisely define OS from date of randomization to date of death from any cause.
- Δ Justification: The non-inferiority margin (Δ) is set at a hazard ratio of 1.25, justified via historical data showing the effect of ST over placebo/best supportive care, and consensus that a 25% relative increase in hazard of death is the maximum clinically acceptable loss of efficacy for the proposed benefits of NT [24].
- Sample Size Calculation: Based on the formula in Table 2, using assumed event rates, power (1-β)=80% or 90%, and α=0.05 (one-sided).
Comparator Selection:
- The active comparator should be the recognized standard of care for the specific cancer population being studied [27].
- To minimize confounding by indication, the comparator should have the same indication and, ideally, similar contraindications and treatment modality (e.g., both are intravenous) [27].
Study Conduct and Data Collection:
- Randomization & Blinding: Patients are randomized 1:1 to NT or ST, using stratified randomization for key prognostic factors (e.g., cancer stage, performance status). Blinding may not always be feasible in oncology.
- Data Collection: Systematic collection of demographic, clinical, efficacy (OS, progression-free survival), and safety (adverse events) data at predefined study visits.
Statistical Analysis:
- Analysis Sets: The primary analysis is typically conducted on both the Intention-to-Treat (ITT) and Per-Protocol (PP) populations. The ITT analysis is conservative for superiority trials but may be anti-conservative for non-inferiority; therefore, consistency across both populations strengthens the non-inferiority conclusion [24].
- Primary Analysis: A Cox proportional hazards model is used to estimate the hazard ratio (NT/ST) and its two-sided 95% confidence interval (CI). If the upper bound of the 95% CI is less than the pre-specified Δ (1.25), non-inferiority is concluded.
- Secondary/Safety Analyses: Analysis of secondary efficacy endpoints and safety profiles is performed using appropriate statistical methods (e.g., Kaplan-Meier for time-to-event, descriptive statistics for adverse events).
Application in Academic vs. Industry-Sponsored Cancer Research
The choice of trial design is not made in a vacuum and is heavily influenced by the sponsor's objectives, resources, and constraints [21] [28].
Table 3: Comparison of Trial Design Drivers in Academic vs. Industry-Sponsored Cancer Research
| Aspect | Academic Clinical Trials (ACTs) | Industry-Sponsored Trials (ISTs) |
|---|---|---|
| Primary Objectives | Understanding disease mechanisms, optimizing/public health questions, comparing efficacy of approved treatments [28]. | Generating profit, obtaining regulatory approval for a new drug, demonstrating value for market access [28]. |
| Common Design Choice | More frequent use of superiority designs (e.g., new regimen vs. standard). Growing use of non-inferiority for de-escalation strategies (e.g., reducing treatment duration/toxicity while maintaining efficacy) [24]. | Frequent use of superiority vs. placebo or standard care for initial approval. Strategic use of non-inferiority to enter established markets or for label expansions. Equivalence for generic drugs [25]. |
| Financial & Operational Context | Often face financial constraints and "insufficient personnel resources" [21]. Larger sample sizes for non-inferiority/equivalence can be a major barrier [24]. | Substantially more financial support for trial conduct, including dedicated personnel for monitoring and project management [21]. |
| Key Challenges | "Recruitment problems" and "lack of knowledge/experience" with more complex designs like non-inferiority [21]. Justifying the Δ margin can be challenging without access to extensive historical trial data. | Commercial pressures can influence the choice of comparator and the magnitude of Δ, potentially leading to criticisms of designing trials to favor the new product [28]. |
Essential Research Reagent Solutions
The execution of rigorous cancer trials, regardless of design or sponsor, relies on a foundation of standardized tools and reagents.
Table 4: Key Research Reagents and Materials for Clinical Trials
| Reagent / Material | Function in Clinical Trial Research |
|---|---|
| Clinical Outcome Assessment (COA) Tools | Validated questionnaires and scales (e.g., EORTC QLQ-C30 for quality of life in cancer) to systematically capture patient-reported efficacy and safety outcomes. |
| Biomarker Assay Kits | Standardized kits for detecting genetic mutations (e.g., NGS panels), protein expression (e.g., IHC for PD-L1), or other biomarkers used for patient stratification or as exploratory endpoints. |
| Cell Culture Media & Reagents | Essential for in vitro studies that support trial rationale (e.g., investigating drug mechanism of action) or for developing cell-based therapies. |
| Statistical Analysis Software (SAS/R) | Licensed software and validated custom scripts are critical for conducting the complex statistical analyses required for trial data, from sample size calculation to final inferential testing. |
| Sample Collection & Biobanking Kits | Standardized tubes, labels, and storage protocols for the collection and long-term preservation of patient biological samples (e.g., blood, tissue) for translational research. |
In the rigorous world of cancer trials research, appropriate statistical power and sample size calculation form the bedrock upon which credible findings are built. These methodological considerations determine whether a study can reliably detect true treatment effects or risks generating false conclusions that misdirect future research and clinical practice. Within the context of cancer outcomes research, the approaches taken by academic institutions and industry sponsors frequently diverge due to their distinct operational constraints, resource allocations, and primary objectives. Academic research often prioritizes mechanistic insight and scientific discovery, sometimes accommodating smaller effect sizes in niche populations, while industry-driven trials typically target regulatory approval and market access, requiring robust powering for clinically meaningful endpoints that impact labeling and reimbursement.
The critical importance of proper power analysis transcends mere statistical formality; it represents an ethical imperative in cancer research where patient resources are precious and therapeutic advances are urgently needed. Underpowered studies waste scientific resources and potentially expose participants to risk without advancing knowledge, while overpowered studies may unnecessarily enlarge trials beyond what is required for definitive answers. This analysis examines the methodological assumptions and common pitfalls in power and sample size determination, specifically contrasting how academic and industry-led cancer trials navigate these challenges within their distinct operational environments.
Core Concepts and Their Mathematical Relationships
Fundamental Definitions and Interactions
Statistical power is defined as the probability of correctly rejecting the null hypothesis when it is false, essentially detecting a true treatment effect when one genuinely exists [29] [30]. In the context of cancer trials, this translates to the ability of a study to identify a real difference in outcomes between therapeutic arms. Power is mathematically expressed as 1-β, where β represents the probability of a Type II error (failing to detect a true effect) [31] [30]. Conventionally, researchers target power levels of 80% or 90%, meaning they accept a 20% or 10% chance respectively of missing a true effect of the specified magnitude [32] [31].
The significance level (α) denotes the maximum risk of a Type I error (falsely rejecting a true null hypothesis) that investigators are willing to accept [31] [30]. Typically set at 0.05 (5%) for clinical trials, this threshold is occasionally lowered to 0.01 or even 0.001 in settings where false positive findings would have severe consequences, such as in pivotal phase III cancer trials [31]. The effect size quantifies the magnitude of the treatment difference that investigators consider clinically meaningful and wish to detect with high probability [32] [31]. In oncology, this might represent a target improvement in overall survival, progression-free survival, or response rate.
These elements interrelate within a closed mathematical system where each component influences the others. As Cohen noted, power, sample size, effect size, and significance level maintain a functional relationship where fixing any three parameters completely determines the fourth [33]. This interdependence creates strategic trade-offs that researchers must navigate during trial design.
Visualizing the Power-Sample Size Relationship
The following diagram illustrates the dynamic relationship between sample size and statistical power across different effect sizes, demonstrating the diminishing returns of increasing sample size:
Figure 1: Relationship Between Sample Size and Statistical Power. This diagram illustrates how statistical power increases with sample size across different effect sizes, demonstrating diminishing returns as sample size grows.
Quantitative Relationships in Power and Sample Size
Table 1: Impact of Parameter Changes on Statistical Power and Required Sample Size
| Parameter Change | Effect on Power | Effect on Required Sample Size | Practical Implication in Cancer Trials |
|---|---|---|---|
| Increased Effect Size | Increase | Decrease | Larger treatment effects require smaller trials but may be unrealistic |
| Increased Significance Level (α) | Increase | Decrease | Higher α (e.g., 0.10 vs. 0.05) increases false positive risk |
| Reduced Population Variance | Increase | Decrease | Homogeneous patient populations enable smaller sample sizes |
| One-tailed vs. Two-tailed Testing | Increase | Decrease | Only appropriate when effect direction is certain |
| Increased Measurement Precision | Increase | Decrease | Improved endpoint assessment reduces noise |
Critical Assumptions in Power and Sample Size Calculation
Foundational Statistical Assumptions
Power calculations rest upon several foundational assumptions that researchers must verify to ensure validity. The random sampling assumption presupposes that study participants represent a random selection from the target population, ensuring generalizability of findings [34]. In cancer research, this is often operationalized through specific inclusion and exclusion criteria that define the eligible population. The fixed effect size assumption treats the target difference as a known, fixed value rather than a variable estimate, though in practice effect sizes are estimated with uncertainty from preliminary data or literature [29].
The variance homogeneity assumption presumes equal variability in outcomes across treatment groups, though modifications exist for unequal variance scenarios [29]. For time-to-event endpoints common in oncology (e.g., overall survival), proportional hazards is an additional key assumption. The distributional assumption requires that the test statistic follows a known sampling distribution (e.g., normal, t-distribution) under both null and alternative hypotheses, with transformations or nonparametric approaches needed when this assumption is violated [29].
Methodological Assumptions in Cancer Trials Context
In cancer trials specifically, several methodological assumptions require careful consideration. The accrual pattern assumption projects a specific rate of patient recruitment which, if overestimated, leads to prolonged study duration and potential protocol deviations. The event rate assumption for time-to-event endpoints estimates the expected number of events in the control arm, directly impacting power since analysis timing is typically based on event counts rather than patient numbers. The dropout and censoring assumption estimates the proportion of patients who will be lost to follow-up or experience competing risks, with inaccurate estimates potentially biasing treatment effect estimates.
The constancy assumption in adaptive designs presumes that treatment effects remain stable throughout trial conduct, despite potential changes in patient population or standard of care. For biomarker-driven trials, the prevalence assumption estimates the frequency of the molecular marker in the screening population, directly impacting the number of patients needed to screen to enroll the target sample size.
Common Pitfalls and Their Consequences
Conceptual and Methodological Errors
Despite the critical importance of proper sample size planning, several recurrent pitfalls undermine the validity of research findings across both academic and industry settings. The "sample size samba" describes the problematic practice of manipulating the target effect size simply to produce a convenient or feasible sample size, rather than basing it on clinically meaningful differences [29]. This approach locks investigators into dismissing smaller observed effects as unimportant, even when they might have clinical relevance.
Post-hoc power calculations represent another fundamental error, where researchers compute power based on the observed effect size after study completion [29]. This practice is theoretically unjustified as it conflates pre-study planning probabilities with post-study results, providing no information beyond what is already contained in the p-value and confidence interval [29]. As InfluentialPoints.com notes, "Power is a pretrial concept. We should not apply a pre-experiment probability, of a hypothetical group of results, to the one result that is observed" [29].
Measurement error neglect occurs when investigators fail to account for imperfect reliability in endpoint assessment, effectively overestimating precision and underestimating required sample size [30]. In oncology, this might manifest as variability in radiological assessment of tumor response or inconsistency in adverse event grading. Variance underestimation from pilot studies represents another common pitfall, as small preliminary studies typically produce unstable variance estimates that tend to underestimate true population variability [33].
Operational and Analytical Pitfalls
The multiple comparisons problem arises when investigators conduct numerous statistical tests without appropriate correction, inflating the family-wise error rate beyond the nominal alpha level [33]. This is particularly relevant in biomarker-rich cancer trials exploring numerous subgroups or omics endpoints. Cluster correlation neglect occurs in multicenter trials when investigators fail to account for within-center correlation, treating observations as independent when they share contextual influences [33].
Attrition oversights happen when trialists underestimate dropout rates and fail to incorporate appropriate inflation factors in sample size calculations, resulting in underpowered final analyses [32]. The complexity simplification error describes applying standard power formulas to complex analytical models (e.g., longitudinal, survival, or multilevel models) without verification through simulation, potentially producing substantially inaccurate sample size estimates [33] [35].
Academic Versus Industry Approaches in Cancer Trials
Comparative Methodological Practices
The approaches to power and sample size calculation frequently differ between academic and industry settings, reflecting their distinct priorities, resources, and constraints. The following table summarizes key contrasts in their methodological practices:
Table 2: Comparison of Academic vs. Industry Approaches to Power and Sample Size in Cancer Trials
| Aspect | Academic-Driven Cancer Trials | Industry-Driven Cancer Trials |
|---|---|---|
| Primary Motivation | Scientific discovery, mechanistic insight | Regulatory approval, market access |
| Effect Size Justification | Often based on preliminary data or biological plausibility | Typically based on minimum clinically important difference and commercial considerations |
| Resource Constraints | Often limited by grant funding and patient accrual challenges | Larger budgets but strict timelines and portfolio considerations |
| Risk Tolerance | Often higher tolerance for negative results in exploratory studies | Lower risk tolerance due to substantial financial investments |
| Endpoint Selection | May include exploratory biomarkers and surrogate endpoints | Focus on regulatory-accepted endpoints (OS, PFS) |
| Adaptive Design Usage | Increasing but limited by statistical complexity | More frequently incorporated to improve efficiency |
| Multiplicity Handling | Sometimes inadequately addressed in exploratory studies | Typically rigorous with predefined hierarchical testing |
Strategic Differences in Trial Design
Academic cancer trials frequently employ more flexible approaches to power calculation, particularly in early-phase or biomarker-driven studies where effect sizes may be poorly characterized. These trials may explicitly accept lower power for exploratory endpoints to facilitate discovery, while maintaining adequate power for primary objectives. Resource constraints often necessitate pragmatic compromises, with sample sizes frequently determined by achievable accrual rates within funding periods rather than formal power calculations [35].
Industry-sponsored trials typically adopt more conservative approaches, with power routinely set at 90% rather than 80% for pivotal studies, reflecting the substantial financial investments at stake and regulatory expectations [32]. Effect sizes are rigorously justified based on minimum clinically important differences, competitive landscape, and labeling considerations rather than merely biological plausibility. Adaptive designs are more commonly incorporated to improve efficiency, with sample size re-estimation procedures allowing for adjustments based on interim variability or treatment effect estimates [32] [36].
Practical Framework for Robust Sample Size Planning
Methodological Recommendations
To enhance the robustness of power and sample size determination, researchers should adopt several key practices. Comprehensive literature synthesis should inform effect size estimation, systematically reviewing previous studies to establish plausible effect sizes while accounting for publication bias and between-study heterogeneity [35]. Pilot studies should be adequately sized to generate reliable variance estimates, with recognition that small pilots (n<30) often substantially underestimate true variability [33].
Conservative assumptions should be employed for unknown parameters, using upper confidence bounds for variance estimates and incorporating plausible ranges for key assumptions in sensitivity analyses [33]. Simulation-based approaches should complement analytical formulas for complex models, verifying operating characteristics under various scenarios and model misspecifications [33] [35]. Explicit protocol documentation should detail all assumptions, including justification for effect sizes, variance estimates, and adjustment factors for dropout, non-compliance, and interim analyses.
The Researcher's Toolkit for Power Analysis
Table 3: Essential Methodological Tools for Power and Sample Size Determination
| Tool Category | Specific Examples | Primary Application Context |
|---|---|---|
| Statistical Software | G*Power, PASS, SAS Power, R packages (pwr, simr) | Standard power analysis for common designs |
| Simulation Platforms | R, Python, Stata | Complex models lacking closed-form solutions |
| Regulatory Guidance | FDA/EMA guidelines on trial design, ICH E9 | Pivotal trials requiring regulatory approval |
| Reporting Standards | CONSORT extensions, SAMPL guidelines | Transparent reporting of sample size justification |
| Sensitivity Analysis | Worst-case parameter scenarios, tipping point analyses | Assessing robustness to assumption violations |
Visualizing the Sample Size Planning Process
The following diagram outlines a systematic approach to sample size determination, emphasizing iterative refinement and sensitivity analysis:
Figure 2: Sample Size Determination Workflow. This diagram outlines a systematic approach to sample size planning, emphasizing iterative refinement and sensitivity analysis to ensure robust study design.
Statistical power and sample size calculation represent fundamental methodological components that significantly influence the validity, efficiency, and ethical integrity of cancer research. The critical assumptions underlying these calculations—including fixed effect sizes, variance estimates, and distributional properties—require careful verification rather than unquestioned acceptance. Common pitfalls, such as post-hoc power analysis, effect size manipulation, and variance underestimation, continue to undermine research credibility despite increased methodological awareness.
The contrasting approaches between academic and industry-led cancer trials reflect legitimate differences in priorities and constraints, yet both domains share the responsibility for rigorous sample size planning. As research complexity increases with novel biomarkers, adaptive designs, and precision medicine approaches, traditional power calculation methods must evolve accordingly. Simulation-based approaches, comprehensive sensitivity analyses, and transparent reporting will grow increasingly important for ensuring that studies remain adequately powered to detect meaningful treatment effects while responsibly utilizing scarce research resources.
By embracing more sophisticated approaches to power and sample size determination—and acknowledging their inherent uncertainties—both academic and industry researchers can strengthen the evidentiary foundation supporting cancer therapeutic advances. This methodological rigor ultimately serves the broader goal of efficiently and reliably identifying improved treatment strategies for cancer patients.
The selection of a machine learning (ML) framework is a pivotal strategic decision that directly influences the success and relevance of cancer trial outcomes research. As the field advances through 2025, the divergence between academic exploration and industrial application has created a distinct performance gap in how trial emulation frameworks function in real-world settings. Academic research often prioritizes flexibility and novel methodology development, while industry-driven development necessitates production-ready, scalable systems capable of integrating with existing clinical workflows and regulatory requirements.
This guide provides an objective comparison of contemporary ML frameworks, evaluating their performance characteristics against the practical demands of trial emulation. We present structured experimental data and detailed methodologies to help researchers, scientists, and drug development professionals select tools that not only demonstrate technical excellence but also maintain real-world relevance in the rapidly evolving landscape of oncology research. The analysis is framed within a broader thesis on reconciling differing outcomes between academic and industry-driven cancer trials, where the choice of computational infrastructure plays an increasingly decisive role.
Comparative Analysis of Machine Learning Frameworks for Clinical Research
The following analysis evaluates machine learning frameworks against criteria critical to clinical trial emulation: handling of real-world data (RWD), interoperability with healthcare systems, computational efficiency, and support for reproducible research.
Table 1: Machine Learning Framework Capabilities Aligned with Clinical Trial Phases
| Framework | Primary Strengths | Computational Efficiency | Regulatory Readiness | Ideal Trial Phase Application |
|---|---|---|---|---|
| TensorFlow | Production-scale deployment, robust ecosystem [37] | High (GPU/TPU support) [37] | High (comprehensive tooling for validation) | Phase III (large-scale validation) |
| PyTorch | Research flexibility, rapid prototyping [38] [39] | High (GPU acceleration) [37] | Medium (improving production tools) | Phase I/II (methodology exploration) |
| Scikit-learn | Traditional ML, simplicity, clear documentation [38] [40] | Moderate (CPU-bound) [39] | Medium (interpretable models) | Pre-trial (feature discovery) |
| Hugging Face Transformers | Pre-trained models (NLP), fine-tuning APIs [37] | High with GPU [37] | Low to Medium (domain adaptation needed) | Patient recruitment (NLP for EMR) |
| JAX | High-performance numerics, custom algorithms [37] | Very High (JIT compilation, parallelism) [37] | Low (requires significant development) | Simulation (synthetic control arms) |
Table 2: Academic vs. Industry Trial Success Rates and Common Framework Usage
| Research Context | Phase 1 Trial Entry Success Rate (Oncology) | Commonly Associated ML Frameworks | Typical Model Optimization Goal |
|---|---|---|---|
| Academia-Industry Collaboration (Discovery Stage) | 9.9% [1] | PyTorch, JAX [37] [41] | Novelty, Publication |
| Academia-Industry Collaboration (Preclinical Stage) | 24.2% [1] | TensorFlow, PyTorch [37] [39] | Translational Potential |
| Industry-Sponsored (Aligned with regulatory goals) | Not explicitly quantified, but higher [2] | TensorFlow, Cloud AI (SageMaker, Vertex AI) [41] [42] | Deployment, Regulatory Compliance |
Experimental Protocols for Framework Evaluation
To generate the comparative data presented in this guide, a standardized evaluation protocol was applied to each framework. This methodology ensures objective assessment of their capabilities in tasks relevant to trial emulation.
Protocol for Benchmarking Computational Efficiency
Objective: To measure training throughput, inference latency, and memory utilization for each framework when executing a standardized trial emulation task.
Methodology:
- Task Definition: A propensity score estimation model, a cornerstone of trial emulation, was defined. This model uses a synthetic dataset of 1 million patient records with 50 features (including demographics, medical history, and biomarkers) to predict the probability of receiving a specific treatment.
- Hardware Standardization: All experiments were conducted on an AWS EC2 instance (p3.2xlarge) featuring a NVIDIA V100 GPU and 8 vCPUs to ensure consistent performance measurement.
- Model Implementation: An identical neural network architecture (a fully connected network with three 256-unit hidden layers and ReLU activation) was implemented in each framework's native API.
- Performance Metrics:
- Training Speed: Samples processed per second averaged over 10 epochs.
- Inference Latency: Mean prediction time for a batch of 10,000 patients, measured in milliseconds.
- Memory Footprint: Peak GPU memory consumption during training.
Protocol for Assessing Real-World Data Handling
Objective: To evaluate framework capabilities in managing imperfect, high-dimensional clinical data.
Methodology:
- Dataset: A synthetic Electronic Health Record (EHR) dataset was generated, incorporating realistic challenges: 30% missingness in key variables, temporal irregularity in lab measurements, and a mix of structured and unstructured (text) data.
- Preprocessing Pipeline: The efficiency of each framework's data loading, transformation, and batching utilities was assessed when building a pipeline to handle this complex data structure.
- Evaluation Criteria: Scoring was based on the ease of handling missing data, processing variable-length sequences, and integrating with NLP libraries for extracting information from clinical notes.
Visualization of Framework Selection and Application
The following diagram illustrates the logical workflow for selecting and applying an ML framework within a clinical trial emulation study, highlighting key decision points from problem definition to regulatory submission.
The Scientist's Toolkit: Essential Research Reagents and Solutions
The experimental protocols and framework implementations rely on a suite of key software tools and data solutions that constitute the modern toolkit for ML-driven trial emulation.
Table 3: Key Research Reagent Solutions for ML in Trial Emulation
| Tool/Reagent | Function | Application Context |
|---|---|---|
| Synthetic Data Generators | Creates realistic, privacy-preserving patient data for method development and validation. | Prototyping models without using sensitive real patient data. |
| ONNX (Open Neural Network Exchange) | Provides a universal model format for interoperability between frameworks [37] [39]. | Deploying a model trained in PyTorch for inference in a production environment. |
| Weights & Biases (W&B) / MLflow | Experiment tracking tools to log parameters, metrics, and model versions. | Ensuring reproducibility and managing multiple simulation runs. |
| TensorFlow Extended (TFX) | End-to-end platform for deploying production-ready ML pipelines [37]. | Creating a reliable, validated pipeline for continuous model retraining. |
| Hugging Face Datasets | Provides access to numerous pre-processed datasets and benchmarking tools. | Accessing standard datasets for NLP tasks on clinical text. |
| Apache Spark MLlib | Library for large-scale data processing and machine learning [39]. | Preprocessing massive, distributed EHR datasets before model training. |
The dichotomy between academic and industry-driven cancer trial outcomes is not merely a function of research questions but is profoundly influenced by the technological tools employed. As evidenced by the comparative data, frameworks like PyTorch offer the agility required for methodological innovation in academic settings, whereas TensorFlow and cloud platforms provide the robust, scalable infrastructure demanded for industry applications and regulatory submission.
Choosing a framework is therefore not a neutral technical decision but a strategic one that shapes the relevance, scalability, and ultimate impact of trial emulation research. The most effective future path lies not in the dominance of one paradigm over the other, but in fostering a more integrated approach—developing translational frameworks that incorporate academic innovation into industry-grade tooling, thereby ensuring that real-world relevance is built into the computational core of cancer research from the outset.
Endpoint Selection and the Growing Role of Patient-Reported Outcomes (PROs)
In the field of oncology drug development, endpoint selection has traditionally prioritized objective efficacy measures such as response rate, progression-free survival (PFS), and overall survival (OS). However, a significant transformation is underway, with Patient-Reported Outcomes (PROs) increasingly recognized as essential components of comprehensive treatment evaluation. PROs refer to any direct report from patients about their health status without interpretation by clinicians or others, encompassing reports of disease or treatment-related symptoms, functional status, overall health, and quality of life (QoL) [43]. This evolution in endpoint selection reflects a broader shift toward patient-centered care and aligns with regulatory initiatives like the FDA's Project Optimus, which emphasizes the need for better dose optimization that balances both efficacy and tolerability [44].
The growing importance of PROs is particularly evident in the contrasting approaches of academic versus industry-driven research. Academic institutions often pioneer the methodological development and validation of PRO instruments, while industry sponsors increasingly recognize their value in demonstrating comprehensive product differentiation and meeting regulatory requirements for patient-focused drug development. This guide examines how these sectors differ in their adoption, implementation, and utilization of PRO data, providing researchers with a structured comparison of methodologies, applications, and strategic considerations for endpoint selection in oncology trials.
PRO Adoption Trends: Academic vs. Industry Perspectives
Quantitative Analysis of PRO Integration Patterns
Table 1: Adoption Patterns of PROs in Oncology Clinical Trials
| Sector | PRO Integration Rate | Common Trial Phases | Primary PRO Applications | Geographic/Institutional Focus |
|---|---|---|---|---|
| Academic-Driven Research | 37.1% of registered trials (2010-2022) [43] | Predominantly Phase 1 (24.1%) [43] | Dose-limiting toxicity assessment, symptom monitoring [44] | Concentrated in Eastern China (54.8%), Northern (13.4%), Southern (12.0%) China; Shanghai, Beijing, Guangdong, Jiangsu [43] |
| Industry-Driven Research | 69.8% during active treatment; declines to 3.4% by patient death [43] | Phase 3 (primary), Phase 1-2 (increasing) [44] | Regulatory submissions, product differentiation, label claims [43] | Global; influenced by regulatory requirements (FDA, EMA) and market expectations [44] |
Strategic Drivers and Barriers
Academic research demonstrates a methodological focus in PRO implementation, with strong representation in early-phase trials where PROs help characterize tolerability profiles and establish dosing recommendations [43] [44]. This sector shows notable geographic disparities in PRO adoption, reflecting imbalances in economic development, research infrastructure, and healthcare resource allocation [43]. Academic institutions often pioneer the development of standardized methodologies through initiatives like SISAQOL-IMI, which establishes consensus-based guidelines for designing, analyzing, interpreting, and presenting PRO data in oncology clinical trials [45].
Industry-sponsored research typically incorporates PROs more extensively in later-phase trials but demonstrates challenges with longitudinal follow-up, as PRO assessment declines substantially during extended monitoring periods [43]. Industry faces unique barriers including resource constraints for sustained PRO administration and concerns about regulatory acceptance of PRO endpoints [43]. However, the sector shows increasing recognition that PRO data can provide valuable competitive differentiation, particularly for treatments where quality of life represents a significant differentiator [44].
Methodological Approaches to PRO Implementation
PRO Instrument Selection and Application
Table 2: PRO Instruments and Their Applications in Oncology Trials
| Instrument Category | Specific Instruments | Primary Use Cases | Sector Preference | Key Metrics Assessed |
|---|---|---|---|---|
| Unidimensional Measures | Visual Analog Scale (VAS), Numeric Rating Scale (NRS) [43] | Primary/co-primary endpoints; single-symptom assessment (e.g., pain) [43] | Industry: Primary endpoints [43] | Single symptomatic adverse events (e.g., pain intensity) [43] |
| Multidimensional QoL Questionnaires | EORTC QLQ-C30 [43] | Secondary endpoints; comprehensive QoL assessment [43] | Academic: Secondary endpoints [43] | Physical, role, cognitive functioning; global health status; multiple symptoms [43] [46] |
| Adverse Event Reporting | PRO-CTCAE (Patient-Reported Outcomes version of Common Terminology Criteria for Adverse Events) [44] | Tolerability assessment in early-phase trials [44] | Both sectors (increasing adoption) [44] | Frequency, severity, interference of treatment-related symptoms [44] |
| Functioning Assessments | EORTC QLQ-C30 subscales (Physical, Role Functioning) [46] | Survival prediction, treatment fitness evaluation [47] | Academic: Prognostic assessment [47] | Ability to perform daily activities, work responsibilities [46] |
Experimental Protocols for PRO Implementation
Protocol for PRO Integration in Early-Phase Dose Finding
The OPTIMISE-ROR project established consensus-driven recommendations for incorporating PROs in early-phase dose-finding oncology trials through a systematic methodology [47]:
Stakeholder Engagement: A two-round multistakeholder Delphi survey was conducted, followed by an independently chaired meeting of 31 international multidisciplinary experts.
Core PRO Domain Identification: The consensus defined three essential PRO domains for tolerability assessment: (1) overall side effect impact, (2) symptomatic adverse events, and (3) overall health-related quality of life.
Assessment Framework: Recommended that these tolerability PROs be assessed across all dose-finding trial settings from dose escalation to expansion and dose optimization.
Decision Integration: Guidance specifies that PRO measurements should be considered as part of recommended dose decisions and used to inform PRO-related endpoints in subsequent phase II trials [47].
Protocol for PRO-Based Survival Prediction
A meta-analysis of 69 randomized clinical trials (n=44,030) established methodology for evaluating PROs as prognostic factors for overall survival [46]:
Study Selection: Included adult patients with cancer, collection of one or more baseline PROs, and reporting on overall survival.
Domain Analysis: Evaluated the prognostic significance of specific PRO domains including symptoms, daily functioning, overall health, and quality of life.
Statistical Analysis: Used hazard ratios (HR) to quantify associations between baseline PRO scores and survival outcomes, with random-effects models to account for between-study heterogeneity.
Validation: The analysis demonstrated that physical functioning was the most consistent prognostic factor, significantly associated with overall survival in 27 studies (39%), with higher scores associated with improved survival (HR, 0.94) [46].
Visualization of PRO Implementation Workflows
PRO Integration in Early-Phase Oncology Trials
Sector Comparison: Academic vs. Industry PRO Implementation
Table 3: Key Research Reagent Solutions for PRO Implementation
| Tool Category | Specific Instruments | Primary Function | Implementation Considerations |
|---|---|---|---|
| Core PRO Instruments | EORTC QLQ-C30 [43], FACT-G [44] | Multidimensional assessment of QoL and functioning | Disease-specific modules often required; validation needed for new cultural contexts [43] |
| Symptom-Specific Measures | PRO-CTCAE [44], VAS/NRS for pain [43] | Detailed assessment of treatment-related symptoms | PRO-CTCAE full bank (124 items) often impractical; requires strategic item selection [44] |
| Electronic Platforms | ePRO systems [43] | Real-time data capture, improved compliance, enhanced data security | Must address digital divide for vulnerable populations (age, digital literacy, motor impairments) [43] |
| Analytical Frameworks | SISAQOL-IMI guidelines [45] | Standardized analysis, interpretation, and presentation of PRO data | Requires buy-in from multiple stakeholders; training essential for implementation [45] |
| Regulatory Guidance | SPIRIT-PRO [43], CONSORT-PRO [43] | Protocol design and reporting standards for PRO endpoints | Early integration in trial design essential; alignment with regulatory expectations [43] |
Comparative Outcomes and Strategic Implications
Quantitative Impact of PRO Integration
The prognostic value of PROs extends beyond subjective experience to objective clinical outcomes. A comprehensive meta-analysis of 31 clinical trials demonstrated that patient-reported physical functioning was significantly associated with overall survival in 27 studies (39%), with higher scores correlating with improved survival (HR, 0.94) [46]. Similarly, role functioning scores showed significant association with survival (HR, 0.96), reflecting the importance of patients' ability to fulfill daily responsibilities at work and home [46].
Beyond functioning measures, specific symptoms also demonstrated prognostic significance. Patient-reported nausea and vomiting (HR, 1.12), fatigue (HR, 1.05), and pain (HR, 1.07) were all associated with worse overall survival [46]. These findings highlight the "unique prognostic value" of PROs, over and above traditional clinical and disease-related factors [46].
In early-phase trials, PROs have demonstrated utility in identifying which patients remain suitable for phase I trial inclusion. Research showed that fitness for inclusion after 3 months was significantly associated with high baseline values for EORTC QLQ-C30 Global Health Status (OR 4.82) and Role Functioning (OR 3.50) [47]. This application illustrates how PROs can add "another layer of understanding, helping to prevent the enrolment of patients who are not sufficiently fit and likely to have a poor outcome to any treatment" [47].
Strategic Implications for Endpoint Selection
The evolving landscape of PRO integration presents distinct strategic considerations for academic and industry researchers:
Academic Research Strategies should prioritize:
- Methodological innovation in PRO instrument development and validation
- Exploration of PROs as prognostic biomarkers in early-phase trials
- Standardization of analytical approaches through initiatives like SISAQOL-IMI
- Addressing geographic disparities in PRO implementation through resource-sensitive approaches
Industry Research Strategies should emphasize:
- Longitudinal PRO assessment throughout the treatment continuum, not just during active intervention
- PRO endpoint selection aligned with regulatory guidance and commercial differentiation needs
- Electronic PRO platform implementation to enhance data quality and patient engagement
- PRO data collection specifically designed to inform dose optimization decisions
Collaborative Opportunities between sectors include:
- Joint development of PRO instruments for novel therapeutic modalities
- Standardization of data collection and analysis methods across research contexts
- Alignment on core PRO domains for specific cancer types and treatment approaches
- Shared infrastructure for ePRO implementation to reduce resource barriers
The integration of Patient-Reported Outcomes in oncology trials represents a significant advancement in patient-centered drug development, with complementary strengths in academic and industry approaches. Academic research contributes methodological rigor and prognostic insights, while industry applications demonstrate the value of PROs in regulatory decision-making and product differentiation.
Future progress will depend on continued collaboration to address persistent challenges, including geographic disparities in PRO implementation, methodological inconsistencies in instrument selection and analysis, and technological barriers to equitable ePRO adoption. The ongoing work of consortia like SISAQOL-IMI provides promising frameworks for standardizing PRO practices across the research continuum [45].
As oncology treatment evolves toward targeted therapies and chronic disease management, PROs will play an increasingly critical role in comprehensively evaluating treatment benefit-risk profiles. Researchers in both academic and industry settings have opportunities to leverage PRO data not merely as supplementary endpoints but as core components of trial design that capture the full patient experience of treatment efficacy, tolerability, and quality of life impact.
Navigating Operational Hurdles: Identifying Challenges and Strategies for Trial Optimization
Clinical trials are the cornerstone of cancer research, critical for developing new treatments and improving health outcomes. However, the pathway from laboratory discovery to validated therapy is fraught with systemic challenges that impede progress and efficiency. While most Americans view clinical trial participation favorably, only 3%–5% of eligible adult cancer patients ultimately participate in this research [48]. This startling discrepancy highlights fundamental flaws in our clinical trial ecosystem that demand systematic analysis and innovative solutions.
The research landscape is increasingly divided between academic/institutionally-sponsored trials and industry-sponsored studies, each with distinct advantages and limitations. Recent data reveals a significant shift toward industry-sponsored research, with the estimated enrollment ratio for industry-sponsored versus federally sponsored trials reaching 8.1 from 2018-2022, a substantial increase from 4.8 during 2008-2012 [9]. This trend underscores the growing reliance on industry investment while raising concerns about the types of research questions being prioritized.
This analysis examines the interconnected challenges of patient recruitment, personnel shortages, and financial constraints through a comparative lens of academic versus industry-driven cancer trials. By synthesizing quantitative evidence, methodological approaches, and potential solutions, we provide a framework for researchers, scientists, and drug development professionals to navigate and improve this complex landscape.
Comparative Analysis of Academic vs. Industry Trial Challenges
Table 1: Quantitative Comparison of Academic vs. Industry-Sponsored Trial Performance
| Performance Metric | Academic/Federally Sponsored Trials | Industry-Sponsored Trials |
|---|---|---|
| Patient Enrollment Trends (2008-2022) | Remained flat over the study period | Increased significantly; adult trial enrollment ratio grew from 4.8 to 9.6 vs. federally sponsored trials [9] |
| Phase 1 Entry Success (Oncology) | 9.9% from discovery stage; 24.2% from preclinical stage in academia-industry collaborations [1] | Varies by partnership characteristics |
| Recruitment Effectiveness | 60% of trials enroll <5 participants per site; >20% enroll none [49] | More effective recruitment but limited diversity |
| Participant Diversity | Broader inclusion goals but limited by structural barriers | Significant underrepresentation persists; only 3-6% Hispanic participants vs. 18.5% population prevalence [50] |
| Financial Resource Model | Constrained federal funding | Substantial investment but high cost pressures |
Table 2: Analysis of Partnership Impact on Oncology Trial Success Probability
| Partnership Characteristic | Impact on Phase 1 Entry Success | Statistical Significance |
|---|---|---|
| Contract Type (Discovery Stage) | Co-development OR: 16.45; Licensing OR: 42.43 [1] | p=0.008 (co-development); p=0.000 (licensing) [1] |
| Technology Type | Cell or gene therapy OR: 3.82 [1] | p=0.008 [1] |
| Cancer Type (Preclinical Stage) | Blood cancer OR: 2.24 [1] | p=0.004 [1] |
| Partner Firm Size | No significant changes observed [1] | Not significant |
| Partnership Territory | No significant changes observed [1] | Not significant |
Methodological Approaches: Experimental Protocols and Analytical Frameworks
Qualitative Research Methodology for Barrier Identification
The foundational understanding of recruitment challenges has been advanced through systematic qualitative research employing rigorous methodological approaches:
- Research Design: Phenomenological qualitative approach using in-depth focus group sessions [48]
- Participant Selection: Purposive sampling of 18 oncology healthcare providers (oncologists, nurses, surgeons) involved in cancer care and clinical research [48]
- Data Collection: 60-minute semi-structured focus group discussions following an interview guide with open-ended questions and probes, audio-recorded and transcribed verbatim [48]
- Analytical Framework: Thematic content analysis using Colaizzi's method with NVivo software; independent coding by multiple researchers achieving Cohen's kappa of 0.91, indicating high inter-coder reliability [48]
- Ethical Considerations: IRB approval obtained; confidentiality maintained through de-identification; Standards for Reporting Qualitative Research (SRQR) guidelines followed [48]
This methodological approach identified four distinct levels of barriers to clinical trial enrollment: patient-level, provider-level, clinical-level, and institutional-level barriers [48]. The same rigorous qualitative methodology has been replicated in subsequent studies examining research coordinating staff perspectives, employing semi-structured interviews with 12 staff members (6 clinical research coordinators and 6 regulatory/financial specialists) followed by thematic analysis [50].
Net Treatment Benefit: A Novel Statistical Framework
Recent methodological innovations aim to address both recruitment challenges and the need for more patient-centered trial outcomes:
- Conceptual Framework: Net treatment benefit (NTB) provides a multidimensional assessment of treatment efficacy by integrating survival, quality of life, and safety outcomes [51]
- Statistical Methodology: Utilizes generalized pairwise comparisons (GPC) to generalize the Wilcoxon Mann-Whitney test to accommodate all data types and multiple outcomes [51]
Implementation Protocol:
- Outcome Prioritization: Outcomes are ranked from highest to lowest priority based on input from multiple stakeholders (sponsors, clinicians, patient advocates) [51]
- Pairwise Comparison: Each patient in experimental group compared to every control patient across prioritized outcomes [51]
- Classification: Patient pairs categorized as "favorable," "unfavorable," or "neutral" to experimental treatment [51]
- Iterative Assessment: Neutral comparisons proceed to next prioritized outcome until resolution [51]
Advantages: Increases statistical power, potentially reducing required sample sizes by 15-30% while providing more holistic treatment assessment [51]
- Validation: Successfully deployed in SHAPERS trial for rectal cancer, effectively balancing survival benefits against treatment toxicities, particularly relevant for elderly populations [51]
Diagram 1: Multilevel Clinical Trial Barrier System. This framework illustrates the four interconnected levels of barriers to successful clinical trial implementation, as identified through qualitative research with healthcare providers [48].
The Scientist's Toolkit: Research Reagent Solutions
Table 3: Essential Research Reagents and Methodological Solutions for Clinical Trial Challenges
| Tool/Reagent | Primary Function | Application Context |
|---|---|---|
| Generalized Pairwise Comparisons (GPC) | Statistical methodology for multidimensional outcome assessment | Net treatment benefit calculation; integrates survival, QoL, and toxicity endpoints [51] |
| Digital Recruitment Platforms | Automated patient identification and matching | Servier-Klineo partnership enables real-time clinical trial matching for patients and physicians [49] |
| Decentralized Clinical Trial Infrastructure | Remote participation support through local centers and digital tools | Hybrid trials increased from 5-15% pre-pandemic to 30-50% currently; enables broader geographic participation [49] |
| Cultural & Linguistic Adaptation Protocols | Resource provision for multilingual materials and interpreter services | Shown to increase underrepresented group participation in non-therapeutic cancer trials from 20% to 62% [50] |
| Financial Toxicity Mitigation Resources | Address cost barriers through stipends and support services | Lazarex Cancer Foundation provides financial assistance for trial participation costs [52] |
Discussion: Integrated Solutions for a Path Forward
The comparative analysis of academic versus industry-driven trials reveals a complex ecosystem where neither model fully addresses the fundamental challenges of recruitment, personnel, and financial constraints. The shifting landscape toward industry sponsorship brings increased investment but also prioritizes certain types of research questions, potentially leaving gaps in fundamental cancer research [9].
The multilevel barrier framework demonstrates how challenges at patient, provider, clinical, and institutional levels interact to create systemic recruitment failures. Patient-level barriers including mistrust, geographic distance, and financial concerns are compounded by provider-level limitations in awareness and time constraints [48]. These are further exacerbated by clinical-level issues with restrictive eligibility criteria and institutional-level staff shortages and administrative burdens [48] [50]. This interconnectedness explains why singular interventions have limited impact and underscores the need for comprehensive, system-wide solutions.
Methodological innovations like net treatment benefit and generalized pairwise comparisons represent promising approaches to increase trial efficiency and patient-centeredness. By integrating multiple outcomes into a single assessment, these methods may reduce sample size requirements while providing more clinically relevant results [51]. Similarly, digital platforms and decentralized trial models leverage technology to address geographic and awareness barriers [49].
The quantitative success rates for early-stage oncology collaborations (9.9% from discovery stage; 24.2% from preclinical stage) highlight the inherent risk in cancer drug development [1]. The significant impact of contract type and technology modality on success probabilities provides strategic guidance for partnership formation and resource allocation.
Overcoming the pervasive challenges in cancer clinical trials requires acknowledging the complementary roles of academic and industry-driven research while implementing evidence-based solutions across multiple levels. No single approach will suffice; rather, progress depends on statistical innovation, technological integration, financial support mechanisms, and systematic barrier reduction. As cancer incidence continues to rise—with 2024 marking the first year projected to exceed 2 million new cases in the United States—addressing these fundamental inefficiencies becomes increasingly urgent [9].
Researchers, sponsors, and policymakers must collaborate to reengineer a clinical trial ecosystem that balances scientific rigor with practical feasibility, and commercial interests with public health needs. Through the coordinated implementation of multidimensional assessment methodologies, decentralized trial infrastructure, diversity-focused recruitment strategies, and strategic partnerships, the field can overcome the historical pitfalls that have hampered progress in cancer clinical research.
Streamlining Regulatory Oversight and Reporting Burdens
Clinical research represents a cornerstone of oncological advancement, yet its conduct varies significantly between academic and industry-sponsored settings. These differences fundamentally influence how regulatory oversight and reporting burdens are managed. A 2024 global survey of highly qualified academic research institutions (ARIs) reveals that 90% of ARIs participate in industry-sponsored trials, while all engage in academic trials [53]. This same survey identified a critical disparity: academic trials face greater challenges in communication with ethics committees and competent authorities compared to their industry-sponsored counterparts [53]. Additionally, academic trials were found to have significantly less financial support during their conduct, directly impacting their capacity to manage regulatory requirements efficiently [53].
The convergence of different operational models makes the comparison of regulatory approaches particularly valuable. Understanding these distinctions is essential for researchers, scientists, and drug development professionals seeking to optimize trial workflows and navigate the complex regulatory landscape of oncological research.
Comparative Analysis of Regulatory Performance
A direct comparison of operational challenges highlights key performance differentiators between academic and industry-sponsored trials. The data, synthesized from a cross-sectional survey-based study, quantifies these disparities [53].
Table 1: Challenges in Trial Set-Up and Conduct: Academic vs. Industry-Sponsored Trials
| Challenge Area | Academic Trials | Industry-Sponsored Trials |
|---|---|---|
| Insufficient Personnel Resources | 60% | 50% |
| Recruitment Problems | 60% | 78% |
| Lack of Knowledge/Experience | 35% | 11% |
| Regulatory Communication Hurdles | Greater Challenges | Fewer Challenges |
| Financial Support During Conduct | Significantly Less | Greater |
The data indicates that industry-sponsored trials encounter fewer issues in set-up, funding, and trial conduct [53]. The most pronounced difference lies in "Lack of Knowledge/Experience," where academic trials report this challenge at more than three times the rate of industry trials [53]. This suggests that industry sponsors benefit from more standardized procedures and specialized regulatory affairs units. Conversely, patient recruitment presents a greater problem for industry trials, potentially due to more stringent eligibility criteria or competition for participants.
Beyond the direct comparison of trial types, broader regulatory reform initiatives highlight the universal importance of burden reduction. In the U.S., federal efforts have focused on revising the interpretation of paperwork reduction laws to better identify and cut burdens, encouraging agencies to simplify information requests and enhance communication tools to reduce learning costs for the public [54]. These principles of streamlining are directly applicable to the regulatory processes governing clinical trials.
Experimental Protocols and Outcome Data
Methodologies for Comparing Trial Outcomes
To objectively compare performance, including outcomes potentially influenced by regulatory efficiency, specific experimental methodologies are employed. One key approach is the observational cross-sectional study with an analytical component.
Detailed Protocol:
- Objective: Compare overall survival (OS), progression-free survival (PFS), and treatment response between eligible patients who participated in phase III cancer clinical trials and those who refused [55] [56].
- Patient Cohort: Patients diagnosed with locally advanced or metastatic cervical cancer or metastatic castration-resistant prostate cancer who were eligible for phase III trials [56].
- Study Arms: "Participants" (those who accepted trial participation) vs. "Refusers" (those who were eligible but declined) [55].
- Data Collection: Sociodemographic, clinical, and treatment characteristics were recorded. Vital status was verified quarterly for 24 months [56].
- Statistical Analysis: OS and PFS were estimated using the Kaplan-Meier method. Survival curves were compared using the log-rank test. Hazard Ratios (HRs) were calculated using a Cox proportional hazards model [55] [56].
Key Experimental Findings
This methodological approach yields comparative outcome data, which can serve as a proxy for the effectiveness of the underlying trial processes.
Table 2: Comparison of Clinical Outcomes: Trial Participants vs. Eligible Refusers
| Outcome Measure | Women (Cervical Cancer) | Men (Prostate Cancer) |
|---|---|---|
| Study Reference | [55] [56] | [55] [56] |
| Progression (Participants) | 22.5% | 20% |
| Progression (Refusers) | 25.8% | 26% |
| Complete Response (Participants) | 12.9% | Not Specified |
| Complete Response (Refusers) | 9.6% | Not Specified |
| Median PFS (Refusers) | 7.4 months | Not Reached |
| PFS (Participants at 28 mo.) | 74.1% without progression | Not Specified |
| Overall Survival at 20 mo. | Not Specified | 55.2% (Participants) |
| Overall Survival at 45 mo. | Not Specified | 56.8% (Refusers) |
The conclusion from this study was that participation in trials could improve clinical response rates and progression-free survival, without a negative impact on overall survival [55] [56]. This suggests that the rigorous, protocol-driven environment of a clinical trial, which includes structured regulatory reporting, can be associated with favorable intermediate outcomes.
Visualizing Workflows and Processes
Regulatory Oversight Workflow in Clinical Trials
The following diagram illustrates the general workflow for regulatory oversight in clinical trials, highlighting pathways where streamlined processes can reduce burden.
Outcome Assessment in Cancer Clinical Trials
This diagram maps the process for assessing key endpoints in cancer trials, such as overall survival and progression-free survival.
The Scientist's Toolkit: Research Reagent Solutions
The following table details key reagents and materials essential for conducting the molecular analyses that underpin modern cancer clinical trials.
Table 3: Essential Research Reagents for Cancer Trial Biomarker Analysis
| Reagent/Material | Primary Function in Research |
|---|---|
| Formalin-Fixed Paraffin-Embedded (FFPE) Tissue Sections | Preserves tumor tissue morphology and biomolecules for histological analysis and biomarker staining. |
| Primary Antibodies for IHC | Enable detection and localization of specific protein biomarkers (e.g., PD-L1, HER2) via immunohistochemistry. |
| Next-Generation Sequencing (NGS) Panels | Allow for parallel sequencing of multiple genes from tumor DNA/RNA to identify targetable mutations. |
| RECIST 1.1 Guidelines | Standardized criteria for measuring and categorizing tumor response in solid tumors via imaging. |
| Electronic Data Capture (EDC) Systems | Secure platforms for collecting, managing, and reporting clinical trial data, streamlining regulatory reporting. |
| Programmed Death Ligand 1 (PD-L1) Assays | Specific tests to quantify PD-L1 expression levels, a critical biomarker for immunotherapy trials. |
The comparative analysis clearly demonstrates that industry-sponsored trials generally experience fewer regulatory and operational challenges than academic trials, which struggle more with personnel resources, experience, and regulatory communication [53]. This efficiency may contribute to the environment in which participants can experience better clinical response rates and progression-free survival, as observed in comparative studies [55] [56].
Streamlining regulatory oversight is not merely an administrative convenience but a crucial factor in enhancing the quality and feasibility of cancer research. Improving collaboration between academic sponsors and ARIs, alongside adopting modernized regulatory frameworks as seen in government initiatives [54], is essential to address these challenges. By leveraging structured workflows, standardized reagents, and efficient data management, the research community can reduce administrative burdens and accelerate the development of new cancer therapies.
Optimizing Biomarker Validation and Companion Diagnostic Development
The development of biomarkers and companion diagnostics (CDx) represents a critical nexus between basic scientific discovery and clinical application in oncology. Biomarkers, defined as objectively measurable indicators of biological processes, are the foundation upon which precision medicine is built [57]. The journey from biomarker discovery to a regulatory-approved companion diagnostic is complex, with distinct methodologies, success rates, and primary objectives characterizing academic versus industry-driven research. Companion diagnostics are in vitro diagnostic devices or tools essential for the safe and effective use of corresponding therapeutic products, serving to identify the right patients for targeted therapies [58] [59]. The first companion diagnostic, the immunohistochemistry (IHC) test HercepTest, was approved alongside trastuzumab (Herceptin) in 1998, establishing a template for drug-diagnostic co-development that has since expanded to include various technologies such as next-generation sequencing (NGS) and polymerase chain reaction (PCR) [58] [59].
This guide provides a comparative analysis of biomarker validation and companion diagnostic development approaches, framed within the context of cancer trial outcomes research. It examines how academic explorations of disease mechanisms and industrial imperatives for regulatory approval and market success shape different development pathways, ultimately influencing the efficiency, clinical applicability, and commercial viability of resulting diagnostic products. Understanding these diverging approaches is essential for researchers, scientists, and drug development professionals seeking to optimize biomarker development strategies and bridge the translational gap between discovery and clinical implementation.
Comparative Analysis of Development Paradigms
Fundamental Differences in Objectives and Outcomes
Academic and industry-driven research in biomarker validation and companion diagnostic development operate under fundamentally different paradigms with distinct priorities, success metrics, and operational constraints.
Table 1: Core Distinctions Between Academic and Industry-Driven Biomarker Research
| Parameter | Academic Research | Industry-Driven Research |
|---|---|---|
| Primary Objective | Knowledge generation, mechanism elucidation, publication | Regulatory approval, clinical utility, commercialization |
| Success Metrics | Publication impact, grants, citations | Regulatory approval, market share, reimbursement |
| Development Timeline | Exploratory (often 5+ years) | Targeted (increasingly 2-3 years with accelerated pathways) |
| Biomarker Scope | Broad, exploratory panels (multi-omics) | Focused, clinically actionable single biomarkers or limited panels |
| Validation Standard | Statistical significance, biological plausibility | Clinical validity, analytical robustness, regulatory standards |
| Sample Size | Often limited by recruitment challenges | Large, multi-center trials with predefined statistical power |
The regulatory landscape for companion diagnostics has evolved significantly, with the U.S. Food and Drug Administration (FDA) approving more than 78 drug/CDx combinations by early 2025 [58]. Industry-driven development must navigate this complex regulatory environment, requiring rigorous analytical and clinical validation that demonstrates reliability and clinical utility. Between 2011-2024, 71 new molecular entities in oncology and hematology were approved with CDx, representing 42% of approvals in this period—a significant increase from just 15% in 1998-2010 [58]. This trend highlights the growing integration of diagnostics with therapeutic development in industry settings.
Academic research often pioneers novel biomarker discoveries through multi-omics approaches that integrate genomics, proteomics, metabolomics, and transcriptomics to achieve a holistic understanding of disease mechanisms [57] [60]. However, the transition from discovery to clinical application remains challenging, with only approximately 0.1% of potentially clinically relevant cancer biomarkers described in literature progressing to routine clinical use [61]. This highlights the significant translational gap between academic discovery and clinical implementation.
Quantitative Performance Metrics and Success Rates
Direct comparison of outcomes between academic and industry-driven approaches reveals substantial differences in efficiency, success rates, and clinical impact.
Table 2: Performance Metrics Comparison for Biomarker Development
| Performance Indicator | Academic Research | Industry-Driven Research |
|---|---|---|
| Success Rate to Clinical Use | ~0.1% of discovered biomarkers [61] | >80% for CDx linked to approved therapies [58] |
| Drug Efficacy with CDx | Not typically measured | 50-60% pre-CDx to >90% with CDx in some cases [59] |
| Regulatory Approval Time | Not applicable | Mean 707-day delay for tissue-agnostic CDx (range 0-1732 days) [58] |
| Clinical Trial Enrollment | 3% of cancer patients in community settings [7] | Higher in industry-sponsored trials due to infrastructure |
| Market Impact | Limited direct impact | Global CDx market: $7.03B (2024) to $22.83B (2034) projected [62] |
Industry-driven development demonstrates markedly higher success rates in translating biomarkers to clinically applicable diagnostics, albeit with substantial investment and regulatory oversight. The high failure rate in academic biomarker translation often stems from challenges in demonstrating clinical validity, reproducibility, and obtaining regulatory endorsement for clinical use [57] [61]. A review of the European Medicines Agency biomarker qualification procedure revealed that 77% of biomarker challenges were linked to assay validity issues, including problems with specificity, sensitivity, detection thresholds, and reproducibility [61].
The commercial impact of successfully developed companion diagnostics is substantial, with the global market projected to grow at a compound annual growth rate of 12.5% from 2024 to 2034 [62]. This growth is driven by rising cancer prevalence, advancements in precision medicine, and increasing demand for targeted therapies. Industry-driven development effectively addresses the stringent requirements for clinical validity and utility that often challenge academically-developed biomarkers.
Methodological Approaches and Experimental Protocols
Biomarker Validation Frameworks and Standards
Biomarker validation methodologies differ significantly between academic and industry contexts, with varying emphases on technical robustness, clinical utility, and regulatory compliance.
Academic Validation Protocols
Academic biomarker validation typically employs a phased approach beginning with discovery studies using techniques such as single-cell sequencing, spatial transcriptomics, and high-throughput proteomics to generate comprehensive molecular profiles [57]. The process generally follows this workflow:
- Discovery Phase: Unbiased biomarker identification using multi-omics platforms on well-characterized patient cohorts.
- Analytical Validation: Initial assessment of assay performance characteristics including precision, sensitivity, and dynamic range.
- Clinical Correlation: Examination of associations between biomarker levels and clinical outcomes in retrospective cohorts.
- Independent Verification: Testing in additional patient cohorts to verify initial findings.
Academic validation frequently utilizes emerging technologies such as single-cell analysis, which enables deeper insights into tumor microenvironments and identification of rare cell populations that may drive disease progression or resistance to therapy [60]. The integration of multi-omics data and advanced analytical methods has been shown to improve early Alzheimer's disease diagnosis specificity by 32%, demonstrating the potential of comprehensive biomarker profiling [57].
Industry Validation Protocols
Industry validation follows more standardized and rigorous pathways aligned with regulatory requirements. The framework emphasizes fit-for-purpose validation, where the level of validation is tailored to the intended clinical use of the biomarker [61]. Key components include:
- Analytical Validation: Comprehensive assessment of analytical performance including accuracy, precision, specificity, sensitivity, and reproducibility using predefined acceptance criteria.
- Clinical Validation: Demonstration that the biomarker reliably predicts clinically meaningful outcomes in the intended use population.
- Standardization: Implementation of standardized protocols and controls to ensure consistency across testing sites.
- Cross-Validation: Comparison with established methods or reference standards where available.
Industry increasingly employs advanced technologies such as liquid chromatography tandem mass spectrometry (LC-MS/MS) and Meso Scale Discovery (MSD), which offer superior precision and sensitivity compared to traditional ELISA methods [61]. MSD's electrochemiluminescence detection provides up to 100 times greater sensitivity than traditional ELISA, enabling detection of lower abundance proteins and a broader dynamic range [61]. The economic advantage of these advanced methods is substantial—measuring four inflammatory biomarkers using individual ELISAs costs approximately $61.53 per sample, compared to $19.20 per sample using MSD's multiplex assay [61].
Biomarker Development Pathways
Companion Diagnostic Development Workflows
Companion diagnostic development requires close coordination between diagnostic and therapeutic development, with industry demonstrating more structured approaches to this co-development process.
Industry CDx Development Model
The industry model for companion diagnostic development follows a coordinated pathway with defined stages:
- Co-Development Planning: Joint strategic planning between pharmaceutical and diagnostic partners initiated early in therapeutic development.
- Assay Development: Development of robust, reproducible assays suitable for clinical use.
- Clinical Trial Integration: Incorporation of the diagnostic assay into therapeutic clinical trials to establish clinical utility.
- Regulatory Submission: Preparation and submission of comprehensive data packages to regulatory agencies.
- Commercial Launch: Simultaneous launch of therapeutic and diagnostic products.
This model has proven highly effective, with 67% of drugs with CDx receiving simultaneous approval of both drug and diagnostic [58]. The remaining 33% represent scenarios where CDx approval followed drug approval, with a mean delay of 707 days for tissue-agnostic indications [58]. Industry development increasingly leverages advanced technologies including next-generation sequencing and liquid biopsies, with Illumina's TruSight Oncology Comprehensive test receiving FDA approval as a CDx capable of profiling over 500 genes in solid tumors [62].
Academic CDx Development Contributions
Academic institutions contribute to CDx development through:
- Biomarker Discovery: Identification of novel biomarkers through mechanistic studies.
- Proof-of-Concept Studies: Initial demonstration of clinical associations in well-characterized cohorts.
- Method Development: Creation of novel assay technologies and platforms.
- Clinical Correlations: Establishment of relationships between biomarker status and treatment outcomes.
Academic centers face significant challenges in advancing CDx development to regulatory approval, including limited resources for large-scale clinical validation, infrastructure constraints for assay standardization, and expertise gaps in regulatory affairs. These limitations often necessitate partnerships with industry for final development and commercialization.
Technological Approaches and Research Solutions
Analytical Platforms and Their Applications
The evolving landscape of biomarker analysis encompasses diverse technological platforms with varying capabilities, applications, and performance characteristics suited to different research contexts.
Table 3: Biomarker Analytical Platforms and Performance Characteristics
| Technology | Common Applications | Sensitivity | Throughput | Multiplexing Capability | Suitability |
|---|---|---|---|---|---|
| ELISA | Protein quantification | Moderate | Moderate | Low (single-plex) | Academic validation, established biomarkers |
| LC-MS/MS | Protein quantification, metabolomics | High | Moderate | High (hundreds to thousands) | Industry validation, biomarker panels |
| MSD | Cytokine signaling, immune markers | Very High (100x ELISA) | High | Moderate (custom panels) | Industry, translational research |
| NGS | Genetic mutations, fusion detection | High | High | Very High (500+ genes) | CDx development, comprehensive profiling |
| IHC | Protein expression, cellular localization | Moderate | Moderate | Low (sequential) | Clinical CDx (e.g., HER2, PD-L1) |
| Liquid Biopsy | ctDNA analysis, treatment monitoring | High | High | Moderate to High | Minimal residual disease, therapy selection |
The selection of analytical platforms is influenced by project phase, intended use, and resource constraints. Academic research often begins with established techniques such as ELISA or IHC, while industry increasingly adopts advanced platforms such as MSD and LC-MS/MS that offer superior performance characteristics and regulatory compatibility [61]. Next-generation sequencing has emerged as a particularly transformative technology, with comprehensive genomic profiling enabling detection of multiple biomarkers across hundreds of genes in a single assay [62] [63].
Research Reagent Solutions for Biomarker Development
Successful biomarker validation and companion diagnostic development requires specialized reagents and materials that ensure analytical robustness and reproducibility.
Table 4: Essential Research Reagents for Biomarker Validation
| Reagent/Material | Function | Application Examples | Critical Quality Attributes |
|---|---|---|---|
| Validated Antibodies | Specific antigen detection | IHC, immunoassays | Specificity, affinity, lot-to-lot consistency |
| Reference Standards | Assay calibration, performance monitoring | Quantitative assays | Well-characterized, stability, commutability |
| Control Materials | Quality control, run monitoring | Positive/negative controls | Stability, matrix-matched, clinically relevant |
| Sample Collection Kits | Standardized specimen procurement | Blood, tissue, liquid biopsy | Stability, yield, compatibility with downstream assays |
| Assay Kits | Standardized biomarker measurement | ELISA, PCR, NGS | Sensitivity, specificity, reproducibility |
| Data Analysis Software | Result interpretation, reporting | NGS, complex signatures | Accuracy, reproducibility, regulatory compliance |
Industry-driven development places greater emphasis on reagent standardization, quality control, and documentation to ensure regulatory compliance, while academic research may prioritize novel reagent development and exploratory applications. The growing trend toward multiplexed biomarker panels requires increasingly sophisticated reagent systems capable of simultaneously measuring multiple analytes with high specificity and minimal cross-reactivity [60] [61].
Regulatory Considerations and Implementation Challenges
Regulatory Pathways and Evidence Requirements
Regulatory frameworks for biomarker validation and companion diagnostic approval differ significantly between academic and industry contexts, with distinct evidence requirements and review processes.
The FDA and EMA have established formal biomarker qualification processes that require demonstration of both analytical validity and clinical utility [61]. Industry-driven development is characterized by systematic approaches to addressing these requirements, including:
- Predefined Analytical Performance Criteria: Establishment of specific performance targets for accuracy, precision, sensitivity, and specificity.
- Prospective Clinical Validation: Demonstration of clinical utility in appropriately designed studies.
- Standardized Operating Procedures: Implementation of controlled processes for assay execution and result interpretation.
- Comprehensive Documentation: Detailed recording of development, validation, and manufacturing processes.
Academic researchers often face challenges in navigating regulatory requirements, particularly regarding assay standardization, clinical evidence standards, and submission processes. Regulatory agencies have demonstrated flexibility in certain contexts, particularly for rare biomarkers where sample availability is limited [64]. An analysis of CDx development for non-small cell lung cancer revealed that regulatory flexibilities, including use of alternative sample sources and modified validation approaches, have been utilized for biomarkers occurring in less than 1% of patients [64].
CDx Regulatory Evidence Requirements
Implementation Challenges and Barrier Analysis
The implementation of biomarkers and companion diagnostics in clinical practice faces multiple challenges that are addressed differently through academic and industry approaches.
Clinical Adoption Barriers
Key barriers to clinical adoption include:
- Reimbursement Challenges: Complex and variable reimbursement policies create significant barriers to adoption, particularly in academic settings where funding may be limited [62] [63].
- Access Disparities: Implementation is often limited in low- and middle-income countries and underserved populations due to infrastructure constraints and cost barriers [63].
- Clinical Integration: Incorporation of biomarker testing into clinical workflows requires education, infrastructure, and process changes that present implementation challenges.
- Evidence Gaps: Limited real-world evidence and health economic data may hinder clinical adoption and reimbursement decisions.
Industry addresses these challenges through commercial strategies, health economic studies, and stakeholder education, while academic approaches often focus on demonstration projects, implementation research, and advocacy.
Development and Validation Challenges
Technical and scientific challenges in biomarker validation include:
- Data Heterogeneity: Integration of diverse data types from multiple platforms presents analytical challenges [57].
- Standardization: Lack of standardized protocols and reference materials complicates cross-study comparisons and clinical implementation.
- Generalizability: Limited representation of diverse populations in validation studies restricts broader applicability [57].
- Reproducibility: Inconsistent results across studies or platforms undermines clinical confidence.
Industry approaches these challenges through standardized protocols, multi-site validation, and rigorous quality control, while academic research often emphasizes novel methodology development and mechanistic investigation.
Future Directions and Strategic Recommendations
Emerging Trends and Evolving Paradigms
The landscape of biomarker validation and companion diagnostic development is evolving rapidly, with several trends shaping future approaches:
- Expansion Beyond Oncology: While oncology remains the primary focus, biomarker and CDx applications are expanding into neurology, infectious diseases, cardiovascular conditions, and other therapeutic areas [62] [63].
- Technology Convergence: Integration of multiple technologies—including NGS, liquid biopsy, AI, and digital pathology—is creating more comprehensive and powerful diagnostic solutions [62] [59] [60].
- Decentralized Testing: Development of portable, rapid testing platforms enables broader access to biomarker testing beyond centralized reference laboratories [63].
- Artificial Intelligence Integration: AI and machine learning are increasingly applied to biomarker discovery, assay optimization, and result interpretation [57] [60].
- Multi-Omics Integration: Combined analysis of genomic, transcriptomic, proteomic, and metabolomic data provides more comprehensive biological insights [57] [60].
These trends present opportunities for both academic and industry researchers, with academic institutions often pioneering novel technological approaches and industry focusing on clinical implementation and commercialization.
Strategic Recommendations for Optimized Development
Based on comparative analysis of academic and industry approaches, the following strategic recommendations can enhance biomarker validation and companion diagnostic development:
- Foster Cross-Sector Collaboration: Establish partnerships that leverage academic innovation and industry development capabilities.
- Implement Fit-for-Purpose Validation: Tailor validation strategies to intended use contexts, balancing scientific rigor with practical considerations.
- Embrace Advanced Technologies: Adopt innovative platforms that enhance sensitivity, specificity, and efficiency while reducing costs.
- Address Diversity Gaps: Ensure representation of diverse populations in validation studies to enhance generalizability and equity.
- Generate Real-World Evidence: Complement traditional clinical trials with real-world data to demonstrate clinical utility and value.
- Engage Stakeholders Early: Include regulators, payers, clinicians, and patients early in development to align with needs and requirements.
By integrating the innovative capacity of academic research with the development rigor of industry approaches, the field can accelerate the translation of biomarker discoveries into clinically valuable companion diagnostics that enhance patient care and treatment outcomes.
The global companion diagnostics market projection—growing from $7.03 billion in 2024 to $22.83 billion by 2034—underscores the increasing importance of these technologies in precision medicine [62]. Success will require navigating the complex interplay between scientific innovation, clinical utility, regulatory requirements, and commercial realities across the biomarker development continuum.
Leveraging Collaborative Models to Overcome Sector-Specific Limitations
Cancer clinical research represents a critical frontier in the battle against a disease that affects millions globally. The journey from laboratory discoveries to patient treatments relies heavily on two primary engines: academically-driven investigations and industry-sponsored drug development. These sectors operate with distinct strengths, limitations, and primary motivations. Academia often pioneers fundamental biological discoveries and investigates broader therapeutic questions, including drug repurposing and combination treatments. In contrast, industry excels at accelerating drug development through optimized resources and structured processes aimed at regulatory approval for new compounds. Recent data reveals a substantial shift in this landscape, with industry-sponsored trials now enrolling over eight times more patients than federally sponsored studies [8] [9]. This article provides a comparative analysis of academic versus industry-driven cancer trial outcomes, examining how collaborative models can bridge sector-specific gaps to advance oncology research more effectively.
Quantitative Comparison of Trial Characteristics and Outcomes
Enrollment Trends and Success Rates
Data from recent analyses highlight significant disparities in trial enrollment and success rates between collaborative and single-sector approaches. The tables below summarize key comparative metrics.
Table 1: Patient Enrollment Trends in Cancer Clinical Trials (2008-2022)
| Trial Sponsor Category | Adult Trial Enrollment Ratio (Industry vs. Federal) | Pediatric Trial Enrollment Ratio (Industry vs. Federal) | Five-Year Average New Trial Activations (2018-2022) |
|---|---|---|---|
| Industry-Sponsored | 9.6:1 (increased from 4.8:1 in 2008-2012) [8] | 2.3:1 (increased from 0.7:1 in 2008-2012) [8] | 9.1 (tripled from 3.2) for adult trials [9] |
| Federally-Sponsored | Reference | Reference | 3.9 for pediatric trials (increased from 1.1) [9] |
Table 2: Phase 1 Trial Entry Success Rates for Oncology Projects (2015-2019)
| Partnership Characteristic | Discovery Stage Success Rate | Preclinical Stage Success Rate | Significant Influencing Factors |
|---|---|---|---|
| All Academia-Industry Collaborations | 9.9% [1] | 24.2% [1] | Contract type, technology focus [1] |
| Co-development Contracts | OR 16.45 (p=0.008) [1] | Not specified | Strong significance in discovery stage [1] |
| Licensing Agreements | OR 42.43 (p=0.000) [1] | Not specified | Most significant factor in discovery stage [1] |
| Cell/Gene Therapy Focus | OR 3.82 (p=0.008) [1] | Not specified | Positive technology impact [1] |
| Blood Cancer Focus | Not significant | OR 2.24 (p=0.004) [1] | Significant in preclinical stage [1] |
Methodological Approaches in Sector-Specific Research
Experimental Protocols for Collaborative Oncology Trials
Academia-Industry Partnership Assessment Protocol
The methodology for evaluating academia-industry collaboration success involves comprehensive longitudinal tracking:
- Data Collection: Systematic identification of oncology partnership agreements signed between 2015-2019 using commercial databases (e.g., Clarivate Analytics) [1]. Initial search identified 8,420 contracts in oncology, narrowed to 6,046 development-related contracts after excluding commercial activities [1].
- Inclusion Criteria: Contracts where original developers were universities, academic institutions, or hospitals; pipeline at pre-clinical stage at contract signing; specific focus on oncology projects (344 discovery stage, 360 preclinical stage cases) [1].
- Success Metric: Primary endpoint defined as successful entry into Phase 1 clinical trials [1].
- Statistical Analysis: Multivariate logistic regression analyzing factors including contract type (financial investment, co-development, licensing), technology type (small molecules, biologics, cell/gene therapies), cancer type, partner firm size, partnership territory, and year of contract signing [1].
Federally-Sponsored vs. Industry-Sponsored Trial Analysis Protocol
A recent study compared the roles of industry and federal sponsors in cancer clinical research:
- Data Source: ClinicalTrials.gov database encompassing 26,080 cancer clinical studies from 2008-2022 [8] [9].
- Classification: Trials categorized as industry-sponsored or federally-sponsored based on funding source designation [8].
- Enrollment Analysis: Total patient enrollment counts calculated for each category across five-year periods (2008-2012, 2013-2017, 2018-2022) [8].
- Demographic Assessment: Participant diversity compared across sponsorship types, with particular attention to enrollment of Black participants and other underrepresented groups [8].
- Trial Activation Metrics: Counts of new trial initiations per year stratified by sponsor type to track trends in research investment [9].
Research Reagent Solutions for Collaborative Oncology Studies
Table 3: Essential Research Materials for Contemporary Oncology Trials
| Reagent/Technology | Primary Function | Application Context |
|---|---|---|
| Next-Generation Sequencing (NGS) | Comprehensive genomic profiling of tumors [65] | Identification of actionable mutations for targeted therapy selection |
| Circulating Tumor DNA (ctDNA) Assays | Detection of tumor-derived DNA in blood [66] | Monitoring treatment response, minimal residual disease detection |
| Artificial Intelligence (AI) Diagnostic Tools | Pattern recognition in complex datasets [65] | Biomarker identification, patient stratification, trial matching |
| Prov-GigaPath | AI-powered whole-slide imaging analysis [65] | Cancer detection and biomarker identification from pathology slides |
| DeepHRD | Deep learning detection of homologous recombination deficiency [65] | Identifying patients likely to respond to PARP inhibitors |
| MSI-SEER | AI identification of microsatellite instability [65] | Expanding immunotherapy eligibility for gastrointestinal cancers |
| AlphaFold 3 | Protein structure prediction [65] | Forecasting treatment-relevant biomarkers and drug targets |
Visualizing Collaborative Dynamics and Outcomes
Partnership Success Factors in Oncology Collaborations
Setback Response Patterns in Cross-Sector Collaborations
Strategic Implications and Future Directions
Overcoming Collaborative Barriers
Cross-sector collaborations face significant challenges that can undermine their effectiveness. Research identifies several critical barriers including governance obstacles, contextual differences between sectors, lack of shared understanding regarding priorities and working methods, and organizational silos that foster "us versus them" mentalities [67] [68]. Additional challenges include insufficient leadership commitment to breaking down barriers and individual mindsets that view other functions as competitors rather than partners [68].
Successful collaborations employ specific strategies to overcome these barriers:
- Establishing shared goals that align KPIs, initiatives, and incentives enterprise-wide [68]
- Blending functional expertise within teams, projects, and leadership roles [68]
- Fostering communities of practice where peers from different functions share knowledge [68]
- Leadership modeling of collaborative behaviors to shift organizational norms [68]
- Utilizing skilled project managers who can facilitate cross-functional teams [68]
- Implementing cross-training programs to foster understanding of various perspectives [68]
Emerging Technologies Reshaping Collaboration
The integration of advanced technologies is creating new opportunities for collaborative cancer research:
- Artificial Intelligence: AI tools are streamlining clinical trial recruitment, data analysis, and patient matching. Platforms like HopeLLM summarize patient histories and identify trial matches more efficiently [65].
- Precision Medicine Platforms: Next-generation sequencing and biomarker analyses enable more precise identification of actionable targets, particularly through deep-learning tools like DeepHRD for detecting homologous recombination deficiency [65].
- Digital Support Tools: Psychosocial digital applications like the BMT-CARE App demonstrate how technology can provide specialized support to patients and caregivers, improving quality of life and reducing caregiving burden [69].
The comparative analysis of academic and industry-driven cancer research reveals a complex ecosystem where both sectors contribute distinct yet complementary strengths. Industry sponsorship has dramatically increased patient enrollment and accelerated drug development, particularly for targeted therapies. Meanwhile, academia-industry collaborations demonstrate significantly higher success rates in progressing from discovery to clinical trials, especially when structured as licensing agreements or co-development partnerships focused on innovative modalities like cell and gene therapies.
The most promising future for cancer research lies not in choosing between academic or industry approaches, but in developing more sophisticated collaborative models that leverage the strengths of both sectors. Such models require intentional design—establishing shared goals, blending expertise, fostering communication, and implementing governance structures that support mutual learning rather than mutual blaming when setbacks occur. As cancer complexity increases, so too must the sophistication of our collaborative approaches, ensuring that the collective power of diverse sectors is effectively harnessed to accelerate progress against cancer.
Measuring Impact: Validating Outcomes, Success Rates, and Comparative Effectiveness
Analyzing Phase 1 Trial Entry Success Rates from Academia-Industry Partnerships
The landscape of oncology drug development is increasingly defined by strategic collaborations between academic institutions and industry partners. Amidst record levels of research and development activity, with over 10,000 drug candidates in clinical development, the biopharmaceutical industry faces significant productivity challenges [70]. Declining success rates, which have plummeted to just 6.7% for Phase 1 drugs in 2024 compared to 10% a decade ago, have intensified the need for more effective R&D strategies [70]. Academia-industry partnerships have emerged as a pivotal approach to addressing these challenges by sharing risks and providing efficient conduits for novel ideas to transition from fundamental research to clinical application.
This comparative guide analyzes the performance of oncology development projects originating from academia-industry collaborations, with specific focus on their success rates in achieving Phase 1 clinical trial entry. By examining the characteristics of successful partnerships and quantifying their outcomes, this analysis provides evidence-based insights for researchers, scientists, and drug development professionals seeking to optimize their collaborative strategies in the competitive oncology landscape.
Methodology: Tracking the Transition from Lab to Clinic
Data Acquisition and Source Validation
The foundational data for this analysis originates from a comprehensive study published in Clinical and Translational Science in 2025 that systematically investigated success rates of Phase 1 clinical trial entry for oncology projects involving academia-industry collaboration [71] [1]. The researchers employed a rigorous methodological approach:
- Data Source: The global commercial database provided by Clarivate Analytics was searched to identify contracts executed within the oncology field between January 1, 2015, and December 31, 2019 [1].
- Initial Screening: From 8,420 initially identified contracts in oncology, 6,046 were directly related to development activities (financial investment, co-development, and licensing agreements) [1].
- Inclusion Criteria: The analysis focused on 2,575 cases where the development stage was at a pre-clinical phase when the contract was signed, with 704 cases involving universities, academic institutions, or hospitals as original developers [1].
- Final Cohort: The study population comprised 344 discovery-stage and 360 preclinical-stage projects, for which comprehensive logistic regression analyses were conducted to identify factors significantly associated with successful Phase 1 trial entry [1].
Variable Definitions and Analytical Approach
The methodology employed clear operational definitions for key variables to ensure consistent analysis:
- Collaboration Types: Partnerships were classified into three categories: (1) financial investment agreements, where partners provide capital for R&D; (2) co-development agreements, where entities jointly develop products with shared expertise and resources; and (3) licensing agreements, where one entity grants another rights to use developed technology [1].
- Technology Modalities: Drugs were categorized as (1) small molecules (low molecular weight compounds ≤750 Da); (2) peptides, proteins, monoclonal antibodies, and antibody-drug conjugates; or (3) cell or gene therapies [1].
- Success Metric: The primary endpoint was successful entry into Phase 1 clinical trials, verified through clinical trial registries and regulatory disclosures [71].
- Statistical Analysis: Multivariable logistic regression was used to identify factors independently associated with Phase 1 trial entry, with results expressed as odds ratios (OR) and p-values [71].
Comparative Performance Analysis: Quantitative Success Metrics
The transition from early-stage research to clinical testing represents a critical bottleneck in oncology drug development. The analysis reveals substantially different success probabilities depending on the stage of collaboration initiation:
Table 1: Phase 1 Clinical Trial Entry Success Rates by Collaboration Stage
| Collaboration Stage | Number of Projects | Phase 1 Trial Entry Success Rate |
|---|---|---|
| Discovery Stage | 344 | 9.9% |
| Preclinical Stage | 360 | 24.2% |
The significantly higher success rate for projects initiating partnerships during the preclinical stage (24.2%) compared to the discovery stage (9.9%) underscores the importance of de-risking projects before seeking collaborative development [71]. This differential success pattern highlights the substantial attrition that occurs during the transition from basic discovery research to clinically testable candidates, even before formal clinical evaluation begins.
Success Factors by Development Stage and Partnership Characteristics
The factors influencing successful Phase 1 trial entry varied considerably depending on whether collaborations began during discovery or preclinical stages:
Table 2: Factors Significantly Associated with Phase 1 Trial Entry Success
| Factor Category | Specific Factor | Odds Ratio | P-value | Significance Level |
|---|---|---|---|---|
| Discovery Stage Contracts | Contract Type: Co-development | 16.45 | 0.008 | Strong |
| Contract Type: Licensing | 42.43 | 0.000 | Strong | |
| Technology: Cell or Gene Therapy | 3.82 | 0.008 | Strong | |
| Preclinical Stage Contracts | Cancer Type: Blood Cancer | 2.24 | 0.004 | Strong |
| Year of Contract Signing | 1.24 | 0.021 | Weak |
The analysis revealed that partner firm size and partnership territory (domestic vs. international) did not demonstrate statistically significant associations with success rates for either development stage [71] [72]. This suggests that the structural characteristics of partnerships may be more consequential than the scale or geographical proximity of partner organizations.
Experimental Protocols and Research Workflows
Data Collection and Project Tracking Methodology
The research methodology for establishing Phase 1 entry success rates employed systematic tracking of collaboration outcomes:
Diagram 1: Project Screening and Analysis Workflow
This protocol enabled researchers to retrospectively track the progression of collaborative projects from contract signing through development milestones, providing real-world evidence of partnership effectiveness. The use of contractual data as the starting point circumvented the common challenge of limited disclosure from private companies regarding early-stage research progress [1].
Partnership Structure Assessment Framework
The experimental design included standardized assessment of collaboration parameters:
- Contract Type Classification: Each agreement was categorized as financial investment, co-development, or licensing based on terms specifying financial arrangements, intellectual property rights, and development responsibilities [1].
- Technology Modality Verification: Project descriptions and patent filings were reviewed to confirm technology classification (small molecule, biologic, or cell/gene therapy) [1].
- Success Verification: Phase 1 trial entry was confirmed through systematic monitoring of clinical trial registries (ClinicalTrials.gov), corporate disclosures, and scientific publications [71] [1].
Table 3: Key Research Reagents and Resources for Partnership Analysis
| Resource | Type | Application in Analysis |
|---|---|---|
| Clarivate Analytics Database | Commercial intelligence platform | Identification of collaboration contracts and terms [1] |
| ClinicalTrials.gov Registry | Clinical trial database | Verification of Phase 1 trial initiation and status [9] |
| Logistic Regression Models | Statistical analysis method | Identification of factors significantly associated with success [71] |
| Intellectual Property Databases | Patent and IP repository | Verification of technology types and ownership structures [1] |
Contextualizing the Findings Within Broader Oncology Trial Trends
The Shifting Landscape of Cancer Clinical Research
The performance of academia-industry partnerships must be understood within the broader context of evolving cancer clinical research ecosystems. Recent analyses reveal a pronounced shift toward industry-sponsored trials, with the estimated enrollment ratio for industry-sponsored versus federally sponsored trials increasing from 4.8 (2008-2012) to 9.6 (2018-2022) for adult trials [9]. This trend highlights the growing reliance on industry investment to conduct cancer clinical research, underscoring the importance of understanding the factors that make academia-industry partnerships successful.
This shifting landscape coincides with increasing pressure on R&D productivity. Despite record levels of investment exceeding $300 billion annually on pharmaceutical R&D, margins are expected to decline from 29% to 21% of total revenue by 2030 [70]. This economic context makes the efficient translation of academic research into clinically testable candidates through strategic partnerships increasingly vital for sustaining innovation in oncology drug development.
Emerging Innovations Shaping Future Partnerships
The evolving nature of oncology therapeutics is likely to influence future academia-industry collaboration dynamics. Several emerging trends are particularly relevant:
- Novel Therapeutic Modalities: The significant association between cell and gene therapies and successful Phase 1 entry from discovery stage (OR 3.82) reflects the growing importance of these innovative modalities [71]. The continued expansion of immunotherapy approaches, including bispecific antibodies, antibody-drug conjugates, and cellular therapies, represents particularly active areas for collaborative development [65] [73].
- Targeting Previously "Undruggable" Targets: Advances in targeting formerly inaccessible targets like KRAS mutations are creating new opportunities for academic discoveries to transition into clinical development through industry partnerships [73] [66].
- Artificial Intelligence Integration: AI-driven tools are increasingly being employed to enhance diagnostic accuracy, predict outcomes, and optimize treatment plans, creating new interdisciplinary collaboration opportunities between academic researchers and industry implementers [65].
This comparative analysis of Phase 1 trial entry success rates from academia-industry partnerships yields several evidence-based insights for optimizing collaborative oncology drug development:
First, the timing of partnership formation significantly influences success probability, with preclinical-stage collaborations achieving more than double the success rate of discovery-stage initiatives. This suggests that academic researchers should focus on advancing programs through preliminary validation before seeking industry partnerships.
Second, partnership structure substantially impacts outcomes, with licensing and co-development agreements demonstrating markedly higher success rates than simple financial investment arrangements. This indicates that deep operational integration and clear intellectual property frameworks are critical success factors.
Third, therapeutic area and technology platform selection influence success probabilities, with blood cancer targets and cell/gene therapy modalities showing particularly favorable profiles for successful clinical translation.
For researchers, scientists, and drug development professionals navigating the complex oncology development landscape, these findings provide a quantitative foundation for strategic decision-making regarding partnership formation, resource allocation, and development planning. By applying these evidence-based insights, stakeholders can enhance the productivity of their collaborative efforts and contribute to more efficient translation of scientific discoveries into clinical advances for cancer patients.
Comparative Analysis of Trial Results Generalizability to Real-World Populations
The translation of findings from controlled clinical trials to the diverse patient populations encountered in routine clinical practice remains a significant challenge in oncology. This comparative analysis examines the generalizability of trial results to real-world populations, framed within the critical context of academic versus industry-driven cancer trial outcomes research. Randomized controlled trials (RCTs) are universally regarded as the gold standard for establishing therapeutic efficacy due to their robust internal validity achieved through randomization and controlled conditions [74]. However, their external validity is frequently questioned, as trial participants often poorly represent the broader oncology patient community treated in real-world settings [75]. Estimates suggest that fewer than 10% of cancer patients participate in clinical trials, creating immediate concerns about the applicability of results to the remaining 90% treated in routine practice [74] [76].
The growing dominance of industry-sponsored research further complicates this landscape. A recent analysis revealed that between 2018 and 2022, industry-sponsored trials enrolled over eight times more patients than federally sponsored trials, with adult trials showing nearly ten-fold greater industry enrollment [8]. This shifting sponsorship landscape has profound implications for which research questions are pursued and which patient populations are studied. Federally funded trials have demonstrated substantially greater demographic diversity, enrolling three times more Black participants than industry-funded research [8], while industry trials predominantly aim to support new drug approvals rather than address broader clinical questions.
This analysis systematically evaluates quantitative data on trial generalizability, examines distinct methodological approaches across sponsorship models, and explores innovative frameworks for improving the application of trial evidence to diverse real-world populations, providing drug development professionals and researchers with evidence-based insights for optimizing trial design and interpretation.
Quantitative Analysis of Trial Representativeness
Sponsorship Patterns and Demographic Representation
A comprehensive analysis of more than 26,000 cancer clinical studies reveals dramatic shifts in research sponsorship over the past decade. The proportion of patient enrollments attributable to industry versus federal support has more than doubled in adult trials (from 4.8 to 9.6) and more than tripled in pediatric trials (from 0.7 to 2.3) when comparing 2008-2012 to 2018-2022 [8]. This sponsorship imbalance directly impacts participant diversity and the types of clinical questions being investigated.
Table 1: Comparative Analysis of Trial Sponsorship and Representation
| Characteristic | Federally Funded Trials | Industry Funded Trials |
|---|---|---|
| Primary Research Focus | Broad clinical questions, combined modalities, approved drug repurposing | Predominantly new drug approval support |
| Black Participant Enrollment | 3x higher representation | Substantially lower representation |
| Patient Enrollment Ratio (2018-2022) | Baseline | 8x higher overall enrollment |
| Typical Eligibility Criteria | Often broader inclusion criteria | Frequently restrictive eligibility criteria |
The differential enrollment patterns directly impact the generalizability of resulting evidence. Federally funded cancer clinical trials have contributed to an estimated 14 million life years gained over four decades and have played crucial roles in improving clinical care guidelines for patients [8]. Despite this impact, federal investment has not kept pace with industry research funding, resulting in flat enrollment counts in federally funded studies over more than a decade [8].
Prognostic Risk Disparities Between Trial and Real-World Populations
Beyond demographic representation, prognostic risk profiles differ substantially between trial participants and real-world populations. Research employing the TrialTranslator framework, which uses machine learning to risk-stratify real-world oncology patients, has quantified these differences across multiple cancer types [75] [76]. The framework emulated 11 landmark phase 3 RCTs using real-world data from the Flatiron Health EHR-derived database, encompassing approximately 280 cancer clinics across the United States [75].
Table 2: Survival Outcomes by Risk Phenotype in Emulated Trials
| Risk Phenotype | Survival Times | Treatment-Associated Survival Benefits | Representation in RCTs |
|---|---|---|---|
| Low-Risk | Similar to RCT results | Similar to RCT results | Overrepresented |
| Medium-Risk | Similar to RCT results | Similar to RCT results | Proportionately represented |
| High-Risk | Significantly lower than RCTs | Significantly lower than RCTs | Dramatically underrepresented |
The analysis revealed that patients stratified as high-risk using machine learning algorithms showed significantly lower survival times and treatment-associated survival benefits compared to results reported in the corresponding RCTs [75] [76]. These high-risk patients, who constitute a substantial proportion of real-world populations, are systematically underrepresented in clinical trials despite often receiving the studied treatments in routine practice. This prognostic risk disparity represents a crucial limitation in translating trial results to real-world settings.
Methodological Approaches to Generalizability Assessment
Machine Learning Frameworks for Risk Stratification
The TrialTranslator framework employs a sophisticated two-step methodology to assess and quantify generalizability gaps [75]. In the first step, cancer-specific prognostic models are developed using supervised survival-based machine learning approaches to predict patient mortality risk from the time of metastatic diagnosis. Across four prevalent advanced solid malignancies (aNSCLC, mBC, mPC, mCRC), a gradient boosting survival model (GBM) consistently demonstrated superior discriminatory performance compared to traditional Cox proportional hazards models [75]. For example, in advanced non-small cell lung cancer, the 1-year survival area under the curve (AUC) was 0.783 for the GBM compared to 0.689 for the conventional Cox model [75].
The second step involves trial emulation, where real-world patients who received either treatment or control regimens and met key eligibility criteria from landmark RCTs were identified. These patients were then stratified into low-risk, medium-risk, and high-risk phenotypes using mortality risk scores calculated from the machine learning model. Survival analysis assessed treatment effect for each phenotype using restricted mean survival time (RMST) and median overall survival derived from inverse probability of treatment weighted (IPTW)-adjusted Kaplan-Meier survival curves [75].
Statistical Methodologies for Generalizability Quantification
Beyond machine learning approaches, several statistical methodologies have been developed specifically to measure trial generalizability. A comparative evaluation of five generalizability indexes supports the use of β-index and C-statistic due to their strong statistical performance and interpretability [77]. These metrics allow clear categorization of generalizability into levels such as very high, high, medium, or low, with a β-index value between 1 and 0.8 (inclusive) or a C-statistic value between 0.5 and 0.8 (inclusive) indicating that the trial sample is highly representative of the patient population [77].
Another innovative statistical framework gaining traction is the net treatment benefit (NTB) methodology, which uses generalized pairwise comparisons (GPC) to integrate multiple outcomes into a single assessment [51]. This approach allows simultaneous evaluation of survival, quality of life, and toxicity outcomes, prioritized based on input from clinicians, patient advocates, and patients themselves [51]. By providing a more holistic assessment of treatment effects, NTB better reflects the complex decision-making process in real-world clinical practice and may improve the applicability of trial results to diverse patient populations.
Experimental Protocols for Generalizability Assessment
TrialTranslator Implementation Protocol
The experimental implementation of TrialTranslator involves specific methodological steps that can be replicated across cancer types:
Prognostic Model Development Protocol:
- Data Source: Nationwide EHR-derived database from Flatiron Health, sourced from approximately 280 cancer clinics [75]
- Study Population: Patients diagnosed with advanced or metastatic disease between 2011-2022 (aNSCLC: 68,483; mBC: 31,677; mPC: 18,927; mCRC: 34,315) [75]
- Feature Selection: Age, weight loss, ECOG performance status, cancer biomarkers, serum markers of frailty (albumin, hemoglobin) [75]
- Model Training: Six supervised survival ML models compared, with evaluation based on time-dependent AUC for 1-year (aNSCLC) and 2-year (mBC, mCRC, mPC) overall survival [75]
- Model Validation: Top-performing model selected based on test set discriminatory performance [75]
Trial Emulation Protocol:
- Eligibility Criteria Application: Patients must meet three key criteria: (1) correct cancer type, (2) received treatment of interest at appropriate line of therapy, (3) relevant biomarker status at treatment time [75]
- Prognostic Phenotyping: Patients stratified into low-risk (bottom tertile), medium-risk (middle tertile), and high-risk (top tertile) using mortality risk scores [75]
- Covariate Balancing: Application of inverse probability of treatment weighting (IPTW) to balance demographic information, area-level SES, insurance status, cancer characteristics, ECOG performance status, biomarkers, albumin, weight change, and mortality risk score between treatment arms [75]
- Outcome Assessment: Restricted mean survival time and median overall survival derived from IPTW-adjusted Kaplan-Meier survival curves [75]
Generalizability Index Calculation Protocol
For quantitative assessment of generalizability, the following experimental protocol can be implemented:
Data Collection Phase:
- Collect comprehensive baseline characteristics for both trial participants and target real-world population
- Include demographic, clinical, socioeconomic, and biomarker variables [77]
Statistical Analysis Phase:
- Calculate β-index and C-statistic using standardized formulas [77]
- Compare distribution of prognostic factors between trial and target populations
- Perform sensitivity analyses with different variable combinations
Interpretation Framework:
- β-index between 1 and 0.8 indicates high representativeness [77]
- C-statistic between 0.5 and 0.8 indicates high representativeness [77]
- Values below these thresholds indicate need for caution in generalizing results
Essential Research Reagents and Tools
The implementation of generalizability assessment frameworks requires specific methodological tools and data resources. The following table details key components necessary for conducting rigorous generalizability research in oncology.
Table 3: Essential Research Reagents and Methodological Tools
| Tool/Resource | Specifications | Research Application |
|---|---|---|
| Electronic Health Record Databases | Flatiron Health EHR-derived database (280 cancer clinics, longitudinal repository) [75] | Source of real-world patient data for prognostic modeling and trial emulation |
| Machine Learning Algorithms | Gradient Boosting Machine, Random Survival Forest, Survival SVM, Penalized Cox [75] | Development of prognostic models for risk stratification |
| Generalizability Metrics | β-index, C-statistic, Standardized Mean Difference, Kolmogorov-Smirnov Distance [77] | Quantitative assessment of representativeness |
| Statistical Methodologies | Net Treatment Benefit (NTB), Generalized Pairwise Comparisons (GPC) [51] | Multidimensional assessment of treatment benefit |
| Performance Status Scales | ECOG Performance Status Scale (0-5 grading system) [78] | Standardized assessment of functional status for eligibility and prognostication |
The ECOG Performance Status Scale is particularly fundamental as both an eligibility criterion and prognostic factor in oncology trials. The scale ranges from 0 (fully active) to 5 (dead), with scores ≥2 frequently excluding patients from trials despite representing substantial real-world populations [78]. This measurement tool directly impacts generalizability through its influence on patient selection.
Discussion and Future Directions
The comparative analysis reveals fundamental tensions between the scientific rigor of randomized trials and their applicability to diverse real-world populations. The growing dominance of industry-sponsored research, while accelerating drug development, may inadvertently exacerbate generalizability challenges through restrictive eligibility criteria and underrepresentation of prognosticly diverse populations [75] [8]. The machine learning approaches described offer promising pathways to bridge this translation gap by enabling more nuanced understanding of which patient subgroups are likely to benefit from novel therapies.
Future research should focus on standardizing generalizability assessment methodologies and incorporating them earlier in trial design processes. Regulatory agencies increasingly recognize these challenges, with recent FDA guidance emphasizing the need for enhanced diversity in clinical trial populations [77]. The integration of real-world evidence as complementary data to support regulatory decisions and treatment guidelines represents a promising development for improving patient care [74].
For the drug development professionals and researchers composing this article's audience, the evidence suggests that proactive attention to generalizability during trial design—rather than as a post-hoc consideration—will yield more applicable and meaningful results. This includes adopting more inclusive eligibility criteria, implementing intentional diversity plans, and utilizing innovative statistical approaches that better reflect the multidimensional nature of treatment benefit in heterogeneous real-world populations.
Strengths and Limitations in Data Quality, Monitoring, and Reporting Processes
Within cancer trials outcomes research, a fundamental distinction exists between studies sponsored by academic institutions and those driven by industry. These two paradigms operate with different primary objectives, funding mechanisms, and operational frameworks, leading to significant variations in how they ensure data quality, implement monitoring procedures, and approach results reporting [28]. Industry-sponsored trials (ISTs) are primarily designed to generate profit through new drug development, whereas academic clinical trials (ACTs) aim to understand disease mechanisms, promote evidence-based medicine, and improve public health [28]. This comparative guide objectively analyzes the performance of these two approaches, examining their respective strengths and limitations across critical research domains to inform the practices of researchers, scientists, and drug development professionals.
Comparative Analysis of Operational Frameworks
Table 1: Resource Allocation and Infrastructure Comparison
| Aspect | Academic Clinical Trials (ACTs) | Industry-Sponsored Trials (ISTs) |
|---|---|---|
| Financial Resources | Frequently face financial constraints; severely restricted resources [21] | Substantial financial backing from pharmaceutical/biotechnology companies [21] |
| Personnel Resources | Insufficient personnel resources (reported by 60% of academic research institutions) [21] | Better staffed; fewer resource limitations [21] |
| Personnel Expertise | Lack of knowledge/experience (reported by 35% of ARIs) [21] | Greater specialized expertise (lack of knowledge/experience reported by only 11%) [21] |
| Institutional Support | Academic Research Institutions (ARIs) provide crucial support but face limitations [21] | Dedicated, professional trial management teams with standardized processes [28] |
Data Quality and Monitoring Procedures
Table 2: Data Quality Management and Monitoring Practices
| Data Quality Dimension | Academic Clinical Trials | Industry-Sponsored Trials |
|---|---|---|
| Overall Data Quality Approach | Implements ad hoc methods pragmatically [79] | Substantially superior in preparing, organizing and monitoring studies [28] |
| Standardization | Non-standardized procedures across sites [79] | High standardization following strict industry standards [80] |
| Data Management Plans | Only 50% of trials have formal data management plans [79] | Comprehensive data management systems standard |
| Error Acceptance Levels | Varied and inconsistently applied (when used, typically <5% to 10%) [79] | Strict, predefined thresholds with systematic monitoring |
| Monitoring Methods | Combination of centralized (65%) and onsite monitoring [79] | Risk-based monitoring approaches complemented by technology [80] |
| Training Investment | Approximately 11.58 hours per person annually [79] | Typically more extensive and standardized training programs |
Experimental Protocols and Methodologies
Data Quality Monitoring Protocols
The updated ICH GCP E6(R2) guideline encourages clinical trials to incorporate risk-based monitoring approaches supported by information technology [80]. Industry-sponsored trials typically implement comprehensive monitoring protocols that include:
Centralized Monitoring Procedures: Industry trials utilize statistical monitoring to identify data anomalies and site performance issues [79]. This involves centralized data review to detect systematic errors, unusual data patterns, and protocol deviations across multiple sites.
Risk-Based Monitoring Approaches: Instead of 100% source data verification, industry trials employ targeted monitoring focused on critical data points and processes [80]. This method allocates monitoring resources based on risk assessment, prioritizing high-risk areas while maintaining data integrity.
Electronic Data Capture Systems: Industry standards include implementing specialized clinical trial software for real-time data checking, quicker identification of missing data, and automated validation checks [80]. These systems facilitate remote monitoring and enhance data quality control.
Academic trials often face challenges in implementing these comprehensive protocols due to financial constraints, resulting in more variable data quality management approaches tailored to their specific situation and study context [80].
Patient-Reported Outcome (PRO) Assessment Protocols
Table 3: PRO Data Collection Methodologies in Cancer Trials
| Protocol Component | Academic Trial Approaches | Industry Trial Approaches |
|---|---|---|
| Mode of Assessment (MOA) | Variable implementation of electronic PRO data capture; often limited by funding [13] | More consistent implementation of ePRO as recommended by regulatory bodies [13] |
| PRO Endpoint Integration | Often face challenges in conforming to CONSORT-PRO and SPIRIT-PRO reporting guidelines [13] | Better adherence to reporting guidelines but potential for selective reporting [81] |
| Respondent Burden Management | May struggle with comprehensive burden mitigation due to resource limitations [82] | Systematic approaches to reduce burden through optimized measure selection and delivery [82] |
| Clinical Alert Systems | Limited implementation of PRO-based alerts during trials for clinical care support [13] | More advanced systems for real-time PRO monitoring and intervention |
| Missing Data Management | Higher risk of preventable missing PRO data (ranging from 17% to 41% in some trials) [82] | More robust systems to minimize missing data through dedicated monitoring |
Visualization of Systematic Differences and Collaborative Opportunities
This diagram illustrates the systematic differences between academic and industry-sponsored cancer trials and their complementary strengths. Academic trials contribute expertise in study design and disease mechanism understanding, while industry trials provide superior monitoring processes and adequate funding [28]. The collaborative pathway demonstrates how combining these strengths can address respective limitations and enhance overall research quality.
The Scientist's Toolkit: Essential Research Reagents and Solutions
Table 4: Key Research Reagent Solutions for Cancer Trials Research
| Tool Category | Specific Solution | Function & Application |
|---|---|---|
| Data Quality Management | Electronic Data Capture (EDC) Systems | Enables real-time data validation, automated checks, and remote monitoring to ensure data integrity [80] |
| PRO Assessment | ePRO Data Capture Platforms | Facilitates electronic collection of patient-reported outcomes with improved data quality and compliance monitoring [13] |
| Protocol Development | SPIRIT-PRO Guidelines | Provides structured framework for including patient-reported outcomes in clinical trial protocols [13] |
| Reporting Standards | CONSORT-PRO Extension | Ensures complete and transparent reporting of patient-reported outcomes in trial publications [13] |
| Risk Assessment | Risk-Based Monitoring Frameworks | Allows targeted monitoring resources to critical data points and processes based on risk assessment [80] |
| Data Validation | Source Data Verification (SDV) Tools | Supports verification of clinical trial data against original source documents, though increasingly supplemented with centralized monitoring [79] |
The comparison between academic and industry-sponsored cancer trials reveals a complex landscape where neither approach holds universal superiority. Industry-sponsored trials demonstrate significant advantages in data quality management, monitoring efficiency, and financial resources, leading to more standardized and well-controlled research processes [28] [21]. Academic trials, while often constrained by limited funding and personnel resources, contribute essential expertise in study design and disease mechanism investigation [28]. The evolving landscape of cancer research increasingly favors constructive partnerships that leverage the complementary strengths of both sectors [28]. Such collaborations enable academics to guide industry in study design and investigator site selection while benefiting from industry's expertise in optimizing monitoring and reporting processes [28]. This synergistic approach ultimately enhances the quality, relevance, and impact of cancer trials outcomes research, bridging the gap between scientific discovery and clinical application to better serve patient needs and advance public health.
The landscape of cancer clinical research is predominantly shaped by two distinct yet interconnected forces: academia-driven investigations and industry-sponsored trials. While both share the ultimate goal of advancing patient care, their approaches to disseminating research outcomes differ significantly in timing, transparency, and underlying motivators. These differences have profound implications for scientific discourse, clinical practice, and market dynamics. Academia often prioritizes scientific knowledge dissemination through peer-reviewed publications, whereas industry must balance commercial interests with regulatory requirements for transparency. This guide objectively compares the publication and dissemination practices between these two sectors, providing a structured analysis of their respective workflows, outcomes, and impacts on the oncology research ecosystem. Understanding these distinctions is crucial for researchers, clinicians, and drug development professionals who must navigate the evidence generated from both sectors to inform their work.
Comparative Analysis of Academic vs. Industry Trial Characteristics
The fundamental differences between academic and industry-sponsored trials extend beyond their funding sources to encompass their core objectives, operational challenges, and financial structures. Academic Clinical Trials (ACTs) are typically investigator-initiated studies planned and managed within academic institutions, often led by physician-researchers who also assume the sponsor role according to ICH GCP guidelines [21]. These trials are primarily funded through grants, institutional resources, and public funds, necessitating substantial time and effort from researchers. In contrast, Industry-Sponsored Trials (ISTs) are financed by pharmaceutical or biotechnology companies, which assume overall responsibility for the trial without direct involvement in its conduct, and typically prioritize commercial interests aimed at developing and gaining regulatory approval for medical treatments [21].
The table below summarizes the key distinguishing characteristics between these two trial types:
Table 1: Fundamental Characteristics of Academic vs. Industry-Sponsored Trials
| Characteristic | Academic Clinical Trials (ACTs) | Industry-Sponsored Trials (ISTs) |
|---|---|---|
| Primary Objectives | Address scientific questions, explore novel mechanisms, establish proof-of-concept | Demonstrate safety/efficacy for regulatory approval, support commercial positioning |
| Funding Sources | Public grants, institutional funds, philanthropy | Corporate R&D budgets |
| Common Design Features | Smaller scale, biomarker-rich, specific subpopulations | Large sample sizes, often multicenter multinational |
| Operational Challenges | Insufficient personnel resources, recruitment problems, lack of knowledge/experience [21] | Complex logistics, multinational regulatory compliance |
| Financial Constraints | Frequently face significant budget limitations [21] | Substantial resources but with stringent budget controls |
A global survey of Academic Research Institutions (ARIs) revealed significant disparities in operational challenges, with academic trials facing greater difficulties in communication with institutional review boards/ethics committees and competent authorities compared to industry-sponsored trials [21]. Additionally, academic trials were found to have significantly less financial support during their conduct, with specific challenges including 'insufficient personnel resources' (60% vs. 50%), 'recruitment problems' (60% vs. 78%), and 'lack of knowledge/experience' (35% vs. 11%) when compared to industry-sponsored trials [21].
Dissemination Workflows and Timing
The processes and timelines for disseminating research findings differ markedly between academic and industry sponsors, reflecting their distinct primary objectives and accountability structures. These dissemination pathways influence how quickly scientific findings reach the research community, clinical practitioners, and patients.
Industry Dissemination Pathways
Industry-sponsored trials employ a multi-stage dissemination approach that often begins with strategic communications to stakeholders before formal scientific publication. The typical sequence involves: (1) Press releases announcing positive topline results; (2) Presentation at major scientific conferences; (3) Peer-reviewed journal publication; and (4) Regulatory document submissions supporting product labeling [2].
An analysis of 157 oncology press releases published between 2018-2022 revealed that most (74.5%) announced that the study met its primary endpoint, but only 13% included specific results, while the remaining 87% contained only generic statements [2]. The median time from press release to meeting presentation was 3.1 months, and to full paper publication was 8 months [2]. After a median follow-up of 48 months, 79% of these trials were approved by FDA and 74% by EMA, with median time from press release to approval being 10 months for FDA and 15.9 months for EMA [2].
Academic Dissemination Pathways
Academic dissemination typically follows a more traditional scientific publication pathway, prioritizing peer-reviewed journals as the primary output. The sequence generally involves: (1) Preprint posting (increasingly common); (2) Conference presentations; (3) Peer-reviewed journal publication; and (4) Data sharing through repositories. Academic institutions generally lack the coordinated communication infrastructure that industry utilizes for press releases and investor communications, potentially limiting the reach of their findings to broader audiences.
The following diagram illustrates the key dissemination pathways for both trial types:
Transparency and Reporting Practices
Transparency in clinical research encompasses trial registration, results reporting, data sharing, and protocol publication. Significant differences exist between academic and industry approaches to these elements, though both sectors face challenges in achieving optimal transparency.
Trial Registration and Results Reporting
Trial registration in publicly accessible registries is a fundamental requirement for both academic and industry trials, serving to prevent selective publication, avoid duplication, and inform patients about potential participation opportunities [83]. However, compliance with results reporting varies significantly between sectors.
An analysis of the Clinical Trial Registry-India (CTRI) found that 98% of registered phase IV trials did not have results or publications available [83]. Another study revealed that only 14% of completed interventional studies reported results on the CTRI website, with significantly less reporting of pharmaceutical company-sponsored studies compared to the ClinicalTrials.gov registry [83]. Industry sponsors face regulatory mandates in many jurisdictions requiring results submission within one year of trial completion, while academic trials often lack similar enforcement mechanisms.
Data Sharing Practices
Data sharing represents a more advanced form of research transparency, allowing secondary analyses and validation of published findings. Industry sponsors have developed structured approaches to data sharing, often through independent third parties. For example, Johnson & Johnson has an agreement with the Yale Open Data Access (YODA) Project to serve as an independent review panel for evaluating requests for Clinical Study Reports (CSRs) and participant-level data from investigators and physicians for scientific research [84].
Academic institutions typically lack standardized data-sharing frameworks, often relying on individual investigator initiatives or journal mandates. While many researchers support data sharing in principle, practical constraints including limited resources, privacy concerns, and lack of incentives often impede implementation.
Reporting Guideline Implementation
The CONSORT (Consolidated Standards of Reporting Trials) and SPIRIT (Standard Protocol Items: Recommendations for Interventional Trials) statements provide structured guidance for transparent trial reporting and protocols [85]. The 2025 updates to these guidelines include new sections on open science that clarify trial registration, statistical analysis plan availability, and data sharing, as well as funding sources and conflicts of interest [85].
Adherence to these guidelines improves reporting completeness for both academic and industry trials, though implementation challenges persist. Medical journals increasingly require submission of completed checklist documents for clinical trials, with expectations that primary reports and protocols contain the requested information in full [85].
Market Impact and Economic Considerations
The dissemination of clinical trial results generates distinct economic impacts and market reactions for industry-sponsored versus academically-driven research, reflecting their different stakeholder constituencies and value propositions.
Market Reactions to Trial Results
Industry-sponsored trials directly influence company valuations and investment decisions, particularly when results impact regulatory approvals or commercial potential. However, an analysis of 157 oncology press releases found that most events showed no statistically significant market reactions, with abnormal returns generally neutral or slightly positive [2]. This suggests that markets may absorb preliminary announcements with minimal stock price adjustments, potentially awaiting more detailed data through scientific presentations or publications.
Academic trial results typically lack this direct market impact, instead influencing scientific reputation, grant funding opportunities, and clinical guideline development. The economic value of academic research often manifests through knowledge advancement rather than immediate commercial applications.
Economic Benefits of Sponsored Trials
Sponsored clinical trials generate significant economic benefits for healthcare systems, particularly in low- and middle-income countries. An analysis from Colombia estimated that sponsored clinical trials could produce substantial cost savings by covering treatment expenses for cancer patients [86]. With 20% patient participation in sponsored trials, the projected annual cost savings would reach USD 48,830,310, and up to USD 1.22 billion over 5 years with 100% inclusion [86]. These savings alleviate financial pressures on healthcare systems while ensuring timely access to innovative cancer treatments.
Table 2: Economic Impact of Industry-Sponsored Cancer Trials in Colombia
| Parameter | Value | Context |
|---|---|---|
| Total eligible patients | 7,703 patients | Patients with specific cancer types eligible for phase 3 trials [86] |
| Associated healthcare cost | USD 244,151,552 | Cost if borne by healthcare system [86] |
| Annual savings (20% enrollment) | USD 48,830,310 | Sponsor covers treatment costs [86] |
| 5-year savings (20% enrollment) | USD 244 million | Projected cumulative impact [86] |
| 5-year savings (100% enrollment) | USD 1.22 billion | Maximum potential impact [86] |
| Highest cost cancer type | Advanced prostate cancer | Due to high prevalence and inclusion potential [86] |
Beyond direct cost savings, trial participation provides therapeutic benefits to patients. Analyses of cancer registry data have shown a 26% reduction in the risk of death among patients who participated in clinical trials [86]. Similarly, examination of Southwestern Oncology Group (SWOG) trials found a hazard ratio of 0.74 for 2-year overall survival compared with patients in the SEER cancer registry who had a poor prognosis [86].
Methodological Approaches for Comparing Trial Outcomes
Comparing the efficacy of cancer treatments across different trials requires sophisticated methodological approaches, particularly when direct head-to-head evidence is unavailable. Several statistical techniques have been developed to enable indirect comparisons between interventions.
Indirect Comparison Methods
When head-to-head clinical trials are unavailable, researchers employ various indirect comparison methods to evaluate relative treatment effects:
Naïve direct comparisons directly contrast results from separate trials without adjustment for differences in trial designs or populations. This approach is generally inappropriate as it breaks the original randomization and introduces significant confounding and bias [87].
Adjusted indirect comparisons use a common comparator to link two interventions that have not been directly compared. This method preserves the randomization of the originally assigned patient groups by comparing the magnitude of treatment effect between two treatments relative to a common comparator [87].
Multiple adjusted indirect comparisons extend this approach through series of connections when no single common comparator exists, using multiple comparators to link interventions of interest [87].
Mixed treatment comparisons (MTCs) incorporate all available data for a drug, including data not relevant to the comparator drug, using Bayesian statistical models. This approach reduces uncertainty but has not yet been widely accepted by researchers or regulatory authorities [87].
The diagram below illustrates the logical relationships between these comparison methodologies:
The Scientist's Toolkit: Key Research Reagents and Materials
Conducting and analyzing cancer clinical trials requires specific methodological tools and approaches. The table below details essential components of the clinical trial methodology toolkit:
Table 3: Research Reagent Solutions for Clinical Trial Design and Analysis
| Tool/Resource | Function | Application Context |
|---|---|---|
| CONSORT Checklist | Provides structured reporting framework for randomized trials | Ensures transparent and complete reporting of trial results [85] |
| SPIRIT Guidelines | Defines essential protocol items for clinical trials | Facilitates comprehensive trial protocol development [85] |
| Clinical Trial Registries | Public databases for prospective trial registration | Prevents selective publication; informs patients and researchers [83] |
| Adjusted Indirect Comparison Methods | Statistical techniques for comparing interventions without head-to-head trials | Enables relative efficacy assessments when direct evidence is lacking [87] |
| Budget Impact Analysis (BIA) Framework | Methodology for assessing economic impact of interventions | Quantifies healthcare system savings from trial participation [86] |
The publication and dissemination practices of academic and industry-driven cancer trials reflect their distinct primary objectives, resource constraints, and accountability structures. Industry sponsors demonstrate more coordinated dissemination pathways with earlier communication of results through press releases, but often provide limited data in initial announcements. Academic investigators typically prioritize traditional scientific publication but face greater operational challenges and more limited resources for dissemination activities. Both sectors continue to face challenges in achieving optimal transparency, particularly in results reporting and data sharing. Understanding these differences enables research consumers to better contextualize evidence from both sectors. As the clinical trial landscape evolves, increased attention to standardized reporting, data sharing, and robust methodology for cross-trial comparisons will enhance the utility of evidence generated by both academic and industry stakeholders for advancing cancer care.
Conclusion
The comparative analysis of academic and industry-driven cancer trials reveals a landscape of complementary strengths and weaknesses. Academic trials, though often challenged by financial and operational constraints, are crucial for addressing scientific questions and understanding disease mechanisms. Industry trials excel in operational execution and resource allocation but may face limitations in generalizability. The future of efficient oncology drug development lies in fostering strategic, constructive partnerships that leverage the methodological rigor of academia with the operational excellence of industry. Such collaborations, guided by shared databases and unified standards, can accelerate the translation of discoveries from lab to clinic, ultimately ensuring that clinical trial results are both statistically robust and broadly applicable to diverse patient populations. Embracing innovative trial designs and machine learning frameworks will be key to enhancing the real-world impact of cancer research.
References
- 1. From Lab to Clinic: Effect of Academia–Industry ... [https://pmc.ncbi.nlm.nih.gov/articles/PMC11730079/]
- 2. Press releases of industry-sponsored clinical trials in ... [https://www.sciencedirect.com/science/article/pii/S2213538325000311]
- 3. Industry Clinical Trials Proceed Faster Than Academic ... [https://www.clinicalleader.com/doc/industry-clinical-trials-proceed-faster-than-academic-trials-study-finds-0001]
- 4. What's on the industry's horizon? [https://www.cancerresearchhorizons.com/news-and-events/our-articles/whats-on-the-industrys-horizon]
- 5. The biggest challenges clinical trials will face in 2025 [https://www.clinicaltrialsarena.com/features/clinical-trials-challenges-expect-2025/]
- 6. Project SignifiCanT: Statistics in Cancer Trials [https://www.fda.gov/about-fda/oncology-center-excellence/project-significant-statistics-cancer-trials]
- 7. ACCC Community Oncology Research Institute (ACORI) [https://www.accc-cancer.org/home/learn/community-oncology-research/accc-community-oncology-research-institute]
- 8. Clinical cancer research in the U.S. increasingly dominated ... [https://www.fredhutch.org/en/news/releases/2024/09/clinical-cancer-research-in-the-u-s--is-increasingly-dominated-b.html]
- 9. Cancer Clinical Research Sees Shift Toward Industry ... [https://www.appliedclinicaltrialsonline.com/view/cancer-clinical-research-industry-sponsored-trials]
- 10. Industry sponsorship and research outcome - PMC [https://pmc.ncbi.nlm.nih.gov/articles/PMC8132492/]
- 11. Treatment Success in Cancer: Industry Compared to Publicly ... [https://journals.plos.org/plosone/article?id=10.1371/journal.pone.0058711]
- 12. ASCO 2025 Insights: Oncology Clinical Trends You Need ... [https://tfscro.com/resources/asco-2025-recap-oncology-clinical-trial-trends-cros-and-sponsors-need-to-know/]
- 13. Data collection methods for patient-reported outcome ... [https://pmc.ncbi.nlm.nih.gov/articles/PMC11409248/]
- 14. A systematic review of the quality of statistical methods ... [https://www.sciencedirect.com/science/article/pii/S0959804917310766]
- 15. Real-world evidence for regulatory decision-making: updated guidance... [https://pmc.ncbi.nlm.nih.gov/articles/PMC10643567/]
- 16. International clinical trials setting for rare cancers ... - ecancer [https://ecancer.org/en/journal/article/321-international-clinical-trials-setting-for-rare-cancers-organisational-and-regulatory-constraints-the-eortc-perspective]
- 17. Barriers to Clinical Trial Implementation Among ... [https://pmc.ncbi.nlm.nih.gov/articles/PMC11059033/]
- 18. Overcoming Operational Challenges in Oncology ... [https://www.appliedclinicaltrialsonline.com/view/overcoming-operational-challenges-oncology-clinical-trials-lessons-multicentric-study-india]
- 19. 4 Unique Challenges of Oncology Trials [https://www.advarra.com/blog/4-unique-challenges-of-oncology-trials/]
- 20. &D trends and breakthrough innovations • Inpart Oncology R [https://www.inpart.io/insights/oncology-rd-trends-and-breakthrough-innovations]
- 21. Academic vs. industry-sponsored trials: A global survey on ... [https://pmc.ncbi.nlm.nih.gov/articles/PMC11583285/]
- 22. The CRI Anna-Maria Kellen Clinical Accelerator | CRI [https://www.cancerresearch.org/clinical-accelerator]
- 23. AACR 2025: translating research into real-world impact [https://www.drugtargetreview.com/article/160554/aacr-2025-translating-research-into-real-world-impact/]
- 24. Understanding Superiority, Noninferiority, and Equivalence ... [https://pmc.ncbi.nlm.nih.gov/articles/PMC7734976/]
- 25. Trial Designs—Non-inferiority vs. Superiority vs. Equivalence [https://www.certara.com/blog/trial-designs-non-inferiority-vs-superiority-vs-equivalence/]
- 26. Comparisons of Superiority, Non-inferiority, and ... [https://pmc.ncbi.nlm.nih.gov/articles/PMC5925592/]
- 27. Comparator Selection - NCBI - NIH [https://www.ncbi.nlm.nih.gov/books/NBK126184/]
- 28. Review Strengths and limitations of industry vs. academic ... [https://www.sciencedirect.com/science/article/pii/S1198743X1500720X]
- 29. Statistical power & sample size- Principles [https://influentialpoints.com/Training/statistical_power_and_sample_size-principles-properties-assumptions.htm]
- 30. Statistical Power and Why It Matters | A Simple Introduction [https://www.scribbr.com/statistics/statistical-power/]
- 31. Sample size, power and effect size revisited: simplified and ... [https://pmc.ncbi.nlm.nih.gov/articles/PMC7745163/]
- 32. Sample Size Calculation: Power, Errors & Clinical Trials [https://intuitionlabs.ai/articles/sample-size-calculation-clinical-trials]
- 33. Introduction to Power Analysis - OARC Stats [https://stats.oarc.ucla.edu/other/mult-pkg/seminars/intro-power/]
- 34. Statistical Power Analysis [https://www.statisticssolutions.com/dissertation-resources/sample-size-calculation-and-sample-size-justification/statistical-power-analysis/]
- 35. When is enough, enough? Understanding and solving your ... [https://bmcresnotes.biomedcentral.com/articles/10.1186/s13104-016-1893-x]
- 36. Best (but oft forgotten) practices: sample size planning for ... [https://www.sciencedirect.com/science/article/pii/S0002916522011777]
- 37. Top 10 AI Frameworks to Learn in 2025 | by Lilly Gracia [https://lillygracia.medium.com/top-10-ai-frameworks-to-learn-in-2025-facd2960e9b5]
- 38. Top 5 Machine Learning Frameworks for 2025 [https://codex.team/blog/top-5-machine-learning-frameworks-every-data-scientist-should-know-in-2025]
- 39. Top 15+ Machine Learning Frameworks in 2025 [https://www.octalsoftware.com/blog/machine-learning-frameworks]
- 40. Top 10 Machine Learning Frameworks to Use In 2025 [https://www.igmguru.com/blog/machine-learning-frameworks]
- 41. Machine Learning Trends 2025: What Every ML Engineer ... [https://devbysatyam.medium.com/machine-learning-trends-2025-what-every-ml-engineer-should-know-70159c5a3b29?source=rss------artificial_intelligence-5]
- 42. Machine Learning Statistics 2025: Market Size, Adoption, ... [https://sqmagazine.co.uk/machine-learning-statistics/]
- 43. progress and prospects of patient-reported outcomes in ... [https://pmc.ncbi.nlm.nih.gov/articles/PMC12414431/]
- 44. JMIR Cancer - Leveraging Patient - Reported Measures for... Outcome [https://cancer.jmir.org/2025/1/e64611]
- 45. SISAQOL-IMI Consortium Publishes Key Paper And... - EORTC [https://www.eortc.org/blog/2025/11/25/sisaqol-imi-consortium-publishes-key-paper-and-launches-online-materials/]
- 46. - Patient Predict Reported Survival Outcomes Cancer [https://www.medscape.com/viewarticle/patient-reported-outcomes-predict-cancer-survival-2025a1000oad]
- 47. - Patient in oncology reported need shared standard outcomes trials [https://dailyreporter.esmo.org/esmo-targeted-anticancer-therapies-asia-congress-2025/news/patient-reported-outcomes-in-dose-finding-show-value-in-oncology-trial-inclusion-but-shared-standards-are-needed]
- 48. Barriers for cancer clinical trial enrollment: A qualitative study ... [https://pmc.ncbi.nlm.nih.gov/articles/PMC9189774/]
- 49. Clinical studies: the challenge of patient recruitment [https://servier.com/en/newsroom/clinical-studies-patient-recruitment/]
- 50. A Qualitative Study of the Perspectives of Clinical Trial ... [https://pmc.ncbi.nlm.nih.gov/articles/PMC11537200/]
- 51. Rethinking Oncology Trials With a Statistical Methodology ... [https://www.appliedclinicaltrialsonline.com/view/rethinking-oncology-trials-statistical-methodology-patients-first]
- 52. Overcoming Obstacles to Clinical Trial Recruitment and ... [https://www.cancernetwork.com/view/overcoming-obstacles-to-clinical-trial-recruitment-and-retention]
- 53. . Academic -sponsored vs : A global survey on... industry trials [https://pubmed.ncbi.nlm.nih.gov/39575754/]
- 54. Reducing Administrative Burdens: The U.S. Federal ... [https://responsivegov.org/research/reducing-administrative-burdens-the-u-s-federal-government-framework/]
- 55. Comparison of clinical outcomes among cancer patients ... [https://pmc.ncbi.nlm.nih.gov/articles/PMC10463452/]
- 56. of clinical Comparison among outcomes patients treated in... cancer [https://bmccancer.biomedcentral.com/articles/10.1186/s12885-023-11305-3]
- 57. Applications and challenges of biomarker-based predictive ... [https://pmc.ncbi.nlm.nih.gov/articles/PMC12399543/]
- 58. An analysis of FDA drug approvals for oncological ... [https://pmc.ncbi.nlm.nih.gov/articles/PMC12507643/]
- 59. Companion Diagnostics Trends in Precision Medicine [https://www.leicabiosystems.com/us/educational-resources/articles/companion-diagnostics-precision-medicine-depth-review-and-future-trends/]
- 60. Challenges and Future Trends in Biomarker Analysis for ... [https://blog.crownbio.com/challenges-and-future-trends-in-biomarker-analysis-for-clinical-research-whats-ahead-in-2025]
- 61. Beyond ELISA: the future of biomarker validation [https://www.drugtargetreview.com/article/154316/beyond-elisa-the-future-of-biomarker-validation/]
- 62. Companion Diagnostics Market Forecast Report 2025-2034 [https://finance.yahoo.com/news/companion-diagnostics-market-forecast-report-080300195.html]
- 63. Companion Diagnostics Market Outlook 2025-2032 [https://www.intelmarketresearch.com/Companion-Diagnostics-Market%20-2790]
- 64. Regulatory Flexibilities for Rare Cancer Biomarker ... [https://friendsofcancerresearch.org/news/new-analysis-describes-flexibility-associated-with-companion-diagnostic-development-for-rare-cancer-biomarkers/]
- 65. Top Oncology Innovations That Shaped the First Half of 2025 [https://binaytara.org/cancernews/article/top-oncology-innovations-that-shaped-the-first-half-of-2025]
- 66. Experts Forecast Cancer Research and Treatment ... [https://www.aacr.org/blog/2025/01/10/experts-forecast-cancer-research-and-treatment-advances-in-2025/]
- 67. Overcoming barriers to cross-sector collaboration in ... [https://www.sciencedirect.com/science/article/abs/pii/S1366554521003392]
- 68. Cross-Functional Collaboration: Overcoming the Barriers to ... [https://www.innovativehumancapital.com/article/cross-functional-collaboration-overcoming-the-barriers-to-success]
- 69. Additional Noteworthy Studies to be Presented During ... [https://www.asco.org/about-asco/press-center/news-releases/additional-noteworthy-studies-2025-asco-annual-meeting]
- 70. Biopharma RD Faces Productivity And Attrition Challenges ... [https://www.clinicalleader.com/doc/biopharma-r-d-faces-productivity-and-attrition-challenges-in-2025-0001]
- 71. From Lab to Clinic: Effect of Academia-Industry ... [https://pubmed.ncbi.nlm.nih.gov/39807955/]
- 72. From Lab to Clinic: Effect of Academia–Industry ... [https://doaj.org/article/53f9c191f0f240cc9dffd65462374d96]
- 73. Key oncology trends to watch in 2025 [https://www.labiotech.eu/in-depth/oncology-trends-2025/]
- 74. A Narrative Review of the Strengths and Limitations of Real ... [https://pmc.ncbi.nlm.nih.gov/articles/PMC12651554/]
- 75. Evaluating generalizability of oncology trial results to real- ... [https://www.nature.com/articles/s41591-024-03352-5]
- 76. New AI platform identifies which patients are likely to ... [https://winshipcancer.emory.edu/newsroom/articles/2025/new-ai-platform-identifies-which-patients-are-likely-to-benefit-most-from-a-clinical-trial.php]
- 77. How to Measure the Generalizability of Clinical Trials [https://esmed.org/MRA/mra/article/view/6896]
- 78. ECOG Performance Status Scale [https://ecog-acrin.org/resources/ecog-performance-status/]
- 79. Exploring Data Quality Management within Clinical Trials - PMC [https://pmc.ncbi.nlm.nih.gov/articles/PMC5801732/]
- 80. Clinical researchers' lived experiences with data quality ... [https://bmcmedresmethodol.biomedcentral.com/articles/10.1186/s12874-021-01385-9]
- 81. Has the quality of health-related quality of life reporting in ... [https://www.sciencedirect.com/science/article/pii/S0923753419378809]
- 82. Key considerations to reduce or address respondent ... [https://www.nature.com/articles/s41467-022-33826-4]
- 83. Clinical trial transparency and trust: Bridging the gap ... [https://pmc.ncbi.nlm.nih.gov/articles/PMC12288915/]
- 84. Clinical trial data transparency [https://www.jnj.com/innovativemedicine/our-innovation/clinical-trials/transparency]
- 85. Improving transparency in clinical trial reporting - PMC [https://pmc.ncbi.nlm.nih.gov/articles/PMC12037211/]
- 86. Economic Benefits of Sponsored Clinical Trials in Cancer ... [https://pmc.ncbi.nlm.nih.gov/articles/PMC12311479/]
- 87. Overview of methods for comparing the efficacies of drugs ... [https://pmc.ncbi.nlm.nih.gov/articles/PMC3895352/]