Advanced Exosome Isolation Techniques: Enhancing Purity and Yield for Next-Generation Diagnostics
This article provides a comprehensive analysis of recent advancements and methodologies in exosome isolation, tailored for researchers and drug development professionals.
Advanced Exosome Isolation Techniques: Enhancing Purity and Yield for Next-Generation Diagnostics
Abstract
This article provides a comprehensive analysis of recent advancements and methodologies in exosome isolation, tailored for researchers and drug development professionals. It explores the fundamental role of exosomes as non-invasive biomarkers in diseases like cancer and neurodegenerative disorders. The scope ranges from foundational concepts of exosome biogenesis and function to a detailed comparison of established and emerging isolation techniques, including ultracentrifugation, size-exclusion chromatography, precipitation, and microfluidics. It addresses critical challenges in purity, yield, and standardization, offering practical troubleshooting and optimization strategies. Furthermore, it outlines rigorous validation frameworks and comparative analyses of isolation methods to guide protocol selection for specific diagnostic applications, ultimately aiming to bridge the gap between laboratory research and clinical translation.
Exosomes 101: Understanding Their Biogenesis, Cargo, and Role as Non-Invasive Biomarkers
Frequently Asked Questions
What is the fundamental definition of an exosome? Exosomes are defined as small extracellular vesicles (EVs) with a size range of approximately 30 to 150 nanometers that are formed inside cells within specialized compartments called multivesicular bodies (MVBs). They are released into the extracellular space when these MVBs fuse with the plasma membrane [1] [2] [3].
My exosome isolation has low yield. What could be going wrong? Low yield can stem from several points in the workflow:
- Incomplete Cell Removal: If initial low-speed centrifugation steps (e.g., 300 × g for cells, 2,000 × g for debris) are skipped or too short, cells and large debris remain, contaminating the preparation and reducing effective exosome recovery [4].
- Inefficient Pelletting: The high-speed ultracentrifugation step (100,000-150,000 × g) may be insufficient in time or force, failing to pellet all exosomes. Ensure centrifugation parameters are optimized for your specific rotor and sample volume [4] [5].
- Exosome Loss during Washing: The pellet wash step, while intended to increase purity, can lead to significant exosome loss if not handled carefully. If yield is critical, consider omitting the wash or using a size-exclusion chromatography (SEC) method, which is gentler and can minimize loss [4] [5].
How can I confirm that my isolated vesicles are exosomes and not other extracellular vesicles? Confirming exosome identity requires a multi-method approach, as no single marker is absolutely specific. The following table outlines the primary characteristics used for validation.
| Characteristic | Exosome Profile | Key Confirmation Methods |
|---|---|---|
| Size & Morphology | 30-150 nm, cup-shaped in traditional electron microscopy (due to drying) but spherical in solution [3]. | Nanoparticle Tracking Analysis (NTA), Dynamic Light Scattering (DLS), Transmission Electron Microscopy (TEM). |
| Specific Protein Markers | Enriched in tetraspanins (CD63, CD81, CD9), ESCRT-related proteins (Alix, TSG101), and heat shock proteins (Hsp70) [2] [3]. | Western Blot, Flow Cytometry (for larger vesicles), ELISA. |
| Absence of Contaminants | Should be negative for organelle-specific proteins like Calnexin (ER marker) or Cytochrome C (mitochondrial marker). Presence suggests cellular contamination [2]. | Western Blot. |
I see a lot of protein contamination in my exosome prep. How can I improve purity? Protein aggregates and lipoproteins are common contaminants. To enhance purity:
- Switch to Density Gradient Centrifugation: Instead of differential ultracentrifugation alone, use a sucrose or iodixanol density gradient. Exosomes typically float at a density of 1.10-1.19 g/mL, separating them from denser protein aggregates [4] [6] [5].
- Incorporate a Size-Based Step: Use Size-Exclusion Chromatography (SEC) either after ultracentrifugation or as a stand-alone method. SEC effectively separates exosomes from smaller, soluble proteins [4] [5].
- Optimize Washing: Resuspend the final exosome pellet and re-centrifuge at high speed. This can remove some soluble protein contaminants, though be mindful of potential exosome loss [4].
What are the major pathways for exosome biogenesis, and why does it matter? Understanding biogenesis is crucial because it determines exosome cargo and function, and provides targets for therapeutic intervention. The two major pathways and their key regulators are summarized below.
| Pathway | Key Machinery & Regulators | Function in Biogenesis |
|---|---|---|
| ESCRT-Dependent | ESCRT-0, -I, -II, -III complexes, VPS4, TSG101, Alix | The classic pathway for sorting ubiquitinated proteins and facilitating the inward budding of the endosomal membrane to form ILVs [1] [3]. |
| ESCRT-Independent | Tetraspanins (CD63, CD81), Ceramide, nSMase2 | Tetraspanin microdomains and ceramide (which induces membrane curvature) can drive ILV formation independently of ESCRT components [1] [2]. |
Experimental Protocols & Data
Comparison of Common Exosome Isolation Methods
| Method | Principle | Purity | Yield/Recovery | Key Advantages | Key Disadvantages |
|---|---|---|---|---|---|
| Differential Ultracentrifugation | Sequential centrifugation at increasing speeds to pellet particles based on size and density [4] [5]. | Medium | Low | Considered the "gold standard"; no additional reagents required; handles large volumes [4] [5]. | Time-consuming (can take 12+ hours); can damage exosomes; requires expensive equipment [4] [5]. |
| Density Gradient Centrifugation | Separates particles based on buoyant density in a medium like sucrose or iodixanol [4] [6]. | High | Low | High purity; effective separation from contaminants like proteins [6] [5]. | Very time-consuming; technically demanding; low yield [5]. |
| Size-Exclusion Chromatography (SEC) | Separates particles based on size as they pass through a porous gel matrix [4] [5]. | High | Relatively Low | Fast; simple; preserves exosome integrity and function; maintains biological activity [4] [5]. | Lower yield; cannot process large sample volumes; potential co-isolation of similar-sized particles (e.g., lipoproteins) [4] [5]. |
| Ultrafiltration | Uses membranes with specific pore sizes to concentrate and separate exosomes based on size [4] [5]. | Low | High | Fast; no specialized equipment beyond a centrifuge; good for concentrating samples [4] [5]. | Shear stress can damage exosomes; membranes clog easily; lower purity [4] [5]. |
| Precipitation | Uses polymers (e.g., PEG) to reduce exosome solubility, causing them to precipitate [4] [5]. | Low | Relatively High | Simple; user-friendly; commercial kits available; good for large volumes [4] [5]. | Co-precipitates contaminants (proteins, lipoproteins); polymers may interfere with downstream analysis [4] [5]. |
| Immunoaffinity Capture | Uses antibodies against exosome surface markers (e.g., CD63, CD81) to selectively capture exosomes [4] [5]. | High | Relatively Low | High specificity; can isolate subpopulations of exosomes [4] [5]. | Expensive; low yield; antibody binding may affect downstream analysis or functional studies [4] [5]. |
Standard Protocol: Exosome Isolation via Differential Ultracentrifugation This is a widely used method for isolating exosomes from cell culture media [4].
- Sample Pre-clearing:
- Centrifuge cell culture supernatant at 300 × g for 10 min to pellet cells.
- Transfer supernatant to a new tube and centrifuge at 2,000 × g for 20 min to remove dead cells and large debris.
- Transfer supernatant and centrifuge at 10,000 × g for 30-45 min to remove larger vesicles and organelles.
- Exosome Pelletting:
- Transfer the resulting supernatant to ultracentrifuge tubes.
- Centrifuge at 100,000-150,000 × g for 60-120 min to pellet exosomes.
- Washing & Resuspension:
- Discard the supernatant and gently resuspend the pellet in a large volume of sterile, cold PBS.
- Perform a second ultracentrifugation at the same speed for 60-120 min.
- Discard the supernatant and finally resuspend the pure exosome pellet in a small volume of PBS or your desired buffer.
- Aliquot and store at -80 °C.
The Scientist's Toolkit: Key Research Reagents
| Reagent/Molecule | Function in Exosome Research |
|---|---|
| GW4869 | A pharmacological inhibitor of neutral sphingomyelinase 2 (nSMase2), used to block the ceramide-dependent pathway of exosome biogenesis and study its functional consequences [1]. |
| CD63 / CD81 / CD9 Antibodies | Essential for immunoaffinity capture and detection of exosomes via techniques like flow cytometry, Western blot, and ELISA, as these tetraspanins are highly enriched on exosomes [2] [4]. |
| Alix & TSG101 Antibodies | Used as positive markers for Western blot analysis to confirm the endosomal origin of isolated exosomes, as they are components of the ESCRT machinery [2] [3]. |
| Polyethylene Glycol (PEG) | A polymer used in precipitation-based isolation kits to force exosomes out of solution, enabling their collection via low-speed centrifugation [4] [5]. |
| Sucrose/Iodixanol | Solutions used to create density gradients for high-purity separation of exosomes from other vesicular and non-vesicular contaminants [4] [6]. |
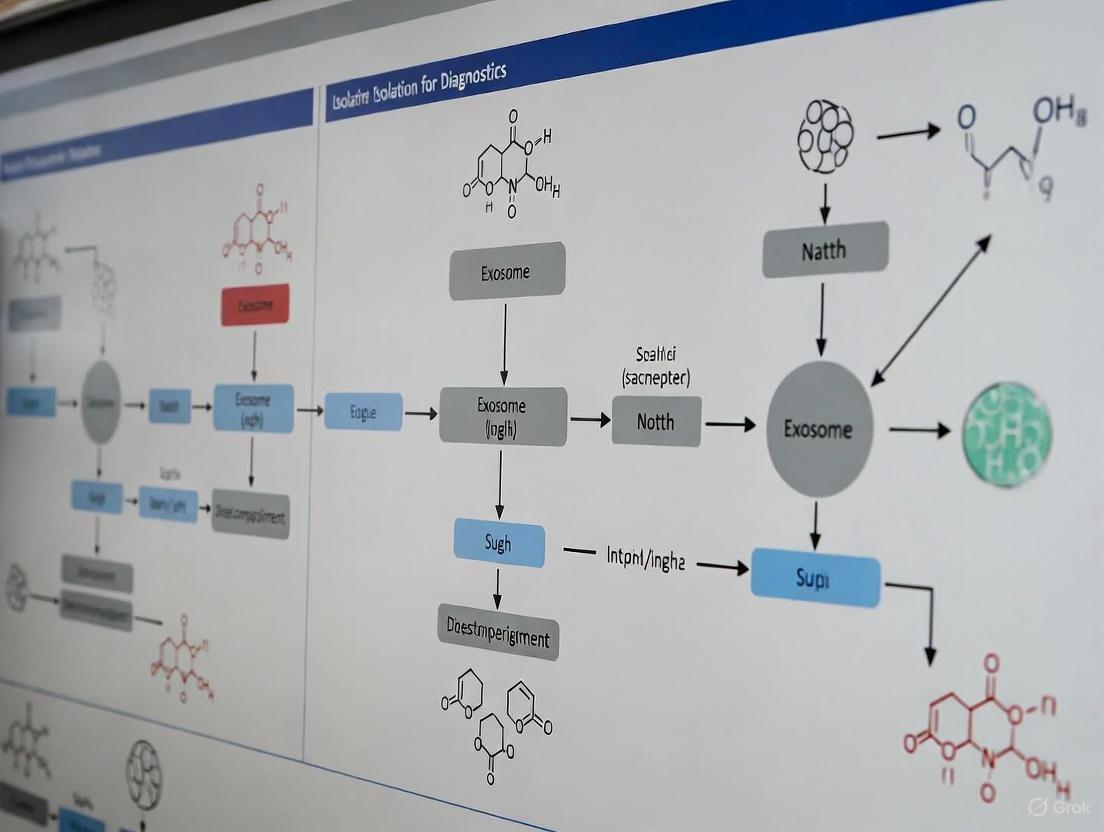
Pathways and Workflows
Exosome Biogenesis and Isolation Pathway This diagram illustrates the cellular journey of exosome biogenesis and the key steps involved in their subsequent isolation.
Exosome Biogenesis Decision Tree This flowchart outlines the key molecular decisions and pathways during the formation of intraluminal vesicles (ILVs) inside MVBs.
Core Concepts: The Diagnostic Molecules Within Exosomes
What are the key diagnostic molecules found in exosomal cargo, and why are they significant?
Exosomes are nano-sized extracellular vesicles (30-150 nm in diameter) secreted by virtually all cell types into bodily fluids like blood, urine, and saliva [7] [8]. They function as crucial intermediaries in intercellular communication by carrying a diverse cargo of bioactive molecules, which reflects the physiological state of their parent cells [9] [10]. This cargo includes proteins, nucleic acids (such as miRNA and DNA), and lipids [7]. The molecular profile of exosomes can change during pathological processes, such as cancer, making them promising, non-invasive biomarkers for disease diagnosis, prognosis, and monitoring treatment response [9] [8].
- Proteins: Exosomes carry a rich array of proteins, including transmembrane proteins (e.g., tetraspanins CD9, CD63, CD81), fusion proteins (e.g., Annexins, RAB GTPases), and cytosolic proteins. Tumor-derived exosomes often contain specific proteins relevant to cancer progression and diagnosis. For instance, in gastric cancer, exosomal proteins like HER2, PD-L1, and ITIH4 have been identified as potential diagnostic and prognostic biomarkers [9] [10].
- Nucleic Acids: Exosomes protect and transport various nucleic acids. MicroRNAs (miRNAs) are particularly abundant and can regulate gene expression in recipient cells. The presence of specific miRNAs, such as exosomal MT1-MMP mRNA in gastric cancer, has shown superior diagnostic value compared to traditional serum markers [9]. They also carry DNA, including mitochondrial DNA, which can offer genetic insights into the cell of origin [7].
- Lipids: The exosomal membrane is enriched in lipids like cholesterol, sphingomyelin, and phosphatidylserine. This lipid composition is not just structural; it plays a role in exosome formation, stability, and cellular uptake, and can also serve as a signature of specific diseases [8].
Table 1: Key Exosomal Cargo Molecules and Their Diagnostic Relevance
| Cargo Type | Example Molecules | Primary Function/Role | Diagnostic Significance |
|---|---|---|---|
| Proteins | Tetraspanins (CD9, CD63, CD81), HER2, PD-L1 | Cell adhesion, fusion, immune regulation, signal transduction | Biomarkers for cancer diagnosis (e.g., gastric cancer), monitoring immunotherapy response [9] [10] |
| Nucleic Acids | miRNA, mRNA, lncRNA, mitochondrial DNA | Gene regulation, intercellular genetic exchange | Non-invasive "liquid biopsy" for early cancer detection and tracking disease progression [9] [7] |
| Lipids | Cholesterol, Sphingomyelin, Phosphatidylserine | Membrane structure, stability, signaling | Potential disease biomarkers; crucial for exosome biogenesis and uptake [8] |
The Scientist's Toolkit: Isolation & Characterization Techniques
What are the standard methods for isolating and characterizing exosomes for diagnostic research?
The reliability of exosome-based diagnostics hinges on effective isolation and thorough characterization. The choice of isolation method involves a trade-off between yield, purity, and the specific requirements of downstream analysis [11] [8].
Table 2: Comparison of Common Exosome Isolation Techniques
| Isolation Method | Principle | Purity | Yield | Key Advantages | Key Limitations |
|---|---|---|---|---|---|
| Ultracentrifugation | Sequential centrifugation based on size/density | High | Medium | Considered the "gold standard"; cost-effective for consumables [11] [12] | Time-consuming; requires large sample volumes; potential for exosome damage [8] |
| Size-Exclusion Chromatography (SEC) | Separation by size using a porous matrix | Medium-High | Medium | Maintains exosome integrity and function; good reproducibility [11] [8] | Can be tedious; may have volume constraints; co-isolation of similarly sized contaminants [8] |
| Tangential Flow Filtration (TFF) | Size-based separation using tangential flow to avoid clogging | Medium | High | Excellent scalability; suitable for large volumes and clinical applications [11] [8] | May co-isolate non-vesicular particles of similar size [8] |
| Polymer-Based Precipitation | Precipitation using polymers like PEG | Low | High | Simple and fast protocol; cost-effective [11] [8] | Low purity due to co-precipitation of contaminants (e.g., proteins, lipoproteins) [8] |
| Immunoaffinity Capture | Antibody-based capture of specific surface markers | Very High | Low | High specificity; enables isolation of exosome subpopulations [11] [8] | Lower yield; limited throughput; surface marker must be known [8] |
Key Research Reagent Solutions
- Isolation Kits: Commercial kits based on precipitation, SEC, or immunoaffinity are available from suppliers like AMSBio, offering standardized protocols for different sample types [8].
- Characterization Antibodies: Antibodies against tetraspanins (CD9, CD63, CD81) and other specific markers (e.g., HER2, PD-L1) are essential for Western Blot, Flow Cytometry, and ELISA characterization [8].
- Exosome Standards: Purified or synthetic exosome standards from specific cell types are critical for ensuring quality control, calibrating instruments, and validating diagnostic assays [8].
The following workflow outlines the multi-method approach recommended for robust exosome characterization:
Troubleshooting & FAQs: Addressing Common Experimental Challenges
FAQ 1: My exosome isolation yield is low. What could be the cause and how can I improve it? Low yield can result from several factors related to the isolation protocol and sample handling.
- Possible Causes:
- Insufficient starting material: Exosome concentration varies between biofluids.
- Inefficient isolation method: Ultracentrifugation can have low recovery rates (~30%), and immunoaffinity capture inherently sacrifices yield for purity [8] [12].
- Sample mishandling: Improper storage or repeated freeze-thaw cycles can degrade exosomes.
- Incomplete exosome resuspension: The exosome pellet from ultracentrifugation can be difficult to resuspend fully.
- Solutions:
- Increase the starting volume of your biofluid sample if possible.
- Consider switching to a higher-yield method like Tangential Flow Filtration (TFF) or polymer-based precipitation for initial screening, acknowledging the potential for lower purity [11] [8].
- Always process samples fresh or use a standardized freezing protocol (-80°C). Avoid multiple freeze-thaw cycles.
- Allow adequate time for resuspending the pellet and use appropriate buffers.
FAQ 2: My exosome preparation has low purity with contaminants like protein aggregates. How can I enhance purity? Purity is a common challenge, as biofluids contain many non-vesicular contaminants.
- Possible Causes:
- Method selection: Precipitation methods are notorious for co-precipitating proteins and lipoproteins [8].
- Incomplete washing: Failure to include wash steps in the protocol.
- Solutions:
- Combine methods. A common strategy is to use precipitation or ultracentrifugation for an initial isolation, followed by a polishing step with Size-Exclusion Chromatography (SEC) to remove soluble contaminants [8].
- Incorporate a PBS wash step after pelleting exosomes, followed by a second, high-speed centrifugation.
- For the highest purity requirements, use immunoaffinity capture, which isolates specific exosome subpopulations with very high purity [11].
FAQ 3: How can I ensure the integrity and biological activity of my isolated exosomes? Isolation methods that are too harsh can damage exosomes, compromising downstream functional studies.
- Possible Causes:
- Harsh physical forces: Ultracentrifugation can cause mechanical damage and aggregation [12].
- Chemical stress: Some reagents in precipitation kits may affect exosome integrity.
- Solutions:
- Opt for gentler methods like SEC or TFF when maintaining biological activity is a priority [8].
- Characterize your exosomes using multiple techniques (see workflow diagram above) to confirm the presence of expected markers and intact morphology.
- Use functional assays to confirm biological activity.
FAQ 4: My downstream analysis (e.g., RNA-seq) results are inconsistent. Could this be related to my exosome isolation? Absolutely. Inconsistencies in isolation directly lead to variable analytical results.
- Possible Causes:
- Lack of protocol standardization: Small variations in centrifugation speed, time, or buffer composition between experiments.
- Operator variability: Manual protocols are susceptible to differences in technique.
- Solutions:
- Standardize your protocol meticulously. Document and adhere strictly to centrifugation forces (RCF), times, temperatures, and buffer recipes [11].
- Follow the Minimal Information for Studies of Extracellular Vesicles (MISEV) guidelines to ensure rigorous reporting and reproducibility [11].
- Use exosome standards as positive controls to validate your entire workflow, from isolation to analysis [8].
Advanced Strategies & Future Directions
What are the emerging trends and advanced applications of exosomal cargo in diagnostics?
The field is moving beyond simple isolation towards engineered applications and highly sensitive detection platforms.
- Engineered Exosomes for Therapy and Diagnostics: Exosomes can be engineered as sophisticated drug delivery systems. They can be loaded with therapeutic agents (e.g., chemotherapeutics, nucleic acids) via passive incubation or active loading methods like electroporation or sonication [13]. Their surface can also be modified with targeting ligands (e.g., antibodies, peptides) to enhance their delivery to specific tissues, such as pancreatic tumors, overcoming biological barriers [13].
- Integrated Platforms for Liquid Biopsy: Future diagnostic platforms aim to combine advanced isolation technologies (like microfluidics) with artificial intelligence to create efficient, high-throughput systems for capturing and analyzing exosomal cargo. This integration promises to enhance the sensitivity and specificity of exosome-based liquid biopsies for early cancer detection and real-time monitoring [9] [14].
The complex process of exosome biogenesis and cargo loading is fundamental to understanding their function. The following diagram illustrates this pathway:
Core Concepts: Exosome Biogenesis and Function
What are exosomes and how are they formed? Exosomes are small extracellular vesicles, typically 30-150 nm in diameter, that are released by various cell types into the extracellular environment [15]. They are formed through the endocytic pathway: early endosomes mature into multivesicular bodies (MVBs), which contain intraluminal vesicles. These intraluminal vesicles are released as exosomes when the MVBs fuse with the plasma membrane [16]. This biogenesis pathway distinguishes exosomes from other extracellular vesicles, such as microvesicles (which bud directly from the plasma membrane) and apoptotic bodies (released during cell death) [15] [16].
What is the primary function of exosomes in intercellular communication? Exosomes act as crucial intermediaries in cell-to-cell communication by transporting functional cargo—including proteins, lipids, DNA, and various RNA species (such as mRNA and miRNA)—from donor to recipient cells [17] [16]. They deliver their payload through several mechanisms: direct fusion with the target cell membrane, endocytosis by the target cell, or by engaging with surface receptors to initiate signaling cascades [15]. Their lipid bilayer protects this cargo from degradation in the harsh extracellular environment, making them ideal for conveying biological information over distance [18].
How do exosomes influence physiological and pathological processes? Exosomes mediate diverse effects based on their cell of origin and specific cargo. Key roles include [17]:
- Reproduction and Development: miRNAs in exosomes from semen, placenta, and breast milk help maintain healthy conception and fetal development.
- Immune Responses: They can present antigens and deliver nucleic acids to trigger innate immune responses, but can also be exploited by pathogens to aid survival.
- Neurological Disorders: Exosomes can cross the blood-brain barrier and are implicated in the progression of Alzheimer's disease by carrying tau and Aβ proteins.
- Cancer: Exosomal cargo can enhance tumor growth, promote metastasis, and increase resistance to chemotherapy.
Exosome Isolation Techniques: A Comparative Guide
What are the most common methods for isolating exosomes? The choice of isolation method significantly impacts exosome yield, purity, and suitability for downstream applications. The table below summarizes the primary techniques.
| Method | Principle | Advantages | Disadvantages | Best For |
|---|---|---|---|---|
| Ultracentrifugation [19] [20] [8] | Sequential centrifugation at high speeds to separate particles by size/density. | Considered the "gold standard"; no chemical reagents; handles large volumes. | Time-consuming; requires skilled technician; potential for vesicle damage/aggregation; low-to-moderate purity. | Large sample volumes; research where reagent-free isolation is preferred. |
| Size-Exclusion Chromatography (SEC) [19] [8] | Separates particles based on size as they pass through a porous stationary phase. | Good purity; simple and reproducible protocol; preserves vesicle integrity. | Tedious fraction collection; sample dilution; volume constraints. | Obtaining highly purified exosome preparations from complex fluids like serum [21]. |
| Immunoaffinity Capture [21] [19] [15] | Uses antibodies against exosome surface markers (e.g., CD9, CD63, CD81) for capture. | High specificity and purity; ability to isolate specific exosome subpopulations. | Lower yield; high cost; reliance on known surface markers. | Isolating specific exosome subtypes when high purity is critical. |
| Precipitation [19] [8] | Uses volume-excluding polymers (e.g., PEG) to force exosomes out of solution. | High yield; simple protocol; minimal equipment needed. | Co-precipitation of contaminants (e.g., lipoproteins); may require additional purification. | Rapid isolation and early-stage screening when yield is a priority. |
| Tangential Flow Filtration (TFF) [8] | Uses tangential flow across membranes to separate by size, avoiding clogging. | Scalable for clinical and manufacturing settings; can process large volumes. | Can co-isolate non-EV particles of similar size. | Scalable production for therapeutic applications. |
Exosome Characterization and Quantification
What are the key parameters and methods for characterizing isolated exosomes? Proper characterization is essential to confirm the identity and purity of exosome preparations. A combination of techniques is recommended.
| Method | Parameter Measured | Key Details |
|---|---|---|
| Nanoparticle Tracking Analysis (NTA) [15] [8] | Size distribution, concentration | Tracks Brownian motion of particles in suspension to estimate size and count. |
| Transmission Electron Microscopy (TEM) [21] [15] | Morphology, size | Provides high-resolution images to visualize exosome shape and structure. |
| Western Blotting [21] [15] [8] | Protein markers | Detects positive markers (e.g., CD63, CD81, CD9, TSG101, Alix) and negative markers (e.g., calnexin for ER). |
| Flow Cytometry [21] [8] | Surface markers, quantity | Uses fluorescently labeled antibodies to detect and quantify exosomes (often after binding to beads). |
| Mass Spectrometry [15] [8] | Proteome, Lipidome | Provides a detailed profile of protein and lipid composition. |
| RNA Sequencing [8] [22] | Nucleic acid cargo | Characterizes the RNA content (mRNA, miRNA, lncRNA) of exosomes. |
Which markers should I use to confirm the presence of exosomes? There is no single universal exosome marker. The research community recommends a combination of markers [21] [16]:
- Positive Tetraspanin Markers: CD9, CD63, and CD81 are commonly found in many exosome preparations. However, their abundance varies, and some cell lines release exosomes negative for one of these (e.g., Jurkat cells are CD9 negative) [21].
- Other Positive Markers: Proteins involved in biogenesis, such as TSG101 and Alix [16].
- Negative Markers: To rule out contamination from intracellular compartments, test for markers like calnexin (ER), GM130 (Golgi), cytochrome C (mitochondria), and histones (nucleus) [21].
Troubleshooting Common Experimental Challenges
My exosome isolation yield is lower than expected. What could be wrong? Low yields can result from several factors [15]:
- Sample Quality: Ensure your starting material is fresh and contains adequate exosome levels. For cell culture, standardize harvest conditions and time.
- Protocol Efficiency: Vesicles can be lost during multi-step procedures like ultracentrifugation. For low-yield samples, consider switching to a direct capture method or a technique with higher yield, like precipitation [21].
- Technical Handling: Avoid prolonged centrifugation times that can disintegrate exosomes [19]. When using ultrafiltration, wash filters thoroughly to improve exosome recovery [19].
The isolated exosomes appear to be contaminated with proteins. How can I improve purity? Contamination often comes from soluble proteins or lipoproteins co-precipitated or co-sedimented with exosomes [20] [8].
- Add a Purification Step: Follow a primary isolation method (e.g., precipitation) with a purification step like size-exclusion chromatography (SEC) or a wash with PBS via ultracentrifugation [21] [19].
- Choose a Purer Method: If purity is critical, move towards techniques like SEC or immunoaffinity capture, which offer better separation from common contaminants [8].
- Characterize with Negative Markers: Always use Western Blotting to check for the absence of contaminants from organelles like the ER and Golgi [21].
My isolated exosomes are not showing expected markers in Western Blot analysis. What might be wrong?
- Antibody Specificity: Verify that your antibodies are specific for exosomal markers. It is advised to test antibodies from different manufacturers and closely follow recommended usage protocols [15].
- Sample Preparation: Ensure that lysis and protein extraction procedures are optimized for exosomes.
- Marker Heterogeneity: Remember that not all exosomes express all markers. The expression of tetraspanins like CD9, CD63, and CD81 differs based on the cell line of origin. Try detecting a combination of markers rather than relying on a single one [21].
How should exosomes be stored to maintain stability and functionality?
- Short-term (days to a week): Store at 4°C [15].
- Long-term (months to years): Store at -80°C in PBS with a carrier protein like 0.1% BSA. Aliquot samples to avoid repeated freeze-thaw cycles, which can damage exosome integrity and lead to functionality loss [21] [15].
Advanced Experimental Protocols and Workflows
Workflow for Combined Isolation and Characterization of Exosomes from Cell Culture This integrated protocol ensures a comprehensive analysis of exosome structure and function.
Protocol for Immunoaffinity Capture of Exosomes using Magnetic Beads This method is ideal for isolating specific subpopulations of exosomes with high purity [21].
- Pre-enrichment (Optional but Recommended): For complex samples like plasma, perform a pre-clearing step using size-exclusion chromatography to reduce contaminants [21].
- Bead Preparation: Use 20 µL of magnetic beads (e.g., Dynabeads) per 100 µL isolation volume. The bead concentration depends on the downstream application:
- For Flow Cytometry: Use a stock solution of 1x10^7 beads/mL to maximize the exosome-to-bead ratio for a strong signal.
- For Western Blotting: Use a stock solution of 1.3x10^8 beads/mL to capture more exosomes on a larger total surface area.
- Incubation: Incubate the beads with the exosome-containing sample for a defined period (e.g., several hours) at 4°C with gentle mixing to allow exosomes to bind to the antibody-coated beads.
- Washing: Place the tube on a magnet, discard the supernatant, and wash the beads with PBS to remove unbound material.
- Downstream Analysis: Process the bead-bound exosomes directly for your chosen application. Note that efficient release of intact, functional exosomes from the beads remains a challenge [21].
The Scientist's Toolkit: Essential Research Reagents
| Reagent / Material | Function | Application Notes |
|---|---|---|
| Dynabeads (CD9/CD63/CD81) [21] | Magnetic beads coated with antibodies for immunoaffinity isolation of exosomes. | Ideal for flow cytometry or Western blot; allows isolation of specific exosome subpopulations. |
| Total Exosome RNA & Protein Isolation Kit [23] | Simultaneously isolates RNA and protein from exosomes for downstream analysis. | Enables multi-analyte profiling from a single sample, maximizing data output. |
| Polyethylene Glycol (PEG) [19] | A volume-excluding polymer used to precipitate exosomes from solution. | A key component of precipitation-based kits; simple but may co-precipitate contaminants. |
| Sucrose Density Gradient [19] [20] | A medium for ultracentrifugation that separates vesicles based on buoyant density. | Used to further purify exosomes (density ~1.15-1.19 g/mL) from contaminants after differential centrifugation. |
| Reference Exosome Standards [8] | Well-characterized exosomes from specific cell types or biofluids. | Crucial for standardizing isolation and characterization methods across experiments and laboratories. |
Liquid biopsy represents a transformative approach in clinical diagnostics, offering a non-invasive alternative to traditional tissue biopsies. Among the various analytes used in liquid biopsies, exosomes have emerged as a particularly promising tool. These nanoscale vesicles (30-150 nm), secreted by virtually all cell types into biofluids like blood, urine, and saliva, carry a rich molecular cargo of proteins, nucleic acids, and lipids from their parent cells [24] [25]. Their stability, abundance, and molecular richness make them ideal biomarkers for a wide spectrum of diseases, including cancer, neurodegenerative disorders, and cardiovascular conditions [26] [27]. This technical resource center supports researchers in overcoming the primary challenge in this field: the efficient and specific isolation of exosomes for diagnostic applications.
Why Exosomes? Comparative Advantages in Liquid Biopsy
Exosomes offer distinct advantages over other liquid biopsy components, such as circulating tumor cells (CTCs) and cell-free DNA (cfDNA). The table below summarizes these key benefits.
Table 1: Comparative Advantages of Exosomes in Liquid Biopsy
| Feature | Exosomes | Circulating Tumor Cells (CTCs) | Cell-free DNA (cfDNA) |
|---|---|---|---|
| Abundance | Very high; continuously secreted by living cells [26] | Very low; rare in circulation [26] | Moderate; released during cell death [24] |
| Origin | Living cells, providing a "real-time" snapshot [24] | Living cells | Apoptosis or necrosis (dying cells) [24] [26] |
| Stability | High; lipid bilayer protects cargo from degradation [24] [25] | Fragile cells | Prone to degradation in biofluids [24] |
| Cargo | Diverse: DNA, RNA (mRNA, miRNA), proteins, lipids [24] [25] | Complete cellular content (DNA, RNA, protein) | DNA only |
| Isolation | Multiple established methods (UC, SEC, precipitation) [4] [28] | Complex and challenging [25] | Relatively straightforward |
The molecular content of exosomes is a faithful reflection of their cell of origin, and their fundamental properties make them exceptionally suitable for clinical diagnostics.
Table 2: Key Properties of Exosomes Supporting Their Diagnostic Use
| Property | Description | Diagnostic Implication |
|---|---|---|
| Ubiquity | Found in all body fluids (blood, urine, saliva, CSF) [25] | Enables non-invasive sampling from multiple sources. |
| Stability | Lipid bilayer membrane protects cargo from enzymatic degradation [24] [25] | Cargo remains intact even after sample storage and freeze-thaw cycles. |
| Specific Molecular Cargo | Carry cell-specific proteins, nucleic acids, and lipids [24] [4] | Provides a molecular fingerprint of the parent cell, including diseased cells like tumors. |
| Surface Markers | Display tetraspanins (CD9, CD63, CD81) and cell-type-specific proteins [24] [21] | Allows for targeted isolation and tissue-of-origin tracing. |
Diagram 1: From Biofluid to Diagnostic Advantage
The Scientist's Toolkit: Key Reagents and Materials
Successful exosome research relies on a suite of essential reagents and materials for isolation, characterization, and analysis.
Table 3: Essential Research Reagent Solutions for Exosome Workflows
| Reagent/Material | Function | Application Examples & Notes |
|---|---|---|
| Antibody-coated Magnetic Beads | Immunoaffinity capture of exosomes using surface markers (e.g., CD9, CD63, CD81) [21] [4] | CD9 beads can capture exosomes from plasma after size-exclusion chromatography [21]. Species specificity (e.g., human vs. mouse) is critical [21]. |
| Size-Exclusion Chromatography (SEC) Columns | Gentle separation of exosomes from smaller contaminants (proteins, lipoproteins) based on size [4] [28] | Ideal for pre-enrichment from complex fluids like plasma; preserves vesicle integrity and function [4]. |
| Polyethylene Glycol (PEG) | Polymer that precipitates exosomes by reducing solubility [4] [28] | Simple, equipment-free method suitable for large sample volumes. May co-precipitate contaminants [4]. |
| Ultracentrifugation Equipment | Gold standard method using high g-forces to pellet exosomes based on density and size [4] [28] | Requires specialized equipment and is time-consuming. Potential for vesicle damage and aggregation [4]. |
| Characterization Antibody Panels | Western blot validation of exosome markers (CD9, CD63, CD81, TSG101, Alix) and assessment of contaminants (Calnexin, GM130) [21] [4] | Confirms exosome identity and purity. Absence of organelle-specific markers (e.g., Calnexin for ER) indicates minimal cellular contamination [21]. |
| PBS with BSA | Buffer for resuspending and storing isolated exosomes [21] | Helps maintain exosome stability for short-term storage at 4°C or long-term storage at -80°C [21]. |
Troubleshooting Guides and FAQs
This section addresses common experimental challenges encountered in exosome isolation and analysis.
FAQ 1: Is there a single, universal marker to confirm I have isolated exosomes?
No. There is no consensus on a universal exosome marker [21]. The current recommendation is to combine detection of several membrane-bound proteins to verify the presence of exosomes. Commonly used tetraspanins include CD63, CD81, and CD9. However, note that some cell lines (e.g., Jurkat cells) release exosomes that are CD9 negative [21]. It is equally important to document the absence of contaminating vesicles from organelles like the ER (marker: Calnexin), Golgi (marker: GM130), mitochondria, and nucleus [21].
FAQ 2: How can I differentiate exosomes from different cell origins in a complex sample like serum?
This requires characterization of both general exosome markers and cell-specific markers. For example, in B-cell lymphoma, exosomes can be characterized by the presence of tetraspanins (CD63, CD81) alongside B-cell-specific markers [21]. The expression profile of these markers can differ between exosomes from different sources. To handle the complexity of serum, a pre-clearing or pre-enrichment step, such as size-exclusion chromatography (SEC), is recommended prior to further isolation or analysis [21].
FAQ 3: What is the best way to store isolated exosomes, and how does storage affect downstream analysis?
Isolated exosomes can be stored in PBS with a carrier protein like 0.1% BSA [21]. For short-term storage (up to 24 hours), samples can be kept at 4°C. For long-term storage, it is best to freeze them at -80°C [21] [25]. Studies show that isolation efficiency and biomarker quality are not significantly compromised after freezing at -80°C compared to fresh exosomes [21]. Cell culture media can also be frozen without cryoprotectants for later isolation [21].
FAQ 4: My exosome yield from ultracentrifugation is low and inconsistent. What are the potential reasons and alternatives?
Ultracentrifugation, while considered a gold standard, has several drawbacks that can lead to low and variable yields, including vesicle loss during multiple pellet washes, incomplete pelleting, or even physical damage to exosomes due to high centrifugal forces [4] [28]. Alternatives include:
- Size-exclusion Chromatography (SEC): A gentler method that provides good yield and preserves vesicle integrity [4].
- Polymer-based Precipitation: A simple, scalable method, though it may co-precipitate non-exosomal material [4].
- Direct Immunoaffinity Capture: Using magnetic beads for specific capture can be more efficient for certain applications and avoids vesicle loss from pre-enrichment steps [21] [26].
FAQ 5: Why is protein concentration a poor indicator of exosome quantity?
The correlation between total protein concentration and actual exosome content is often poor, even in simple solutions like cell culture media or urine [21]. This is because protein-based assays can be confounded by co-isolated contaminants, such as soluble proteins or lipoproteins. For a more accurate estimation of exosome amount, researchers should standardize harvest conditions and use methods that directly count or capture vesicles, such as immunoaffinity capture with magnetic beads or nanoparticle tracking analysis [21].
Detailed Experimental Protocols
Here, we detail three common exosome isolation methodologies, citing key parameters from the literature.
Protocol 1: Isolation by Differential Ultracentrifugation
This is the most widely used technique, often considered the benchmark [4] [28].
- Sample Pre-clearing: Centrifuge cell culture supernatant or biofluid at 300 × g for 10 min to remove live cells.
- Debris Removal: Transfer supernatant and centrifuge at 16,000 × g for 30 min to pellet larger vesicles and cell debris.
- Exosome Pelletting: Transfer the resulting supernatant to ultracentrifuge tubes. Pellet exosomes by ultracentrifugation at 100,000 - 150,000 × g for 1-6 hours [4] [28].
- Washing & Resuspension: Carefully discard the supernatant. Resuspend the pellet in a large volume of sterile, cold PBS. Perform a second ultracentrifugation step under the same conditions to wash the exosomes. Finally, resuspend the pure exosome pellet in 50-100 µL of PBS [4].
Protocol 2: Isolation by Size-Exclusion Chromatography (SEC)
This gentle, size-based technique is excellent for preserving vesicle integrity and function [4] [28].
- Column Preparation: Equilibrate the SEC column (e.g., Sepharose CL-2B) with PBS or a suitable buffer.
- Sample Preparation: Pre-clear the sample by centrifugation at 16,000 × g for 30 min to remove large particles.
- Sample Loading and Elution: Load a defined volume (e.g., 500 µL) of the pre-cleared sample onto the column. Elute with PBS and collect sequential fractions.
- Fraction Collection: Exosomes, being larger, will elute in the early fractions (void volume), while smaller proteins and contaminants will elute later. Pool the exosome-rich fractions for downstream use.
Protocol 3: Immunoaffinity Capture using Magnetic Beads
This method offers high specificity by targeting exosomal surface markers [21] [4].
- Bead Preparation: Vortex the bottle of magnetic beads conjugated to an antibody (e.g., anti-CD9, anti-CD63). Transfer 20 µL of beads (for flow cytometry) to a tube [21].
- Bead Washing: Place the tube on a magnet for 1-2 minutes. Remove the supernatant. Wash beads with an appropriate buffer.
- Exosome Capture: Incubate the washed beads with 100 µL of your sample (e.g., pre-cleared plasma or cell culture supernatant) for 30-60 minutes with continuous mixing.
- Washing: Place the tube on a magnet. Discard the supernatant. Wash the bead-bound exosomes with a wash buffer to remove unbound material.
- Downstream Analysis: The exosome-bound beads can now be used directly for downstream applications like flow cytometry. For Western blotting, use a higher amount of beads (e.g., 20 µL of a more concentrated bead stock) to capture more exosomes [21].
Diagram 2: Exosome Isolation Workflow Decision Tree
Frequently Asked Questions (FAQs) on Exosome Isolation and Analysis
Q1: What is the most reliable marker for confirming exosome isolation? Currently, there is no single, universal exosome marker acknowledged by the research community. The recommended strategy is to combine the detection of several membrane-bound proteins to verify the presence of exosomes. Commonly used tetraspanins include CD63, CD81, and CD9; however, it is crucial to note that some cell lines (e.g., Jurkat cells) release exosomes that are CD9 negative. It is equally important to demonstrate the absence of contaminants from other cellular compartments by testing for markers such as calnexin (ER), GM130 (Golgi), cytochrome C (mitochondria), or histones (nucleus) [21].
Q2: How can I differentiate exosomes from different cellular origins in a complex sample like serum? Exosomes from different cellular origins carry specific surface markers and cargo that reflect their parent cells. Characterization can be performed by analyzing the expression of both general exosomal tetraspanins (e.g., CD81, CD63) and cell-specific markers. For instance, in B-cell lymphoma-derived exosomes, the expression profiles of exosomal and B-cell markers were found to be distinct between different lymphoma types. For complex samples like serum, a pre-clearing step, such as size-exclusion chromatography, prior to targeted isolation (e.g., with immunoaffinity beads) is recommended to reduce complexity and improve specificity [21].
Q3: What are the primary challenges associated with the ultracentrifugation method? While ultracentrifugation is considered a gold standard and offers high purity, it faces several challenges:
- Co-isolation of Contaminants: It can co-pellet non-exosomal impurities like protein aggregates and lipoproteins [29].
- Low Reproducibility: The method requires highly skilled technicians to avoid vesicle loss during preparation, leading to potential variability [21] [29].
- Potential for Damage: The high g-forces can damage exosomes, affecting their integrity and downstream analysis [29].
- Low Throughput: The process is time-consuming and not easily scalable for processing many samples or large volumes [11] [29].
Q4: How should I store isolated exosomes to maintain their stability? Isolated exosomes can be stored in PBS with 0.1% BSA. Studies indicate that isolation efficiency is not significantly changed after freezing at -80°C compared to using freshly prepared exosomes. Cell culture media or urine samples can also be frozen directly without cryo-protectants like glycerol for later exosome isolation [21].
Troubleshooting Common Exosome Workflow Issues
This section addresses specific problems researchers might encounter during exosome isolation and characterization.
Table 1: Troubleshooting Guide for Exosome Experiments
| Problem | Potential Causes | Recommended Solutions |
|---|---|---|
| Low Yield [30] | Low abundance in starting material; harsh isolation methods damaging exosomes; inefficient isolation protocol. | Use high-sensitivity isolation kits; standardize cell culture growth conditions; for flow cytometry with beads, use few beads to maximize exosome load per bead [21] [30]. |
| High Contamination [29] [30] | Co-isolation of proteins, lipoproteins, or other extracellular vesicles; use of size-based methods only. | Combine methods (e.g., SEC post-ultracentrifugation); use immunoaffinity capture for specific subpopulations; employ density gradient centrifugation [11] [29]. |
| Inconsistent Results Between Isolations | Lack of standardized protocol; variability in technician skill (e.g., ultracentrifugation); differences in starting sample volume/cell count. | Adhere to MISEV guidelines; meticulously document all technical details (centrifugation forces, rotor types, buffers); use a defined, reproducible protocol [11]. |
| Weak or Negative Signal for Exosome Markers | Exosomes from your system lack the marker tested; antibody is not validated for exosome detection; insufficient exosome quantity. | Test a panel of markers (CD9, CD63, CD81, Alix, Tsg101); characterize the host cell for marker expression; increase exosome input for Western blot by using more beads [21]. |
| Loss of Exosome Integrity [30] | Harsh mechanics (ultracentrifugation) or chemistry (precipitation reagents) during isolation. | Use gentler methods like size-exclusion chromatography or charge-based proprietary technologies that alter isoelectric charges on exosome surface proteins [30]. |
Experimental Protocols for Key Methodologies
Immunoaffinity Capture Using Magnetic Beads for Flow Cytometry
This protocol is ideal for phenotyping exosomes using flow cytometry, providing high specificity by targeting surface antigens [21] [11].
Materials:
- Dynabeads coated with antibodies against exosome surface markers (e.g., CD9, CD63, CD81).
- Pre-enriched exosome sample (e.g., from cell culture media, urine, or pre-cleared serum).
- PBS with 0.1% BSA.
- Fluorescently-labeled detection antibodies.
- Magnetic separation rack.
Procedure:
- Resuspend Beads: Gently vortex the Dynabeads bottle to achieve a homogeneous suspension.
- Prepare Bead-Sample Mixture: In a 1.5 mL microcentrifuge tube, combine 20 µL of bead stock solution (1x10^7 beads/mL) with your exosome sample. Adjust the total isolation volume to 100 µL with PBS/BSA [21].
- Incubate: Incubate the mixture with gentle tilting and rotation for 30-90 minutes at room temperature to allow exosomes to bind to the beads.
- Separate and Wash: Place the tube in a magnetic rack for 1-2 minutes. Carefully remove and discard the supernatant while the tube is on the magnet. Wash the bead-bound exosomes twice with PBS/BSA without disturbing the pellet.
- Label with Detection Antibody: Resuspend the bead-exosome complex in a solution containing a fluorescently-labeled detection antibody targeting a different exosome marker. Incubate for 20-30 minutes at room temperature, protected from light.
- Wash and Analyze: Separate on the magnet, wash to remove unbound antibody, resuspend in a small volume of PBS/BSA, and analyze by flow cytometry.
Size-Exclusion Chromatography (SEC) for High-Purity Isolation
SEC separates exosomes from soluble proteins and other contaminants based on size, preserving vesicle structure and functionality [11] [31].
Materials:
- SEC columns (e.g., qEV columns).
- Phosphate-buffered saline (PBS) or similar elution buffer.
- Fraction collection tubes.
Procedure:
- Column Equilibration: Equilibrate the SEC column with the recommended volume of elution buffer (e.g., PBS).
- Sample Load: Carefully load your pre-cleared sample (e.g., plasma centrifuged at 10,000-20,000 g to remove large particles) onto the top of the resin bed. Avoid disturbing the bed.
- Elution: Add elution buffer and begin collecting sequential fractions. Exosomes, being large, are excluded from the pores and will elute in the early fractions (typically fractions 7-9 for many commercial columns).
- Contaminant Separation: Soluble proteins and smaller contaminants will enter the pores and elute later.
- Concentration (Optional): If needed, the exosome-rich fractions can be concentrated using ultrafiltration devices.
Signaling Pathways and Experimental Workflows
Exosome Biogenesis and Cargo Loading
This diagram illustrates the two primary pathways of exosome formation and the key molecules involved.
Integrated Workflow for Exosome Isolation & Characterization
This flowchart outlines a decision-making process for selecting the appropriate isolation and characterization techniques based on research goals.
The Scientist's Toolkit: Research Reagent Solutions
Table 2: Essential Materials for Exosome Research
| Reagent / Material | Function / Application | Examples & Key Details |
|---|---|---|
| Anti-Tetraspanin Beads | Immunoaffinity isolation of exosome subpopulations. | Dynabeads coated with anti-CD9, CD63, or CD81. For flow, use 20 µL of 1x10^7 beads/mL; for Western, use 20 µL of 1.3x10^8 beads/mL [21]. |
| Size-Exclusion Columns | High-purity isolation based on hydrodynamic diameter. | qEV columns. Separates exosomes from contaminating soluble proteins, preserving biological activity [11] [31]. |
| PBS with BSA | Storage buffer and dilution buffer for immunoassays. | PBS with 0.1% BSA is recommended for resuspending and storing isolated exosomes at -80°C [21]. |
| Tetraspanin Antibodies | Detection and characterization of exosomes via Western blot or flow cytometry. | Antibodies against CD9, CD63, CD81 (e.g., BioLegend). Always use a combination for validation [21] [32]. |
| Negative Markers | Assessing purity of isolation by detecting common contaminants. | Antibodies against Calnexin (ER), GM130 (Golgi), Cytochrome C (Mitochondria). Their absence indicates a pure preparation [21]. |
| Protease Inhibitors | Prevent degradation of exosomal proteins during isolation. | Added to lysis buffers for protein extraction or to isolation buffers, especially when working with complex biofluids [31]. |
A Practical Guide to Exosome Isolation: From Gold Standards to Novel Microfluidic Platforms
Principles of Ultracentrifugation
Ultracentrifugation is a powerful separation technique that uses high centrifugal force to separate particles in a solution based on their size, shape, and density. The core principle involves spinning samples at exceptionally high speeds, reaching up to 150,000 rotations per minute (rpm), which can generate forces equivalent to 1,000,000 × g [33]. This intense centrifugal force causes particles to sediment at different rates, allowing for the precise separation of biological nanoparticles like exosomes, proteins, and viruses from other components in a complex mixture [33] [34].
To prevent sample degradation from overheating due to extreme centrifugal forces, ultracentrifuges are equipped with vacuum systems that maintain a constant temperature around the rotor, ensuring delicate biological samples remain undamaged during the separation process [33]. Two main ultracentrifugation protocols are used for exosome isolation: differential ultracentrifugation and density gradient ultracentrifugation [20] [4].
The following diagram illustrates the fundamental principle of how particles are separated in a centrifugal field based on their size and density.
Experimental Protocols for Exosome Isolation
Differential Ultracentrifugation Protocol
Differential ultracentrifugation is the most commonly used method for exosome isolation and is often considered the "gold standard" against which other methods are evaluated [20] [4]. This technique involves several consecutive rounds of centrifugation with increasing centrifugal force and duration.
Detailed Step-by-Step Protocol:
Pre-analytic Fluid Processing: For plasma samples, collect whole blood in anticoagulant-containing vacutainer tubes (e.g., EDTA). Centrifuge for 15 minutes at 1,500 × g at room temperature to separate plasma from cellular components. Carefully remove the plasma layer without disrupting the buffy coat. Recentrifuge the plasma for 10 minutes at 2,200 × g at 4°C to remove residual cells and platelets. Aliquot and store at -80°C until use [35].
Cell and Debris Removal: Centrifuge the plasma or other biofluid sample at 300 × g for 10 minutes to pellet intact cells [20] [4].
Large Particle Removal: Transfer the supernatant to a new tube and centrifuge at 2,000 × g for 10 minutes to remove larger particles and cell debris [20].
Microvesicle Removal: Transfer the supernatant again and centrifuge at 10,000 × g for 30 minutes to separate exosomes from larger extracellular vesicles and non-exosomal components [20].
Exosome Pellet Formation: Transfer the supernatant to ultracentrifuge tubes and centrifuge at 100,000-150,000 × g for 1-6 hours to pellet the exosomes. The required duration depends on the rotor type and sample viscosity [35] [20] [4].
Washing and Resuspension: Resuspend the exosome pellet in sterile-filtered phosphate-buffered saline (PBS), then recentrifuge at 100,000-150,000 × g for an additional 1-2 hours to wash the exosomes. Finally, resuspend the purified exosome pellet in PBS or another suitable buffer for downstream analysis or storage at -80°C [4].
Density Gradient Ultracentrifugation Protocol
Density gradient ultracentrifugation provides higher purity exosome preparations by separating particles based on their buoyant density rather than just sedimentation rate [20] [4].
Detailed Step-by-Step Protocol:
Gradient Preparation: Prepare a stepwise density gradient in an ultracentrifuge tube using solutions such as sucrose, iodixanol, or iohexol. Layer solutions of decreasing density from bottom to top, typically ranging from 1.10 g/mL to 1.20 g/mL [4].
Sample Loading: Carefully load the pre-processed sample (after steps 1-3 of differential protocol) on top of the density gradient [4].
Ultracentrifugation: Centrifuge at 100,000-150,000 × g for several hours (typically overnight) to allow particles to migrate to their isopycnic positions where their density matches the surrounding medium [20] [4].
Fraction Collection: After centrifugation, carefully collect fractions from the top or bottom of the tube to preserve the separated layers. Exosome-rich fractions typically band at densities between 1.10-1.20 g/mL [4].
Dilution and Washing: Dilute the exosome-containing fractions with PBS and centrifuge at 100,000-150,000 × g for 1-2 hours to pellet the exosomes and remove the gradient material [4].
Resuspension: Resuspend the final exosome pellet in an appropriate buffer for downstream applications [4].
The workflow for isolating exosomes using differential ultracentrifugation follows this specific sequence of steps:
Quantitative Data Comparison
Ultracentrifugation Performance Metrics
Table 1: Performance metrics of ultracentrifugation for exosome isolation
| Parameter | Typical Range/Value | Application Note |
|---|---|---|
| Speed | 100,000 - 150,000 × g | Sufficient to sediment 30-150 nm particles [35] [20] |
| Duration | 1-6 hours (per run) | Longer spins increase yield but risk damage [20] [4] |
| Typical Yield | Variable (~70% of 50-150 nm particles) | 20% >150 nm, 10% <50 nm co-sediment [20] |
| Sample Volume | μL to mL range | Limited by rotor capacity [34] |
| Processing Time | ~12 hours (complete protocol) | Includes multiple steps and washes [4] |
| Purity | Moderate | Contamination with lipoproteins and protein aggregates [20] |
Comparison with Alternative Methods
Table 2: Ultracentrifugation compared to other exosome isolation methods
| Method | Principle | Time | Yield | Purity | Advantages | Disadvantages |
|---|---|---|---|---|---|---|
| Ultracentrifugation | Size/Density | ~12 hours | Moderate | Moderate | No chemical additives; handles large volumes [20] | Low throughput; potential exosome damage [20] [4] |
| Precipitation | Solubility | ~2 hours | High | Low | Simple, fast, scalable [35] | Co-precipitation of contaminants [35] |
| Size Exclusion Chromatography | Size | <1 hour | High | Moderate-High | Gentle; preserves function [4] | Cannot separate similar-sized particles [4] |
| Immunoaffinity | Surface Markers | 2-4 hours | Low | High | High specificity [14] [4] | Limited by antibody specificity; expensive [4] |
The Scientist's Toolkit: Essential Research Reagents
Table 3: Key reagents and materials for ultracentrifugation protocols
| Item | Function/Application | Examples/Specifications |
|---|---|---|
| Ultracentrifuge | Generates high g-forces for sedimentation | Beckman Coulter Optima series; requires vacuum cooling [33] [35] |
| Swinging Bucket Rotors | Holds samples during centrifugation | SW60 rotor; suitable for small volumes [35] |
| Fixed Angle Rotors | Alternative rotor design | Type 70.1 Ti; different k-factors affect efficiency [35] |
| Polycarbonate Bottles/Tubes | Sample containers during ultracentrifugation | Compatible with high g-forces; various capacities [35] |
| Phosphate-Buffered Saline (PBS) | Washing and resuspension buffer | Maintains physiological pH and osmolarity [35] [4] |
| Density Gradient Media | For density-based separation | Sucrose, iodixanol, or iohexol solutions [20] [4] |
| Protease Inhibitors | Prevent protein degradation | Added to biofluids to preserve exosomal cargo [35] |
Troubleshooting Guides & FAQs
Frequently Asked Questions
Q1: Our exosome yields are consistently low despite following standard protocols. What are the potential causes and solutions?
Low yields can result from several factors:
- Rotor Selection: The rotor type (fixed-angle vs. swinging-bucket) and specific parameters (k-factor, sedimentation path length) significantly impact efficiency. Swinging-bucket rotors generally provide better resolution for exosome isolation [20].
- Incomplete Sedimentation: Some exosomes may not pellet even at high g-forces. Consider slightly increasing centrifugation time, but balance against potential damage [20].
- Sample Viscosity: Highly viscous samples like plasma require protocol adjustments. Diluting samples or increasing centrifugation time can improve recovery [20].
- Exosome Loss in Washes: Each wash step results in some exosome loss. Reduce the number of washes or increase starting material [20] [4].
Q2: Our exosome preparations show significant contamination with lipoproteins and other non-vesicular components. How can we improve purity?
Contamination is a common limitation of differential ultracentrifugation:
- Implement Density Gradient Ultracentrifugation: This technique provides much higher purity by separating particles based on buoyant density rather than just sedimentation rate [20] [4].
- Add Filtration Steps: Incorporate 0.1-0.45 μm filters before ultracentrifugation to remove larger contaminants [4].
- Combine Methods: Use size-exclusion chromatography or filtration after ultracentrifugation to remove soluble proteins and lipoproteins [4].
Q3: We observe inconsistent results between different runs and operators. How can we improve reproducibility?
Inconsistency often stems from protocol variability:
- Standardize Rotor Conditions: Use the same rotor type and carefully document k-factors, maximum radius, and minimum radius for all runs [20].
- Control Temperature: Always use temperature-controlled centrifugation and maintain consistent temperatures between runs [33] [20].
- Document Pre-analytical Variables: Standardize sample collection, processing, and storage conditions as these significantly impact exosome quality and yield [35].
- Implement Quality Controls: Use nanoparticle tracking analysis or other characterization methods to validate each preparation [35].
Q4: We're concerned about exosome functionality after high-force centrifugation. Does ultracentrifugation damage exosomes?
Yes, this is a validated concern:
- Physical Stress: High centrifugal forces can disrupt exosome morphology and integrity, potentially affecting their biological activity [20] [4].
- Functionality Testing: Always assess functionality after isolation when studying biological activities [4].
- Alternative Methods: For functional studies, consider gentler methods like size-exclusion chromatography or density gradient centrifugation [4].
Q5: Our laboratory needs to process multiple samples efficiently, but ultracentrifugation seems low-throughput. Are there solutions?
Throughput limitations are inherent to ultracentrifugation:
- Rotor Capacity: Use rotors with higher tube capacity where possible, but note that this may affect separation efficiency [34].
- Parallel Processing: Optimize workflow to process multiple batches consecutively [4].
- Alternative Methods: For high-throughput needs, consider precipitation-based methods or automated systems, acknowledging their different limitations [35] [4].
- Pre-concentration: Use ultrafiltration to concentrate samples before ultracentrifugation, reducing the number of ultracentrifugation runs needed [4].
Troubleshooting Common Problems
Table 4: Troubleshooting guide for common ultracentrifugation issues
| Problem | Potential Causes | Solutions |
|---|---|---|
| No visible pellet | Insufficient centrifugation force/time; low exosome concentration; incorrect rotor type | Increase centrifugation time; use higher g-force; concentrate sample first; verify rotor specifications |
| Low yield | Excessive washing; incomplete resuspension; sample viscosity; improper storage | Minimize wash steps; optimize resuspension technique; dilute viscous samples; ensure proper sample handling |
| High protein contamination | Incomplete removal of soluble proteins; lipoprotein co-precipitation | Add additional low-speed spins; incorporate density gradient; use filtration steps |
| Exosome aggregation | Excessive g-force; oversedimentation; improper resuspension | Reduce centrifugation time/force; optimize resuspension buffer; gentle pipetting |
| Inconsistent results | Variable sample quality; protocol deviations; different operators | Standardize pre-analytical procedures; strictly follow protocol; train all operators |
Ultracentrifugation remains the cornerstone technique for exosome isolation, providing a balance of yield, scalability, and reliability. While newer methods offer advantages in specific applications like purity or throughput, understanding the principles, protocols, and limitations of ultracentrifugation is essential for researchers developing improved exosome-based diagnostics. By implementing the troubleshooting strategies and quality controls outlined in this guide, scientists can optimize their ultracentrifugation workflows to generate reproducible, high-quality exosome preparations that advance diagnostic research and therapeutic development.
The following table summarizes the core principles and characteristics of SEC and TFF for exosome isolation [36] [11] [37].
| Method | Core Principle | Typical Time | Yield | Purity | Key Advantages | Key Disadvantages |
|---|---|---|---|---|---|---|
| Size-Exclusion Chromatography (SEC) | Separates particles by hydrodynamic size as they pass through a porous stationary phase [36]. | ~20 minutes [37] | Medium [11] [37] | Medium-High [36] [11] [37] | Maintains exosome integrity and function; high reproducibility [36] [11] [37]. | Low sample volume limit; can be contaminated with lipoproteins [36] [37]. |
| Tangential Flow Filtration (TFF) | Separates and concentrates via membrane pore size; feed flow is parallel to membrane, minimizing clogging [38] [37]. | < 4 hours [37] | High [11] [37] | Medium [11] [37] | Fast, high-yield, scalable, and excellent for processing large volumes [11] [37]. | Can expose exosomes to shear forces, potentially damaging them [37]. |
SEC Troubleshooting FAQs
Q: My system pressure is unexpectedly high. What should I do? A: High pressure can damage columns. Systematically identify the cause [39]:
- Check the instrument and tubing: Disconnect the column and run the system. If pressure remains high, the issue is with the pump, autosampler, or tubing [39].
- Check the columns: If pressure is normal without columns, reconnect them one by one. The pressure spike will occur when the blocked column is installed. Pre-columns and column frits are common culprits [39].
- Check post-column components: Detector flow cells can also become blocked [39].
Q: I am observing a loss of resolution and distorted peak shapes. What could be the cause? A: This indicates a problem with column performance [39].
- Test column performance: Regularly measure parameters like plate count and peak asymmetry. Compare these values to the column's certificate or baseline measurements [39].
- Identify the faulty column: Test each column in your set individually to find the one that is malfunctioning [39].
- Check connections: Ensure all tubing connections are low dead-volume to avoid peak broadening and distortion [39].
Q: My baseline is drifting, especially with a Refractive Index (RI) detector. How can I fix this? A: Baseline drift is often related to temperature fluctuations [39].
- Stabilize the environment: Ensure the instrument and laboratory are free from drafts and sudden temperature changes from air conditioning or open windows [39].
- Verify detector performance: Use a standard test sample to check for signal-to-noise (S/N) issues, which could also indicate a dirty flow cell requiring cleaning [39].
TFF Troubleshooting FAQs
Q: The filtration flux is dropping rapidly during my process. What is causing this? A: A sharp flux decline typically indicates membrane fouling or concentration polarization [38].
- Optimize cross-flow: Increase the tangential flow rate to enhance the sweeping effect across the membrane, which carries away retained particles and reduces buildup [38].
- Manage transmembrane pressure (TMP): Ensure TMP is not excessively high, as this can force particles into the membrane pores, accelerating fouling [38].
- Consider membrane cleaning: Follow manufacturer guidelines for cleaning protocols to restore membrane performance [38].
Q: How do I choose between a hollow fiber module and a flat-sheet cassette? A: The choice depends on your sample's sensitivity and scalability needs [38].
- Hollow Fiber Modules: Provide gentler, more laminar flow with lower shear stress. Ideal for fragile, shear-sensitive targets like enveloped viruses (lentivirus) or delicate proteins [38].
- Flat-Sheet Cassettes: Generate higher turbulence and shear forces. Best for robust products like non-enveloped viruses (AAV) and for processes requiring very high filtration flux [38].
Q: I am concerned about low recovery or damaged exosomes after TFF. How can I mitigate this? A: To preserve exosome integrity and function [37]:
- Control Shear Forces: For sensitive exosomes, select a hollow fiber module and avoid excessively high pump speeds [38] [37].
- Optimize Membrane Parameters: Use an appropriate molecular weight cutoff (MWCO) or pore size (e.g., 100-500 kDa MWCO for ultrafiltration) to retain exosomes without excessive force [38] [37].
- Combine Methods: A common strategy is to use TFF for initial concentration and buffer exchange, followed by a high-purity technique like SEC for final purification and removal of small contaminants [37].
The Scientist's Toolkit: Essential Research Reagent Solutions
| Item / Reagent | Function in SEC/TFF Workflow |
|---|---|
| Size-Exclusion Columns | Pre-packed columns with porous polymer beads for separating exosomes from contaminants by size [36]. |
| TFF Membranes & Modules | Hollow fiber cartridges or flat-sheet cassettes with specific pore sizes (e.g., 500 kDa MWCO) for exosome concentration and purification [38]. |
| Phosphate-Buffered Saline (PBS) | A standard, isotonic buffer for sample dilution, column equilibration in SEC, and diafiltration in TFF to maintain exosome stability [36]. |
| Ethanolamine or BSA | Used for passivating system surfaces and columns to minimize non-specific adsorption of exosomes, thereby improving recovery [36]. |
| PEG-based Precipitation Kits | Sometimes used in combination with TFF for initial crude concentration of exosomes from large-volume starting materials [11] [37]. |
Experimental Workflow and Method Combination Strategies
The following diagram illustrates a combined TFF and SEC workflow for high-quality exosome isolation, ideal for diagnostics research.
Workflow Description: This combined approach leverages the strengths of both techniques. TFF first rapidly processes and concentrates the large-volume starting material. The resulting retentate is then applied to an SEC column, which acts as a polishing step to remove contaminating proteins and lipoproteins, yielding a pure and functional exosome preparation suitable for sensitive downstream diagnostics applications [37].
Method Selection and Combination Logic
This decision tree outlines the logic for selecting and combining isolation methods based on research goals and sample type.
Selection Logic: The optimal path depends on your constraints. Choose TFF for large volumes and throughput, SEC for high purity from small samples, or a combined TFF->SEC approach to achieve both concentration and high purity. For shear-sensitive samples within a TFF workflow, select gentler hollow fiber modules [38] [37].
Exosomes, small extracellular vesicles with diameters between 30 and 150 nm, have emerged as crucial entities in intercellular communication, carrying nucleic acids, lipids, and proteins that influence wide-ranging biological and pathological processes [14]. Their importance in disease diagnostics, therapy, and as biomarkers has driven the development of multiple isolation techniques. Among these, polyethylene glycol (PEG)-based precipitation has gained significant traction as a method that balances accessibility, yield, and technical feasibility [4]. This approach, originally utilized for virus isolation, leverages the ability of PEG to reduce exosome solubility, causing them to precipitate out of solution for collection via low-speed centrifugation [40] [4]. Within the context of diagnostic research, where sample throughput, cost-effectiveness, and preservation of biomolecular integrity are paramount, PEG workflows offer a compelling alternative to more equipment-intensive methods like ultracentrifugation.
The fundamental principle behind PEG precipitation involves volume exclusion, where PEG molecules reduce the hydration shell around exosomes, decreasing their solubility and promoting aggregation and precipitation [41]. This process allows for the efficient capture of exosomes from diverse biological fluids, including plasma, serum, urine, and cell culture supernatants, without requiring specialized ultracentrifugation equipment [14] [42]. For diagnostic applications, where protocols must be transferable across clinical settings and yield sufficient material for downstream analyses like nucleic acid profiling or protein biomarker detection, PEG-based methods provide a viable pathway toward standardized exosome isolation.
Frequently Asked Questions (FAQs) on PEG Workflows
Q1: What is the typical yield and purity of exosomes isolated via PEG precipitation compared to ultracentrifugation?
Studies have demonstrated that the precipitation method results in an approximately 2.5-fold higher concentration of exosomes per milliliter compared to ultracentrifugation [35]. However, this increase in yield often comes with a trade-off in purity. PEG preparations frequently contain co-precipitated contaminants, including proteins, lipoproteins, and nucleic acids not contained within exosomes [40] [20]. For instance, one study noted a "high level of contamination of other proteins in serum" when using PEG isolation [40]. Ultracentrifugation, while considered the "gold standard" for purity, is not immune to contamination either, but typically yields more enriched extracellular vesicle fractions [35] [20].
Q2: What PEG concentration is optimal for exosome isolation from different sample types?
The optimal PEG concentration is not universal and should be optimized for different sample types and cell sources. Research indicates that:
- For human plasma, a final concentration of 10% PEG 8000 was superior to commercial kits in isolating exosomes for miRNA and proteomic analysis [40].
- For oral squamous cell carcinoma (OSCC) cell culture media, 8% PEG 6000 was ideal, producing exosomes of higher purity, proper size, and higher particle numbers compared to both higher PEG concentrations and ultracentrifugation [42].
- A screening range of 8% to 12% PEG is a practical starting point for optimization, as different biological fluids have varying compositions that affect precipitation efficiency [42].
Q3: How does the choice of PEG protocol affect downstream applications like RNA sequencing or proteomics?
The PEG isolation protocol directly impacts the quality and reliability of downstream applications. Key considerations include:
- miRNA Analysis: For detecting miRNAs like miR-122 and miR-16 from plasma, exosomes isolated with 10% PEG demonstrated superior detection compared to those isolated with commercial kits [40].
- Proteomics: While PEG-isolated exosomes are suitable for proteomic analysis, the preparations often contain a high level of co-precipitated contaminating proteins, which can complicate the analysis and require careful data interpretation [40].
- Cell Transfection: PEG-precipitated exosomes have been shown to have better transfection efficiency when co-cultured with recipient cells compared to exosomes isolated by other methods [42].
Q4: Can PEG-based isolation be automated for higher throughput in a clinical diagnostics setting?
Yes, PEG precipitation assays are amenable to automation. Open-source, automated liquid-handling systems can accurately pipette even viscous PEG solutions to perform high-throughput relative solubility measurements with low sample volumes (requiring as little as 200 µg of protein material) [41]. Automation significantly improves reproducibility, accuracy, and walk-away time, making it suitable for screening large sample numbers in clinical research pipelines.
Q5: What are the primary storage conditions for PEG-precipitated exosomes?
Exosomes isolated via PEG precipitation can be stored in PBS, often with a carrier protein like 0.1% BSA, at -80°C [21]. Studies indicate that isolation efficiency is not significantly changed after freezing compared to using freshly prepared exosomes. For direct isolation from cell culture media or urine, freezing without cryo-protectants like glycerol is common practice [21].
Troubleshooting Guide for Common PEG Workflow Challenges
Table 1: Common Issues and Solutions in PEG-Based Exosome Isolation
| Problem | Potential Cause | Recommended Solution |
|---|---|---|
| Low exosome yield | Inadequate PEG concentration; Insufficient incubation time; Incomplete pellet resuspension | Optimize PEG concentration for your sample type (test 8-12%); Ensure overnight incubation at 4°C; Resuspend pellet thoroughly in an appropriate buffer [40] [42]. |
| High protein contamination | Co-precipitation of non-exosomal proteins and lipoproteins | Incorporate a pre-cleaning step (e.g., density gradient centrifugation, size-exclusion chromatography); Wash the final pellet with PBS [40] [20]. |
| Low purity / High lipoprotein content | Inability of PEG to distinguish exosomes from similarly sized particles like lipoproteins | Combine PEG precipitation with a subsequent purification step, such as size-exclusion chromatography, to remove soluble contaminants and lipoproteins [21] [20]. |
| Inconsistent results between samples | Variable PEG pipetting due to high viscosity; Unstandardized sample processing | Automate PEG pipetting using a liquid-handling robot for accuracy; Standardize pre-analytical conditions (e.g., plasma processing protocol, sample volume) [35] [41]. |
| Poor performance in downstream applications | Damage to exosomes or co-precipitation of inhibitors | Treat sample with DNase/RNase pre-isolation to degrade external nucleic acids; Validate exosome integrity via nanoparticle tracking analysis and Western blotting for markers (CD9, CD63, CD81) [40] [42]. |
Experimental Protocols for Optimization and Validation
Basic Protocol: PEG Precipitation from Plasma/Serum
This protocol is adapted from validated research methods for isolating exosomes from plasma [40] [35].
- Plasma Pre-processing: Collect whole blood in EDTA tubes and process within 2 hours. Centrifuge at 1,500-2,200 RCF (xg) for 15 minutes to obtain plasma. Perform a second centrifugation at 2,200 RCF for 10 minutes to remove residual cells and platelets. Aliquot and store at -80°C [35].
- Pre-treatment: Thaw plasma on ice. To remove free nucleic acids, add DNase I and/or RNase A and incubate at 37°C for 15 minutes [40].
- PEG Precipitation:
- Prepare a 40% (w/v) stock solution of PEG 8000 (or PEG 6000) in 1M NaCl or PBS.
- Mix 500 µL of pre-cleared plasma with 500 µL of the 40% PEG stock to achieve a final concentration of 20% PEG. Note: The optimal final concentration may be 8-15%; adjust the stock PEG volume accordingly [40] [42].
- Vortex the mixture thoroughly and incubate at 4°C for a minimum of 12 hours (overnight is typical).
- Pellet Recovery: Centrifuge the mixture at 16,000× g for 1 hour at 4°C to pellet the exosomes.
- Washing and Resuspension: Carefully discard the supernatant. Resuspend the pellet in 250 µL of particle-free PBS or a buffer suitable for your downstream application. A second, brief centrifugation can be performed to remove any insoluble aggregates.
Protocol: Optimizing PEG Concentration for Cell Culture Media
This protocol outlines a strategy for determining the ideal PEG concentration for a specific cell line, using OSCC cells as an example [42].
- Conditioned Media Collection: Culture cells in a serum-free medium for 24 hours. Collect the conditioned media and centrifuge at 900× g for 30 minutes to remove cell debris. Filter the supernatant through a 0.22 µm syringe filter.
- PEG Titration:
- Prepare a 40% PEG 6000 solution in PBS.
- Aliquot 10 mL of filtered media into separate tubes.
- Add varying volumes of the 40% PEG stock to create final concentrations of 8%, 10%, and 12% PEG. For example:
- 8% PEG: Add 2.5 mL of 40% PEG to 10 mL media.
- 10% PEG: Add 3.3 mL of 40% PEG to 10 mL media.
- 12% PEG: Add 4.3 mL of 40% PEG to 10 mL media.
- Isolation and Analysis:
- Incubate all mixtures at 4°C for 16 hours.
- Centrifuge at 16,000× g for 1 hour at 4°C.
- Resuspend pellets in equal volumes of PBS.
- Characterize the exosomes from each condition using Nanoparticle Tracking Analysis (NTA) for size and concentration, and Western Blot for markers (CD63, CD81, CD9) to identify the condition with the highest yield and purity.
Workflow Diagram: Optimizing PEG-Based Exosome Isolation
The following diagram illustrates the logical workflow for isolating and troubleshooting exosomes using PEG precipitation.
Diagram 1: Workflow for optimizing PEG-based exosome isolation, incorporating key troubleshooting feedback loops.
The Scientist's Toolkit: Essential Reagents and Materials
Table 2: Key Research Reagent Solutions for PEG-Based Exosome Workflows
| Reagent / Material | Function / Application | Example Usage |
|---|---|---|
| PEG 6000 / 8000 | Polymer that induces exosome precipitation via volume exclusion. | Core component of the precipitation solution; concentration must be optimized (e.g., 8% for OSCC cells, 10% for plasma) [40] [42]. |
| DNase I / RNase A | Enzymes that degrade free nucleic acids outside of exosomes. | Pre-treatment of sample to ensure that downstream nucleic acid analysis (e.g., miRNA-seq) specifically captures exosomal content [40]. |
| Phosphate-Buffered Saline (PBS) | Isotonic buffer for resuspending exosome pellets and washing. | Used to dilute PEG stock and to resuspend the final exosome pellet for storage or downstream applications [35]. |
| Protease Inhibitor Cocktails | Suppresses proteolytic degradation of exosomal proteins. | Added to PBS during the resuspension step to preserve protein integrity for Western Blot or proteomic analysis [42]. |
| CD9, CD63, CD81 Antibodies | Markers for validating exosome identity and purity via Western Blot or Flow Cytometry. | Used to confirm the presence of exosomal tetraspanins and the success of the isolation protocol. Note: Not all exosomes express all markers equally [21] [4]. |
| Size-Exclusion Chromatography (SEC) Columns | Post-PEG purification to remove soluble proteins and lipoproteins. | Used as a follow-up step to "clean" PEG-precipitated exosomes, significantly improving sample purity for sensitive applications [21] [20]. |
Affinity-based capture has emerged as a powerful technique for isolating extracellular vesicles (EVs), including exosomes, with high specificity and purity. This method leverages antibodies targeting canonical EV surface tetraspanins—CD63, CD81, and CD9—to selectively pull down vesicle populations from complex biological samples. Unlike conventional methods like ultracentrifugation or polymeric precipitation, which can co-isolate contaminants and damage vesicle integrity, antibody-mediated capture preserves EV morphology and function while significantly reducing non-vesicular impurities [43] [44]. For diagnostics research, where sample purity directly impacts analytical sensitivity and reliability, affinity-based approaches provide a critical advantage by enabling the isolation of well-defined EV subsets that reflect their parental cell origins [45] [46].
The principle is foundational to liquid biopsy applications: EVs carry proteins, nucleic acids, and lipids from their parent cells, making them invaluable biomarker sources [26]. By targeting specific surface antigens, researchers can not only isolate total EVs but also enrich for subpopulations derived from particular cell types, such as carcinoma-derived exosomes via epithelial cell adhesion molecule (EpCAM) antibodies [44] [26]. This technical guide addresses common experimental challenges and provides troubleshooting resources for implementing robust, reproducible affinity-based EV isolation protocols.
Troubleshooting Guide: FAQs for Affinity-Based EV Capture
FAQ 1: What are the primary advantages of using affinity capture over ultracentrifugation or precipitation methods?
Affinity purification offers superior specificity and purity compared to conventional techniques. Ultracentrifugation requires expensive equipment, has limited processing capacity, and can cause EV damage due to high g-forces [43] [44]. Polymer-based precipitation (e.g., polyethylene glycol) efficiently recovers EVs but co-precipitates substantial non-vesicular contaminants, including proteins and lipoprotein complexes, which interfere with downstream analyses like mass spectrometry [43] [47]. In contrast, affinity capture with anti-tetraspanin antibodies isolates a more defined EV population, significantly reducing contamination and enabling more accurate biomarker detection [43] [48].
FAQ 2: How specific are CD9, CD63, and CD81 as general exosome markers?
There is no single universal exosome marker, and tetraspanin expression varies across EV populations and cell types. The research community recommends combining detection of multiple membrane-associated proteins to verify EV presence [21]. While CD63, CD81, and CD9 are frequently found on exosomes, some cell lines release exosomes lacking certain tetraspanins (e.g., Jurkat and B-cell lymphoma exosomes can be CD9-negative) [21]. Characterization should therefore include several positive markers (e.g., CD9, CD63, CD81, Tsg101) and negative controls for intracellular organelle proteins (e.g., calnexin for ER, GM130 for Golgi, cytochrome C for mitochondria, histones for nucleus) to assess contamination [21].
FAQ 3: My Western blot signals for isolated exosomes are weak or absent. What could be wrong?
Several factors can cause weak Western blot signals:
- Insufficient sample loading: EVs contain relatively low protein cargo. For initial experiments, load as much sample as possible [47].
- Antibody issues: Titrate antibody concentrations and ensure proper storage. Verify antibody performance under specific gel conditions (reducing/non-reducing, denaturing/non-denaturing) recommended for your target [47].
- Suboptimal isolation: Ensure efficient EV capture by optimizing antibody-bead ratios and incubation conditions. Use a positive control (e.g., known exosome-producing cell line) to validate the entire workflow [47].
FAQ 4: How can I release captured exosomes intact for functional studies?
Intact EV release remains challenging with traditional immunoaffinity due to strong antibody-antigen binding. Innovative solutions include:
- Calcium-dependent Tim4 affinity: Tim4 protein binds EV phosphatidylserine in a Ca²⁺-dependent manner. Adding EDTA or other Ca²⁺ chelators gently releases intact EVs [43].
- Desthiobiotin-streptavidin chemistry: Using desthiobiotin-conjugated antibodies (instead of biotin) allows competitive elution with free biotin solution under mild conditions, preserving EV integrity and function [44]. Standard low-pH or high-salt elution can damage EVs or reduce functionality, so these mild elution methods are preferred for uptake or functional studies [44] [21].
FAQ 5: What is the recommended storage condition for isolated exosomes?
For short-term storage, keep exosomes at 4°C for up to one week. For long-term storage, aliquot exosomes to avoid repeated freeze-thaw cycles and store at -20°C or -80°C. Multiple freeze-thaw cycles can damage exosomes and reduce yield [47]. Isolated exosomes can be stored in phosphate-buffered saline (PBS) with a carrier protein like 0.1% bovine serum albumin (BSA) [21].
FAQ 6: Can I use the same antibody-bead amount for different downstream applications?
No, the amount of beads and capture antibodies should be optimized for specific applications:
- Flow cytometry: Use fewer beads (e.g., 20 μL of 1×10⁷ beads/mL) to maximize exosomes per bead, enhancing signal detection [21].
- Western blotting or proteomics: Use more beads (e.g., 20 μL of 1.3×10⁸ beads/mL) to increase total surface area and capture more exosomes for analysis [21].
Quantitative Comparison of EV Isolation Methods
The following table summarizes key performance metrics of affinity-based methods versus conventional techniques, based on published data.
Table 1: Performance Comparison of EV Isolation Methods
| Isolation Method | Purity (Relative Protein Contamination) | Intact EV Yield | Processing Time | Key Advantages | Major Limitations |
|---|---|---|---|---|---|
| Anti-Tetraspanin Affinity | High (Low non-vesicular protein) [43] | Medium-High [48] | Medium (2-4 hours) [44] | High specificity; low contamination; targets specific EV subsets [43] [48] | Limited to EVs expressing target antigen; potential high cost; elution challenges [44] [21] |
| Tim4 Affinity | Very High (Minimal contaminants) [43] | Medium [43] | Medium (2-4 hours) | Gentle, Ca²⁺-dependent elution; high purity suitable for MS [43] | Phosphatidylserine masking by MFG-E8 may reduce yield in some samples [43] |
| Ultracentrifugation (UC) | Low-Medium (High with PBS wash, but yield drops) [43] | Low-Medium (Potential damage) [44] | Long (>5 hours, often overnight) | No reagent cost; widely established [43] | Instrument cost; low throughput; vesicle damage; skill-dependent [43] [44] |
| Polymer Precipitation | Low (Co-precipitates contaminants) [43] | High [43] | Short-Medium (<2 hours to overnight) | Simple protocol; high total yield; processes large volumes [43] [47] | High protein contamination; polymer may interfere with downstream steps [43] [47] |
| Microfluidic Affinity (e.g., OncoBean) | High [44] | High (Functional post-release) [44] | Short (<1 hour) | Fast processing; high throughput; low sample volume [44] | Device fabrication required; flow rate optimization needed [44] |
Table 2: Typical Yield and Resource Estimates for Affinity-Based EV Isolation
| Parameter | Typical Value/Range | Notes and Context |
|---|---|---|
| EVs from 1 mL HeLa culture | 4-8 × 10⁹ particles [47] | Using Total Exosome Isolation reagent; measured by Nanosight |
| EVs from 100 μL serum | 1.5-3 × 10¹¹ particles [47] | Using Total Exosome Isolation reagent; measured by Nanosight |
| RNA from 30 mL HeLa culture | ~8 ng [47] | Isolated via Total Exosome RNA & Protein Isolation Kit |
| RNA from 4 mL serum | ~2 ng [47] | Sufficient for RNA library prep for sequencing |
| Typical bead amount for flow cytometry | 20 μL of 1×10⁷ beads/mL [21] | In 100 μL isolation volume |
| Typical bead amount for Western blot | 20 μL of 1.3×10⁸ beads/mL [21] | In 100 μL isolation volume |
Detailed Experimental Protocol: Immunoaffinity Capture Using Magnetic Beads
Materials Required
- Dynabeads coated with streptavidin (e.g., Thermo Fisher Scientific) [21]
- Biotinylated or desthiobiotinylated antibodies against CD9, CD63, or CD81 [44] [21]
- Magnetic separation rack
- Binding buffer (e.g., PBS with 0.1% BSA)
- Elution buffer (specific to release method)
Step-by-Step Procedure
- Antibody Conjugation: Incubate biotinylated anti-tetraspanin antibodies with streptavidin-coated magnetic beads per manufacturer's instructions (typically 30-60 minutes at room temperature with rotation) [21].
- Blocking: Block beads with 1% BSA in PBS for 1 hour to minimize nonspecific binding.
- Sample Preparation: Pre-clear biofluid or cell culture supernatant by low-speed centrifugation (2,000 × g for 30 minutes) and filtration (0.22 μm) to remove cells, debris, and large vesicles [43].
- EV Capture: Incubate pre-cleared sample with antibody-conjugated beads for 2-4 hours at room temperature with rotation. Use 20 μL bead suspension per 100-500 μL sample, adjusting based on EV abundance [21].
- Washing: Separate beads magnetically, discard supernatant, and wash 3-5 times with PBS + 0.1% BSA.
- EV Release (Optional):
- For desthiobiotin-based capture: Incubate beads with 5-10 mM biotin solution in PBS for 30-60 minutes to competitively elute intact EVs [44].
- For Tim4-based capture: Incubate beads with elution buffer containing 2-10 mM EDTA for 30 minutes to chelate calcium and release EVs [43].
- For direct analysis without release: Proceed to downstream applications with beads resuspended in appropriate buffer.
- Post-Isolation Analysis: Characterize EVs using nanoparticle tracking analysis (NanoSight), Western blotting for tetraspanins, transmission electron microscopy, or functional uptake assays [43] [44].
Workflow Visualization: Affinity Capture and Analysis
The following diagram illustrates the key decision points and steps in a standard affinity-based EV isolation workflow:
The Scientist's Toolkit: Key Research Reagent Solutions
Table 3: Essential Reagents for Affinity-Based EV Isolation
| Reagent/Category | Specific Examples | Function and Application Notes |
|---|---|---|
| Capture Antibodies | Biotinylated anti-CD63, anti-CD81, anti-CD9 [21] | Immobilized on solid supports for specific EV capture; selection depends on EV source |
| Control Antibodies | Anti-EpCAM (for carcinoma-derived EVs) [44] [26] | Enrich tissue-specific EV subpopulations; enhances diagnostic signal-to-noise |
| Magnetic Beads | Streptavidin-coated Dynabeads [21] | Solid support for antibody conjugation; enable magnetic separation and washing |
| Elution Reagents | EDTA (for Tim4 method), Biotin (for desthiobiotin method) [43] [44] | Mild elution agents for releasing intact EVs for functional studies |
| EV Characterization Antibodies | Anti-CD63, CD81, CD9 (for Western blot/flow cytometry) [21] | Confirm EV identity and purity in downstream assays |
| Negative Markers | Anti-calnexin, anti-GM130, anti-cytochrome C [21] | Assess contamination from ER, Golgi, or mitochondria |
| Isolation Kits | Total Exosome Isolation reagents (from various sample types) [47] | Provide optimized protocols and reagents for specific sample matrices |
| Microfluidic Devices | Modified OncoBean chip [44] | High-throughput EV capture with integrated desthiobiotin release capability |
Affinity-based capture using antibodies against CD63, CD81, and CD9 represents a significant advancement in EV isolation methodology, particularly for diagnostics applications requiring high purity and specific subpopulation enrichment. While challenges remain in intact EV release and standardization, emerging technologies like Tim4 phosphatidylserine binding, desthiobiotin-based elution, and microfluidic platforms offer promising solutions [43] [44].
The true diagnostic power of affinity-isolated EVs is realized when combined with multi-analyte analysis (RNA, protein, DNA), providing complementary biomarker information that enhances sensitivity and clinical utility [26]. As the field progresses toward clinical translation, standardization of protocols, rigorous characterization, and validation across diverse sample types will be essential. The troubleshooting guidance and technical resources provided here aim to support researchers in implementing robust affinity-capture workflows that accelerate exosome-based diagnostic development.
This technical support center is designed for researchers and scientists advancing diagnostic research through exosome studies. It provides targeted troubleshooting and detailed protocols for emerging microfluidic technologies that integrate exosome isolation and analysis. These systems overcome critical limitations of conventional methods by enabling automated, high-throughput processing of complex biological samples with minimal volume requirements and maximal sensitivity [49] [50].
Microfluidic platforms manipulate fluids at sub-millimeter scales, offering significant advantages for exosome research. The inherent properties of these systems—including large surface-to-volume ratios for enhanced EV absorption and laminar flow characteristics for superior manipulation—make them ideal for handling nanoscale vesicles [49] [50]. The field is rapidly shifting from using microfluidics solely for isolation toward seamlessly integrated on-chip quantification and analysis [49].
Integrated systems combine isolation modalities (e.g., affinity-based capture or size-based separation) with integrated sensing approaches like fluorescence, chemiluminescence, or surface-enhanced Raman spectroscopy (SERS) for direct on-chip analysis of captured particles [49]. The table below summarizes the performance of selected microfluidic quantification technologies.
Table 1: Performance of Microfluidic On-Chip EV Quantification Platforms
| Technology Principle | Detection Method | Limit of Detection (Particles/mL) | Linear Range (Particles/mL) | Targeted Markers |
|---|---|---|---|---|
| Droplet-based optofluidic platform [49] | Fluorescence | 9 x 10³ | Information Missing | CD81 |
| DEP trapping in microwells [49] | Fluorescence | 193 | 1.4 x 10³ - 1.4 x 10⁸ | CD63, CD81, CEA, EpCAM |
| Droplet-based single-exosome counting immunoassay [49] | Fluorescence | 10⁴ | 10⁴ - 10⁸ | CD63, GPC-1 |
| Inertial separation + capture on AuNPs [49] | Chemiluminescence | 9.5 x 10⁴ | 2.5 x 10⁵ - 2.5 x 10¹¹ | CD24, CD81, EpCAM |
| Membrane EV isolation/counting [49] | Fluorescence | 10⁵ (10⁸ for clinical samples) | 1 x 10⁵ - 4 x 10⁶ | CD63 |
| Centrifugal chip + capture on magnetic NPs [49] | Colorimetric | 10⁶ | Information Missing | CD63, CEA, CA125, EGFR |
Troubleshooting Guide: Frequently Asked Questions (FAQs)
FAQ 1: Our microfluidic device consistently clogs when processing complex biofluids like blood plasma. What are the primary causes and solutions?
Clogging is a common challenge, often caused by the presence of non-vesicular contaminants such as protein aggregates and lipoproteins in complex matrices [50] [4].
- Pre-filtration is Critical: Always pre-process raw biofluids. Centrifuge samples at low speeds (e.g., 2,000 × g for 10 minutes) and filter through a 0.22 µm membrane to remove cells, large debris, and apoptotic bodies before loading the sample into the microfluidic device [51] [4].
- Optimize Sample Introduction: If clogging persists, further dilute the pre-processed sample with a compatible buffer (e.g., PBS). Alternatively, explore devices that incorporate on-chip pre-filters or use techniques less susceptible to clogging, such as viscoelastic flow separation [4].
- Avoid Overloading: Do not exceed the recommended sample volume or particle concentration for your specific device. Overloading accelerates fouling and compromises assay performance.
FAQ 2: We are observing low exosome recovery and capture efficiency in our affinity-based microfluidic chip. How can we improve this?
Low recovery in affinity-based systems (e.g., those using anti-CD63 or anti-CD81 antibodies) can stem from several factors related to binding kinetics and device operation.
- Verify Antibody Function and Concentration: Ensure the antibodies conjugated to the chip surface are specific, active, and used at an optimal density. The capture surface should have a high density of antibodies to maximize interaction with exosomal surface markers like tetraspanins (CD9, CD63, CD81) [49] [52].
- Optimize Flow Rate and Incubation Time: Excessive flow rates can reduce the contact time between exosomes and the capture surface, preventing effective binding. Use lower, controlled flow rates during the loading and capture phase to enhance binding efficiency. If possible, incorporate a stopped-flow incubation period to allow for sufficient interaction [49].
- Consider Hybrid Methods: For higher throughput and recovery, consider platforms that combine affinity capture with other forces. For example, one documented platform uses acoustic wave-assisted mixing to increase the interaction between exosomes in solution and magnetic beads, significantly improving capture efficiency [49].
FAQ 3: The signal-to-noise ratio in our on-chip fluorescence detection is poor. What steps can we take to enhance detection sensitivity?
Poor signal can be caused by inefficient labeling, non-specific binding, or suboptimal detector settings.
- Validate Labeling Protocol: Confirm that the fluorescent dye is effectively incorporating into the exosomes. Remove unincorporated dye using size-exclusion spin columns to reduce high background noise [52].
- Include Rigorous Controls: Implement controls to identify and minimize non-specific binding. Use isotype control antibodies to establish a baseline for background fluorescence. Adding a blocking step with BSA or other blocking agents can reduce non-specific adsorption to the chip surface [52].
- Integrate Signal Amplification: Explore advanced detection modalities integrated into microfluidic platforms. Chemiluminescence, for instance, which couples capture on gold nanoparticles (AuNPs) with a chemiluminescent reaction, has been shown to achieve a wide dynamic range and low detection limits, potentially offering superior performance over standard fluorescence [49].
FAQ 4: How can we ensure our microfluidic isolation method yields exosomes pure enough for downstream functional analysis or therapeutic development?
Purity is paramount, especially for therapeutic applications. The choice of isolation method and careful process control are essential.
- Employ a Multi-Modal Approach: No single method is perfect. A common strategy is to use a combination of techniques. For example, sequential processing using ultrafiltration to concentrate samples followed by high-resolution size-exclusion chromatography (SEC) or density gradient purification on-chip can significantly enhance purity by removing co-isolated proteins and other contaminants [51] [50] [4].
- Leverage High-Purity Microfluidic Modes: Prefer microfluidic isolation methods known for high purity. Deterministic lateral displacement (DLD) and acoustic-based separation are label-free techniques that can separate particles based on size with high resolution, reducing contamination [4].
- Implement In-process Quality Control: Characterize the isolated exosomes directly on the chip if possible, or use orthogonal methods post-isolation. Techniques like nanoparticle tracking analysis (NTA) for size/concentration and western blot for marker expression (CD63, CD81, TSG101) and absence of negative markers (e.g., Calnexin) are essential for verifying purity and identity [51] [52].
FAQ 5: Our automated, high-throughput system suffers from poor reproducibility. What are the key factors to standardize?
Reproducibility is a major challenge in exosome research and can be addressed through rigorous standardization.
- Standardize Pre-analytical Variables: Control factors such as sample collection tubes, time-to-processing, storage conditions (snap-freeze at -80°C), and buffer composition across all experiments. These variables significantly impact exosome integrity and yield [51].
- Calibrate Instrumentation and Use Controls: Perform regular calibration of pumps, valves, and detectors in your automated system. Include a positive control (e.g., exosomes from a well-characterized cell line) in every run to monitor system performance and batch-to-batch variability [53] [52].
- Adhere to Reporting Guidelines: Follow the Minimal Information for Studies of Extracellular Vesicles (MISEV) guidelines to ensure your experiments are well-documented and reproducible. This includes detailed reporting of isolation and characterization methods [49] [53].
Experimental Protocol: On-Chip Exosome Isolation and Quantification via Immunoaffinity Capture
This protocol provides a detailed methodology for isolating and quantifying exosomes from cell culture supernatant using a microfluidic chip functionalized with CD63 antibodies.
Materials and Reagent Setup
Table 2: Research Reagent Solutions for Immunoaffinity Capture
| Reagent/Material | Function | Example Product / Specification |
|---|---|---|
| CD63-Functionalized Microfluidic Chip | Specific capture of CD63-positive exosomes | In-house fabricated or commercial chip with anti-CD63 surface [49] |
| Dynabeads Magnetic Beads (alternative) | Flexible, automatable capture of exosome sub-populations | Exosome-Human CD63 Isolation/Detection Reagent [52] |
| Phosphate-Buffered Saline (PBS) | Washing and dilution buffer; maintains physiological pH and osmolarity | Sterile-filtered, 1X, pH 7.4 |
| Blocking Buffer | Reduces non-specific binding to the chip surface | 1-5% Bovine Serum Albumin (BSA) in PBS |
| Fluorescent Detection Antibody | Labels captured exosomes for quantification | e.g., Anti-CD81 or Anti-GPC-1 antibody conjugated to a fluorophore (e.g., FITC) [49] |
Step-by-Step Procedure
- Chip Preparation: Flush the CD63-functionalized microfluidic channel with PBS at a low flow rate (e.g., 10 µL/min) for 5 minutes to prime the system. Then, load the blocking buffer (1% BSA in PBS) and incubate for 30 minutes at room temperature to passivate the surface. Flush with PBS again to remove excess blocker.
- Sample Preparation: Collect cell culture conditioned media (CCM) from SK-MES-1 cells (or your cell line of interest). Perform differential centrifugation: first at 300 × g for 10 min to remove cells, then at 2,000 × g to remove dead cells and debris. Filter the supernatant through a 0.22 µm syringe filter [51].
- On-Chip Isolation: Load the pre-processed CCM onto the chip using a precision syringe pump at a controlled, slow flow rate (e.g., 5-10 µL/min) to maximize binding efficiency. Collect the flow-through.
- Washing: Pass at least 5 channel volumes of PBS through the chip at a slightly higher flow rate (e.g., 20 µL/min) to remove unbound and non-specifically bound particles.
- On-Chip Detection and Quantification:
- Immunofluorescence: Introduce a fluorescently-labeled detection antibody (e.g., anti-CD81-FITC) diluted in blocking buffer. Incubate for 30-60 minutes in a stopped-flow regime. Wash with PBS to remove unbound antibody. Use integrated microscopy or an external fluorescence detector to image and count the captured, labeled exosomes on the chip surface [49].
- Alternative Detection: For chips without integrated optics, elute the captured exosomes using a low-pH buffer (e.g., 0.1 M glycine, pH 2.5-3.0) and immediately neutralize. The eluate can then be characterized using orthogonal methods like nanoparticle tracking analysis (NTA) or western blot [52].
The following workflow diagram illustrates the key steps of this protocol:
Essential Research Reagent Solutions
The following table lists key materials essential for experiments in this field.
Table 3: Essential Research Reagent Solutions for Microfluidic Exosome Research
| Reagent/Material | Function | Specifications & Notes |
|---|---|---|
| Exosome-Depleted FBS | Used in cell culture media to prevent confounding exosomes from serum in CCM. | ≥90% exosome depletion is critical; ensures secreted exosomes are cell-derived [52]. |
| Total Exosome RNA & Protein Isolation Kit | Co-isolation of RNA and protein from pre-enriched exosomes for multi-omic analysis. | Compatible with eluates from various isolation methods, including microfluidics [52]. |
| Microfluidic Chip (Affinity-based) | Core platform for integrated capture and analysis. | Can be pre-conjugated with antibodies (CD63, CD81, EpCAM) or require user functionalization [49] [4]. |
| Fluorescently-Labeled Antibodies | Detection and characterization of captured exosomes via on-chip immunoassays. | Target surface markers (e.g., CD9, CD81) or disease-specific biomarkers (e.g., PD-L1, HER2) [49] [52]. |
| Magnetic Beads (for automated platforms) | Enable automatable, high-throughput exosome sub-population isolation on systems like KingFisher. | Beads pre-conjugated with antibodies or streptavidin for use with biotinylated antibodies [52]. |
Overcoming Isolation Hurdles: Strategies for Maximizing Purity, Yield, and Biomarker Integrity
Technical Support Center
Frequently Asked Questions (FAQs)
Q1: Why are lipoproteins and albumin the most common contaminants in exosome isolates?
Lipoproteins and albumin are major contaminants due to their high abundance in biological fluids like plasma and serum, and their physical properties overlap with those of exosomes [54].
- Albumin is the most abundant free protein in plasma and can co-elute or co-precipitate with exosomes in various isolation methods [54].
- Lipoproteins, such as LDL and HDL, have sizes and densities that significantly overlap with those of exosomes, making them particularly challenging to separate based on these physical properties alone [54] [55]. For example, separating by size leads to co-isolation of larger lipoproteins, while separating by density leads to co-isolation of HDL particles [55].
Q2: What are the specific downstream impacts of these contaminants?
Contaminants can severely compromise experimental results and applications [54] [55]:
- Proteomic Analysis: Co-isolated proteins and lipoproteins can mask the true exosomal protein signature, leading to incorrect biological interpretations and hindering biomarker discovery [54].
- Functional Studies: Contaminants can cause off-target effects. For instance, polymer-based precipitation kits have been shown to co-isolate contaminants that cause cell death in macrophage cultures, an effect not seen with purer exosome preparations [55].
- Therapeutic Development: The presence of contaminants of human origin, such as lipoproteins from plasma, poses a significant risk for the safety and efficacy of exosome-based therapeutics [55].
Q3: How can I quantitatively assess the purity of my exosome preparation?
Traditional methods like nanoparticle tracking analysis (NTA) cannot differentiate between exosomes and similarly sized impurities [54]. The recommended approach is to use specific assays to quantify both exosome markers and contaminant markers:
- Exosome Markers: Quantify transmembrane tetraspanins (e.g., CD9, CD63, CD81) using digital ELISA or western blot [54].
- Contaminant Markers: Quantify albumin (for free proteins) and ApoB-100 (for LDL, IDL, and VLDL lipoproteins) using specific assays [54].
- Purity Calculation: Purity can be expressed as the ratio of the exosome yield (measured by tetraspanins) to the amount of albumin or ApoB-100 [54].
Q4: My ultracentrifugation-derived exosomes have low yield. Is this a trade-off for higher purity?
Not necessarily. While often considered the "gold standard," differential ultracentrifugation (dUC) has several drawbacks. It is known to cause exosome damage, aggregation, and fusion, which can lead to lower functional yield and skewed results [55]. Furthermore, dUC can still co-isolate contaminants with similar density, such as high-density lipoproteins (HDLs) [55]. Therefore, the low yield may not be a simple trade-off for purity but could also be due to mechanical damage and inefficiency in the isolation process itself.
Q5: Which isolation method provides the best balance for diagnostic research?
For diagnostic research requiring high-purity exosomes from liquid biopsies, Size Exclusion Chromatography (SEC) is often the most suitable starting point [55]. It is a gentle, quick (about 15 minutes), and reproducible method that preserves exosome integrity and functionality [56] [55]. It effectively removes the majority of soluble protein contaminants like albumin [56] [55]. However, for samples rich in lipoproteins (like plasma), a single SEC step may not be sufficient, and a combination with a second technique (e.g., cation-exchange chromatography) might be necessary for the highest purity requirements [54] [55].
Troubleshooting Guides
Problem: High Albumin Contamination in Isolated Exosomes
Potential Causes and Solutions:
- Cause 1: Inefficient separation during size-based isolation.
- Cause 2: Polymer from precipitation kits co-precipitating with proteins.
- Solution: If using a polymer-based precipitation kit, the inherent design leads to high protein co-isolation [5]. Consider switching to a different method like SEC or affinity capture for higher purity. If you must use precipitation, include extensive washing steps and validate purity with contaminant assays.
Problem: Persistent Lipoprotein Contamination in Plasma-Derived Exosomes
Potential Causes and Solutions:
- Cause: The size and density of lipoproteins (e.g., VLDL, LDL, HDL) overlap with those of exosomes, making them difficult to remove with a single technique [54] [55].
- Solution 1: Dual-Mode Chromatography (DMC). Combine SEC with a cation-exchange resin in the same column. Since ApoB-100 (on LDL/VLDL) is positively charged and most EVs are negatively charged, this combination can significantly deplete lipoproteins while retaining EVs [54].
- Solution 2: Density Gradient Ultracentrifugation (DGU). This method can separate EVs from ApoB-100-containing lipoproteins based on their differing buoyant densities [54]. However, it is time-consuming and has lower throughput.
- Solution 3: Multi-step purification. For the highest purity, combine two methods, such as SEC followed by density gradient ultracentrifugation or ultrafiltration [5] [55].
Quantitative Data on Isolation Performance
The following tables summarize key performance metrics for various isolation methods, highlighting the purity vs. yield trade-off.
Table 1: Performance Comparison of Common Exosome Isolation Methods Regarding Contaminants [5]
| Method | Principles | Purity Relative to Contaminants | Recovery/Yield | Key Advantages | Key Disadvantages |
|---|---|---|---|---|---|
| Differential Ultracentrifugation (dUC) | Size & Density | Medium | Low | Widely used; suitable for functional studies | Time-consuming; can cause exosome damage; co-isolates density-similar lipoproteins (e.g., HDL) |
| Density Gradient Centrifugation | Buoyant Density | High | Low | High purity; separates EVs from non-vesicle particles | Time-consuming; low throughput; low yield |
| Size Exclusion Chromatography (SEC) | Size | High | Relatively Low | High purity from proteins; gentle; preserves biological activity; fast | Co-isolates similarly-sized particles (e.g., large lipoproteins) |
| Ultrafiltration | Size | Low | High | Simple; time-saving; high yield | Low purity; membrane clogging; potential shear stress |
| Polymer Precipitation | Solubility | Low | Relatively High | Simple; commercial kits; suitable for large volumes | Co-isolates non-EV particles (e.g., lipoproteins, proteins) |
| Immunoaffinity Capture | Specific Binding | High (for specific subpopulations) | Relatively Low | High specificity; can isolate subpopulations | Expensive; only isolates a subset of EVs; low yield |
Table 2: Quantitative Performance of Advanced and Emerging Isolation Techniques
| Method | Reported Yield | Reported Purity / Contaminant Removal | Processing Time | Sources |
|---|---|---|---|---|
| SE-FPLC (Size Exclusion-Fast Protein Liquid Chromatography) | 88.47% recovery | Effectively removes albumin and lipoprotein complexes | < 20 min (total process ~1 hr) | [56] |
| Dual-Mode Chromatography (DMC) | Lower EV yield than SEC alone (some CD9+ EV loss) | Significantly depletes ApoB-100 (lipoproteins) | N/A | [54] |
| Tri-Mode Chromatography (TMC) | Lower EV yield than SEC alone | Depletes both albumin and ApoB-100 | N/A | [54] |
| Phosphatidylserine (PS) Affinity (MagCapture) | ~1-2 x 10^10 particles/mL from K562 cells | Higher purity and recovery than ultrafiltration or antibody-based affinity | ~3.5 hours | [57] |
Detailed Experimental Protocols
Protocol 1: Isolating High-Purity Exosomes from Plasma using Combined SEC and Cation-Exchange (DMC)
This protocol is adapted from research to maximize the removal of both free proteins and lipoproteins [54].
Principle: Combines separation by size (to remove proteins) and by charge (to remove positively-charged ApoB-100 lipoproteins) in a single column.
Materials:
- Chromatography System: Such as AKTA pure (Cytiva).
- Resins: Sepharose CL-6B (for SEC) and Cation Exchange Resin (e.g., Capto SP ImpRes).
- Buffers: Phosphate-Buffered Saline (PBS), pH 7.4.
Procedure:
- Column Preparation: Construct a column with a 2 mL bottom layer of cation-exchange resin and a 10 mL top layer of Sepharose CL-6B resin.
- Equilibration: Equilibrate the column with at least 10 mL of PBS to remove ethanol and storage buffers.
- Sample Preparation: Centrifuge plasma at 2,000 x g for 10 minutes to remove cells and debris. Filter the supernatant through a 0.22 µm filter.
- Sample Loading: Load up to 500 µL of pre-processed plasma onto the column.
- Elution: Elute with PBS and collect 0.5 mL fractions.
- Fraction Analysis: The first peak (early eluting fractions, typically fractions 9-12) will contain exosomes. The second peak will contain soluble proteins. Quantify exosome markers (CD9, CD81, CD63) and contaminants (Albumin, ApoB-100) in each fraction to identify the purest exosome fractions [54].
Protocol 2: Rapid, High-Yield EV Isolation using SE-FPLC
This protocol describes a scalable method for rapid isolation with high recovery [56].
Principle: Uses a high-performance size exclusion chromatography system for fast and efficient separation.
Materials:
- System: AKTA pure 25 chromatography system (Cytiva) or similar FPLC system.
- Column: IZON qEV10 column (or similar large-scale SEC column).
- Buffers: PBS or other compatible buffer.
Procedure:
- System Setup: Install the SEC column and equilibrate according to the manufacturer's instructions.
- Sample Preparation: Centrifuge cell culture supernatant or other samples at 2,000 x g and 10,000 x g to remove cells and debris. Filter through a 0.22 µm filter.
- Loading and Elution: Load the sample (volumes up to 100 mL possible) and elute with an isocratic buffer at a constant flow rate.
- Fraction Collection: Use UV monitoring at 280 nm. The first peak is EV-enriched, and the second peak is protein-contaminant enriched. Collect the first peak.
- Validation: Validate isolates via nanoparticle tracking analysis (NTA), western blot for EV markers (CD81, syntenin-1) and absence of non-EV markers (GAPDH, Histone H3, GM130), and cryo-EM for morphology [56].
Isolation Workflow and Contaminant Analysis
The following diagram illustrates the core decision-making process for selecting an isolation strategy based on purity requirements and sample type, as discussed in the FAQs and troubleshooting guides.
Research Reagent Solutions
Table 3: Essential Research Tools for Exosome Isolation and Purity Assessment
| Reagent / Tool | Function / Principle | Example Use Case |
|---|---|---|
| qEV Size Exclusion Columns | Commercial SEC columns for standardized, high-purity EV isolation from various sample volumes. | Isolating intact, functional exosomes from cell culture supernatant or plasma for downstream functional studies [55]. |
| Dynabeads Magnetic Beads | Magnetic beads conjugated to antibodies (e.g., anti-CD9, CD63, CD81) for immunoaffinity capture of exosome subpopulations. | Isolating a specific subset of exosomes for proteomic analysis or to study a particular biological function [21]. |
| MagCapture Exosome Isolation Kit PS | Isolates EVs via affinity for phosphatidylserine (PS) on the EV membrane, using a Tim4 protein, in a calcium-dependent manner. | A non-antibody-based affinity method for isolating a broad range of PS-positive EVs under mild, neutral elution conditions [57]. |
| Simoa (Single Molecule Array) Assays | Digital ELISA technology for ultrasensitive quantification of protein biomarkers. | Simultaneously measuring exosome tetraspanins (CD9, CD63, CD81) and contaminants (Albumin, ApoB-100) to precisely calculate isolation purity and yield [54]. |
| Anti-Tetraspanin Antibodies (CD9, CD63, CD81) | Antibodies for detecting canonical exosome surface markers via western blot, flow cytometry, or ELISA. | Confirming the presence of exosomes in isolated fractions and characterizing the isolate [21] [4]. |
| Anti-Non-EV Marker Antibodies (GM130, Calnexin, Histone H3) | Antibodies for detecting proteins associated with intracellular organelles (Golgi, ER, nucleus) to assess contamination. | Verifying the absence of co-isolated cellular debris and confirming isolation purity [56] [21]. |
Exosomes, small extracellular vesicles ranging from 30-150 nm in diameter, are secreted by nearly all cell types and play vital roles in intercellular communication by transferring proteins, lipids, and nucleic acids [52] [27]. Their isolation from biological samples represents a critical first step in diagnostic research and therapeutic development. The selection of an appropriate isolation method directly impacts the yield, purity, and functional integrity of recovered exosomes, thereby influencing all subsequent analytical results [11] [58]. This guide provides a structured approach to matching isolation techniques with specific sample types and downstream applications, framed within the context of improving diagnostic reproducibility and accuracy.
No single isolation method is perfect for all scenarios; each technique presents distinct trade-offs between purity, yield, processing time, and technical requirements [11] [59]. For diagnostic applications, the optimal method balances these factors while minimizing contaminants that could interfere with biomarker detection or functional analysis. This guide synthesizes current methodologies into a practical framework to help researchers navigate these complex decisions based on their specific sample characteristics and research objectives.
Comparative Analysis of Exosome Isolation Methods
Technical Principles and Performance Metrics
Table 1: Comprehensive comparison of major exosome isolation techniques
| Method | Principle | Purity | Yield | Processing Time | Cost | Technical Demand | Sample Volume Flexibility |
|---|---|---|---|---|---|---|---|
| Ultracentrifugation (UC) | Size/density via high g-force | High | Medium | Long (4-12+ hours) | Medium | High | Large volumes preferred |
| Density Gradient Centrifugation | Buoyant density separation | Very High | Low | Very Long (up to 2 days) | Medium-High | High | Limited |
| Size-Exclusion Chromatography (SEC) | Size-based separation through porous matrix | Medium-High | Medium | Short (≤1 hour) | Medium | Medium | Small to medium |
| Polymer-Based Precipitation | Solubility reduction via polymers | Low | High | Medium (1-4 hours) | Low | Low | High flexibility |
| Immunoaffinity Capture | Antibody-antigen interaction | Very High | Low | Medium (1-2 hours) | High | Medium | Small volumes |
| Ultrafiltration | Size-based membrane separation | Medium | Medium-High | Short (≤1 hour) | Low-Medium | Low | Large volumes |
| Microfluidic Technologies | Size/affinity via chip-based systems | High | Medium | Very Short (minutes) | High | High | Small volumes |
Quantitative Method Performance Across Applications
Table 2: Performance ratings of isolation methods for key downstream applications
| Method | Protein Analysis | Nucleic Acid Studies | Functional Studies | Biomarker Discovery | High-Throughput Screening |
|---|---|---|---|---|---|
| Ultracentrifugation | Excellent | Good | Good [58] | Good | Poor |
| Density Gradient | Excellent | Excellent | Excellent [59] | Excellent | Poor |
| SEC | Good | Excellent | Excellent [11] [59] | Good | Fair |
| Precipitation | Fair | Fair | Poor [59] | Fair | Good |
| Immunoaffinity | Excellent* | Good* | Good* [52] | Excellent* | Fair |
| Ultrafiltration | Good | Good | Fair [4] | Good | Good |
| Microfluidic | Good | Excellent | Excellent [27] | Excellent | Excellent |
Note: Immunoaffinity methods provide excellent results for specific subpopulations but may not represent the total exosome population.
Sample-Specific Considerations and Protocols
Plasma and Serum Samples
Plasma and serum represent complex matrices for exosome isolation due to their high concentrations of proteins, lipoproteins, and other contaminants that co-precipitate with exosomes [59]. The viscosity of these samples necessitates specific adaptations to standard protocols.
Key considerations:
- Major contaminants: Lipoproteins (especially HDL and LDL), protein aggregates, and coagulation factors [59] [58]
- Recommended methods: SEC, immunoaffinity capture, or density gradient centrifugation for high-purity requirements; precipitation methods for rapid screening when purity is less critical [59]
- Sample preparation: Pre-clearing steps including centrifugation at 16,000 × g for 30 minutes to remove microparticles and debris [4]
Protocol: Size-Exclusion Chromatography for Plasma
- Collect blood in EDTA or citrate tubes and process within 1 hour to minimize exosome degradation
- Centrifuge at 2,000 × g for 30 minutes to obtain platelet-free plasma
- Centrifuge at 16,000 × g for 30 minutes to remove larger vesicles and debris
- Load 500 μL of pre-cleared plasma onto SEC columns (e.g., EVsec columns)
- Elute with phosphate-buffered saline (PBS) and collect 500 μL fractions
- Exosomes typically elute in fractions 3-5 (determined empirically for each column lot)
- Validate exosome presence by nanoparticle tracking analysis and Western blot for CD63/CD81 [59]
Urine Samples
Urine contains Tamm-Horsfall protein (THP), which can form polymers that co-precipitate with exosomes and interfere with downstream analysis [59]. The relatively low exosome concentration in urine often requires sample concentration.
Key considerations:
- Major contaminants: THP, urea, salts, and metabolites [59]
- Recommended methods: SEC, ultrafiltration, or specialized precipitation kits designed for urine
- Sample preparation: Dithiothreitol (DTT) treatment to dissociate THP polymers prior to isolation [59]
Protocol: Ultrafiltration for Urine
- Collect mid-stream urine and process within 2 hours or store at -80°C with protease inhibitors
- Centrifuge at 17,000 × g for 15 minutes to remove cells and debris
- Add DTT to a final concentration of 5 mM and incubate for 30 minutes at 37°C to dissociate THP
- Concentrate sample using a 100 kDa molecular weight cut-off filter by centrifuging at 4,000 × g
- Apply concentrated sample to a 0.22 μm filter to remove larger particles
- Use tangential flow filtration for higher recovery rates and minimal exosome damage [59] [4]
- Resuspend concentrated exosomes in PBS for downstream applications
Cell Culture Media
Cell culture media presents a simpler matrix but requires consideration of serum-derived exosomes when using fetal bovine serum (FBS) in cell cultures [52].
Key considerations:
- Major contaminants: Serum-derived exosomes, protein aggregates, and cell debris
- Recommended methods: Ultracentrifugation, precipitation, or immunoaffinity capture
- Sample preparation: Use exosome-depleted FBS during cell culture to avoid contamination with bovine exosomes [52]
Protocol: Ultracentrifugation for Cell Culture Media
- Culture cells with exosome-depleted FBS for 48-72 hours before collection
- Centrifuge media at 300 × g for 10 minutes to remove cells
- Centrifuge at 2,000 × g for 20 minutes to remove dead cells and debris
- Centrifuge at 16,000 × g for 30 minutes to remove larger vesicles
- Filter through a 0.22 μm pore filter
- Ultracentrifuge at 100,000-120,000 × g for 70 minutes at 4°C
- Discard supernatant and resuspend pellet in PBS
- Repeat ultracentrifugation step for higher purity [4]
- Resuspend final pellet in 50-200 μL PBS and store at -80°C
Method Selection Workflows
Troubleshooting Common Experimental Issues
Frequently Asked Questions
Q1: Why is my exosome yield lower than expected from plasma samples?
A: Low yield from plasma often results from incomplete pre-clearing or inappropriate storage conditions. Ensure:
- Plasma is processed within 1 hour of collection or stored at -80°C with protease inhibitors
- Sequential centrifugation steps are performed completely (300 × g, 2,000 × g, then 16,000 × g)
- Sample viscosity is addressed by dilution with PBS (1:1) before ultracentrifugation [59] [58]
- Consider switching to SEC if ultracentrifugation consistently gives low yields
Q2: How can I remove Tamm-Horsfall protein from urine exosome preparations?
A: THP contamination can be minimized by:
- Adding DTT to a final concentration of 5 mM with 30-minute incubation at 37°C before isolation
- Using commercial urine exosome isolation kits specifically designed to handle THP
- Implementing a SEC-based purification after initial concentration [59]
Q3: My isolated exosomes show poor functionality in recipient cells. What could be wrong?
A: Loss of functionality may stem from:
- Excessive centrifugal force damaging exosome integrity (avoid forces >120,000 × g for extended periods)
- Harsh elution conditions in immunoaffinity protocols (use mild acidic elution or competitive binding)
- Repeated freeze-thaw cycles (aliquot exosomes and avoid multiple freeze-thaw cycles)
- Contamination with apoptotic bodies or protein aggregates that affect cellular uptake [58]
Q4: How can I confirm my isolation method is effectively separating exosomes from lipoproteins?
A: Verification can be achieved by:
- Performing Western blot analysis for apolipoprotein B (apoB) as a lipoprotein marker
- Using electron microscopy to identify lipoprotein particles by morphology
- Implementing density gradient centrifugation as a reference method for comparison
- Testing with nanoparticle tracking analysis to identify particles outside the exosomal size range [58]
Q5: What is the best way to normalize exosome quantities between samples?
A: Avoid relying solely on protein concentration, which can be influenced by co-isolated contaminants. Instead:
- Use nanoparticle tracking to determine particle concentration
- Normalize by the volume of starting material when working with similar sample types
- For cell culture experiments, normalize by cell number and collection time
- Consider spiking with a known quantity of reference exosomes during isolation for quantitative recovery assessment [21]
Research Reagent Solutions
Table 3: Essential reagents and tools for exosome research
| Reagent/Tool | Function | Examples/Specifications | Application Notes |
|---|---|---|---|
| Exosome-depleted FBS | Cell culture supplement without bovine exosomes | Gibco exosome-depleted FBS (≥90% depletion) [52] | Essential for clean cell culture-derived exosome preparations |
| Tetraspanin Antibodies | Exosome detection and capture | Anti-CD63, CD81, CD9 antibodies [52] [21] | Key markers for exosome identification; no single marker universal |
| Magnetic Bead Systems | Immunoaffinity isolation | Dynabeads conjugated to CD63, CD81, CD9 [52] | Enable specific subpopulation isolation; different bead concentrations for different applications |
| Isolation Kits | Method-specific exosome isolation | Total Exosome Isolation kits (precipitation-based) [52] | Optimized for different sample types (serum, urine, cell culture) |
| SEC Columns | Size-based separation | EV SEC Columns, qEV columns [59] | Preserves vesicle integrity; ideal for functional studies |
| Characterization Panel | Multi-parameter exosome verification | Abcam exosome panel (Calnexin, CD9, CD63, CD81, Hsp70, TSG101) [4] | Confirms exosomal markers while checking for cellular contaminants |
Selecting the appropriate exosome isolation method requires careful consideration of sample type, downstream application, and required purity. No single method excels in all categories, necessitating strategic trade-offs based on research priorities. For diagnostic applications where biomarker accuracy is paramount, methods offering higher purity (SEC, density gradient centrifugation, immunoaffinity) are generally preferred despite their potentially lower yields or higher technical demands. As the field advances toward clinical applications, standardization of isolation protocols across laboratories will be essential for generating comparable and reproducible data. By applying the principles outlined in this guide, researchers can make informed decisions that optimize their exosome isolation strategy for specific diagnostic research objectives.
Exosomes, small extracellular vesicles (EVs) with diameters of 30-150 nm, are secreted by virtually all cell types into biofluids and play essential roles in intercellular communication by transferring proteins, lipids, and nucleic acids [14] [7] [15]. Their molecular composition reflects the physiological state of parent cells, making them invaluable for diagnostic and therapeutic applications [8] [7]. However, the reliability of exosome-based data is highly dependent on pre-analytical variables—the procedures for sample collection, processing, and storage [60] [61].
Poor sample preparation remains a top reason for failed or suboptimal results in exosome research, with over 50% of sample failures tracing back to errors in early-stage handling [60]. Exosomal RNA (exoRNA) is particularly vulnerable due to its low abundance, small fragment size, and susceptibility to degradation from delays in processing or improper freezing [60]. This technical support article provides evidence-based troubleshooting guides and FAQs to help researchers optimize these critical pre-analytical steps, framed within the broader context of improving exosome isolation for diagnostic research.
Core Principles of Exosome Sample Integrity
Key Vulnerabilities and Protective Strategies
Exosome integrity during pre-processing is compromised by several key factors. Prolonged processing times lead to vesicle degradation and release of contaminating biomolecules from blood cells [60]. Inappropriate anticoagulants like heparin can inhibit downstream PCR and NGS workflows [60]. Inadequate storage temperatures and repeated freeze-thaw cycles cause irreversible damage to exosome structure and cargo [60] [15]. Sample contamination from cellular debris, platelets, or lipoproteins interferes with both isolation and analysis [11] [61].
Protective strategies include: processing plasma samples within 2 hours of collection [60]; using EDTA tubes instead of heparin for blood collection [60]; aliquoting samples into single-use volumes before storage at -80°C [60] [15]; and employing rapid freezing methods with cryoprotectants to maintain exosome stability [15].
Sample Type-Specific Collection & Processing Protocols
Table 1: Optimized Collection and Processing Parameters by Sample Type
| Sample Type | Recommended Collection Tube | Optimal Processing Timeline | Critical Processing Steps | Storage Temperature |
|---|---|---|---|---|
| Plasma | EDTA (lavender top) [60] | Centrifuge within 2 hours of collection [60] | Two-step centrifugation: 1. 2,000 × g for 30 min to remove cells; 2. 10,000 × g for 40 min to remove platelets [11] | -80°C in single-use aliquots [60] |
| Urine | Sterile container [60] | Centrifuge to remove cells/debris within 1 hour [60] | Centrifuge at 2,000 × g for 30 min; add preservatives if delays expected [60] | -80°C [60] |
| Saliva | Collection kits with RNase inhibitors [60] | Process immediately or freeze immediately [60] | Centrifuge at 2,000 × g for 10 min; use specific saliva collection kits [60] | -80°C with RNase inhibitors [60] |
| Cell Culture Supernatant | N/A | Collect at predefined timepoints [60] | Centrifuge at 2,000-3,000 × g to remove cell debris; optional filtration [60] | -80°C [60] |
Experimental Workflow for Sample Processing
The following diagram illustrates the complete workflow for handling exosome samples from collection to storage, incorporating critical control points to maintain sample quality.
Sample Processing Workflow: This diagram outlines the critical path for handling exosome samples, with yellow nodes indicating key action steps and red annotations highlighting crucial quality control timelines and procedures.
Storage and Stability Optimization
Table 2: Exosome Storage Conditions and Stability Guidelines
| Storage Method | Temperature | Recommended Duration | Key Considerations | Impact on Exosome Integrity |
|---|---|---|---|---|
| Short-term | 4°C [15] | Up to 1 week [15] | Suitable for immediate processing; not recommended for long-term storage | Maintains integrity for brief periods; risk of degradation after several days |
| Medium-term | -20°C [15] | Weeks to months [15] | Acceptable for intermediate storage | Preserves basic structure but may not maintain full biological activity |
| Long-term | -80°C [60] [15] | Months to years [15] | Preferred method; use single-use aliquots to avoid freeze-thaw cycles | Best preservation of structural integrity and bioactive molecules [60] |
| Lyophilization | Room temperature [15] | Long-term (months to years) [15] | Requires rehydration before use; may use cryoprotectants | Maintains stability at room temperature; requires validation of functional recovery |
Troubleshooting Guides and FAQs
Common Pre-Analytical Challenges and Solutions
Q: My exosome isolation yields are lower than expected. What pre-analytical factors should I investigate?
A: Low yields often trace back to pre-analytical issues:
- Check sample freshness: Ensure starting material is processed promptly according to recommended timelines in Table 1 [60] [15].
- Verify processing protocols: Confirm correct centrifugation speeds and durations were used [11].
- Evaluate storage conditions: Avoid repeated freeze-thaw cycles; use single-use aliquots stored at -80°C [60] [15].
- Assess sample quality: For biofluids like plasma, ensure proper separation from cellular components during initial processing [60].
Q: The isolated exosomes appear contaminated with proteins. How can I improve purity?
A: Contamination typically arises from:
- Incomplete removal of platelets and cellular debris: Implement the two-step centrifugation protocol outlined in Table 1 [11].
- Co-precipitation of non-vesicular particles: When using polymer-based precipitation, add purification steps like size-exclusion chromatography [8] [11].
- Lipoprotein contamination: Consider size-exclusion chromatography as it efficiently removes albumin and reduces lipoprotein co-isolation [8] [61].
Q: How can I prevent exosomal RNA degradation during sample processing?
A: exoRNA is highly vulnerable to degradation:
- Use RNase-free consumables: Implement strict RNase-free techniques with sterile tubes, tips, and filters [60].
- Add RNase inhibitors: Particularly important for saliva samples which contain abundant RNases [60].
- Minimize processing delays: Process samples within recommended timelines and freeze immediately at -80°C [60].
- Avoid heparin tubes: Heparin inhibits downstream PCR and NGS workflows; use EDTA tubes instead [60].
Q: What is the impact of freeze-thaw cycles on exosome quality?
A: Multiple freeze-thaw cycles significantly impact exosome integrity:
- Structural damage: Repeated freezing and thawing can damage exosome membranes, leading to content leakage [15].
- Loss of functionality: Biological activity may be compromised even if structural appearance remains [15].
- Best practice: Aliquot samples into single-use volumes before initial freezing to avoid repeated thawing [60] [15].
- Thawing protocol: Thaw quickly at 37°C and immediately place on ice; avoid room temperature thawing [15].
The Scientist's Toolkit: Essential Research Reagent Solutions
Table 3: Key Reagents and Kits for Exosome Sample Preparation
| Reagent/Kit Type | Specific Examples | Function | Considerations |
|---|---|---|---|
| Blood Collection Tubes | EDTA tubes (lavender top) [60] | Prevents coagulation while maintaining exosome integrity | Avoid heparin tubes which inhibit downstream molecular applications [60] |
| RNase Inhibitors | Commercial RNase inhibition cocktails | Prevents degradation of exosomal RNA | Critical for saliva and urine samples with high RNase content [60] |
| Protease Inhibitors | Commercial protease inhibitor cocktails | Prevents protein degradation in exosome samples | Important for proteomic analysis of exosomal cargo |
| Exosome Isolation Kits | Polymer-based precipitation kits [8] [62] | Facilitates exosome precipitation from large-volume samples | May co-precipitate contaminants; requires optimization [8] |
| Cryoprotectants | Trehalose, DMSO | Protects exosomes during freezing process | Helps maintain structural integrity during long-term storage [15] |
Impact of Pre-Analytical Variables on Downstream Applications
The careful management of pre-analytical steps directly influences the success of diagnostic applications and research outcomes. Inconsistent handling can alter exosome surface markers, cargo composition, and functionality, leading to unreliable results [60] [63]. For example, delays in processing plasma samples can increase contamination from cell-free RNA released from lysed blood cells, complicating the interpretation of exosomal RNA sequencing data [60]. Similarly, improper storage conditions may affect the detection of protein biomarkers used in diagnostic assays [15].
Adherence to standardized protocols for sample collection, processing, and storage is particularly crucial for the development of exosome-based diagnostics, where reproducibility and reliability are paramount for clinical translation [11] [63]. The Minimal Information for Studies of Extracellular Vesicles (MISEV) guidelines from the International Society for Extracellular Vesicles (ISEV) provide comprehensive recommendations for reporting exosome research to enhance reproducibility [11].
Optimizing pre-analytical steps is foundational to generating reliable, reproducible exosome data for diagnostic research. By implementing the standardized protocols, troubleshooting guides, and best practices outlined in this technical support article, researchers can significantly improve exosome quality, enhance experimental outcomes, and advance the field of exosome-based diagnostics. Consistency in sample handling, coupled with rigorous quality control measures, will accelerate the translation of exosome research from the laboratory to clinical applications.
For researchers in diagnostics and drug development, the quality of exosome isolation directly dictates the reliability of subsequent proteomic analysis. The inherent heterogeneity of exosomes and the complexity of biological fluids make a single isolation technique often insufficient. Hybrid workflows, which combine the robust yield of ultracentrifugation with the high purity of size-exclusion chromatography (SEC), are emerging as a powerful solution to overcome these challenges, providing the superior sample quality required for comprehensive and reproducible proteomics.
FAQs on Hybrid Isolation Workflows
1. Why should I combine Ultracentrifugation with SEC instead of using one method alone?
Using a single method often forces a trade-off between yield and purity. Ultracentrifugation (UC) is considered the "gold standard" and provides high yield but can co-isolate non-vesicular contaminants like protein aggregates and lipoproteins [5] [8]. SEC, on the other hand, excels at providing high-purity exosomes free from these soluble contaminants while maintaining biological activity and integrity [5]. Combining them leverages the strengths of both: UC serves as an excellent initial concentration step, and SEC subsequently polishes the sample to a high purity, which is crucial for sensitive downstream proteomics [5] [8].
2. What are the primary challenges in exosome proteomics that hybrid workflows address?
The main challenges are contamination and exosome damage, which lead to unreliable proteomic data.
- Contaminants: Standard UC isolates can be contaminated with soluble proteins and lipoproteins, which can mask lower-abundance exosomal proteins in mass spectrometry analysis [5] [8].
- Exosome Integrity: Harsh mechanical forces during UC can damage exosomes, affecting their morphological integrity and potentially leading to cargo leakage [5]. The gentler SEC step in a hybrid workflow helps maintain exosome integrity.
3. For which applications is a UC-SEC workflow most beneficial?
This workflow is particularly advantageous for applications requiring high-purity exosomes and deep molecular characterization, including:
- Biomarker Discovery: Identifying disease-specific protein signatures from patient biofluids [64] [8].
- Drug Delivery System Characterization: Analyzing the protein composition of engineered exosomes [65] [64].
- Functional Studies: Investigating the roles of exosomes in cell-to-cell communication without interference from contaminating proteins [65] [5].
4. How does the hybrid workflow improve results for LC-MS/MS proteomics?
LC-MS/MS for proteomics is highly sensitive and can be easily compromised by contaminants [66]. The hybrid workflow directly improves data quality by:
- Reducing Signal Suppression: Removing polymers, lipids, and abundant soluble proteins (e.g., albumin) that can suppress the ionization of peptides during MS analysis [66].
- Minimizing Keratin Contamination: A purer sample reduces the interference from keratin proteins, a common contaminant in proteomics that can obscure the detection of low-abundance proteins of interest [66].
- Preventing Column Damage: Removing residual salts and aggregates protects the LC column and MS instrumentation from physical damage and clogging [66].
Troubleshooting Guide for Hybrid UC-SEC Workflows
Table 1: Common Issues and Solutions in Hybrid Isolation
| Problem | Potential Cause | Recommended Solution |
|---|---|---|
| Low Overall Yield | Excessive exosome loss during transfers between steps; over-drying samples. | Implement "one-pot" methods where possible; limit sample transfers; avoid completely drying samples during preparation [66]. |
| High Contaminant Levels in SEC Eluent | Overloading the SEC column; improper column equilibration. | Use a dichotomic SEC column (e.g., CL-6B) for better performance; ensure column is equilibrated with >20 column volumes of buffer [5]. |
| Poor LC-MS/MS Data (Noisy Baselines, Extra Peaks) | Polymer contamination (PEGs) from surfactants or labware; keratin contamination. | Avoid surfactant-based cell lysis; use LC-MS grade water and "high-recovery" vials; wear gloves and work in a laminar flow hood to prevent keratin introduction [66]. |
| Clogged SEC Column | Large particles or aggregates from the initial UC pellet. | After UC resuspension, centrifuge the sample at a lower speed (e.g., 10,000 g) to remove large aggregates before loading onto the SEC column [5]. |
| Inconsistent Results Between Replicates | Inconsistent UC pelleting efficiency; variable SEC fraction collection. | Standardize UC rotor types, speeds, and times; carefully collect and record SEC fractions; use exosome standards from commercial providers for quality control [8]. |
Table 2: Quantitative Comparison of Exosome Isolation Methods
This table summarizes the performance of common methods, highlighting the rationale for hybrid approaches. Data is synthesized from general findings in the literature [5].
| Method | Principle | Purity | Yield / Recovery | Pros | Cons |
|---|---|---|---|---|---|
| Differential Ultracentrifugation (UC) | Size & Density | Medium | Low | High sample capacity; widely used. | Time-consuming; can damage exosomes; requires expensive equipment. |
| Size-Exclusion Chromatography (SEC) | Size | High | Relatively Low | Maintains exosome activity and integrity; fast and simple. | Can retain nanoscale contaminants like lipoproteins; volume constraints. |
| Precipitation | Solubility | Low | High | Simple protocol; high yield; commercial kits available. | Co-isolates many impurities (proteins, lipoproteins); polymers can interfere with downstream analysis. |
| Immunoaffinity Capture | Specific Binding | Very High | Low | Can isolate specific exosome subpopulations; extreme purity. | Expensive; low yield; surface marker-dependent. |
| Hybrid UC-SEC | Size, Density & Size | High | Medium | Superior purity for proteomics; good yield; maintains integrity. | More time-consuming than SEC alone; requires multiple instruments. |
Detailed Experimental Protocol: UC-SEC Hybrid Workflow
Sample Preparation and Initial Ultracentrifugation
- Starting Material: Conditioned cell culture media, plasma, or urine. For plasma, pre-clear by centrifugation at 2,000 × g for 30 minutes to remove cells and debris.
- Ultracentrifugation Steps:
- Transfer supernatant to ultracentrifuge tubes. Balance pairs meticulously to prevent imbalances [67].
- Pellet Removal Centrifugation: Centrifuge at 10,000 × g for 30 minutes at 4°C to remove larger vesicles and organelles.
- Exosome Pelletting: Transfer the supernatant to fresh tubes and centrifuge at 100,000 - 120,000 × g for 70-90 minutes at 4°C to pellet exosomes.
- Wash (Optional but Recommended): Resuspend the pellet in a large volume of sterile, cold PBS. Centrifuge again at 100,000 × g for 60-70 minutes to reduce soluble protein contamination [5].
- Resuspension: Carefully resuspend the final pellet in a small volume (e.g., 100-500 µL) of PBS or your chosen SEC running buffer. Avoid vortexing; use gentle pipetting.
Size-Exclusion Chromatography (Polishing Step)
- Column Selection: Use a commercially available SEC column (e.g., qEV series) or pack your own (e.g., with Sepharose CL-6B) [5].
- Equilibration: Equilibrate the column with at least 20 column volumes of degassed, filtered PBS or a suitable buffer [5].
- Sample Loading and Elution:
- Load the resuspended UC pellet onto the column. Do not exceed the recommended sample volume (typically 1-2% of the column volume).
- Elute with buffer and collect sequential fractions. The first turbid or opalescent fraction that elutes will typically contain the exosomes, followed by later fractions containing smaller proteins and contaminants [5] [8].
- Fraction Analysis: Use nanoparticle tracking analysis (NTA) and protein assays (e.g., BCA) to identify the fractions with the highest particle-to-protein ratio, indicating high exosome purity [8].
Downstream Proteomic Analysis Preparation
- Concentration (If Needed): If the SEC fraction is too dilute, use a centrifugal concentrator with a suitable molecular weight cutoff (e.g., 100 kDa) to concentrate the exosomes.
- Lysis and Digestion: Lyse the purified exosomes with a strong detergent (e.g., SDS) or a commercial lysis buffer. Follow standard proteomic protocols for protein reduction, alkylation, and tryptic digestion [66].
- Clean-up: Before LC-MS/MS, use a reversed-phase solid-phase extraction (SPE) step to desalt the peptide mixture and remove any residual contaminants or detergents that could suppress ionization or damage the LC-MS system [66].
Workflow for Hybrid Exosome Isolation and Proteomic Analysis
The Scientist's Toolkit: Essential Research Reagent Solutions
Table 3: Key Materials and Reagents for Hybrid Workflows
| Item | Function | Key Consideration |
|---|---|---|
| SEC Columns (e.g., qEV, Sepharose CL-6B) | Separates particles by size; exosomes elute in early fractions. | Pre-packed columns ensure reproducibility. Column size must be matched to sample volume [5]. |
| Ultracentrifuge & Fixed-Angle Rotor | High-g-force pelleting of nanoscale vesicles. | Proper rotor calibration and balanced loads are critical to prevent vibration and damage [67]. |
| PBS (Phosphate-Buffered Saline) | Washing and resuspension buffer; SEC mobile phase. | Must be sterile, particle-free, and compatible with downstream assays. Use high-quality water to prepare [66]. |
| Protease and Phosphatase Inhibitors | Prevents degradation of exosomal proteins and phosphoproteins. | Add fresh to samples and all buffers before isolation begins. |
| Mass Spectrometry-Grade Water | Used for preparing all buffers and mobile phases for LC-MS. | Essential to prevent polymer and ion contamination that compromise MS data quality [66]. |
| Exosome Standards (e.g., from AMSBio) | Well-characterized exosomes for use as positive controls and QC. | Helps validate isolation efficiency and instrument performance across experiments [8]. |
| "High-Recovery" Low-Bind Tubes | Sample storage and processing. | Engineered surfaces minimize adsorption of exosomes and peptides, maximizing recovery [66]. |
Exosome research holds immense promise for advancing diagnostics and personalized medicine. However, the field faces a significant challenge: a lack of reproducibility across studies. Inconsistent isolation and characterization methods can undermine data reliability, hindering the translation of research into clinical applications. This technical support center provides troubleshooting guides and FAQs to help researchers adhere to international standards, specifically the Minimal Information for Studies of Extracellular Vesicles (MISEV) guidelines, to ensure the rigor and reproducibility of their exosome experiments.
Troubleshooting Guides
Guide 1: Addressing Low Exosome Purity in Isolations
Problem: Isolated exosome samples are contaminated with non-exosomal components like proteins or lipoproteins.
Solution: Implement orthogonal characterization methods and optimize your isolation technique based on your sample type and desired application.
| Symptom | Possible Cause | Solution | Validation Method |
|---|---|---|---|
| High albumin/ApoA1 in Western blot [68] [69] | Co-isolation of soluble proteins or lipoproteins | Switch to a purity-focused method like SEC or density gradient UC [11] [70] | Assess negative markers (ApoA1, albumin) via Simple Western or WB [70] |
| Low specific particle-to-protein ratio | Polymer-based precipitation introducing aggregates [8] | Add a washing step (e.g., PBS filtration) or use SEC for higher purity [11] | NTA for particle count + BCA for protein; calculate ratio [11] |
| Heterogeneous size profile (NTA) | Cell debris or apoptotic bodies | Increase centrifugation speed for pre-clearing or optimize filtration steps [11] | Use NTA to confirm a peak in the 30-150 nm size range [11] |
Guide 2: Inconsistent Yield Across Replicates
Problem: Significant variation in exosome quantity between identical sample processing runs.
Solution: Standardize pre-analytical variables and the isolation protocol meticulously.
| Symptom | Possible Cause | Solution | Validation Method |
|---|---|---|---|
| Variable particle count from same sample type | Inconsistent sample collection or storage | Standardize blood collection tubes, processing time, and storage temperature (-80°C) [68] | NTA to track particle concentration across replicates [11] |
| Low yield after ultracentrifugation | EV pellet loss during aspiration | Resuspend pellet in a consistent, small volume of PBS; use fixed incubation time [70] | NTA to quantify yield against a standardized control [70] |
| Inconsistent fluorescence in flow cytometry | Dye aggregation or non-specific labeling | Titrate lipophilic dyes (e.g., PKH67); use dye removal columns; include controls [68] | Use antibody against a tetraspanin (e.g., CD81) for comparison [68] |
Frequently Asked Questions (FAQs)
FAQ 1: What are the MISEV guidelines, and why are they critical for my research?
The MISEV guidelines are a framework established by the International Society for Extracellular Vesicles (ISEV) to ensure the transparency, rigor, and reproducibility of EV research [71] [68]. Adherence to MISEV is critical because it provides a standardized approach for isolating, characterizing, and reporting on EVs, which helps to ensure that your data is reliable, comparable to other studies, and suitable for peer review and potential clinical translation [68] [69].
FAQ 2: I am new to exosome research. Which isolation method should I start with?
The choice of method depends on your research goals, sample type, and required balance between yield, purity, and throughput [11] [8]. The table below compares the major techniques:
| Isolation Method | Principle | Purity | Yield | Scalability | Best For |
|---|---|---|---|---|---|
| Ultracentrifugation (UC) | Sequential centrifugation based on size/density [11] | High [11] | Medium [11] | Medium [11] | Established protocols; high purity needs [8] |
| Size-Exclusion Chromatography (SEC) | Separation by size through a porous matrix [11] | Medium-High [11] | Medium [11] | High [11] | Preserving vesicle integrity; good purity [8] |
| Polymer-Based Precipitation | Reduced solubility via polymers (e.g., PEG) [11] | Low [11] | High [11] | High [11] | Simple, high-yield needs where purity is less critical [8] |
| Immunoaffinity Capture | Antibody binding to surface markers (e.g., CD63) [11] | Very High [11] | Low [11] | Low [11] | Isolating specific subpopulations of exosomes [11] |
| Tangential Flow Filtration (TFF) | Size-based separation via tangential flow [8] | Medium [11] | High [11] | High [11] | Processing large sample volumes (e.g., conditioned media) [8] |
FAQ 3: According to MISEV2023, what are the minimum characterization requirements for my exosome preparation?
MISEV2023 recommends characterizing EVs based on the following aspects [68] [69]:
- Quantification: Determine particle number and size distribution using techniques like Nanoparticle Tracking Analysis (NTA) [11] [69].
- Composition: Demonstrate the presence of at least three transmembrane (e.g., tetraspanins CD9, CD63, CD81) and/or cytosolic EV-associated proteins (e.g., ALIX, TSG101) from different biochemical categories [68] [69].
- Purity: Show the absence or minimal presence of common contaminants by assessing negative markers such as ApoA1 (for lipoproteins) or albumin (for soluble proteins) [70] [69].
FAQ 4: How can I troubleshoot functional studies where my exosome treatment shows no effect?
First, verify that your observed results (or lack thereof) are truly due to the exosomes and not co-isolated contaminants.
- Control for non-exosomal components: Include controls from the starting material depleted of exosomes (e.g., supernatant after exosome removal) [68].
- Confirm exosome uptake: Use fluorescently labeled exosomes and confirm their internalization by recipient cells via microscopy [68].
- Validate biological activity: Ensure your exosomes are intact and functional by checking for the presence of known active cargo (e.g., specific miRNAs or proteins) and using a positive control assay if available [68].
Experimental Workflows & Signaling Pathways
Exosome Isolation and Characterization Workflow
The following diagram illustrates a robust, MISEV-compliant workflow for processing samples from collection to characterization, integrating critical quality control checkpoints.
Decision Tree for Selecting an Isolation Method
This flowchart provides a logical framework for choosing the most appropriate exosome isolation method based on key experimental priorities.
The Scientist's Toolkit: Research Reagent Solutions
This table details essential materials and reagents used in exosome research, along with their critical functions.
| Item | Function/Application | Key Considerations |
|---|---|---|
| Tetraspanin Antibodies (e.g., anti-CD9, CD63, CD81) [68] [69] | Positive EV marker detection for characterization by Western Blot, flow cytometry, or immunoaffinity capture. | Confirm specificity and cross-reactivity for your species; titrate for optimal signal. |
| Negative Marker Antibodies (e.g., anti-ApoA1, Albumin) [70] [69] | Assessing sample purity by detecting common contaminants like lipoproteins and soluble proteins. | Crucial for validating isolation method efficiency and reporting per MISEV. |
| Protease Inhibitor Cocktails | Added to collection tubes or lysis buffers to prevent protein degradation in exosome cargo during processing. | Use EDTA-free cocktails if planning downstream functional studies that require divalent cations. |
| PBS (Phosphate-Buffered Saline) | Universal buffer for sample dilution, EV resuspension, and column equilibration in SEC. | Always use sterile, calcium- and magnesium-free PBS to avoid cell aggregation or activation. |
| Size-Exclusion Chromatography (SEC) Columns (e.g., qEV columns) [70] | Isolate exosomes based on size with good purity and preserved vesicle integrity. | Choose the pore size (e.g., 35nm) appropriate for exosomes; be precise during fraction collection. |
| Polyethylene Glycol (PEG)-based Kits | Precipitate exosomes from solution for a simple, high-yield isolation. | Be aware of co-precipitating contaminants; may require additional washing steps. |
| Iodixanol (OptiPrep) | Medium for density gradient ultracentrifugation, separating vesicles based on buoyant density. | Allows for high-purity separation of exosomes from non-vesicular contaminants [70]. |
| Lipophilic Tracer Dyes (e.g., PKH67, DiD) | Fluorescently label exosome membranes for tracking uptake and biodistribution in functional studies. | Can form dye aggregates that mimic EVs; must include rigorous controls (e.g., dye-only) [68]. |
Benchmarking Isolation Success: A Framework for Characterizing and Comparing Exosome Preparations
The efficacy of exosomes as diagnostic biomarkers and therapeutic agents hinges on the precision of their isolation and characterization. The Essential Characterization Triad of Nanoparticle Tracking Analysis (NTA), Transmission Electron Microscopy (TEM), and Western Blot provides a multi-faceted assessment that is critical for validating exosome preparations. This integrated approach confirms the concentration and size distribution of particles, visualizes their morphology and integrity, and verifies the presence of specific protein markers, respectively. Within the broader thesis of improving exosome isolation for diagnostics, this triad is indispensable for moving beyond simple yield measurement to a comprehensive evaluation of exosome quality, purity, and functionality, thereby ensuring that downstream research and clinical applications are built upon a reliable foundation [72] [73] [74].
Core Principles and Technical Specifications of the Triad
Nanoparticle Tracking Analysis (NTA)
NTA is a light-scattering technique that tracks the Brownian motion of individual particles in a suspension to determine their hydrodynamic diameter and concentration. This method is particularly suited for exosomes, which typically fall in the 30-200 nm size range [75]. The principle is based on the Stokes-Einstein equation, where the velocity of a particle's movement is inversely proportional to its size. NTA simultaneously provides information on particle concentration, size distribution, and sample polydispersity. For exosome research, it is crucial to be aware that different NTA instruments, such as the NanoSight NS300 and ZetaView, can yield varying results; the ZetaView has been shown to provide more accurate and repeatable concentration measurements, while the NanoSight NS300 may offer size measurements of higher resolution [76].
Transmission Electron Microscopy (TEM)
TEM offers high-resolution imaging of exosomes, allowing researchers to confirm their spherical, cup-shaped morphology and membrane integrity. In a typical negative stain TEM procedure, a small volume of exosome suspension is applied to a grid, stained with a heavy metal salt (like uranyl acetate), and imaged under an electron beam. This process confirms the presence of intact vesicles and rules out the presence of large protein aggregates or other non-vesicular contaminants. A key limitation is that TEM preparation can dehydrate samples, sometimes leading to the characteristic cup-shaped appearance, and it provides only a snapshot of a potentially heterogeneous sample [72] [74]. To streamline analysis, new semi-automated ImageJ-based algorithms are being developed to quantify EV diameter from TEM images more efficiently and objectively [74].
Western Blot
Western Blot is used to biochemically characterize exosomes by detecting the presence of specific protein markers. Commonly used positive markers include tetraspanins (CD9, CD63, CD81), as well as TSG101 and Alix. Crucially, it is also used to confirm the absence of contaminants from intracellular compartments, such as the endoplasmic reticulum (calnexin), Golgi (GM130), mitochondria (cytochrome C), or nucleus (histones) [72] [21]. There is currently no single universal exosome marker, so a combination of markers is recommended for positive identification. The technique involves separating proteins by SDS-PAGE, transferring them to a membrane, and probing with specific primary and secondary antibodies for detection [21].
The Integrated Workflow
The following diagram illustrates the typical integrated workflow for exosome characterization using the triad, from sample preparation to data interpretation.
Troubleshooting Guides
Nanoparticle Tracking Analysis (NTA) Troubleshooting
Problem: Inaccurate concentration measurements.
- Potential Cause and Solution: The choice of instrument significantly impacts results. If concentration accuracy is paramount, select a ZetaView system, which demonstrates lower %BIAS (2.7–8.5) compared to NanoSight NS300 (%BIAS 32.9–36.8) [76]. Always use the same instrument model for comparative studies.
- Potential Cause and Solution: Improper sample dilution can lead to inaccurate counting. Too high a concentration causes multiple particles to be tracked as one, while too low a concentration yields poor statistics. Perform a dilution series to identify the optimal concentration of 20-100 particles per frame [75].
Problem: Failure to detect small exosomes (<60 nm).
- Potential Cause and Solution: Both NanoSight NS300 and ZetaView may fail to report a peak diameter below 60 nm. Corroborate findings with TEM or Single Particle Interferometric Reflectance Imaging Sensing (SP-IRIS), which have better detection capabilities for smaller particles [76].
Problem: Low measurement repeatability.
- Potential Cause and Solution: Instrument settings (e.g., camera level, detection threshold) are not standardized. Use the same predefined settings for all samples in a study and document them thoroughly to ensure reproducibility [75]. The viscosity of the solvent and temperature must also be controlled, as they directly impact the Brownian motion calculation [75].
Transmission Electron Microscopy (TEM) Troubleshooting
Problem: Cup-shaped artifacts in exosome morphology.
- Potential Cause and Solution: This is a common artifact from sample dehydration during preparation. While it does not necessarily indicate damaged EVs, it is important to recognize it as a processing artifact. The presence of intact spherical vesicles in micrographs confirms successful isolation [72] [74].
Problem: Labor-intensive and subjective manual quantification.
- Potential Cause and Solution: Manually measuring EV diameter from micrographs is time-consuming. Implement a (semi-)automated ImageJ-based algorithm (e.g., "EV finder" plugin) to drastically reduce analysis time, increase objectivity, and transform TEM images into quantifiable data [74]. Note that automated quantification may systematically report a smaller diameter than manual measurement, but relative differences between groups remain consistent [74].
Problem: Low particle count or aggregation on the grid.
- Potential Cause and Solution: This can result from improper sample application or staining. Ensure the grid is freshly glow-discharged to increase hydrophilicity and sample adherence. Optimize the sample incubation time and stain concentration for a clear, well-distributed preparation [74].
Western Blot Troubleshooting
Problem: Weak or no signal for exosome markers (e.g., CD63, CD81).
- Potential Cause and Solution: Insufficient exosomal protein loaded. Increase the amount of protein loaded per lane. Confirm total protein concentration using a BCA or Bradford assay, but note that protein concentration does not always correlate perfectly with exosome content [77] [21].
- Potential Cause and Solution: Inefficient transfer to the membrane. Check transfer efficiency by staining the membrane with Ponceau S after transfer. For low molecular weight antigens, add 20% methanol to the transfer buffer to improve binding; for high molecular weight antigens, add 0.01–0.05% SDS to help pull proteins from the gel [78] [77].
Problem: High background noise.
- Potential Cause and Solution: Antibody concentration is too high. Titrate both primary and secondary antibodies to find the optimal dilution that maximizes signal-to-noise ratio [78] [79].
- Potential Cause and Solution: Inadequate blocking or washing. Block the membrane for at least 1 hour at room temperature or overnight at 4°C with a compatible buffer (e.g., 5% BSA or non-fat milk). Increase the number and volume of washes with TBST or PBST (containing 0.05% Tween 20) between antibody incubations [78] [77].
Problem: Presence of non-specific bands.
- Potential Cause and Solution: Antibody cross-reactivity. Run a negative control (e.g., a non-transfected cell lysate) to confirm the primary antibody is specific for the target. Use primary antibodies that have been validated for western blotting [78] [77].
- Potential Cause and Solution: Protein degradation. Add fresh protease inhibitors to the lysis buffer during sample preparation to prevent proteolysis, which can create multiple bands or smears [77].
Frequently Asked Questions (FAQs)
Q1: Are CD9, CD63, and CD81 specific markers for all exosomes? A: No. While CD9, CD63, and CD81 are common positive markers, there is no single universal exosome marker. Some cell lines release exosomes that are negative for one of these markers (e.g., Jurkat cells can be CD9 negative). The current recommendation from MISEV guidelines is to combine detection of several membrane-bound proteins and always demonstrate the absence of common contaminant markers from organelles like the ER (e.g., calnexin) and Golgi (e.g., GM130) [21].
Q2: How should exosome samples be stored for subsequent analysis by the characterization triad? A: Isolated exosomes can be stored in PBS, often with a carrier protein like 0.1% BSA. For long-term storage, freezing at -80°C is common. Studies have shown that isolation efficiency from frozen cell culture media or urine is not significantly changed after freezing, even without cryo-protectants like glycerol. However, functional assays should be validated with frozen samples, as some properties like uptake by recipient cells can be sensitive to freeze-thaw cycles [21].
Q3: My NTA shows a high concentration of particles, but my Western Blot for tetraspanins is weak. Why? A: This discrepancy can arise for several reasons. First, the protein concentration may not correlate perfectly with particle count, as exosomes from different sources have varying protein cargo. Second, your isolation method may co-isolate non-exosomal particles (e.g., lipoproteins or protein aggregates) that are counted by NTA but lack exosomal markers. Third, your exosomes might express tetraspanins other than the ones you are probing for (e.g., CD63 instead of CD81). Using a combination of positive markers and checking for negative contaminants in your Western Blot can help clarify this [72] [21].
Q4: Can I use protein concentration alone to normalize my exosome samples? A: No. Relying solely on protein concentration (e.g., from a BCA assay) for normalization is not recommended. The correlation between particle number and total protein is not always linear and can be affected by co-isolated contaminants. A more robust approach is to use the particle concentration from NTA for normalization, or to standardize the initial cell culture and exosome harvest conditions carefully to ensure reproducibility across samples [21].
Table 1: Comparative performance of NTA instruments in EV analysis [76].
| Performance Metric | NanoSight NS300 | ZetaView |
|---|---|---|
| Concentration Accuracy (%BIAS) | 32.9 - 36.8 | 2.7 - 8.5 |
| Concentration Precision (%CV) | 5.4 - 10.7 | 0.0 - 4.7 |
| Size Accuracy vs. TEM | More accurate | Less accurate |
| Detection Limit | Fails below ~60 nm | Fails below ~60 nm |
Table 2: Efficacy and compatibility of different EV isolation methods with the characterization triad [72].
| Isolation Method | EV Yield | EV Purity | Compatibility with Functional Assays | Key Drawbacks |
|---|---|---|---|---|
| Ultracentrifugation (UC) | Low | Low (contaminated with BSA) | Not specified | Damaged EVs; contaminated fractions |
| Precipitation (ExoQuick-TC) | Moderate | High (soluble proteins removed) | Compatible (efficient EV uptake shown) | Not specified |
| Membrane Affinity (exoEasy) | High | Moderate | Incompatible (toxic to target cells) | Toxicity to cells; no EV uptake in functional assays |
| exoEasy + Amicon Filtration | Moderate | High | Compatible | Not specified |
Research Reagent Solutions
Table 3: Essential reagents and materials for exosome characterization.
| Reagent / Material | Function / Application | Example Product / Note |
|---|---|---|
| Dynabeads (CD9/CD63/CD81) | Immunoaffinity capture of exosomes for downstream WB or flow cytometry. Different amounts are used for different applications [21]. | Exosome-Human CD9 Isolation Reagent |
| Total Exosome Isolation Reagent | Polymer-based precipitation for quick and easy enrichment of exosomes from serum, plasma, or cell culture media [74]. | ThermoFisher's Total Exosome Isolation Kit |
| Exosome-Depleted FBS | Used in cell culture media to prevent contamination of the sample with bovine exosomes during cell culture, ensuring that isolated exosomes are cell-derived [80]. | Gibco exosome-depleted FBS |
| Tetraspanin Antibodies (CD9, CD63, CD81) | Primary antibodies for Western Blot to confirm the presence of exosomes via positive marker detection [72] [21]. | Validate for Western Blot |
| Contaminant Marker Antibodies (Calnexin, GM130) | Primary antibodies for Western Blot to confirm the absence of common intracellular contaminants, ensuring exosome preparation purity [21]. | Anti-Calnexin, Anti-GM130 |
| Ponceau S Stain | A reversible stain used to quickly confirm successful protein transfer from the gel to the membrane during Western Blotting [77]. | -- |
| Size-Exclusion Chromatography (SEC) Columns | A technique to separate exosomes from soluble proteins and other contaminants after initial isolation, often used to increase purity [73] [21]. | -- |
Methodologies for Key Experiments
Detailed Protocol: Integrated Characterization of Cell Culture-Derived Exosomes
This protocol outlines the process for isolating and characterizing exosomes from cell culture supernatant using a precipitation method, followed by analysis with the characterization triad.
Sample Preparation and EV Isolation:
- Cell Culture: Grow mesenchymal stem cells (MSCs) or other relevant cell lines to 80-90% confluency in T-175 flasks using media supplemented with exosome-depleted FBS to avoid bovine EV contamination [80].
- Harvest Conditioned Media: Collect the culture medium after 48 hours and perform sequential centrifugation to remove cells and debris.
- Exosome Precipitation: Add the recommended volume of precipitation reagent (e.g., from Total Exosome Isolation Kit) to the clarified supernatant. Incubate at 4°C for 10 minutes, then centrifuge at 10,000 × g for 5 minutes at 4°C to pellet the exosomes [74]. Discard the supernatant and resuspend the pellet in DPBS or 0.9% NaCl.
Characterization using the Triad:
- NTA Analysis:
- Dilute the resuspended exosome sample in PBS to achieve an ideal concentration for the instrument (e.g., 20-100 particles/frame).
- Load the sample into the NTA instrument (e.g., ZetaView or NanoSight NS300). Ensure instrument settings (camera level, detection threshold) are documented and kept consistent for all samples.
- Record multiple videos and use the software to calculate the mode and mean particle size, and particle concentration [76] [75].
- TEM Analysis (Negative Staining):
- Apply 3 μL of the exosome sample to a freshly glow-discharged carbon-coated grid and let it adhere for 1-2 minutes.
- Wick away excess liquid with filter paper.
- Negative stain by applying 3 μL of 1-2% uranyl acetate solution for 1 minute, then wick away the excess.
- Let the grid air-dry completely before imaging with a TEM operating at 80-100 kV.
- Capture images of multiple random fields to assess morphology and size. Use manual measurement or a semi-automated ImageJ plugin for quantification [74].
- Western Blot Analysis:
- Lyse the exosome pellet in RIPA buffer containing protease inhibitors.
- Determine the protein concentration using a BCA assay.
- Separate 10-20 μg of exosomal protein by SDS-PAGE and transfer to a PVDF or nitrocellulose membrane.
- Block the membrane with 5% BSA in TBST for 1 hour at room temperature.
- Incubate with primary antibodies against positive markers (CD63, CD81, TSG101) and negative markers (Calnexin) diluted in blocking buffer, overnight at 4°C.
- Wash the membrane and incubate with an appropriate HRP-conjugated secondary antibody for 1 hour at room temperature.
- Detect the signal using a chemiluminescent substrate and image the blot [72] [78].
Workflow Diagram: From Isolation to Full Characterization
The following diagram summarizes the key experimental and decision points in the exosome characterization process, helping to guide researchers through the protocol.
Exosomes, nanoscale extracellular vesicles (30-200 nm) released by virtually all cell types, have emerged as pivotal entities in diagnostic and therapeutic research due to their role in intercellular communication and their reflection of parental cell physiology [81] [7] [8]. The efficacy of exosome-based applications—from liquid biopsies to drug delivery systems—hinges fundamentally on the quality of the isolated exosomes. The isolation process must successfully navigate the inherent challenges of biological fluid complexity, exosome heterogeneity, and the presence of nanoscale contaminants such as lipoproteins and protein aggregates [82] [4]. Consequently, selecting an appropriate isolation method is not merely a preliminary step but a determinant of experimental success and clinical applicability. This technical support document provides a systematic, evidence-based comparison of major exosome isolation techniques, focusing on the critical performance metrics of yield, purity, and biological activity to guide researchers in optimizing their protocols for diagnostics research.
Performance Metrics Comparison of Key Isolation Methods
The choice of an exosome isolation method involves trade-offs between yield, purity, scalability, and the preservation of biological function. The following table synthesizes the comparative performance of the most widely used techniques, drawing from current literature and established laboratory protocols [11] [8] [4].
Table 1: Comparative Performance Metrics of Exosome Isolation Methods
| Isolation Method | Purity | Yield | Scalability | Processing Time | Impact on Biological Activity | Best Suited For |
|---|---|---|---|---|---|---|
| Differential Ultracentrifugation (UC) | High | Medium | Medium | Long (>5 hours) | Potential mechanical damage from high g-forces; may disrupt structure [81] [82]. | Research settings; established "gold standard" for many applications [11] [8]. |
| Density Gradient Ultracentrifugation | Very High | Low to Medium | Low | Very Long (>10 hours) | Preserves integrity and function better than differential UC [4]. | Applications requiring high purity, like proteomic analysis [81]. |
| Size-Exclusion Chromatography (SEC) | Medium-High | Medium | High | Medium (~1 hour) | Gentle process; maintains vesicle integrity and biological function [11] [4]. | Diagnostic workflows and sensitive downstream analyses [11] [82]. |
| Ultrafiltration (UF) | Medium | High | High | Short-Medium | Shear stress from pressure can damage exosomes [81] [4]. | Rapid processing and concentration of large sample volumes [11]. |
| Polymer-Based Precipitation | Low | Very High | High | Short | Can co-precipitate contaminants; may require additional purification steps [11] [8]. | Simple and quick initial screens; high-yield recovery from large volumes [8]. |
| Immunoaffinity Capture | Very High | Low | Low | Medium | High specificity preserves target exosome function; antibody binding may affect surface markers [11] [8]. | Isolation of specific exosome subpopulations for biomarker studies [8] [4]. |
| Microfluidic Technologies | High (Method-dependent) | High (Method-dependent) | Medium (for throughput) | Short | Varies by technique (acoustic, DLD, affinity); generally designed to be gentle [82]. | Integrated isolation and analysis; point-of-care diagnostic development [82]. |
Detailed Experimental Protocols for Key Methods
Differential Ultracentrifugation Protocol
This protocol is considered the historical "gold standard" for exosome isolation [11] [8].
- Principle: Sequential centrifugation steps at increasing speeds and durations to separate particles based on size and density [81].
- Workflow:
- Sample Pre-clearing: Centrifuge cell culture supernatant or biofluid (e.g., blood plasma) at (300 \times g) for 10 minutes to pellet whole cells. Transfer supernatant to a new tube.
- Debris Removal: Centrifuge the supernatant at (2,000 \times g) for 20 minutes to remove dead cells and large debris. Transfer supernatant.
- Microvesicle Removal: Centrifuge at (10,000 \times g) for 30 minutes to pellet larger microvesicles and organelles. Transfer supernatant carefully.
- Exosome Pelletting: Ultracentrifuge the final supernatant at (100,000 \times g) to (150,000 \times g) for 70-120 minutes to pellet exosomes.
- Wash Step (Optional): Resuspend the pellet in a large volume of phosphate-buffered saline (PBS) and repeat the ultracentrifugation step to improve purity.
- Resuspension: Finally, resuspend the purified exosome pellet in a small volume (e.g., 50-100 µL) of sterile PBS or a suitable buffer for storage at -80°C [81] [4].
The following diagram illustrates this multi-step process:
Size-Exclusion Chromatography (SEC) Protocol
This gel-filtration technique is prized for its speed and ability to preserve exosome integrity [11] [82].
- Principle: A sample is passed through a column packed with porous polymer beads. Smaller molecules and contaminants (e.g., proteins) become trapped in the pores, eluting later, while larger exosomes are excluded from the pores and elute in the earlier fractions [4].
- Workflow:
- Column Preparation: Equilibrate the SEC column (e.g., qEV original) with PBS or the recommended buffer according to the manufacturer's instructions.
- Sample Preparation: Pre-clear the sample by centrifugation at (10,000 \times g) for 30-45 minutes to remove large particles that could clog the column.
- Sample Loading: Carefully load the pre-cleared sample onto the column. The maximum load volume is typically 500 µL for a 10 mL column.
- Elution: Add elution buffer (e.g., PBS) and begin collecting fractions. Exosomes are typically found in the early, void-volume fractions (e.g., fractions 7-9 for a 10 mL column, depending on the sample and column type).
- Analysis: Analyze fractions for exosome content using nanoparticle tracking analysis (NTA) or protein assays. Pool the exosome-rich fractions and concentrate if necessary using ultrafiltration [11] [82] [4].
Immunoaffinity Capture Protocol (Magnetic Bead-Based)
This method offers the highest specificity for isolating exosome subpopulations [8] [4].
- Principle: Antibodies against specific exosomal surface tetraspanins (e.g., CD9, CD63, CD81) are conjugated to magnetic beads. These beads are incubated with the sample, allowing for the selective capture of target exosomes, which are then separated using a magnet [8].
- Workflow:
- Bead Preparation: Wash antibody-conjugated magnetic beads with PBS.
- Incubation: Incubate the washed beads with the pre-cleared sample for 30 minutes to several hours at room temperature or 4°C with gentle mixing.
- Magnetic Separation: Place the tube in a magnetic rack for 2-5 minutes. Once the solution clears, carefully aspirate and discard the supernatant.
- Washing: Wash the bead-bound exosomes 3-5 times with PBS while the tube is in the magnetic rack to remove unbound material.
- Elution (Optional): Elute the captured exosomes from the beads using a low-pH elution buffer or a competitive ligand. Neutralize the pH immediately after elution. Alternatively, beads can be used directly for downstream applications like RNA extraction or flow cytometry [8] [4].
Troubleshooting Guide and Frequently Asked Questions (FAQs)
Troubleshooting Common Issues
Table 2: Troubleshooting Common Exosome Isolation Problems
| Problem | Potential Causes | Solutions & Recommendations |
|---|---|---|
| Low Yield |
|
|
| Low Purity (Protein Contamination) |
|
|
| Compromised Biological Activity | ||
| Poor Reproducibility |
|
Frequently Asked Questions (FAQs)
Q1: Which isolation method is the overall "best" for diagnostic research? There is no single "best" method. The optimal choice depends on the research goal. For high-purity biomarker discovery from small sample volumes, immunoaffinity capture or microfluidics are excellent. For high-yield preparation from large volumes of cell culture media for therapeutic exploration, TFF is ideal. For a general balance of purity, yield, and vesicle integrity for most downstream applications (e.g., RNA sequencing), SEC is often recommended [11] [82] [4].
Q2: Why is my exosome preparation contaminated with abundant non-exosomal proteins? This is a common issue, particularly with polymer-based precipitation and standard ultracentrifugation. These methods can co-precipitate or co-sediment protein aggregates and lipoproteins. To mitigate this, combine methods: for example, use a density gradient centrifugation after initial pelleting, or follow a precipitation step with an SEC clean-up step to remove soluble contaminants [8] [82].
Q3: How can I quickly check the quality of my isolated exosomes? A minimal characterization should include:
- Size and Concentration: Use Nanoparticle Tracking Analysis (NTA) to confirm a peak size distribution of 30-200 nm and determine particle concentration.
- Specific Markers: Use Western Blot or flow cytometry to detect positive markers (e.g., CD9, CD63, CD81, TSG101) and a negative marker (e.g., Calnexin, from the endoplasmic reticulum) to assess purity [11] [8] [4].
- Morphology: Use transmission electron microscopy (TEM) to visualize the classic "cup-shaped" morphology of exosomes.
Q4: My downstream RNA analysis from exosomes is inconsistent. Could the isolation method be the cause? Absolutely. Methods that cause exosome damage or co-isolate ribonucleoproteins (RNPs) can severely impact RNA results. Ultracentrifugation can damage exosomes, releasing RNA, while precipitation kits often co-precipitate non-vesicular RNA. For reliable RNA analysis, use the gentlest method available, such as SEC or a combination of SEC and density gradient ultracentrifugation, which better separates exosomes from free RNA-protein complexes [81] [82].
The Scientist's Toolkit: Essential Research Reagent Solutions
Selecting the right reagents is critical for reproducible and reliable exosome isolation and analysis.
Table 3: Key Reagents and Kits for Exosome Research
| Reagent / Kit Type | Primary Function | Key Considerations for Selection |
|---|---|---|
| qEV Size-Exclusion Columns | Rapid isolation of exosomes based on size with high purity and preserved biological activity [11] [82]. | Choose column size based on sample volume. Ideal for fast, gentle processing of plasma, serum, and cell culture media. |
| Polymer-Based Precipitation Kits (e.g., PEG) | High-yield precipitation of exosomes from large volume samples via dehydration [11] [8]. | Be aware of co-precipitation of contaminants. Best suited for initial screening or when yield is prioritized over absolute purity. |
| Immunoaffinity Kits (Magnetic Beads) | High-specificity isolation of exosome subpopulations bearing specific surface markers (e.g., CD63+) [8] [4]. | Select antibodies based on target exosome population. Lower yield but very high purity. Essential for biomarker studies. |
| Exosome Standards & Controls | Act as positive controls for isolation and characterization protocols, ensuring instrument performance and procedural accuracy [8]. | Use well-characterized exosomes from defined cell lines or synthetic standards to validate workflows and enable cross-lab comparisons. |
| Lysis Buffers for Cargo Analysis | Break down the exosome lipid bilayer to release internal cargo (RNA, DNA, proteins) for downstream analysis. | Ensure compatibility with downstream applications (e.g., RNA-seq, proteomics). Use kits designed specifically for low-abundance exosomal content. |
| Characterization Antibody Panels | Identification and validation of isolated exosomes via Western Blot, ELISA, or Flow Cytometry. | Must include positive (e.g., CD9, CD81, CD63, TSG101) and negative (e.g., Calnexin) markers to confirm identity and purity [8] [4]. |
Method Selection and Workflow Visualization
Choosing the correct isolation strategy requires aligning method capabilities with experimental objectives. The following decision pathway provides a logical framework for this selection, particularly within a diagnostics research context.
Extracellular Vesicles (EVs), including exosomes, are nanoscale vesicles released by all cell types and are essential mediators of intercellular communication. Their molecular cargo reflects their cell of origin, making them promising targets for diagnostic biomarker discovery. However, isolating EVs with high purity remains a significant challenge. Biological fluids like plasma are complex and contain abundant soluble proteins and lipoproteins that can co-isolate with EVs. These contaminants can severely interfere with downstream proteomic analyses, leading to misleading results and hindering biomarker validation.
Proteomic purity scoring addresses this challenge by using targeted mass spectrometry to provide an objective, quantitative assessment of EV preparation quality. This approach moves beyond simple particle counts to measure the specific presence of canonical EV markers and key contaminant proteins, enabling researchers to select optimal isolation methods and ensure the reliability of their proteomic data for diagnostic development.
Frequently Asked Questions (FAQs) and Troubleshooting Guides
FAQ 1: Why is standardizing EV isolation critical for diagnostic biomarker discovery?
Answer: Standardization is paramount because the isolation method directly and profoundly impacts the proteomic profile you obtain. Different isolation techniques co-enrich different sets of non-EV contaminants, such as lipoproteins and highly abundant plasma proteins like albumin and apolipoproteins [70]. This variability makes it difficult to compare results across studies and can lead to the misidentification of contaminants as potential biomarkers. Using proteomic purity scoring provides an objective metric to benchmark different methods, ensuring that the proteins identified truly originate from EVs and not from co-isolated contaminants [84] [85]. This is a foundational step for developing robust and reproducible liquid biopsy diagnostics.
FAQ 2: Which EV isolation methods yield the highest purity for proteomics?
Answer: Comparative studies consistently show that Size-Exclusion Chromatography (SEC) provides superior purity for proteomic applications [4] [85]. SEC effectively separates EVs from smaller, soluble protein complexes based on their hydrodynamic diameter.
The table below summarizes the performance of common isolation methods based on recent comparative studies:
| Isolation Method | Proteomic Purity | Key Advantages | Key Limitations |
|---|---|---|---|
| Size-Exclusion Chromatography (SEC) | High | Low contamination from soluble proteins; maintains vesicle integrity [4] [85]. | Lower yield; sample dilution requires a concentration step [85]. |
| Density Gradient Ultracentrifugation (DGUC) | High | Excellent separation from contaminants based on density; high purity [70] [86]. | Time-consuming (>18h); low throughput; requires specialized equipment [70]. |
| Ultracentrifugation (UC) | Medium | High yield; considered a "gold standard"; requires no specialized kits [4] [11]. | Co-pellets contaminants like protein aggregates; can damage exosomes [4]. |
| Polymer-Based Precipitation | Low | Simple and fast protocol; suitable for large volumes [4] [87]. | High co-precipitation of contaminants (e.g., lipoproteins); low purity [84] [87]. |
| Immunoaffinity Capture | Very High (but selective) | Isolates specific EV subpopulations based on surface markers (e.g., CD9, CD81) [21] [4]. | Lower yield; high cost; may not capture the total EV population [4]. |
FAQ 3: How do I use mass spectrometry to quantify purity in my EV samples?
Answer: Targeted mass spectrometry techniques, specifically Multiple Reaction Monitoring (MRM) or its high-resolution equivalent Parallel Reaction Monitoring (PRM), are used for precise purity quantification [84] [85]. The workflow involves:
- Selecting Signature Peptides: Choose peptides that uniquely represent "EV-Marker Proteins" (e.g., CD9, CD81, CD63, TSG101, Flotillin-1) and "Contaminant Proteins" (e.g., Albumin (ALB), Apolipoprotein A1 (APOA1), Apolipoprotein B (APOB)) [84].
- Spiking in Heavy Labeled Standards: Synthesize stable isotope-labeled versions of these signature peptides (QconCATs or individual peptides) and spike them into your EV samples at a known concentration. This serves as an internal standard for absolute quantification [84].
- LC-PRM/MRM Analysis: Digest the EV sample to peptides, separate them via liquid chromatography, and analyze them on the mass spectrometer. The instrument is set to monitor the specific precursor and fragment ions of your target peptides.
- Calculate Purity Ratios: Quantify the absolute amount of each EV marker and contaminant protein. A purity score can then be calculated, for example, by taking the ratio of the total EV marker protein concentration to the total contaminant protein concentration. A higher ratio indicates a purer preparation [85].
FAQ 4: My EV preparation shows high particle yield but low detection of EV markers in proteomics. What is the cause?
Answer: This is a classic symptom of a purity issue. A high particle count from NTA can be misleading because this technique counts all particles in a specific size range, including co-isolated contaminants like lipoproteins (e.g., LDL, HDL) and protein aggregates that are similar in size to EVs [70] [84]. Your sample may be dominated by these non-vesicular particles, which do not carry the typical EV protein markers. To troubleshoot:
- Verify your isolation method: Precipitation-based methods are notorious for this problem [84] [87]. Consider switching to or incorporating SEC or DGUC.
- Implement a purity assessment: Use Western blot or, more quantitatively, PRM-MS to measure the levels of key contaminants like APOA1 and ALB alongside EV markers like CD81 or TSG101 [84] [85].
- Check the particle-to-protein ratio: A low ratio suggests your sample has a high amount of protein relative to the number of vesicles, indicating significant soluble protein contamination [87].
FAQ 5: What are the essential controls for validating an EV isolation protocol for diagnostic research?
Answer: For rigorous diagnostic development, your validation should include a combination of techniques:
- Nanoparticle Tracking Analysis (NTA): To determine particle concentration and size distribution [70] [87].
- Transmission Electron Microscopy (TEM): To confirm the presence of intact, cup-shaped vesicles with a lipid bilayer [87].
- Western Blot or PRM-MS: To positively identify EV-enriched markers (e.g., CD9, CD81, TSG101, Alix) and, critically, to test for the absence of contaminants from non-vesicular compartments (e.g., Calnexin for endoplasmic reticulum, GM130 for Golgi apparatus, Albumin for plasma proteins) [21] [84] [87].
- Proteomic Purity Scoring: The most quantitative control is to implement a targeted MS assay to objectively score your preparations based on the ratio of EV markers to contaminants, providing a standardized quality metric [84] [85].
Experimental Protocols for EV Purity Assessment
Protocol 1: Basic EV Isolation from Plasma using Size-Exclusion Chromatography (SEC)
This protocol is recommended for high-purity proteomic work [85].
- Plasma Pre-clearing: Thaw frozen plasma on ice. Centrifuge at 2,000 × g for 10 minutes at 4°C. Transfer the supernatant to a new tube and centrifuge again at 10,000 × g for 30 minutes at 4°C to remove cells, debris, and larger vesicles.
- Column Equilibration: Equilibrate a qEVoriginal 35 nm SEC column (Izon Science) with phosphate-buffered saline (PBS, pH 7.4) according to the manufacturer's instructions.
- Sample Loading and Elution: Load the recommended volume (e.g., 500 μL) of pre-cleared plasma onto the column. Elute with PBS and collect sequential fractions. The first few fractions (typically the void volume) will contain the EVs.
- Fraction Concentration (Optional): For downstream proteomics, the EV-containing fractions are often too dilute. Concentrate them using centrifugal filters with a 10 kDa molecular weight cutoff [70] [85].
- Storage: Aliquot the concentrated EV sample and store at -80°C.
Protocol 2: Targeted Mass Spectrometry for Purity Scoring using Parallel Reaction Monitoring (PRM)
This protocol enables absolute quantification of key proteins to calculate a purity score [84] [85].
- EV Lysis and Protein Digestion: Solubilize an aliquot of your isolated EVs in a lysis buffer containing 2% SDS. Reduce and alkylate the proteins. Digest the proteins into peptides using trypsin.
- Spike-in of Heavy Labeled Standards: Add a known amount of stable isotope-labeled (heavy) QconCAT protein or a mix of heavy labeled signature peptides to the digested sample. This internal standard allows for absolute quantification.
- LC-PRM/MS Analysis:
- Chromatography: Separate the peptides using reverse-phase nano-liquid chromatography.
- Mass Spectrometry: Analyze the eluting peptides on a high-resolution mass spectrometer (e.g., Q-Exactive series) operated in PRM mode. The method is programmed to isolate the precursor ions of the target signature peptides and monitor all their fragment ions.
- Data Analysis and Purity Scoring:
- Use software (e.g., Skyline) to integrate the chromatographic peaks for the light (sample) and heavy (standard) versions of each peptide.
- Calculate the absolute amount of each target protein (e.g., CD9, APOA1, ALB) in the sample based on the heavy standard.
- Compute a Purity Score. For example:
Purity Score = (Sum of EV Marker Protein Quantities) / (Sum of Contaminant Protein Quantities). A higher score indicates a purer EV preparation.
Workflow and Pathway Visualizations
EV Purity Assessment Workflow
Proteomic Purity Scoring Logic
The Scientist's Toolkit: Research Reagent Solutions
| Reagent / Kit | Function / Application | Key Considerations |
|---|---|---|
| qEV SEC Columns (Izon Science) | Isolation of high-purity EVs from biofluids based on size. Ideal for proteomics [70] [85]. | Provides excellent separation from soluble proteins; fractions require concentration for downstream use. |
| MagCapture Exosome Isolation Kit (Fujifilm) | Affinity-based isolation of phosphatidylserine-positive EVs using Tim4 protein-conjugated beads [70]. | Yields very pure EVs but may select a specific subpopulation; useful for comparative studies. |
| Dynabeads CD9/CD63/CD81 Isolation Reagents | Immunoaffinity capture of specific EV subpopulations from pre-enriched samples or cell culture media [21]. | High specificity but lower yield; beads can be used directly for downstream Western blot or MS. |
| Total Exosome Isolation Kit (Invitrogen) | Polymer-based precipitation for rapid and simple EV isolation from various samples [70] [84]. | High yield but also high co-precipitation of contaminants; less suitable for sensitive proteomics. |
| 15N-Labeled QconCATs | Artificial proteins with concatenated signature peptides used as internal standards for absolute quantification in MRM/PRM assays [84]. | Enables precise, multiplexed quantification of multiple target proteins (both EV markers and contaminants) simultaneously. |
| Anti-Tetraspanin Antibodies (CD9, CD63, CD81) | Essential for Western blot validation of EV isolates and for immunoaffinity capture methods [21] [87]. | No single marker is universal; recommend using a combination for robust characterization. |
The study of extracellular vesicles (EVs) has emerged as a pivotal area in biomedical research, with plasma being one of the most important yet challenging biofluids for EV isolation. Plasma contains an overwhelming abundance of proteins and lipoproteins that can co-isolate with EVs, compromising downstream proteomic analyses. This case study examines why Size-Exclusion Chromatography (SEC) has established itself as the superior method for plasma EV proteomics when the goal is minimal contamination and high-quality data. We present compelling evidence from comparative studies, provide detailed experimental protocols, and offer practical troubleshooting guidance to help researchers implement this powerful technique effectively.
Technical Performance: SEC vs. Alternative Methods
Quantitative Comparison of Isolation Techniques
Multiple systematic studies have demonstrated that SEC consistently outperforms other common EV isolation methods in key performance metrics essential for proteomic analysis.
Table 1: Comparative Performance of Plasma EV Isolation Methods for Proteomics
| Method | Purity (Plasma Protein Contamination) | Proteomic Coverage | Reproducibility | EV Yield | Downstream Compatibility |
|---|---|---|---|---|---|
| Size-Exclusion Chromatography (SEC) | Medium-High [11] [85] | High (identifies more proteins) [88] | High [88] [11] | Medium [11] | Excellent for MS [88] [85] |
| Ultracentrifugation (UC) | Medium (co-pellets contaminants) [85] | Medium (limited by contaminants) [88] | Medium (varies by operator) [28] | Medium [11] | Good (with limitations) [88] |
| Polymer-Based Precipitation | Low (high contaminant carryover) [11] [85] | Low to Medium [88] | Medium [11] | High [11] | Moderate (requires clean-up) [88] |
| Immunoaffinity Capture | Very High (for specific subtypes) [11] | Low (biased to target population) | High (when optimized) | Low [11] | Specialized applications [21] |
| Tangential Flow Filtration | Medium [11] | Medium | High | High [11] | Good [11] |
SEC Delivers Superior Proteomic Content
The fundamental advantage of SEC for proteomic applications lies in its ability to separate EVs from soluble plasma proteins based on size differences. In head-to-head comparisons, SEC identified significantly more EV-associated proteins than ultracentrifugation, polymer precipitation, or membrane affinity methods [88]. When applied to platelet-poor plasma from healthy donors, the SEC method demonstrated enhanced detection of canonical EV marker proteins from smaller sample volumes compared to other approaches [88].
A 2025 comparative study developed a targeted mass spectrometry assay to quantify key EV markers and contaminant proteins across different isolation methods. Among the techniques tested, SEC showed the greatest enrichment of EV markers and unique proteins, with the lowest level of contaminants, resulting in the highest overall purity scores [85]. The study concluded that SEC provides the most EV-enriched plasma isolates for proteomics information, with minimal contamination from plasma proteins [85].
Experimental Protocol: SEC for Plasma EV Proteomics
Standardized SEC Workflow for Plasma
The following protocol is adapted from Vanderboom et al. (2021) with modifications from recent methodological improvements [88] [85] [89]:
Enhanced SEC Protocol with Capto Core 700
Recent methodological advances have combined SEC with additional purification steps to further enhance purity. A 2025 study introduced a modified approach using Capto Core 700 beads after SEC separation [89]:
Procedure:
- Perform standard SEC isolation using qEVoriginal 70nm column
- Collect EV-enriched fractions (typically fractions 7-10)
- Incubate pooled SEC fractions with Capto Core 700 beads for 5 minutes at room temperature
- Separate beads from supernatant containing purified EVs
- Process for proteomic analysis
Performance: This combined approach (qEV + CCS) identified over 1,000 EV-associated proteins by DIA-MS with significant reduction in abundant plasma proteins (albumin, immunoglobulins, apolipoprotein A1) and higher enrichment of common EV markers (CD9, CD81, CD63) [89].
Technical Support Center
Frequently Asked Questions
Q1: How does SEC specifically reduce plasma protein contamination compared to ultracentrifugation?
SEC separates particles based on hydrodynamic volume, where larger EVs elute first while smaller soluble proteins and complexes are retained longer in the column pores [88]. In contrast, ultracentrifugation pellets particles based on density and size, resulting in co-sedimentation of protein aggregates and lipoproteins with similar density to EVs [85] [28]. The orthogonal separation mechanism of SEC specifically resolves EVs from common contaminants like fibrinogen, apolipoprotein B, and immunoglobulin M, which display right-shifted elution profiles compared to EV markers [88].
Q2: What are the critical factors for maximizing SEC performance with plasma samples?
Three factors are particularly crucial:
- Sample Pre-Clearing: Centrifuge plasma at 1,500-10,000 × g to remove cells, debris, and large vesicles before SEC [85] [89].
- Column Selection: Choose appropriate pore size (35nm or 70nm qEV columns) matched to your target EV population [85].
- Fraction Collection: Precisely determine EV-rich fractions for your specific column type and plasma volume. For qEV columns, EVs typically elute in fractions 7-10 following the void volume [88] [89].
Q3: How can I confirm that my SEC isolation has successfully minimized contaminants?
The recommended orthogonal verification approaches include:
- Mass Spectrometry: Monitor known contaminant proteins (albumin, apolipoproteins, fibrinogen) versus EV markers (tetraspanins, annexins, flotillins) [88] [90].
- Nanoparticle Tracking: Evaluate particle-to-protein ratio, with higher ratios indicating better purity [85].
- Western Blotting: Test for presence of EV markers (CD9, CD63, CD81) and absence of organelle contaminants (calnexin for ER, GM130 for Golgi) [21].
Troubleshooting Guide
Table 2: Common SEC Issues and Solutions
| Problem | Potential Causes | Solutions |
|---|---|---|
| Low EV recovery | Column overloaded; EV loss in pre-clearing; Incorrect fraction pooling | Optimize plasma input volume (100-500 μL); Validate pre-clearing forces; Characterize elution profile with NTA |
| High protein contamination | Plasma protein overload; Deteriorated column; Improper fraction collection | Reduce sample load; Replace column; Adjust fraction collection boundaries based on UV profile |
| Poor reproducibility | Variable flow rates; Column lot differences; Inconsistent pre-processing | Use automated fraction collector; Standardize pre-clearing protocol; Include internal controls |
| Column clogging | Insufficient sample pre-clearing; Lipid-rich samples | Add 0.22μm filtration after pre-clearing; Increase pre-clearing force/duration |
| Incomplete separation | High viscosity samples; Flow rate too high | Dilute plasma with PBS (max 1:2); Reduce flow rate per manufacturer guidelines |
Research Reagent Solutions
Table 3: Essential Materials for SEC-Based Plasma EV Proteomics
| Reagent/Equipment | Function/Purpose | Example Products/Specifications |
|---|---|---|
| SEC Columns | Size-based separation of EVs from contaminants | qEVoriginal (35nm or 70nm, Izon Science) [88] [85] |
| Capto Core 700 Beads | Secondary purification to remove soluble proteins | Cytiva Capto Core 700 (700 kDa exclusion) [89] |
| Platelet-Poor Plasma | Starting material with reduced platelet-derived EVs | Prepared via double centrifugation (2,000 × g then 10,000 × g) [88] |
| Protease Inhibitors | Prevent degradation of EV protein cargo | Commercial cocktails added during processing [28] |
| Mass Spectrometry | Downstream proteomic characterization | High-resolution LC-MS/MS systems (Orbitrap preferred) [88] [90] |
Applications and Future Directions
The superior purity of SEC-isolated EVs enables previously challenging applications in biomarker discovery and disease mechanism investigation. A proteomic meta-analysis of plasma EVs successfully refined the genuine EV proteome by separating true EV proteins from contaminants, identifying clusters enriched with 133 CD antigens and proteins involved in cell-to-cell communication and signaling [90]. This refinement enables more reliable biomarker discovery, as demonstrated by the validation of proplatelet basic protein in EVs as a regulator of apoptosis in β cells and macrophages, with implications for type 1 diabetes [90].
Emerging methodologies continue to enhance SEC performance. The integration of AI and machine learning is beginning to revolutionize exosome isolation by optimizing protocols, automating sample processing, and improving detection and classification of exosomes with unprecedented precision [64]. These technological advances, combined with the fundamental advantages of SEC, position this technique as the foundation for the next generation of EV-based diagnostic and therapeutic applications.
Core Concepts: Why Functional Integrity Matters
Exosomes are nanoscale extracellular vesicles (30-150 nm) that play crucial roles in intercellular communication by transferring proteins, lipids, and nucleic acids between cells [27] [91]. For diagnostics and therapeutics, functional integrity—preservation of physical structure, surface markers, and luminal cargo—is paramount. Compromised integrity directly impacts experimental reproducibility and clinical applicability [20] [4].
Key Indicators of Exosome Integrity
The following parameters are essential for assessing the quality and functionality of isolated exosomes:
| Indicator Category | Specific Parameter | Association with Functional Integrity |
|---|---|---|
| Physical Structure | Morphology (cup-shaped, intact membrane) | Compromised by shear stress, excessive g-force; essential for cellular uptake [20] [92] |
| Size distribution (30-150 nm) | Aggregation or disintegration alters profile; critical for biodistribution [4] [11] | |
| Particle concentration | Major deviations suggest poor yield or instability [11] | |
| Biochemical Composition | Surface markers (CD63, CD81, CD9) | Loss indicates surface protein damage; impairs targeting and immunoaffinity [91] [19] |
| Cargo diversity (RNA, proteins) | Degraded cargo disrupts communication and therapeutic effect [27] [91] | |
| Absence of contaminants (lipoproteins, protein aggregates) | Contaminants interfere with analysis and can cause off-target effects [20] [8] | |
| Functional Activity | Uptake by recipient cells | Fundamental for drug delivery and signal transduction [91] |
| Cargo delivery efficiency | Direct measure of bioactivity [27] |
Troubleshooting Guide: Common Problems & Solutions
Problem: Low Yield or Recovery of Exosomes
Potential Causes and Solutions:
- Cause: Overly stringent washing steps.
- Cause: Excessive g-force or prolonged centrifugation.
- Cause: Filter membrane adsorption or clogging in size-based methods.
- Cause: Inefficient precipitation polymer mixing.
Problem: Poor Purity and Co-isolated Contaminants
Potential Causes and Solutions:
- Cause: Co-precipitation of non-exosomal material with polymers.
- Cause: Incomplete removal of cells and debris.
- Cause: Lipoprotein contamination (common in blood samples).
Problem: Loss of Biological Activity and Cargo Integrity
Potential Causes and Solutions:
- Cause: Exosome damage from high shear forces.
- Cause: Protease or RNase degradation.
- Cause: Multiple freeze-thaw cycles.
- Solution: Aliquot isolated exosomes into single-use portions and store at -80°C. Avoid repeated freezing and thawing [8].
Problem: Inconsistent Results Between Experiments
Potential Causes and Solutions:
- Cause: Lack of protocol standardization.
- Solution: Meticulously document all technical details (rotor type, centrifugation time/speed, buffer recipes, etc.) and adhere to MISEV (Minimal Information for Studies of Extracellular Vesicles) guidelines [20] [11].
- Solution: Use a standardized, commercial exosome standard from a defined cell line as an internal control across experiments to control for process variability [8].
- Cause: Biological fluid variability.
Experimental Protocols for Integrity Assessment
A multi-parametric approach is required to confirm exosome integrity and function.
Protocol: Assessing Structural Integrity
1. Nanoparticle Tracking Analysis (NTA)
- Procedure: Dilute the exosome sample in sterile PBS to achieve an ideal concentration of 20-100 particles per frame. Inject the sample into the NTA system and record three 60-second videos. Ensure camera level is optimized to visualize particles without saturation.
- Data Analysis: The software will provide a mean/median size and a mode size. A profile peaking between 80-120 nm with a Gaussian-like distribution is expected. A significant population of particles >200nm suggests aggregation or presence of other vesicles, while a shift to <50nm may indicate fragmentation [8] [11].
2. Transmission Electron Microscopy (TEM)
- Procedure: Adsorb exosomes onto a Formvar/carbon-coated grid for 1-20 minutes. Negative stain with 1-2% uranyl acetate for 1-10 minutes. Wash gently and air-dry before imaging.
- Data Analysis: Intact exosomes typically exhibit a rounded, cup-shaped morphology under TEM due to membrane integrity and staining artifacts. Ruptured membranes, distorted shapes, or the presence of non-vesicular structures indicate damage or contamination [91] [92].
Protocol: Verifying Biochemical Composition
1. Western Blot for Marker Proteins
- Procedure: Lyse an aliquot of exosomes in RIPA buffer. Separate proteins by SDS-PAGE, transfer to a PVDF membrane, and probe for positive markers (e.g., CD63, CD81, TSG101, Alix) and a negative marker (e.g., Calnexin, which should be absent). Use a parent cell lysate as a positive control.
- Data Analysis: The presence of tetraspanins (CD63, CD81) and ESCRT-associated proteins (TSG101, Alix), along with the absence of endoplasmic reticulum markers (Calnexin), confirms the endosomal origin and purity of the exosome preparation [91] [8].
2. Protein Quantification and Purity Ratio
- Procedure: Determine the total particle concentration using NTA. Measure the total protein concentration using a sensitive, compatible assay like BCA or micro-BCA.
- Data Analysis: Calculate the particle-to-protein ratio. A higher ratio generally indicates a purer preparation with less contaminating soluble protein. While no universal standard exists, track this ratio internally to monitor isolation consistency [11].
Protocol: Evaluating Functional Activity
1. Recipient Cell Uptake Assay
- Procedure: Label isolated exosomes with a lipophilic fluorescent dye (e.g., PKH67 or DiD) according to manufacturer instructions. Remove excess dye via SEC or ultracentrifugation. Incubate labeled exosomes with recipient cells for 4-24 hours. Fix cells, stain nuclei with DAPI, and image using a confocal microscope.
- Data Analysis: Fluorescence within the cytoplasm of recipient cells confirms successful uptake and membrane fusion. Compare against a no-exosome control and a control where exosomes are pre-treated with detergent to destroy integrity [91].
The following diagram illustrates the experimental workflow for a functional uptake assay.
FAQs on Exosome Functional Integrity
Q1: What is the single biggest factor that compromises exosome integrity during isolation? The excessive physical stress imposed by ultracentrifugation is a major factor. Prolonged high g-forces can physically disrupt vesicles, alter their morphology, and reduce their functional activity. Balancing yield with integrity is crucial, and gentler alternatives like SEC should be considered for sensitive downstream applications [20] [4].
Q2: How can I quickly check if my isolation worked before full characterization? A combination of NTA and a single western blot marker offers a rapid initial assessment. NTA will immediately show if you have a population of particles in the expected size range (30-150 nm) without large aggregates. A quick western blot for a common tetraspanin like CD63 can confirm the presence of exosomal proteins [8] [11].
Q3: My exosomes have the correct markers and size but are not functional in my cellular assay. Why? This suggests "silent" exosomes that are physically intact but biologically inactive. Potential reasons include: (1) Cargo degradation due to RNase/protease activity during processing—always use inhibitors. (2) Surface protein denaturation from harsh isolation methods. (3) Incorrect storage with multiple freeze-thaw cycles. (4) The specific subpopulation of exosomes you isolated lacks the required bioactive cargo [27] [91].
Q4: Are commercial isolation kits reliable for functional studies? Kits based on precipitation often co-precipitate contaminants and may require a subsequent purification step for functional work. Immunoaffinity kits provide high purity for specific subpopulations but the elution conditions (low pH) can sometimes damage exosomes or affect function. The choice of kit must be validated for your specific application [4] [8].
Q5: How should I store isolated exosomes to best preserve function? For short-term (days), store at 4°C in a buffered solution like PBS. For long-term (weeks/months), aliquot and store at -80°C. Cryopreservants like trehalose can help stabilize membranes during freezing. The most critical rule is to avoid repeated freeze-thaw cycles, as each cycle can reduce integrity and activity [8].
The Scientist's Toolkit: Research Reagent Solutions
The following table details key reagents and materials essential for successful exosome isolation and integrity assessment.
| Tool/Reagent | Primary Function | Key Considerations |
|---|---|---|
| Protease & RNase Inhibitors | Preserve protein and nucleic acid cargo within exosomes from degradation. | Essential in all buffers during isolation from complex biofluids like plasma [91]. |
| Sterile-filtered PBS | Resuspension and washing buffer for isolated exosome pellets. | Must be sterile-filtered (0.1 µm) to avoid nanoparticle contamination [19]. |
| Sucrose or Iodixanol Solutions | Form density gradients for high-purity isolation via ultracentrifugation. | Effectively separates exosomes from contaminants like lipoproteins [20] [4]. |
| Size-Exclusion Chromatography (SEC) Columns | Gently separate exosomes based on size, preserving vesicle integrity and function. | Ideal as a final polishing step after precipitation or for direct isolation from low-volume samples [4] [11]. |
| Lipophilic Fluorescent Dyes (e.g., PKH67, DiD) | Label exosome membranes for functional uptake and tracking assays in recipient cells. | Excess, unincorporated dye must be rigorously removed post-labeling to avoid false positives [91]. |
| Antibody Panels (CD9, CD63, CD81) | Identify and characterize exosomes via techniques like Western Blot, Flow Cytometry, or ELISA. | Use a combination to account for heterogeneity; include a negative marker (e.g., Calnexin) for purity [91] [8]. |
| Magnetic Beads (Antibody-conjugated) | Isolate specific exosome subpopulations via immunoaffinity capture for targeted research. | Elution conditions can be harsh; test functional activity post-isolation [27] [4]. |
| Polyethylene Glycol (PEG) | Precipitate exosomes out of solution by volume exclusion, enabling easy low-speed collection. | Known to co-precipitate contaminants; best used for enrichment rather than high-purity isolation [19] [8]. |
The flowchart below summarizes the key decision points and analytical steps for ensuring exosome integrity, from isolation to functional validation.
Conclusion
The advancement of diagnostic applications powered by exosomes is inextricably linked to the development of robust, reproducible, and efficient isolation techniques. While no single method is universally superior, the choice hinges on the specific diagnostic goals, balancing the high purity offered by techniques like size-exclusion chromatography with the yield of precipitation-based methods. The future of exosome-based diagnostics lies in the standardization of isolation and characterization protocols, the wider adoption of hybrid and novel microfluidic workflows, and the rigorous validation of exosomal biomarkers in large-scale clinical studies. By overcoming current technical challenges, exosomes are poised to revolutionize liquid biopsies, enabling earlier disease detection, real-time monitoring of treatment response, and the dawn of truly personalized medicine.
References
- 1. Exosome biogenesis: machinery, regulation, and therapeutic ... [https://molecular-cancer.biomedcentral.com/articles/10.1186/s12943-022-01671-0]
- 2. Overview of Extracellular Vesicles, Their Origin, Composition ... [https://pmc.ncbi.nlm.nih.gov/articles/PMC6678302/]
- 3. The exosome journey: from biogenesis to uptake and ... [https://biosignaling.biomedcentral.com/articles/10.1186/s12964-021-00730-1]
- 4. Exosome isolation and detection: Methods and applications [https://www.abcam.com/en-us/knowledge-center/cell-biology/exosome-isolation-and-detection]
- 5. Recent developments in isolating methods for exosomes - PMC [https://pmc.ncbi.nlm.nih.gov/articles/PMC9879965/]
- 6. THE INS-AND-OUTS OF EXOSOME BIOGENESIS ... [https://pmc.ncbi.nlm.nih.gov/articles/PMC10811273/]
- 7. Bio fluid exosomes: promises, challenges, and future ... [https://translational-medicine.biomedcentral.com/articles/10.1186/s12967-025-06886-5]
- 8. Exosomes: A Promising New Tool for Diagnostic and ... [https://www.amsbio.com/news/exosomes_blog]
- 9. Exosomes and their cargo proteins in diagnosis, process ... [https://www.frontiersin.org/journals/cell-and-developmental-biology/articles/10.3389/fcell.2025.1560583/full]
- 10. Exosomes and their cargo proteins in diagnosis, process ... [https://pmc.ncbi.nlm.nih.gov/articles/PMC12288513/]
- 11. Exosome Isolation Protocols and Quantification Guidelines [https://www.sepscience.com/exosome-isolation-protocols-and-quantification-guidelines-12144]
- 12. Efficient methods of isolation and purification of extracellular ... [https://nanoconvergencejournal.springeropen.com/articles/10.1186/s40580-025-00509-x]
- 13. Engineered exosomes: a promising approach for overcoming ... [https://jnanobiotechnology.biomedcentral.com/articles/10.1186/s12951-025-03697-0]
- 14. Exosome isolation and characterization for advanced ... [https://www.sciencedirect.com/science/article/pii/S2590006425001711]
- 15. Frequently Asked Questions (FAQs) [https://www.creative-biolabs.com/exosome/frequently-asked-questions-faqs.htm]
- 16. Exosome Processing and Characterization Approaches for ... [https://pmc.ncbi.nlm.nih.gov/articles/PMC9130923/]
- 17. Techniques Supporting Exosome Research and Applications [https://www.thermofisher.com/us/en/home/brands/thermo-scientific/molecular-biology/molecular-biology-learning-center/molecular-biology-resource-library/spotlight-articles/exosome-research-applications-techniques.html]
- 18. Exosome Diagnostics Technology: Liquid Biopsy Tests [https://www.exosomedx.com/our-technology]
- 19. A Beginner's Guide to Exosome Isolation [https://bitesizebio.com/37981/beginners-guide-hunting-exosomes/]
- 20. Principles and Problems of Exosome Isolation from ... [https://pmc.ncbi.nlm.nih.gov/articles/PMC9202659/]
- 21. Exosomes Frequently Asked Questions (FAQs) [https://www.thermofisher.com/us/en/home/life-science/cell-analysis/exosomes/exosomes-webinar-q-and-a.html]
- 22. Exosomes—the next frontier in biomarker discovery and ... [https://www.nature.com/articles/d43747-020-01051-x]
- 23. Exosomes FAQs Video Series | Thermo Fisher Scientific - US [https://www.thermofisher.com/us/en/home/life-science/cell-analysis/exosomes/video-faqs-exosomes.html]
- 24. Emerging role of exosomes as a liquid biopsy tool for ... [https://pmc.ncbi.nlm.nih.gov/articles/PMC11050750/]
- 25. Application of exosomes as liquid biopsy in clinical ... [https://www.nature.com/articles/s41392-020-00258-9]
- 26. Improvements on the Liquid Biopsy: Exosomes [https://www.cap.org/member-resources/articles/improvements-on-the-liquid-biopsy-exosomes]
- 27. Exosome isolation and characterization for advanced ... [https://pmc.ncbi.nlm.nih.gov/articles/PMC11950786/]
- 28. Progress in Exosome Isolation Techniques - PMC [https://pmc.ncbi.nlm.nih.gov/articles/PMC5327650/]
- 29. Challenges in Exosome Isolation and Analysis in Health ... [https://pmc.ncbi.nlm.nih.gov/articles/PMC6801453/]
- 30. 3 Commonly Encountered Issues Surrounding Exosome ... [https://norgenbiotek.com/blog/3-commonly-encountered-issues-surrounding-exosome-purification?srsltid=AfmBOoqKuDD9NwdSH5B5vDbJ_AHnefHkZFWXzGH4HggpdVD7mDyv8WuC]
- 31. Elucidating Methods for Isolation and Quantification of ... [https://pmc.ncbi.nlm.nih.gov/articles/PMC7940341/]
- 32. Exosome isolation and validation [https://bio-protocol.org/exchange/minidetail?id=6011594&type=30]
- 33. Understanding Ultracentrifuges: Principles, Applications, ... [https://torontech.com/understanding-ultracentrifuges/]
- 34. Ultracentrifugation - an overview [https://www.sciencedirect.com/topics/agricultural-and-biological-sciences/ultracentrifugation]
- 35. Exosome Isolation by Ultracentrifugation and Precipitation [https://pmc.ncbi.nlm.nih.gov/articles/PMC8088761/]
- 36. Small extracellular vesicles isolation and separation [https://pmc.ncbi.nlm.nih.gov/articles/PMC9516236/]
- 37. Exosome Isolation : A Guide to EVs Research [https://www.rocker.com.tw/en/application/exosome-isolation/]
- 38. What is a TFF system and how does it work? [https://www.tecnic.eu/what-is-a-tff-system-and-how-does-it-work/]
- 39. Tips & Tricks GPC/SEC: What You Need to Know to Allow ... [https://www.chromatographyonline.com/view/tips-tricks-gpcsec-what-you-need-know-allow-efficient-gpcsec-troubleshooting]
- 40. Optimizing Concentration of Polyethelene Glycol for ... [https://pmc.ncbi.nlm.nih.gov/articles/PMC9694916/]
- 41. An open-source automated PEG precipitation assay to ... [https://www.nature.com/articles/s41598-021-01126-4]
- 42. Optimization Protocol of the PEG-Based Method for OSCC- ... [https://www.mdpi.com/2297-8739/9/12/435]
- 43. A novel affinity-based method for the isolation of highly ... [https://www.nature.com/articles/srep33935]
- 44. Microfluidic Device for High-Throughput Affinity-based ... [https://pmc.ncbi.nlm.nih.gov/articles/PMC7328786/]
- 45. innovative biomarkers leading the charge in non-invasive ... [https://pubmed.ncbi.nlm.nih.gov/40303340/?utm_source=Chrome&utm_medium=rss&utm_campaign=None&utm_content=1zcrKMCEYILtymqeULLHp2eakwGlSXDIYXcIBB78_eLfBouQyf&fc=None&ff=20250503152747&v=2.18.0.post9+e462414]
- 46. A comprehensive review on recent advances in exosome ... [https://www.sciencedirect.com/science/article/pii/S1936523324002481]
- 47. Exosome Immunoprecipitation Reagent (Protein A) - FAQs [https://www.thermofisher.com/order/catalog/product/10610D/faqs]
- 48. Targeted isolation of extracellular vesicles from cell culture ... [https://www.sciencedirect.com/science/article/pii/S1383586624040516]
- 49. Microfluidic devices for on-chip quantification of ... [https://www.oaepublish.com/articles/evcna.2025.10]
- 50. Microfluidic Devices for Manufacture of Therapeutic ... [https://pmc.ncbi.nlm.nih.gov/articles/PMC12287800/]
- 51. Optimized exosome isolation protocol for cell culture ... [https://pmc.ncbi.nlm.nih.gov/articles/PMC4507751/]
- 52. Exosome Isolation, Detection, & Analysis [https://www.thermofisher.com/us/en/home/life-science/cell-analysis/exosomes.html]
- 53. How Exosome Research Works — In One Simple Flow ... [https://www.linkedin.com/pulse/how-exosome-research-works-one-simple-flow-2025-nextverify-wh1ve]
- 54. Improved isolation of extracellular vesicles by removal ... [https://elifesciences.org/articles/86394]
- 55. Extracellular Vesicle Isolation: Why Size Exclusion ... [https://www.izon.com/news/extracellular-vesicle-isolation-why-size-exclusion-chromatography-is-on-the-rise]
- 56. High throughput and rapid isolation of extracellular vesicles ... [https://pmc.ncbi.nlm.nih.gov/articles/PMC11407901/]
- 57. Q&As and Troubleshooting | [Life Science]Products [https://labchem-wako.fujifilm.com/us/category/01360.html]
- 58. Isolation and characterization of extracellular vesicles and ... [https://pmc.ncbi.nlm.nih.gov/articles/PMC10078256/]
- 59. Exosome Isolation and Detection | Bio-Techne [https://www.bio-techne.com/research-areas/exosomes/exosome-isolation-and-detection]
- 60. How to Prepare Samples for Exosome RNA Sequencing [https://www.cd-genomics.com/resource-exosomal-rna-sample-prep.html]
- 61. Extracellular vesicles isolation: a focus on magnetic beads ... [https://www.frontiersin.org/journals/bioengineering-and-biotechnology/articles/10.3389/fbioe.2025.1646385/full]
- 62. Exosome Isolation Guide: Comparing Five Key Methods ... [https://www.procellsystem.com/resources/cell-culture-academy/exosome-isolation-guide-comparing-five-key-methods-to-maximize-your-efficiency-1985]
- 63. Regulation of exosomes as biologic medicines: Regulatory ... [https://pmc.ncbi.nlm.nih.gov/articles/PMC11307316/]
- 64. Exosome Isolation Market Size 2025 to 2034 [https://www.precedenceresearch.com/exosome-isolation-market]
- 65. Bringing exosomes into the game: Current situation ... [https://www.sciencedirect.com/science/article/pii/S2590049825000682]
- 66. Pitfalls in Proteomics: Avoiding Problems That Can Occur ... [https://www.chromatographyonline.com/view/pitfalls-in-proteomics-avoiding-problems-that-can-occur-before-data-acquisition-begins]
- 67. Common Centrifuge Issues and How to Fix Them [https://newlifescientific.com/blogs/new-life-scientific-blog/centrifuge-troubleshooting?srsltid=AfmBOopkTriKQ59aRM5XUsu0P2l2Jk8Ng95QSg_damT7BQzx2JiIeW-t]
- 68. Reproducibility and transparency: why following MISEV ... [https://pmc.ncbi.nlm.nih.gov/articles/PMC12540050/]
- 69. MISEV: extracellular vesicle research standards [https://www.cellgs.com/blog/misev-extracellular-vesicle-research-standards.html]
- 70. Comprehensive Comparison of Methods for Isolation ... [https://pmc.ncbi.nlm.nih.gov/articles/PMC12150312/]
- 71. MISEV [https://www.isev.org/misev]
- 72. Comparative analysis of extracellular vesicle isolation ... [https://pmc.ncbi.nlm.nih.gov/articles/PMC9574064/]
- 73. A comprehensive review on recent advances in exosome ... [https://pmc.ncbi.nlm.nih.gov/articles/PMC11418158/]
- 74. Transmission Electron Microscopy-based characterization of ... [https://biosignaling.biomedcentral.com/articles/10.1186/s12964-025-02383-w]
- 75. Nanoparticle Tracking Analysis of Urinary Extracellular ... [https://www.mdpi.com/1422-0067/24/15/12228]
- 76. Extracellular vesicle measurements with nanoparticle tracking ... [https://pmc.ncbi.nlm.nih.gov/articles/PMC6450530/]
- 77. Western blot troubleshooting guide! [https://www.jacksonimmuno.com/secondary-antibody-resource/technical-tips/western-blot-trouble-shooting/]
- 78. Western Blot Troubleshooting [https://www.thermofisher.com/us/en/home/life-science/protein-biology/protein-biology-learning-center/protein-gel-electrophoresis-information/western-blot-troubleshooting.html]
- 79. Western Blot Troubleshooting Guide - TotalLab [https://totallab.com/resources/western-blot-troubleshooting-guide/]
- 80. Isolation and Characterization of Extracellular Vesicle from ... [https://pmc.ncbi.nlm.nih.gov/articles/PMC9066249/]
- 81. Efficient methods of isolation and purification of extracellular ... [https://pmc.ncbi.nlm.nih.gov/articles/PMC12463815/]
- 82. Recent developments in isolating methods for exosomes [https://www.frontiersin.org/journals/bioengineering-and-biotechnology/articles/10.3389/fbioe.2022.1100892/full]
- 83. Exosome Research Global Market Forecasts 2025-2030 [https://www.businesswire.com/news/home/20250728987947/en/Exosome-Research-Global-Market-Forecasts-2025-2030-Kits-Reagents-Segment-to-Lead-Growth-Due-to-Increased-Demand-for-Standardized-Tools---ResearchAndMarkets.com]
- 84. Assessment of Extracellular Vesicles Purity Using ... [https://pmc.ncbi.nlm.nih.gov/articles/PMC5896757/]
- 85. Comparative Analysis of Plasma Extracellular Vesicle ... [https://www.mdpi.com/2227-7382/13/3/45]
- 86. Proteomic analysis of exosomal cargo [https://pubs.rsc.org/en/content/articlelanding/2016/mb/c6mb00082g]
- 87. A simplified and efficient method for isolating small ... [https://www.nature.com/articles/s41598-025-99822-y]
- 88. A size-exclusion-based approach for purifying extracellular ... [https://pmc.ncbi.nlm.nih.gov/articles/PMC8336930/]
- 89. Rapid and high-yield recovery of plasma-derived extracellular ... [https://biosignaling.biomedcentral.com/articles/10.1186/s12964-025-02263-3]
- 90. A proteomic meta-analysis refinement of plasma ... [https://www.nature.com/articles/s41597-023-02748-1]
- 91. Review of the Isolation, Characterization, Biological Function ... [https://pmc.ncbi.nlm.nih.gov/articles/PMC6523673/]
- 92. “Exosomics”—A Review of Biophysics, Biology and ... [https://www.frontiersin.org/journals/genetics/articles/10.3389/fgene.2018.00092/full]