ddPCR vs NGS for ctDNA Analysis: A Technical Guide for Researchers and Drug Developers
This article provides a comprehensive comparison of droplet digital PCR (ddPCR) and next-generation sequencing (NGS) for circulating tumor DNA (ctDNA) analysis, crucial for precision oncology.
ddPCR vs NGS for ctDNA Analysis: A Technical Guide for Researchers and Drug Developers
Abstract
This article provides a comprehensive comparison of droplet digital PCR (ddPCR) and next-generation sequencing (NGS) for circulating tumor DNA (ctDNA) analysis, crucial for precision oncology. It explores the foundational principles of each technology, their specific methodological applications in areas like treatment monitoring and minimal residual disease (MRD) detection, and practical guidance for troubleshooting technical hurdles. Drawing on recent 2025 clinical data and studies, it delivers a validated, head-to-head performance comparison to inform technology selection for clinical research and oncology drug development.
Understanding the Core Technologies: ddPCR and NGS in the ctDNA Landscape
Droplet Digital PCR (ddPCR) represents a transformative approach in molecular diagnostics, enabling the absolute quantification of nucleic acid targets without the need for a standard curve. This technology operates by partitioning a single PCR reaction into thousands to millions of nanoliter-sized droplets, effectively creating individual micro-reactors where amplification occurs independently. The fundamental principle driving ddPCR is Poisson statistics, which allows for the calculation of the absolute concentration of the target nucleic acid molecule based on the ratio of positive to negative droplets after amplification. Unlike quantitative PCR (qPCR), which relies on relative quantification against reference standards, ddPCR provides direct molecular counting, resulting in unparalleled precision for detecting rare mutations and minor genetic variations in complex biological samples.
The ddPCR workflow involves several critical steps: first, a water-oil emulsion system is created to generate thousands of uniform droplets; second, PCR amplification occurs within each droplet; and finally, droplet fluorescence is measured to determine the presence or absence of the target sequence. This compartmentalization approach provides significant advantages for detecting low-abundance targets, as it effectively enriches rare sequences by distributing them across numerous partitions. The technology has found particular utility in circulating tumor DNA (ctDNA) analysis, where it enables detection of cancer-associated mutations at variant allele frequencies as low as 0.01%, making it an indispensable tool for cancer monitoring, treatment response assessment, and minimal residual disease detection [1].
Fundamental Principles of ddPCR
Partitioning and Absolute Quantification
The core innovation of ddPCR lies in its sample partitioning approach, which enables absolute quantification of nucleic acids. In a typical ddPCR reaction, a 20μL PCR mixture is partitioned into approximately 20,000 uniform nanoliter-sized droplets using a water-in-oil emulsion system [1]. This partitioning process follows Poisson distribution statistics, which dictates that each droplet will contain zero, one, or a few target DNA molecules based on their concentration in the original sample. Following PCR amplification, each droplet is analyzed individually for fluorescence signals corresponding to the presence of target sequences.
The absolute quantification is achieved by counting the positive (fluorescent) and negative (non-fluorescent) droplets and applying Poisson statistics to determine the original concentration of the target molecule in the sample. The fraction of negative droplets (p) is used to calculate the average number of target molecules per droplet (λ) using the formula λ = -ln(1-p). The absolute concentration in the original sample is then determined based on the known volume of the droplets and the proportion of the sample analyzed. This approach eliminates the need for standard curves and reference genes that are essential for qPCR quantification, thereby reducing potential sources of error and variability [2].
Superior Sensitivity and Tolerance to Inhibitors
ddPCR exhibits exceptional sensitivity and specificity, particularly for detecting rare mutations in complex backgrounds. The partitioning process effectively dilutes PCR inhibitors present in the sample across thousands of droplets, minimizing their impact on amplification efficiency. This makes ddPCR remarkably tolerant to inhibitors that commonly affect other PCR-based methods, maintaining accuracy even with challenging sample matrices [2]. This advantage is particularly valuable when analyzing clinical samples such as plasma-derived cell-free DNA, which may contain various amplification inhibitors.
The sensitivity of ddPCR is further enhanced by its ability to detect very low variant allele frequencies. While conventional qPCR typically detects mutations at frequencies around 1-5%, ddPCR can reliably identify mutations present at frequencies as low as 0.001-0.01% under optimal conditions [1]. This exceptional sensitivity stems from the massive sample partitioning that effectively enriches rare targets, allowing for their detection against a background of wild-type sequences. For ctDNA analysis, this translates to the ability to identify minimal residual disease and early treatment resistance mutations long before clinical or radiographic evidence of disease progression emerges.
ddPCR in ctDNA Analysis: Experimental Evidence
Performance Comparison with Next-Generation Sequencing
Recent clinical studies have directly compared ddPCR with Next-Generation Sequencing (NGS) for ctDNA detection across multiple cancer types, revealing distinct advantages and limitations for each platform. In a 2025 study focusing on localized rectal cancer, ddPCR demonstrated significantly higher detection rates compared to NGS. The research evaluated 41 patients in a development cohort and found that ddPCR detected ctDNA in 24/41 (58.5%) of baseline plasma samples, while the NGS panel only identified ctDNA in 15/41 (36.6%) of the same samples (p = 0.00075) [3] [1]. This substantial difference in detection sensitivity highlights ddPCR's superior performance for analyzing samples with limited ctDNA content.
The same study also validated these findings in an independent cohort of 26 rectal cancer patients, where 21/26 (80.8%) showed detectable ctDNA in pre-therapy plasma using ddPCR [1]. Importantly, the detection of ctDNA correlated strongly with established clinical prognostic factors, including higher clinical tumor stage and lymph node positivity identified by MRI. These findings position ddPCR as a robust tool for initial patient stratification and disease severity assessment in rectal cancer. However, the study also noted a limitation regarding postoperative monitoring, as ddPCR failed to detect ctDNA before most recurrences, suggesting that either the timing of sampling or tumor biology might influence detectability in the minimal residual disease setting [1].
Table 1: Comparison of ddPCR and NGS Performance in Rectal Cancer ctDNA Detection
| Parameter | ddPCR | NGS | Statistical Significance |
|---|---|---|---|
| Detection Rate (Development Cohort) | 24/41 (58.5%) | 15/41 (36.6%) | p = 0.00075 |
| Detection Rate (Validation Cohort) | 21/26 (80.8%) | Not reported | Not applicable |
| Variant Allele Frequency Detection | As low as 0.01% | Approximately 0.1-1% | ddPCR more sensitive |
| Association with Clinical Stage | Positive correlation with higher tumor stage and lymph node positivity | Similar trend but lower detection rate | Consistent across platforms |
| Post-operative Monitoring | Limited sensitivity before recurrence | Not reported | Needs improvement |
Prognostic Utility in Clinical Applications
The prognostic value of ddPCR-based ctDNA detection has been established across multiple cancer types, demonstrating its clinical relevance for risk stratification and treatment monitoring. In the TRICIA trial focusing on triple-negative breast cancer (TNBC) patients with residual disease after neoadjuvant chemotherapy, ddPCR-based ctDNA analysis proved highly predictive of outcomes. The study found that patients with undetectable ctDNA after neoadjuvant chemotherapy but before surgery exhibited exceptional survival, with 95% distant-disease relapse-free survival [4]. This finding enables identification of a patient subgroup with favorable prognosis despite not achieving pathological complete response.
Similarly, in a biomarker analysis from the COMBI-AD phase 3 trial involving patients with resected stage III melanoma, ddPCR assays targeting BRAFV600 mutations demonstrated significant prognostic value. Baseline ctDNA was detectable in 79 of 597 (13%) patients, and this detection strongly correlated with worse recurrence-free survival and overall survival in both placebo and combination therapy groups [5]. The hazard ratios for recurrence-free survival were 2.91 and 2.98 for the placebo and combination therapy groups, respectively, highlighting the consistent prognostic value of ddPCR-based ctDNA detection across treatment modalities [5]. Furthermore, longitudinal ctDNA monitoring revealed that patients with adverse ctDNA kinetics (molecular relapse or persistently positive) had markedly shorter median recurrence-free survival (8.31 months and 5.32 months, respectively) compared to patients with favorable kinetics [5].
Table 2: Prognostic Value of ddPCR-based ctDNA Detection Across Cancers
| Cancer Type | Study | ctDNA Detection Rate | Key Prognostic Findings |
|---|---|---|---|
| Triple-Negative Breast Cancer | TRICIA Trial | Varied by timepoint | 95% DDFS with undetectable ctDNA post-NAC |
| Stage III Melanoma | COMBI-AD Trial | 13% at baseline | HR for RFS: 2.98 (combination therapy), 2.91 (placebo) |
| Rectal Cancer | Szeto et al. 2025 | 58.5-80.8% pre-therapy | Associated with higher clinical stage and node positivity |
| HPV-Associated Cancers | Meta-analysis | Varies by platform and site | NGS most sensitive, then ddPCR, then qPCR |
Methodological Protocols for ddPCR ctDNA Analysis
Sample Collection and Processing
Proper sample collection and processing are critical for reliable ctDNA analysis using ddPCR. For clinical applications, blood samples should be collected in specialized tubes containing cell-free DNA preservatives, such as Streck Cell Free DNA BCT tubes, to prevent white blood cell lysis and genomic DNA contamination [1]. The recommended volume is typically 3 × 9 mL of blood per time point, drawn before initiation of any therapeutic interventions for baseline assessment. For longitudinal monitoring, consistent timing relative to treatment cycles is essential to ensure comparability across time points.
Plasma separation should be performed within a specified time frame after collection (usually within 2-6 hours) through a two-step centrifugation process: an initial low-speed centrifugation to separate cellular components followed by a high-speed centrifugation to remove residual cells and debris. The resulting plasma is then carefully aliquoted to avoid disturbing the pellet and stored at -80°C until DNA extraction. Cell-free DNA (cfDNA) extraction is typically performed using silica membrane-based kits optimized for recovering short DNA fragments, with elution in low-EDTA or EDTA-free buffers to prevent interference with downstream enzymatic reactions [1].
Tumor-Informed Assay Design
A key advantage of ddPCR for ctDNA analysis is the ability to implement tumor-informed assay designs that maximize detection sensitivity. The process begins with identifying somatic mutations in the primary tumor tissue using next-generation sequencing panels such as the Ion AmpliSeq Cancer Hotspot Panel v2, which covers hotspot regions in 50 oncogenes and tumor suppressor genes [1]. After identifying tumor-specific mutations, custom ddPCR assays are designed to target one or two mutations with the highest variant allele frequencies in the tumor tissue.
This tumor-informed approach significantly enhances detection sensitivity compared to untargeted methods, as it focuses on mutations confirmed to be present in the patient's tumor. For each patient, one to two predesigned probes are typically used, targeting the most abundant mutations identified through prior NGS analysis [1]. The ddPCR reaction mixture is prepared according to manufacturer specifications, with careful optimization of primer and probe concentrations to ensure efficient amplification and clear signal separation between positive and negative droplets. The partitioned reaction is then amplified using standardized cycling conditions optimized for the specific target sequences.
Data Analysis and Interpretation
Following PCR amplification, droplet fluorescence is measured using a droplet reader that classifies each droplet as positive or negative for the target mutation based on fluorescence thresholds. The raw data is then analyzed using proprietary software that applies Poisson statistics to calculate the absolute concentration of the target molecule in the original sample. For clinical interpretation, results are typically dichotomized into ctDNA-positive or ctDNA-negative categories, with even a single oncogenic mutation detected in plasma considered indicative of ctDNA positivity [1].
The analytical sensitivity of the assay must be established through validation studies using synthetic controls or cell line-derived DNA mixtures with known mutation concentrations. The threshold for detection of somatic alterations is typically set at 0.01% variant allele frequency for ddPCR assays [1]. For quantitative applications, results may be reported as copies per mL of plasma to enable longitudinal monitoring of disease burden. In the context of clinical decision-making, the timing of ctDNA assessment is critical, with specific time points (such as after neoadjuvant therapy but before surgery) demonstrating particular prognostic value in multiple cancer types [4].
Essential Research Reagent Solutions
Successful implementation of ddPCR-based ctDNA detection requires carefully selected reagents and materials optimized for this sensitive application. The following table outlines key solutions and their specific functions in the experimental workflow.
Table 3: Essential Research Reagents for ddPCR-based ctDNA Analysis
| Reagent/Material | Function | Examples/Specifications |
|---|---|---|
| Cell-free DNA Blood Collection Tubes | Preserves blood sample integrity | Streck Cell Free DNA BCT tubes |
| DNA Extraction Kits | Isolation of cell-free DNA from plasma | Silica membrane-based kits |
| Droplet Generation Oil | Creates water-in-oil emulsion for partitioning | Bio-Rad Droplet Generation Oil |
| Supermix for Probes | PCR reaction mixture | ddPCR Supermix for Probes |
| Mutation-Specific Assays | Target detection | Custom ddPCR assays (FAM/HEX) |
| Droplet Reader Oil | Facilitates droplet reading | Bio-Rad Droplet Reader Oil |
| Quantitative Standards | Assay validation and quality control | Synthetic oligonucleotides, reference materials |
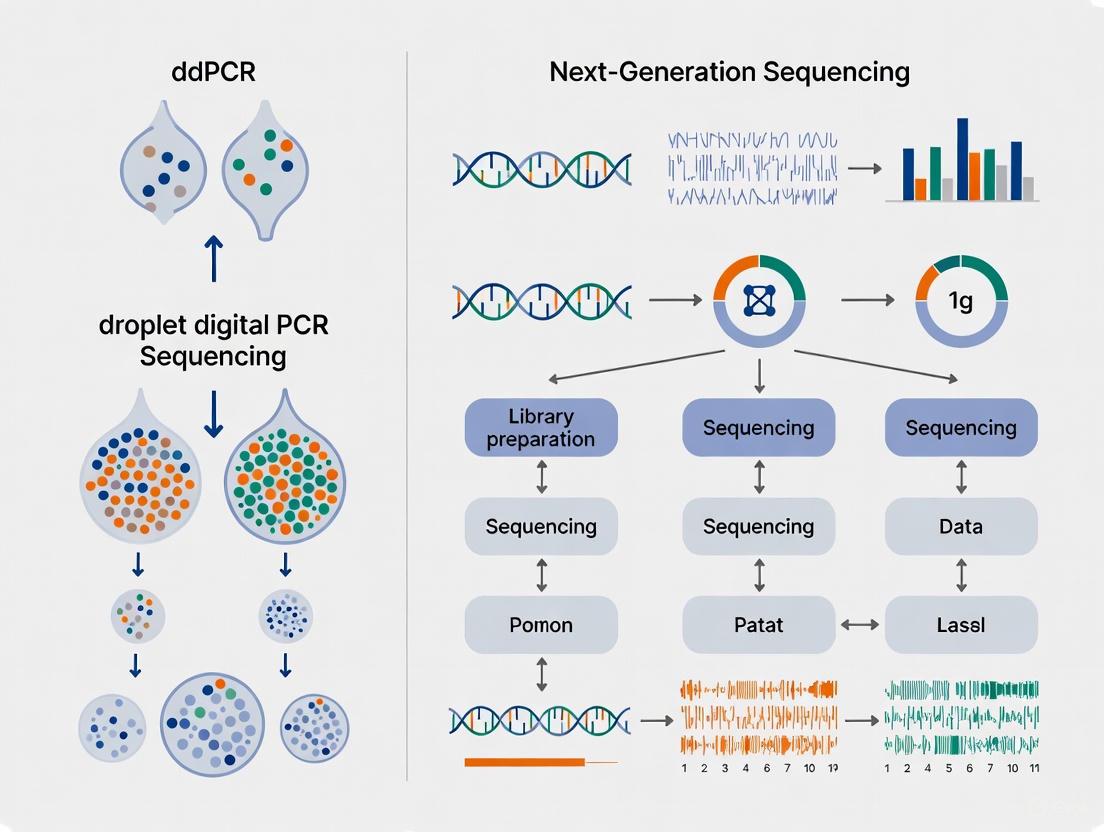
Technological Workflow and Application Pathways
The following diagram illustrates the complete workflow for ddPCR-based ctDNA analysis, from sample collection to clinical application:
Droplet Digital PCR has established itself as a powerful technology for absolute quantification of nucleic acids, particularly in the challenging context of circulating tumor DNA analysis. Its superior sensitivity for detecting rare mutations, tolerance to inhibitors, and ability to provide absolute quantification without standard curves make it particularly valuable for minimal residual disease detection and treatment response monitoring. While next-generation sequencing offers advantages in terms of multiplexing capacity and discovery applications, ddPCR remains the gold standard for sensitive tracking of known mutations in both clinical research and emerging diagnostic applications. As the field of liquid biopsy continues to evolve, the complementary use of both technologies—using NGS for initial mutation discovery and ddPCR for sensitive longitudinal monitoring—will likely provide the most comprehensive approach for cancer management.
Next-generation sequencing (NGS) represents a foundational technology in modern genomics, enabling comprehensive analysis of genetic material across extensive genomic regions. A core principle that makes NGS particularly powerful for research and clinical applications is multiplexing—the simultaneous processing of multiple samples in a single sequencing run. This capability is achieved through the incorporation of unique DNA barcodes, or indexes, attached to each sample during library preparation. Following sequencing, these barcodes allow bioinformatics tools to demultiplex the data, accurately assigning each sequence read to its original sample [6] [7]. This process transforms NGS into a high-throughput methodology that maximizes operational efficiency, significantly reduces per-sample costs, and minimizes technical variability across large sample sets [6].
In the specific context of circulating tumor DNA (ctDNA) research, NGS provides a distinct advantage: the ability to perform broad genomic profiling without requiring prior knowledge of a patient's specific tumor mutations. This "tumor-uninformed" approach is particularly valuable for discovering novel mutations and understanding tumor heterogeneity. However, this breadth comes with technical considerations, especially when compared to targeted methods like droplet digital PCR (ddPCR). This guide objectively examines the principles of NGS multiplexing and contrasts its performance with ddPCR for ctDNA analysis, providing researchers with the experimental data and protocols necessary to inform their technology selection.
Core Principles and Comparative Performance of NGS and ddPCR
The Technological Frameworks
The fundamental difference between NGS and ddPCR lies in their approach to detection. NGS utilizes a massively parallel, sequencing-by-synthesis process to read the nucleotide sequence of millions to billions of DNA fragments simultaneously. When combined with multiplexing, it allows for the interrogation of hundreds to thousands of genetic regions across dozens of samples in a single experiment [6] [8]. Common NGS configurations for ctDNA analysis involve targeted panels focusing on cancer hotspot mutations, such as the 50-gene Ion AmpliSeq Cancer Hotspot Panel v2, which covers key oncogenes and tumor suppressor genes like KRAS, BRAF, APC, and EGFR [1].
In contrast, ddPCR employs a sample partitioning strategy, where a reaction mixture is divided into thousands to millions of nanoliter-sized droplets, each serving as an individual PCR micro-reactor. Following endpoint PCR amplification, droplets are read one-by-one to determine the fraction that contains the amplified target sequence. This allows for absolute quantification of nucleic acids without the need for a standard curve and enables the detection of rare variants with high precision [9]. Its multiplexing capabilities, while more limited than NGS, allow for the concurrent measurement of two to four targets in a single reaction using different fluorescent probes [9].
Table 1: Core Characteristics of NGS and ddPCR
| Feature | Next-Generation Sequencing (NGS) | Droplet Digital PCR (ddPCR) |
|---|---|---|
| Primary Principle | Massively parallel sequencing of DNA fragments | Partitioning and endpoint PCR for absolute quantification |
| Multiplexing Scale | High (dozens of samples, hundreds of genes) | Low to Moderate (2-4 targets per reaction) |
| Genomic Coverage | Broad, suitable for discovery | Narrow, targeted to known mutations |
| Typical Input | Genomic DNA, cfDNA | Genomic DNA, cfDNA |
| Analysis Output | Sequence data and variant calls | Absolute copy number concentration |
| Informed Approach | Can be tumor-uninformed | Typically requires tumor-informed analysis |
Performance Comparison in ctDNA Detection
Direct comparative studies reveal significant differences in the analytical sensitivity and application of NGS and ddPCR for detecting ctDNA. A 2025 study by Szeto et al. provides a head-to-head performance comparison in non-metastatic rectal cancer, which is summarized in the table below [3] [1].
Table 2: Experimental Performance Comparison in Localized Rectal Cancer (Szeto et al., 2025)
| Performance Metric | ddPCR | NGS (Cancer Hotspot Panel v2) | Statistical Significance |
|---|---|---|---|
| Detection Rate (Baseline Plasma, Development Group) | 24/41 (58.5%) | 15/41 (36.6%) | p = 0.00075 |
| Detection Rate (Baseline Plasma, Validation Group) | 21/26 (80.8%) | Not Reported | - |
| Variant Allele Frequency (VAF) Sensitivity | ~0.01% | >0.01% (threshold adjusted post-ddPCR) | - |
| Key Clinical Association | Positive ctDNA associated with higher clinical tumor stage and lymph node positivity on MRI | Similar trends, but lower detection rate | - |
| Postoperative Monitoring | Did not detect ctDNA before most recurrences | Not assessed for postoperative monitoring | - |
This data demonstrates that in a direct comparison using the same patient plasma samples, a tumor-informed ddPCR assay exhibited a significantly higher detection rate for ctDNA than the NGS panel [3] [1]. The authors attributed the superior sensitivity of ddPCR to its ability to reliably detect mutations at very low variant allele frequencies (VAFs), at approximately 0.01%. It is noteworthy that for the NGS assay, the variant calling threshold was lowered to 0.01% VAF after the ddPCR results were known, suggesting standard NGS analysis might have an even higher effective detection limit [1].
The clinical utility of a tumor-informed ddPCR approach is further supported by a study on epithelial ovarian cancer. Researchers used a targeted NGS panel to first identify patient-specific mutations in tumor tissue and then designed custom ddPCR assays to track these mutations in plasma. This combined NGS/ddPCR workflow successfully detected ctDNA in most patients, with levels that correlated strongly with treatment response and clinical recurrence, even in one case where the traditional protein biomarker CA-125 remained normal [10].
Experimental Protocols for ctDNA Analysis
NGS-Based ctDNA Detection Workflow
The following protocol is adapted from the methods used in the comparative study by Szeto et al. [1]:
- Sample Collection: Collect whole blood (e.g., 3 x 9 mL) into cell-free DNA blood collection tubes (e.g., Streck Cell Free DNA BCT). Process plasma within a specified time frame by centrifugation to separate cellular components.
- cfDNA Extraction: Isolate cell-free DNA (cfDNA) from plasma using commercial extraction kits (e.g., QIAamp Circulating Nucleic Acid Kit). Quantify the yield using a fluorescence-based assay suitable for low-concentration DNA.
- NGS Library Preparation: Construct sequencing libraries from the extracted cfDNA. For targeted sequencing:
- Use a panel such as the Ion AmpliSeq Cancer Hotspot Panel v2.
- Perform amplification using the Ion Ampliseq Library Kit 2.0.
- During library prep, incorporate molecular barcodes (indexes) to enable sample multiplexing. The use of unique dual indexes is recommended to minimize the risk of index hopping and improve demultiplexing accuracy [6].
- Template Preparation & Sequencing: Process the barcoded libraries for sequencing on a platform such as an Ion GeneStudio S5 System. This involves emulsion PCR to amplify template-positive ion sphere particles.
- Bioinformatic Analysis: Sequence the libraries and perform primary data analysis. Map sequence reads to a reference genome (e.g., hg19). For variant calling, use a validated pipeline with a sensitivity threshold set appropriately for ctDNA (e.g., 0.01% VAF). Finally, demultiplex the sequenced data based on the sample barcodes to generate individual sample files for analysis.
Tumor-Informed ddPCR Workflow
This protocol outlines the steps for developing and running a patient-specific ddPCR assay, as described in the rectal and ovarian cancer studies [1] [10]:
- Tumor Tissue Sequencing: First, identify somatic mutations from a patient's primary tumor tissue (from a resection specimen or biopsy) using a targeted NGS panel (as described above) or a whole-exome/genome approach.
- Assay Design: Select one or two mutations with the highest variant allele frequency from the tumor NGS report. Design and order custom ddPCR assays (e.g., TaqMan hydrolysis probes) specific to these mutations.
- ddPCR Reaction Setup: Partition the reaction mixture containing the patient's plasma cfDNA, ddPCR supermix, and the mutation-specific probes into 20,000 nanodroplets using a droplet generator (e.g., QX200 Droplet Generator).
- PCR Amplification: Perform endpoint PCR amplification on the droplet emulsion using a thermal cycler with a protocol optimized for the specific assays.
- Droplet Reading and Analysis: Read the droplets using a droplet reader (e.g., QX200 Droplet Reader) which counts the number of positive and negative droplets for each fluorescence channel. Use Poisson statistics to calculate the absolute concentration (copies/μL) and the variant allele frequency of the mutation in the original sample.
The following workflow diagram illustrates the key steps and decision points in these complementary protocols for ctDNA analysis.
Essential Research Reagent Solutions
Successful execution of ctDNA studies relies on a suite of specialized reagents and kits. The following table details key materials used in the protocols derived from the cited research.
Table 3: Key Research Reagents for ctDNA Analysis
| Reagent / Kit | Primary Function | Application Context |
|---|---|---|
| Streck Cell Free DNA BCT Tubes | Stabilizes blood cells to prevent lysis and preserve the native cfDNA profile before plasma separation. | Critical for pre-analytical sample integrity in both NGS and ddPCR workflows [1]. |
| cfDNA Extraction Kits (e.g., QIAamp Circulating Nucleic Acid Kit) | Isolate and purify short-fragment cfDNA from plasma samples. | Fundamental first step for all downstream ctDNA analysis [1]. |
| Targeted NGS Panels (e.g., Ion AmpliSeq Cancer Hotspot Panel v2) | Amplify and prepare specific genomic regions of interest for sequencing. | Used for initial tumor mutation discovery and for tumor-uninformed plasma screening [1]. |
| NGS Library Prep Kits with Indexes | Fragment DNA, add platform-specific adapters, and incorporate sample-specific barcodes. | Enables sample multiplexing in NGS, drastically improving throughput and reducing cost [6] [1]. |
| Custom TaqMan ddPCR Assays | Fluorescent probe-based detection of a specific DNA sequence variant during PCR. | The core of tumor-informed ctDNA tracking, providing high sensitivity for known mutations [1] [10]. |
| ddPCR Supermix | A PCR master mix formulated for use in droplet generation and emulsion PCR. | Essential reagent for creating stable droplets and achieving efficient amplification in ddPCR [9]. |
NGS establishes its primary value in ctDNA research through its unparalleled capacity for broad, hypothesis-free genomic exploration and high-level multiplexing. However, empirical evidence from recent, direct comparisons indicates that for the specific application of detecting and tracking very low levels of ctDNA—particularly in a minimal residual disease setting—tumor-informed ddPCR demonstrates superior analytical sensitivity at a lower operational cost [3] [1] [10]. The choice between these technologies is not necessarily mutually exclusive; an emerging and powerful strategy is to leverage the strengths of both. In this integrated approach, NGS is used for the initial discovery of tumor-specific mutations, and ddPCR is subsequently employed for highly sensitive, cost-effective, and longitudinal monitoring of those selected mutations during therapy and follow-up [10]. This synergistic protocol offers a pragmatic and robust path forward for personalizing cancer monitoring and managing patient treatment responses.
Liquid biopsy, particularly the analysis of circulating tumor DNA (ctDNA), has emerged as a crucial and minimally invasive adjunct to standard tissue-based testing in oncology [11]. This technique involves detecting tumor-derived DNA fragments circulating in the bloodstream, which are released by malignant cells through apoptosis, necrosis, and active secretion [12]. The short half-life of ctDNA (approximately 2 hours) enables real-time monitoring of tumor dynamics, making it an invaluable tool for cancer diagnosis, treatment monitoring, and minimal residual disease (MRD) detection [11] [12]. The utility of ctDNA extends across the entire cancer care continuum, from early detection to management of advanced disease, with applications including identification of actionable mutations for targeted therapy, assessment of treatment response, and detection of resistance mechanisms [11].
Two primary technological platforms have dominated ctDNA analysis: droplet digital PCR (ddPCR) and next-generation sequencing (NGS). Each method offers distinct advantages and limitations in sensitivity, specificity, multiplexing capability, and cost-effectiveness [11]. ddPCR is an ultrasensitive, mutation-driven assay that measures the absolute quantity of targeted DNA mutations by partitioning samples into thousands of nanodroplets [1]. In contrast, NGS-based approaches enable simultaneous detection of multiple somatic alterations across a broad panel of genes, providing a more comprehensive genomic profile [1] [11]. Understanding the relative performance characteristics of these platforms is essential for their appropriate application in clinical and research settings.
Performance Comparison: ddPCR vs. NGS in Clinical Settings
Direct Comparative Studies in Rectal Cancer
A recent 2025 comparative study by Szeto et al. directly evaluated the performance of ddPCR and NGS for ctDNA detection in non-metastatic rectal cancer [3] [1]. The research utilized pre-therapy plasma and rectal tumor samples collected from a development group (n = 41) and a validation group (n = 26). Mutations in tumor samples were first identified using NGS, after which ctDNA detection was performed with both ddPCR and NGS platforms [3] [1].
The results demonstrated a significant advantage in detection sensitivity for ddPCR compared to NGS. In the development group, ddPCR detected ctDNA in 24/41 (58.5%) of baseline plasma samples, while the NGS panel detected ctDNA in only 15/41 (36.6%) of the same samples (p = 0.00075) [3] [1]. This substantial difference in detection rates highlights ddPCR's enhanced sensitivity for ctDNA detection in localized cancers where tumor DNA shedding may be limited. In the validation cohort, the combined approach identified ctDNA in 21/26 (80.8%) patients in pre-therapy plasma, with positive ctDNA status correlating with higher clinical tumor stage and lymph node positivity detected by MRI [3] [1].
Table 1: Performance Comparison of ddPCR vs. NGS in Non-Metastatic Rectal Cancer
| Parameter | ddPCR | NGS | Statistical Significance |
|---|---|---|---|
| Detection Rate (Development Group) | 24/41 (58.5%) | 15/41 (36.6%) | p = 0.00075 |
| Detection Rate (Validation Group) | 21/26 (80.8%)* | 21/26 (80.8%)* | *Combined approach |
| Variant Allele Frequency (VAF) Sensitivity | 0.01% | 0.01% (with lowered threshold) | Comparable in optimized settings |
| Association with Clinical Factors | Higher tumor stage, lymph node positivity | Higher tumor stage, lymph node positivity | Consistent across platforms |
| Postoperative Recurrence Prediction | Limited sensitivity | Not reported | ddPCR missed most recurrences |
The study also evaluated the cost-effectiveness of both approaches, noting that operational costs for ctDNA detection with ddPCR are 5–8.5-fold lower than with NGS [1]. However, the authors cautioned that while ddPCR detects ctDNA from pre-therapy plasma at satisfactory levels in advanced rectal cancers, its overall clinical utility, particularly for postoperative recurrence prediction, requires further evaluation in clinical trials [3] [1].
Application in Lung Cancer Detection
Beyond mutation detection, ddPCR has been adapted for alternative ctDNA analysis approaches, including methylation-based assays. A 2025 study developed and validated a methylation-specific ddPCR multiplex assay for lung cancer detection using five tumor-specific methylation markers identified through in silico analysis [12]. The performance was evaluated across various clinical scenarios, including healthy controls and patients with non-metastatic and metastatic disease [12].
Table 2: Performance of Methylation-Specific ddPCR in Lung Cancer Detection
| Disease Stage | ctDNA-Positive Rate (Cut-off Method 1) | ctDNA-Positive Rate (Cut-off Method 2) | Notes |
|---|---|---|---|
| Non-Metastatic (Stage I-III) | 38.7% | 46.8% | Varying sensitivity by histological subtype |
| Metastatic (Stage IV) | 70.2% | 83.0% | Higher detection in advanced disease |
| Small Cell Lung Cancer | Higher sensitivity | Higher sensitivity | Specific histology performance |
| Squamous Cell Carcinoma | Higher sensitivity | Higher sensitivity | Specific histology performance |
The methylation-based ddPCR assay demonstrated not only utility for cancer detection but also potential application for prognostication and treatment guidance in longitudinal monitoring of patients with metastatic disease undergoing treatment [12]. The robustness and cost-effectiveness of this approach present an appealing option for ctDNA analyses, particularly in settings where resource utilization is a consideration [12].
NGS in Advanced NSCLC: Clinical Utility and Limitations
While ddPCR offers advantages in sensitivity for targeted detection, NGS provides broader genomic coverage, which is particularly valuable in molecularly complex malignancies such as non-small cell lung cancer (NSCLC). A 2025 Dutch study assessed the clinical utility of ctDNA-NGS in 72 advanced NSCLC patients [13]. The research compared concordance between standard of care (SoC) tissue- or cytology-based genotyping and ctDNA-NGS in 59 patients who underwent both testing modalities [13].
The study reported an overall concordance rate of 71.2% between SoC tissue-based testing and ctDNA-NGS [13]. Discordant results were observed in 15 patients (25.4%), though these discrepancies did not have direct therapeutic impact. Critically, in 2 patients (3.4%), ctDNA-NGS failed to detect an actionable driver mutation that would directly impact therapy selection, highlighting a significant limitation in sensitivity for important therapeutic targets [13].
The researchers modeled hypothetical shifts in diagnostic yield, predicting that implementing a ctDNA-first testing strategy for all advanced NSCLC patients would decrease diagnostic yield for actionable and non-actionable drivers by 7.0% [13]. However, offering ctDNA-NGS only to patients who could not undergo SoC tissue testing would increase diagnostic yield by 6.7% [13]. These findings support a complementary rather than replacement role for ctDNA-NGS alongside tissue-based testing in current clinical practice.
Experimental Protocols and Methodologies
Sample Collection and Processing Protocols
Standardized protocols for sample collection and processing are critical for reliable ctDNA analysis across both ddPCR and NGS platforms. In the rectal cancer comparison study, baseline plasma samples were collected before any neoadjuvant therapy on the day of the first clinical visit [1]. From each patient, 3 × 9 mL of blood was collected into Streck Cell Free DNA BCT vacuum tubes, which stabilize nucleated blood cells to prevent genomic DNA contamination [1]. Follow-up plasma samples were collected 12 months after surgery during outpatient visits, following any adjuvant therapy [1].
For plasma separation, blood samples were centrifuged at 2,000 g for 10 minutes within 4 hours of venepuncture [12]. The resulting plasma was then subjected to a second centrifugation at 10,000 g for 10 minutes to remove remaining cellular debris [12]. The double-centrifugation protocol is essential to minimize contamination by cellular genomic DNA, which could significantly affect assay sensitivity and specificity. Processed plasma was stored at -80°C until cfDNA extraction [12] [13].
Cell-free DNA Extraction and Quality Control
Cell-free DNA was extracted from plasma using specialized kits such as the QIAamp Circulating Nucleic Acid kit (Qiagen) or DSP Circulating DNA Kit (Qiagen) on automated systems like QIAsymphony SP [12] [13]. Extraction efficiency was monitored using exogenous spike-in DNA fragments (e.g., CPP1) added to the plasma before extraction [12]. For the methylation-specific ddPCR assay, approximately 9,000 copies/mL of spike-in DNA were used [12].
Quality control measures included assessment of potential lymphocyte DNA contamination using an immunoglobulin gene-specific ddPCR assay (PBC) [12]. Total cfDNA concentration and contamination with high-molecular-weight DNA were evaluated with ddPCR assays amplifying different length regions (65 bp and 250 bp) of the EMC7 gene [12]. The ratio of longer to shorter fragments helps identify high-molecular-weight DNA contamination from cell lysis.
Tumor Tissue Processing and Analysis
For tumor-informed ctDNA assays (common in ddPCR applications), molecular analysis of tumor tissue is first performed to identify patient-specific mutations. In the rectal cancer study, tissue specimens for tumor DNA in the development cohort were collected from surgical resection specimens following any neoadjuvant therapy [1]. For the validation cohort, tumor DNA was isolated from pre-therapy biopsies [1].
DNA from formalin-fixed paraffin-embedded (FFPE) tissue samples was extracted using systems such as Maxwell RSC (Promega) with the Maxwell FFPE Plus DNA Kit [12]. Tumor DNA underwent sequencing using panels such as the Ion AmpliSeq Cancer Hotspot Panel v2 (HS1) by ThermoFisher, which covers >2800 COSMIC variants from 50 oncogene and tumor suppressor gene hotspot regions with theoretical coverage of 99% in rectal patients [1]. The detection rate ranges from 98% to 5% variant allele frequency (VAF) with average 2000× coverage [1].
ctDNA Detection Methodologies
ddPCR Methodology: For ddPCR analysis, one to two predesigned probes were used based on the mutations with the highest variant allele frequencies identified in the matched primary tumor NGS [1]. The technique partitions 2-9 μL extracted DNA into 20,000 droplets and calculates the absolute quantity of targeted cfDNA based on PCR-positive and PCR-negative droplets [1]. This approach enables detection of somatic alterations at low frequencies (VAF 0.01%) [1]. For methylation analyses, extracted DNA was concentrated and bisulfite-converted using kits such as the EZ DNA Methylation-Lightning Kit (Zymo Research) before ddPCR analysis [12].
NGS Methodology: The NGS approach utilized in the rectal cancer study employed the same HS1 panel as for primary tumors but optimized for ctDNA detection [1]. Based on ddPCR results, the variant calling threshold for the NGS panel sequencing was lowered, with the threshold for detection of somatic alteration set at 0.01% VAF [1]. In the NSCLC study, an in-house developed NGS test using a custom probe set covering 117 kb and including relevant DNA variants from 45 genes was utilized [13]. Libraries were prepared using the Twist Library Preparation Kit with xGEN dual index unique molecular identifiers (UMI) adaptors to correct for PCR errors and artifacts [13]. Sequencing was performed on NovaSeq6000 systems (Illumina) producing 2 × 150 bp paired-end reads [13].
Visualization of Experimental Workflows
ctDNA Analysis Workflow: From Blood Draw to Clinical Interpretation
Technology Selection Decision Pathway
Essential Research Reagent Solutions
Table 3: Key Research Reagents and Materials for ctDNA Analysis
| Reagent/Material | Function | Example Products | Application Notes |
|---|---|---|---|
| Cell-Free DNA Blood Collection Tubes | Stabilizes nucleated blood cells to prevent genomic DNA contamination | Streck Cell-Free DNA BCT, Roche Cell-Free DNA Collection Tubes | Enables sample stability during transport (up to 5 days) [1] [13] |
| cfDNA Extraction Kits | Isolation of high-quality cfDNA from plasma | QIAamp Circulating Nucleic Acid Kit, DSP Circulating DNA Kit | Critical for obtaining pure cfDNA without contaminants [12] [13] |
| DNA Methylation Conversion Kits | Bisulfite conversion of DNA for methylation analysis | EZ DNA Methylation-Lightning Kit | Essential for methylation-specific ddPCR assays [12] |
| ddPCR Supermixes | Digital PCR reaction setup for absolute quantification | ddPCR Supermix for Probes, Methylation-Specific ddPCR Kits | Enables partitioning into 20,000 droplets for sensitive detection [1] [12] |
| NGS Library Preparation Kits | Preparation of sequencing libraries from cfDNA | Twist Library Preparation Kit | Incorporates UMIs for error correction [13] |
| Targeted Sequencing Panels | Capture of cancer-relevant genomic regions | Ion AmpliSeq Cancer Hotspot Panel v2, Custom Panels | Covers hotspot mutations in multiple cancer genes [1] [13] |
| Quality Control Assays | Assessment of cfDNA quality and quantity | EMC7 65/250 bp assays, SPIKE-IN DNA controls | Verifies extraction efficiency and detects contamination [12] |
The comparative analysis between ddPCR and NGS for ctDNA detection reveals a complementary relationship rather than a superior-inferior dynamic. ddPCR demonstrates superior sensitivity for detecting specific mutations at low variant allele frequencies (58.5% vs 36.6% detection in rectal cancer baseline plasma) and offers significant cost advantages (5-8.5-fold lower operational costs) [3] [1]. This makes it particularly valuable for monitoring known mutations in tumor-informed settings and for applications requiring high sensitivity, such as MRD detection. The development of methylation-specific ddPCR assays further expands its utility to epigenetic markers, with detection rates of 38.7-46.8% in non-metastatic and 70.2-83.0% in metastatic lung cancer [12].
NGS, while less sensitive for individual mutations, provides unparalleled comprehensive genomic profiling, enabling detection of multiple mutation types across numerous genes simultaneously [11] [13]. This broad coverage is particularly valuable for initial molecular characterization in advanced cancers where identifying all potential therapeutic targets is critical. The 71.2% concordance between tissue-based and ctDNA-NGS testing in NSCLC highlights both its utility and current limitations, with the potential to miss 3.4% of actionable drivers [13].
The optimal integration of these technologies in clinical practice will likely involve strategic application based on specific clinical scenarios: ddPCR for high-sensitivity monitoring of known alterations, and NGS for comprehensive genomic profiling when tissue is unavailable or broader detection is needed. As ctDNA analysis continues to evolve, standardization of methodologies and validation in large-scale clinical trials will be essential to fully realize its potential in precision oncology [11] [14].
Limit of Detection (LOD), Variant Allele Frequency (VAF), and Sensitivity
This guide provides an objective comparison of the key performance metrics—Limit of Detection (LOD), Variant Allele Frequency (VAF), and Sensitivity—for Droplet Digital PCR (ddPCR) and Next-Generation Sequencing (NGS) in the context of circulating tumor DNA (ctDNA) analysis.
Performance Metrics Comparison
The table below summarizes the core performance characteristics of ddPCR and NGS based on recent comparative studies and technological validations.
Table 1: Key Performance Metrics for ddPCR and NGS in ctDNA Analysis
| Performance Metric | Droplet Digital PCR (ddPCR) | Next-Generation Sequencing (NGS) |
|---|---|---|
| Typical Limit of Detection (LOD) | 0.01% VAF [1] / 0.003% VAF with optimized protocols [15] | 0.1% - 0.5% VAF for standard panels [16] [17] |
| Sensitivity in Pre-Therapy Plasma (Rectal Cancer Study) | 58.5% (24/41 patients) [3] [1] | 36.6% (15/41 patients) [3] [1] |
| Variant Allele Frequency (VAF) Range in Clinical Studies | 0.003% - 14.61% [15] | Median 0.15% in validated CGP assays [17] |
| Throughput | Low (1-4 mutations per assay) [16] | High (dozens to hundreds of genes per panel) [16] |
| Typical Cost | 5-8.5 times lower than NGS per assay [1] | Higher, cost increases with sequencing depth [16] [1] |
Experimental Protocols and Supporting Data
Head-to-Head Comparison in Rectal Cancer
A 2025 study directly compared ddPCR and NGS for ctDNA detection in non-metastatic rectal cancer, providing robust experimental data for performance comparison [3] [1] [18].
Methodology:
- Patient Cohorts: A development group (n=41) and a validation group (n=26) with non-metastatic rectal cancer were enrolled [1].
- Tumor Sequencing: Somatic mutations in primary tumor specimens were first identified using an Ion AmpliSeq Cancer Hotspot Panel v2 (HS1) via NGS [1].
- ctDNA Detection with ddPCR: Based on the tumor NGS results, one to two predesigned ddPCR probes were selected to target the mutations with the highest variant allele frequencies. The ddPCR assays were performed by partitioning 2-9 μL of extracted DNA into 20,000 droplets, enabling absolute quantification of mutant cfDNA fragments with a sensitivity down to 0.01% VAF [1].
- ctDNA Detection with NGS: The same HS1 panel sequencing used for the tumors was applied to plasma cfDNA, but the variant calling threshold was lowered to 0.01% VAF to optimize for ctDNA detection [1].
- Analysis: Results from both platforms were compared, and ctDNA positivity was defined as the detection of any oncogenic mutation in the plasma [1].
Key Findings:
- In the development group, ddPCR demonstrated a significantly higher detection rate (58.5%) compared to NGS (36.6%) in baseline plasma samples (p = 0.00075) [3] [1].
- The study concluded that ddPCR was more effective for detecting ctDNA from pre-therapy plasma in patients with advanced rectal cancers [3].
Technological Validation of NGS Assays
While the rectal cancer study highlighted the superior sensitivity of ddPCR, advancements in NGS technology are continuously pushing its detection limits.
Methodology for High-Sensitivity NGS:
- Northstar Select Assay Validation: This tumor-naive Comprehensive Genomic Profiling (CGP) assay was analytically and clinically validated using 674 patient samples [17].
- Key Technical Improvements: The assay's performance relies on several technological enhancements common to modern NGS workflows:
- Ultra-Deep Sequencing: Achieving a raw coverage of ~15,000x to support a lower LOD [16].
- Unique Molecular Identifiers (UMIs): Short barcodes added to DNA fragments before PCR amplification to correct for amplification errors and deduplicate reads, minimizing false positives [16].
- Bioinformatics Pipelines: Implementing "allowed" and "blocked" lists and dynamic LOD approaches calibrated to sequencing depth to enhance result reliability [16].
Key Findings:
- The Northstar Select assay demonstrated a 95% Limit of Detection of 0.15% VAF for SNVs/Indels, which was confirmed by ddPCR [17].
- It identified 51% more pathogenic SNVs/indels and 109% more CNVs compared to on-market CGP assays, with 91% of the additional actionable variants found below 0.5% VAF [17].
Workflow and Decision Pathway
The following diagram illustrates the typical experimental workflows for ddPCR and NGS in ctDNA analysis, highlighting their key distinguishing features.
The Scientist's Toolkit: Essential Research Reagents
The table below lists key reagents and materials critical for conducting the experiments cited in this comparison.
Table 2: Essential Research Reagents for ctDNA Analysis
| Reagent / Material | Function | Example from Cited Studies |
|---|---|---|
| Streck Cell-Free DNA BCT Tubes | Stabilizes blood samples to prevent white blood cell lysis and preserve cfDNA profile before plasma separation. | Used for blood collection in the rectal cancer study [1]. |
| Ion AmpliSeq Cancer Hotspot Panel v2 | Targeted NGS panel for identifying hotspot mutations in 50 oncogenes and tumor suppressor genes from tumor DNA. | Used for initial tumor mutation profiling [1]. |
| Custom ddPCR Mutation Probes | Fluorescently labeled probes designed to detect specific point mutations identified in a patient's tumor. | Designed based on tumor NGS results for ctDNA detection [1]. |
| Unique Molecular Identifiers (UMIs) | Short nucleotide barcodes ligated to individual DNA molecules before PCR to track and correct for amplification errors and duplicates. | Critical for reducing false positives in NGS workflows [16]. |
| Hybrid-Capture Probes | Biotinylated oligonucleotide probes used to selectively enrich target genomic regions from a sequencing library. | Used in comprehensive genomic profiling assays like Northstar Select [17]. |
Strategic Deployment: Matching ddPCR and NGS to Clinical and Research Applications
In the evolving field of circulating tumor DNA (ctDNA) analysis, the choice between tumor-informed and tumor-uninformed (also known as tumor-agnostic or tumor-naive) approaches represents a critical decision point for researchers and clinicians. This comparison is essential within the broader context of evaluating droplet digital PCR (ddPCR) and next-generation sequencing (NGS) methodologies for ctDNA research. The fundamental distinction lies in whether the assay is personalized based on prior knowledge of the patient's tumor genome or uses a standardized, one-size-fits-all panel [19] [20]. Understanding the workflow implications of each approach—encompassing sensitivity, specificity, logistical requirements, and integration into research and clinical trials—is paramount for advancing cancer diagnostics and therapeutic monitoring.
Conceptual Frameworks and Key Definitions
Tumor-Informed Approach
The tumor-informed approach is a two-step process that initiates with the comprehensive genomic analysis of a patient's tumor tissue, typically obtained from a surgical resection or biopsy. The objective is to identify a set of patient-specific somatic mutations (e.g., SNVs, indels). This mutational profile is then used to create a personalized assay, either via NGS or ddPCR, to track these specific alterations in subsequent liquid biopsies [19] [21]. The core strength of this method is its high level of personalization, which allows for the monitoring of mutations unique to the individual's cancer while simultaneously filtering out non-tumor-derived mutations, such as those arising from clonal hematopoiesis (CH), thereby minimizing false-positive results [21] [19].
Tumor-Uninformed Approach
In contrast, the tumor-uninformed approach operates without prior knowledge of the patient's tumor genome. This method utilizes a fixed, pre-defined panel of mutations or methylation markers that are recurrent across a specific cancer type or cancers in general. The same standardized assay is applied to all patients' plasma cfDNA samples to detect the presence of ctDNA [19] [3]. The primary advantage of this strategy is its logistical simplicity, as it eliminates the dependency on tumor tissue availability and sequencing, leading to a faster initial turnaround time [22].
Workflow Comparison and Technical Performance
A direct comparison of the operational and performance characteristics of both approaches is crucial for selection. The data summarized in the table below highlights key trade-offs.
Table 1: Workflow and Performance Comparison of Tumor-Informed vs. Tumor-Uninformed Approaches
| Feature | Tumor-Informed Approach | Tumor-Uninformed Approach |
|---|---|---|
| Core Principle | Personalized assay based on patient's tumor mutational profile [19] | Standardized assay using a fixed panel of recurrent mutations [19] |
| Tissue Requirement | Mandatory tumor tissue sample (surgery/biopsy) [19] | No tumor tissue required [19] |
| Initial Turnaround Time | Longer (e.g., 4-6 weeks for tumor sequencing and assay design) [22] | Shorter (e.g., 7-14 days) [22] |
| Sensitivity for MRD Detection | Higher; detects lower variant allele frequencies (VAFs) [21] [19] | Lower; limited by panel design and VAF detection limit [21] |
| Specificity | Higher; filters CH mutations, reducing false positives [21] [19] | Lower; potential for false positives from CH [21] |
| Typical VAF Detection Limit | Can detect VAFs as low as 0.01% [21] [1] | Typically around 0.1% VAF [21] |
| Ideal Application | Minimal residual disease (MRD) detection, recurrence monitoring in clinical trials [21] [23] | Situations with no tumor tissue, treatment selection in advanced disease |
| Cost & Logistics | Higher initial cost and complexity [19] | Lower initial cost and simpler logistics [1] |
Quantitative Performance Data in Colorectal Cancer
Evidence from a 2023 study in colorectal cancer (CRC) patients underscores the performance differential. The tumor-informed method successfully identified at least one genomic alteration for monitoring in 84% (32/38) of patients, with no CH-related false positives. In the same cohort, the tumor-agnostic approach could only define a monitoring alteration in 37% (14/38) of patients after excluding CH mutations [21]. The clinical impact was clear: the median VAF of mutations detected during surveillance was 0.028%, and 80% (8/10) of these mutations were below the 0.1% VAF detection limit of the tumor-agnostic assay. This lower sensitivity translated to a reduction in recurrence detection sensitivity, from 100% with longitudinal tumor-informed testing to 67% with the tumor-agnostic method [21].
A 2022 meta-analysis further solidified this performance gap, reporting a pooled hazard ratio (HR) for recurrence of 8.66 for tumor-informed methods versus 3.76 for tumor-naive methods in colorectal cancer, indicating a superior prognostic value for the tumor-informed approach [19].
Experimental Protocols for Method Comparison
To generate the comparative data discussed above, rigorous experimental protocols are employed. The following workflow diagrams and detailed methodologies illustrate how such comparisons are structured in clinical studies.
Diagram 1: Experimental Workflow for ctDNA Assay Comparison. This protocol outlines the parallel paths for evaluating tumor-informed (often via ddPCR) and tumor-uninformed (via NGS) approaches in a single patient cohort.
Detailed Methodology from a Rectal Cancer Study
A 2025 study by Szeto et al. provides a representative protocol for a head-to-head comparison, focusing on non-metastatic rectal cancer [1].
1. Patient Cohort and Sample Collection:
- Cohorts: Patients are typically divided into a development group (n=41) and a validation group (n=26).
- Sample Types: Pre-therapy plasma and matched tumor samples (from surgical resection or pre-treatment biopsies) are collected.
- Longitudinal Sampling: Follow-up plasma samples are collected at predefined intervals post-surgery (e.g., 12 months) to monitor for MRD.
2. Tumor Tissue Genomic Analysis:
- DNA Extraction: Genomic DNA is extracted from tumor tissues using kits like the Qiagen Allprep DNA Mini Kit.
- Tumor Sequencing: Somatic alterations in the primary tumor are identified using targeted NGS panels, such as the Ion AmpliSeq Cancer Hotspot Panel v2 (HS1). This panel covers hotspot regions in 50 genes (e.g., KRAS, BRAF, APC, EGFR) with an average sequencing coverage of 2000x.
3. ctDNA Detection via Dual-Method Workflow:
- cfDNA Extraction: Cell-free DNA is isolated from plasma using specialized kits like the MagMAX Cell-Free Total Nucleic Acid Isolation Kit.
- Tumor-Informed ddPCR: Based on the tumor NGS results, one to two mutations with the highest variant allele frequency (VAF) are selected. Custom ddPCR probes are designed for these mutations. The ddPCR run partitions the sample into ~20,000 droplets, allowing for absolute quantification and detection of VAFs as low as 0.01%.
- Tumor-Uninformed NGS: The same plasma cfDNA samples are analyzed using the fixed NGS panel (HS1), but with the variant calling threshold lowered to 0.01% VAF to match the ddPCR's theoretical sensitivity.
4. Data Analysis and Endpoints:
- Concordance: Detection rates between ddPCR and NGS at baseline (pre-therapy) are compared.
- Association with Pathology: ctDNA positivity is correlated with clinical factors like tumor stage and lymph node status.
- Recurrence Prediction: The utility of each method in predicting disease recurrence within one year post-surgery is assessed.
The Scientist's Toolkit: Essential Research Reagents
Table 2: Key Reagents and Kits for ctDNA Workflow Research
| Research Reagent / Kit | Primary Function in Workflow |
|---|---|
| Streck Cell-Free DNA BCT Tubes | Blood collection tube that stabilizes nucleated blood cells, preventing genomic DNA contamination and preserving cfDNA profile [1]. |
| MagMAX Cell-Free Total Nucleic Acid Isolation Kit | Automated extraction of cell-free total nucleic acid (cfTNA) from plasma, ensuring high recovery of short DNA fragments [21]. |
| Qiagen Allprep DNA Mini Kit | Simultaneous purification of genomic DNA from tumor tissue and peripheral blood cells (PBCs) for paired analysis [21] [1]. |
| Ion AmpliSeq Cancer Hotspot Panel v2 | Targeted NGS panel for identifying somatic mutations in hotspot regions of 50 cancer-related genes from tumor DNA [1]. |
| Oncomine Pan-Cancer Cell-Free Assay | A tumor-uninformed NGS panel designed for cfDNA, targeting 52 genes to detect SNVs, indels, CNVs, and fusions [21]. |
| ddPCR Supermix & Custom Probes | Enables ultrasensitive, absolute quantification of specific mutant alleles identified from tumor sequencing [1]. |
Integration in Clinical Research and Future Directions
The application of these approaches is being actively tested in large-scale clinical trials, which shape their future utility. In stage II colon cancer, the prospective DYNAMIC trial demonstrated that a ctDNA-guided strategy (using a tumor-informed approach) could significantly reduce adjuvant chemotherapy use (15% vs. 28%) without compromising recurrence-free survival [22]. For stage III colon cancer, the ongoing CIRCULATE-North America trial is evaluating a tumor-informed approach to de-escalate therapy in ctDNA-negative patients and intensify treatment for ctDNA-positive patients [22].
Longitudinal monitoring studies, such as the GALAXY and INTERCEPT cohorts, consistently show that patients who remain ctDNA-negative have excellent outcomes. Furthermore, a key finding is the lead time advantage: ctDNA detection often precedes radiographic evidence of recurrence by a median of 5 to 5.5 months, offering a critical window for early intervention [21] [22]. As the field progresses, market analysis predicts a shift towards tumor-informed approaches in clinical practice by 2027, driven by their superior performance despite initial logistical hurdles [19].
Droplet Digital PCR (ddPCR) has emerged as a powerful third-generation PCR technology that enables absolute quantification of nucleic acids with exceptional sensitivity and precision. Unlike conventional quantitative PCR (qPCR), which relies on standard curves and provides relative quantification, ddPCR utilizes massive sample partitioning to directly quantify target sequences through Poisson statistics [24]. This technological advancement has positioned ddPCR as an ideal platform for minimal residual disease (MRD) monitoring and longitudinal mutation tracking in oncology, hematology, and infectious disease diagnostics.
The fundamental principle of ddPCR involves partitioning each sample into 20,000 nanoliter-sized droplets, effectively creating thousands of individual PCR reactions. This partitioning enables sensitive detection of rare target sequences—as low as 0.001% variant allele frequency (VAF)—by minimizing competition between wild-type and mutant sequences during amplification [25] [24]. This exceptional sensitivity makes ddPCR particularly valuable for detecting circulating tumor DNA (ctDNA) in liquid biopsies, where tumor-derived DNA fragments may represent ≤ 0.1% of total cell-free DNA, especially in early-stage cancers or during MRD monitoring [26].
Within the context of ctDNA research, ddPCR occupies a crucial niche between broader but less sensitive next-generation sequencing (NGS) approaches and traditional PCR methods. While NGS provides comprehensive genomic profiling capabilities, ddPCR offers superior sensitivity for tracking specific known mutations over time, making it particularly suitable for monitoring treatment response, detecting emergent resistance mutations, and identifying early disease recurrence [27] [1].
Performance Comparison: ddPCR vs. Next-Generation Sequencing
Multiple studies have directly compared the analytical performance of ddPCR and NGS for ctDNA detection across various cancer types, revealing distinct advantages and limitations for each technology depending on the clinical application.
Table 1: Comparative Performance of ddPCR and NGS in ctDNA Detection
| Parameter | ddPCR | NGS | Clinical Context | Source |
|---|---|---|---|---|
| Sensitivity | 0.001% VAF [25] | 0.01%-0.1% VAF [1] | MRD monitoring | |
| Detection Rate | 58.5% (24/41) [1] | 36.6% (15/41) [1] | Pre-therapy rectal cancer | |
| Concordance with Reference | >90% with pdPCR [26] | 87.5% sensitivity, 100% specificity vs. ddPCR [27] | Early-stage breast cancer | |
| Multiplexing Capacity | Limited (typically 2-4 targets) [28] | High (dozens to hundreds of targets) [27] | Multi-gene analysis | |
| Throughput | Targeted, mutation-specific | High-throughput, multi-gene | Population-scale screening | |
| Cost per Sample | 5-8.5-fold lower than NGS [1] | Higher due to library prep and bioinformatics | Resource-limited settings |
A 2025 study on non-metastatic rectal cancer demonstrated that ddPCR detected ctDNA in 58.5% (24/41) of baseline plasma samples compared to 36.6% (15/41) detected by an NGS panel (p = 0.00075) [1] [29]. This significant difference highlights ddPCR's superior sensitivity for detecting low-frequency mutations in limited-volume samples. The same study also noted that positive ctDNA results correlated with higher clinical tumor stage and lymph node positivity detected by MRI, underscoring the clinical relevance of ddPCR findings [1].
In metastatic colorectal cancer patients treated with cetuximab, a direct comparison revealed high concordance between ddPCR and NGS (R² = 0.98) for variant allele frequency quantification, with NGS demonstrating 87.5% sensitivity and 100% specificity when using ddPCR as reference [27]. However, the NGS approach provided additional clinical value by identifying dynamic changes in TP53 mutation levels that correlated with treatment response and disease progression—mutations that were not targeted by the ddPCR assays [27].
Table 2: Advantages and Limitations of ddPCR vs. NGS
| Application | ddPCR Advantages | NGS Advantages |
|---|---|---|
| MRD Monitoring | Superior sensitivity (0.001% VAF); cost-effective for known targets [25] | Broader mutation screening; ability to detect unexpected mutations [27] |
| Treatment Response | Precise quantification of known resistance mutations; rapid turnaround [27] | Comprehensive resistance pattern identification; novel mutation discovery [27] |
| Early Detection | High sensitivity for low VAF mutations; minimal sample input [26] | Unbiased genome-wide approach; no prior knowledge of mutations required |
| Longitudinal Tracking | Excellent reproducibility; minimal technical variability [24] | Adaptability to evolving mutation profiles; retrospective data analysis |
For measurable residual disease monitoring in hematological malignancies, ddPCR has demonstrated exceptional performance in predicting clinical outcomes. A 2024 study of acute myeloid leukemia (AML) and myelodysplastic syndrome (MDS) patients after allogeneic hematopoietic stem cell transplantation showed that ddPCR-MRD positivity for non-DTA genes (DNMT3A, TET2, and ASXL1) was associated with significantly higher cumulative incidence of relapse (38.7% vs. 9.7%, P < 0.001) and lower relapse-free survival (55.5% vs. 83.7%, P < 0.001) [25]. This study also demonstrated that combining ddPCR with multiparameter flow cytometry further improved relapse prediction accuracy [25].
Experimental Protocols and Methodologies
ddPCR Workflow for MRD Detection
The standard ddPCR workflow for MRD monitoring involves several critical steps that must be optimized for reliable results:
Sample Preparation and DNA Extraction: Plasma samples are typically collected in specialized blood collection tubes containing EDTA or cell-free DNA preservatives. For MRD detection in hematological malignancies, bone marrow aspirates may be used. Within one hour of collection, tubes undergo centrifugation at 820 × g for 10 minutes to separate plasma from cellular components [30]. A second centrifugation at 16,000 × g for 10 minutes removes remaining cellular debris [30]. Cell-free DNA is then extracted using commercial kits, such as the QIAamp DNA Blood Mini Kit, with elution volumes typically ranging from 20-60 μL [28] [30].
Droplet Generation and PCR Amplification: The ddPCR reaction mixture contains extracted DNA template, primers, fluorescent probes (typically FAM and HEX/VIC labeled), and ddPCR Supermix. This mixture is partitioned into 20,000 nanoliter-sized droplets using a droplet generator [27]. The emulsion undergoes PCR amplification with thermal cycling conditions optimized for each assay. A typical protocol includes: enzyme activation at 95°C for 10 minutes; 40 cycles of denaturation at 94°C for 30 seconds and annealing/extension at 55-60°°C for 1 minute; and enzyme deactivation at 98°C for 10 minutes [27] [28]. Specific assays may require optimization of annealing temperatures and cycle numbers—for example, the PICALM::MLLT10 fusion transcript assay performed best with an annealing temperature of 58°C [28].
Droplet Reading and Data Analysis: After amplification, droplets are analyzed using a droplet reader that counts fluorescent-positive and negative droplets for each target. Data analysis software applies Poisson statistics to calculate the absolute concentration of target molecules in the original sample, reported as copies/μL or variant allele frequency [24]. The threshold for MRD positivity is typically set at VAF ≥ 0.001% (1 mutant molecule per 100,000 wild-type molecules) [25].
Assay Optimization and Validation
Successful ddPCR implementation requires rigorous assay optimization and validation. Key parameters include:
Primer and Probe Design: Primers and TaqMan probes are designed following manufacturer guidelines, with amplicon sizes ideally kept under 200 bp for optimal amplification efficiency [28]. Specificity must be confirmed through conventional PCR and Sanger sequencing before ddPCR implementation [28].
Thermal Cycling Optimization: Annealing temperatures must be optimized for each assay. For example, the CEBPA c.185_191del assay required increased denaturation temperature from 94°C to 96°C to reduce "raindrop" formation and improve PCR efficiency [28]. The PICALM::MLLT10 fusion transcript assay showed better separation of positive and negative clusters with lower annealing temperatures (58°C vs. 60°C) [28].
Limit of Detection (LOD) Determination: Assay sensitivity is established through serial dilution of positive control material into wild-type background. The LOD is typically defined as the lowest concentration where 95% of positive samples are detected [28]. For fusion transcript detection, precision is validated through replicate testing, with coefficients of variation ideally below 5% for intra-run and below 10% for inter-run variability [28].
Restriction Enzyme Digestion: For certain mutation detection assays, an additional restriction enzyme digestion step may be incorporated to improve specificity by eliminating wild-type templates [28].
Key Research Reagent Solutions
Successful implementation of ddPCR for MRD monitoring requires specific reagents and equipment optimized for high-sensitivity detection.
Table 3: Essential Research Reagents for ddPCR-based MRD Detection
| Reagent Category | Specific Examples | Function and Importance | Optimization Tips |
|---|---|---|---|
| Blood Collection Tubes | Streck Cell-Free DNA BCT, EDTA tubes | Preserve cell-free DNA profile, prevent white blood cell lysis | Process within 4 hours of collection [1] |
| DNA Extraction Kits | QIAamp DNA Blood Mini Kit, DSP Circulating DNA Kit | Isolve high-quality cfDNA with minimal fragmentation | Elute in small volumes (20-60 μL) to maximize concentration [30] |
| ddPCR Supermix | ddPCR Supermix for Probes (Bio-Rad) | Provide optimal environment for amplification in droplets | Include restriction enzymes when needed for improved specificity [28] |
| Fluorescent Probes | FAM- and HEX-labeled TaqMan probes | Enable specific target detection and quantification | Design amplicons <200 bp; verify specificity with Sanger sequencing [28] |
| Positive Controls | Cell line DNA (PC9, H1975), synthetic gBlocks | Validate assay performance and sensitivity | Create dilution series in wild-type background for LOD determination [30] |
| Droplet Generation Oil | Droplet Generation Oil for Probes | Create stable water-in-oil emulsion for partitioning | Ensure proper oil:sample ratio for consistent droplet formation |
Clinical Applications and Case Studies
Hematological Malignancies
In acute myeloid leukemia, ddPCR has proven highly effective for monitoring fusion transcripts and mutations associated with treatment response and relapse. A 2024 study developed ddPCR assays for rare fusion transcripts including atypical BCR::ABL1 variants (e19a2, e23a2ins52, e13a2ins74), CBFB::MYH11 (types G and I), PCM1::JAK2, KMT2A::ELL2, and PICALM::MLLT10 [28]. These assays enabled serial MRD monitoring that guided treatment decisions, with the BCR::ABL1 assay showing sufficient sensitivity to monitor deep molecular responses essential for guiding tyrosine kinase inhibitor discontinuation decisions [28].
The same study highlighted the importance of assay optimization—for the CEBPA c.185_191del detection assay, increasing the denaturation temperature from 94°C to 96°C significantly improved PCR efficiency, reducing "raindrop" formation and increasing total copies per well from 2,000-3,000 to 7,000-10,000 [28]. This optimization was critical for achieving the sensitivity required for reliable MRD detection.
Solid Tumors
In colorectal cancer, ddPCR has demonstrated utility for monitoring treatment response and detecting resistance mutations. A 2018 study of metastatic colorectal cancer patients treated with cetuximab used ddPCR to dynamically monitor emerging RAS mutations associated with drug resistance [27]. The study found that these resistance mutations could be detected in ctDNA several weeks before radiographic evidence of disease progression, potentially allowing for earlier treatment modification [27].
For non-metastatic rectal cancer, a 2025 study found that ddPCR detected ctDNA in 58.5% of patients before therapy, with detection rates increasing to 80.8% in a validation cohort [1] [29]. Positive ctDNA status correlated with higher clinical tumor stage and lymph node involvement, suggesting potential utility for risk stratification [1].
Technology Integration Pathways
The complementary strengths of ddPCR and NGS suggest optimal integration pathways for clinical care and research:
This integrated approach leverages the broad discovery power of NGS for initial comprehensive profiling while utilizing the cost-effectiveness and superior sensitivity of ddPCR for frequent monitoring of known mutations during treatment and surveillance.
Droplet Digital PCR has established itself as an indispensable technology for high-sensitivity MRD monitoring and longitudinal tracking of known mutations across various cancer types. Its exceptional sensitivity (down to 0.001% VAF), absolute quantification capabilities, and cost-effectiveness position it as the preferred method for monitoring specific genetic targets during treatment and surveillance.
While NGS offers broader genomic coverage and discovery potential, ddPCR provides superior sensitivity for detecting low-frequency mutations, making these technologies complementary rather than competitive. The experimental data summarized in this review demonstrates that ddPCR consistently outperforms NGS in detection rates for low VAF mutations while requiring less sample input and offering faster turnaround times.
For researchers and clinicians implementing ddPCR assays, careful attention to pre-analytical variables, assay optimization, and validation is essential for achieving reliable results. The continued refinement of ddPCR technologies and integration with other detection methods will further enhance its utility in personalized cancer management, ultimately improving patient outcomes through more sensitive disease monitoring and earlier intervention.
Comprehensive Genomic Profiling, Resistance Mutation Discovery, and Pan-Cancer Screening
The analysis of circulating tumor DNA (ctDNA) has become a cornerstone of precision oncology, enabling non-invasive detection of tumor-specific mutations, monitoring of treatment response, and identification of resistance mechanisms. Two primary technologies have emerged as critical tools in this field: droplet digital PCR (ddPCR) and next-generation sequencing (NGS). While both methods can detect ctDNA, they differ significantly in their technical approaches, applications, and performance characteristics [3] [1]. ddPCR represents a highly sensitive, targeted approach optimized for detecting specific, known mutations, whereas NGS enables broad genomic profiling across hundreds of genes in a single assay [31] [32]. This comparison guide examines the relative strengths, limitations, and optimal applications of each technology within ctDNA research, providing researchers and drug development professionals with evidence-based insights for experimental design.
The fundamental technological differences between these platforms drive their distinctive performance characteristics. ddPCR operates by partitioning a single PCR reaction into thousands of nanoliter-sized droplets, then performing amplification within each individual droplet. This allows for absolute quantification of target sequences without the need for standard curves, achieving exceptional sensitivity for detecting rare variants [26]. In contrast, NGS utilizes massively parallel sequencing to simultaneously analyze millions of DNA fragments, providing comprehensive genomic coverage but typically with lower sensitivity for any single mutation compared to ddPCR [1] [32]. Understanding these core technological differences is essential for selecting the appropriate methodology for specific research questions in cancer genomics.
Performance Comparison: ddPCR versus NGS
Direct Comparative Studies
Recent head-to-head comparisons in clinical cohorts provide valuable insights into the relative performance of ddPCR and NGS for ctDNA detection. A 2025 study by Szeto et al. directly compared these technologies in non-metastatic rectal cancer patients, revealing significant differences in detection capabilities [3] [1]. In the development cohort (n=41), ddPCR demonstrated markedly higher sensitivity, detecting ctDNA in 24/41 (58.5%) of baseline plasma samples, while the NGS panel detected ctDNA in only 15/41 (36.6%) of the same samples (p = 0.00075) [3]. This substantial difference in detection rates highlights the superior sensitivity of ddPCR for identifying low-frequency mutations in limited analyte samples.
The performance disparity between these technologies becomes particularly important in minimal residual disease (MRD) monitoring and early-stage cancers, where ctDNA fractions can be extremely low (often <0.1%) [26] [33]. The analytical sensitivity of ddPCR typically reaches 0.01% variant allele frequency (VAF), enabling detection of rare mutant molecules in a background of wild-type DNA [1]. While NGS sensitivity can be improved through molecular barcoding techniques and ultra-deep sequencing (increasing costs substantially), standard NGS panels typically achieve sensitivities in the 0.1%-1% VAF range [32] [34]. This order-of-magnitude difference in sensitivity makes ddPCR particularly valuable for applications requiring detection of extremely rare variants, such as MRD monitoring after curative-intent therapy.
Table 1: Performance Comparison of ddPCR and NGS in Rectal Cancer Detection
| Parameter | ddPCR | NGS | Study Details |
|---|---|---|---|
| Detection Rate (Baseline) | 24/41 (58.5%) | 15/41 (36.6%) | Development cohort (n=41) [3] |
| Statistical Significance | p = 0.00075 | [3] | |
| Detection Rate (Validation) | 21/26 (80.8%) | Not reported | Validation cohort (n=26) [1] |
| Typical Sensitivity | ~0.01% VAF | ~0.1-1% VAF (standard panels) | [1] [32] |
| Postoperative Detection | Limited detection before recurrence | Not reported | [3] |
Concordance and Complementary Applications
Despite differences in absolute sensitivity, studies have demonstrated strong concordance between ddPCR and NGS when mutations are detectable by both platforms. A 2024 comparison of ddPCR and plate-based digital PCR (pdPCR) in early-stage breast cancer reported >90% concordance in ctDNA positivity between the two digital PCR methods [26]. Similarly, a 2021 study comparing a specialized NGS method (NOIR-SS) with ddPCR for EGFR L858R mutations in lung adenocarcinoma found strong correlation in variant allele fractions (VAFs) between the two technologies (ρ = 0.90; 95% CI, 0.81–0.95; P < 0.0001) [34]. These findings suggest that when mutations are present at detectable levels, both technologies provide reliable quantification.
Each technology offers distinct advantages for specific research applications. ddPCR excels in serial monitoring of known mutations, where its low cost, rapid turnaround time, and exceptional sensitivity are advantageous [1]. The operational costs of ctDNA detection with ddPCR are 5–8.5-fold lower than NGS, making it economically favorable for high-volume testing of limited mutations [1]. Conversely, NGS provides discovery power for identifying novel mutations, resistance mechanisms, and genomic signatures such as tumor mutational burden (TMB) and microsatellite instability (MSI) [31] [32]. This comprehensive profiling capability makes NGS invaluable for exploratory research and when the mutational landscape is not fully characterized.
Table 2: Technical and Operational Comparison of ddPCR and NGS
| Characteristic | ddPCR | NGS |
|---|---|---|
| Multiplexing Capacity | Limited (typically 2-4 targets per reaction) | High (hundreds of genes simultaneously) |
| Discovery Power | Limited to known mutations | High (can detect novel variants) |
| Theoretical Coverage | Target-specific | 99% in rectal patients (HS1 panel) [1] |
| Operational Cost | 5-8.5x lower than NGS [1] | Higher (especially for large panels) |
| Turnaround Time | Shorter (faster processing) | Longer (library prep + bioinformatics) |
| Genomic Signatures | Not available | TMB, MSI, and HRD [31] [35] |
Methodological Approaches
Sample Collection and Processing
Robust ctDNA analysis begins with appropriate sample collection and processing, as pre-analytical variables significantly impact data quality. Current recommendations specify collecting 2 × 10 mL of blood using butterfly needles, avoiding excessively thin needles and prolonged tourniquet use [33]. Blood should be collected into specialized blood collection tubes (BCTs) containing cell-stabilizing preservative agents, such as Streck Cell Free DNA BCT or PAXgene Blood ccfDNA tubes, which maintain sample integrity for up to 3–7 days at 4–25°C [1] [33]. For conventional EDTA tubes, processing within 2–6 hours at 4°C is critical to prevent leukocyte lysis and contamination of ctDNA with genomic DNA [33].
Plasma separation requires a two-step centrifugation protocol: an initial lower-speed centrifugation (800-1600 × g for 10-20 minutes) to separate plasma from blood cells, followed by a higher-speed centrifugation (10,000-16,000 × g for 10-20 minutes) to remove remaining cellular debris [33]. The resulting plasma can be stored at -80°C until DNA extraction. cfDNA extraction typically utilizes silica membrane-based kits optimized for low DNA concentrations, with median yields from early-stage cancer patients ranging from 22.2–822.0 ng from standard blood volumes [34]. DNA extraction efficiency and purity should be quantified using fluorometric methods rather than spectrophotometry, as the latter is less accurate for low-concentration samples.
Experimental Protocols for ctDNA Detection
ddPCR Protocol for ctDNA Detection: The ddPCR workflow begins with designing mutation-specific probes based on prior tumor sequencing data. For each sample, a reaction mixture is prepared containing 20μL of 2× ddPCR Supermix, 1.8μL of primer-probe mix, and 9-18μL of extracted DNA (approximately 10-100 ng) [1]. This mixture is loaded into a droplet generator that partitions it into ~20,000 nanoliter-sized droplets [1]. After droplet generation, PCR amplification is performed using optimized cycling conditions. Following amplification, droplets are read in a droplet analyzer that counts positive and negative droplets for each fluorescent channel. Results are analyzed using manufacturer-specific software (QuantaSoft for Bio-Rad systems) that calculates the variant allele frequency (VAF) based on the ratio of mutant to wild-type droplets [26]. The threshold for positive detection is typically set using negative controls, with samples requiring multiple positive droplets to be considered truly positive.
NGS Protocol for ctDNA Detection: The NGS workflow for ctDNA analysis typically begins with library preparation using kits such as the Ion AmpliSeq Library Kit 2.0 [1]. For targeted approaches, panels like the Ion AmpliSeq Cancer Hotspot Panel v2 provide coverage of hotspot regions in 50 oncogenes and tumor suppressor genes [1]. Following library preparation, templating and sequencing are performed on platforms such as the Ion GeneStudio S5 or Illumina sequencers. Bioinformatic analysis includes alignment to reference genomes, variant calling, and filtering. For ctDNA applications, the variant calling threshold is typically lowered to 0.01% VAF to enhance detection sensitivity [1]. Additional steps may include molecular barcoding to reduce errors, as implemented in approaches like the nonoverlapping integrated read sequencing system (NOIR-SS), which improves detection accuracy by eliminating sequencing artifacts [34].
Research Reagent Solutions
Successful ctDNA analysis requires carefully selected reagents and tools optimized for low-input, high-sensitivity applications. The following table details essential solutions for both ddPCR and NGS workflows.
Table 3: Essential Research Reagents for ctDNA Analysis
| Reagent Category | Specific Examples | Function & Applications |
|---|---|---|
| Blood Collection Tubes | Streck Cell Free DNA BCT, PAXgene Blood ccfDNA Tubes (Qiagen) | Preserve blood samples during transport/storage; prevent genomic DNA contamination [1] [33] |
| DNA Extraction Kits | Silica membrane-based kits (QIAamp Circulating Nucleic Acid Kit) | Isolate high-quality cfDNA from plasma; optimize recovery of low-concentration DNA [33] |
| ddPCR Master Mixes | ddPCR Supermix for Probes (Bio-Rad), Absolute Q Digital PCR Master Mix (Thermo Fisher) | Enable droplet formation and target amplification; provide fluorescence signal detection [1] [26] |
| NGS Library Prep Kits | Ion AmpliSeq Library Kit 2.0, TruSight Oncology 500 | Prepare sequencing libraries from low-input DNA; enable target enrichment [1] [36] |
| Targeted Panels | Ion AmpliSeq Cancer Hotspot Panel v2 (50 genes), TruSight Oncology 500 (523 genes) | Capture cancer-relevant genes; identify mutations, TMB, MSI [1] [36] |
| Bioinformatics Tools | BWA, GATK, STAR | Sequence alignment, variant calling, and data analysis [32] |
The choice between ddPCR and NGS for ctDNA analysis depends fundamentally on the specific research objectives, with each technology offering distinct advantages. ddPCR provides superior sensitivity for detecting known mutations at low variant allele frequencies, making it ideal for minimal residual disease monitoring, serial assessment of treatment response, and validation of specific mutations [3] [26]. Its lower cost and simpler workflow further support its use in high-volume targeted applications. Conversely, NGS enables comprehensive genomic profiling, discovery of novel alterations, and assessment of complex biomarkers such as tumor mutational burden and microsatellite instability [31] [32]. The broader mutational landscape provided by NGS is invaluable for exploratory research, therapy selection, and identifying resistance mechanisms.
Rather than viewing these technologies as mutually exclusive, researchers should consider integrating both approaches to leverage their complementary strengths. A combined strategy might utilize NGS for initial comprehensive profiling to identify targetable mutations, followed by ddPCR for highly sensitive monitoring of these specific mutations during treatment and follow-up [1] [34]. As ctDNA analysis continues to evolve, technological advancements in both digital PCR and sequencing methodologies will further enhance their sensitivity, accuracy, and accessibility, ultimately advancing personalized cancer care and drug development.
The analysis of circulating tumor DNA (ctDNA) has emerged as a transformative tool in clinical oncology, enabling non-invasive tumor genotyping and monitoring. Two leading technologies for ctDNA analysis are droplet digital PCR (ddPCR) and next-generation sequencing (NGS), each with distinct strengths and limitations. ddPCR offers exceptional sensitivity for quantifying known mutations, while NGS provides a broader genomic landscape view by detecting multiple alterations simultaneously. This guide objectively compares their performance through experimental data across colorectal, lung, and breast cancers, providing researchers with critical insights for technology selection in drug development and clinical research.
Performance Comparison Across Key Cancer Types
Clinical studies directly comparing ddPCR and NGS reveal that their performance is highly context-dependent, influenced by cancer type, stage, and the specific clinical question.
Colorectal Cancer
In localized rectal cancer, ddPCR demonstrated significantly higher detection rates in pre-therapy plasma samples compared to a targeted NGS panel. A 2025 study found ddPCR detected ctDNA in 58.5% (24/41) of patients, versus 36.6% (15/41) with NGS (p = 0.00075) [1] [3]. This superior sensitivity positions ddPCR as a potent tool for initial molecular staging in non-metastatic disease.
However, NGS offers distinct advantages in monitoring therapy resistance. In metastatic colorectal cancer patients treated with cetuximab, a study demonstrated that NGS could dynamically track a wider spectrum of resistance mutations compared to ddPCR. Notably, NGS identified additional dynamic changes in TP53 mutations that correlated with disease progression [37].
Lung Cancer
In advanced non-small cell lung cancer (NSCLC), a prospective multicenter study evaluated an "up-front ddPCR" strategy, followed by NGS only if ddPCR was negative. This approach identified 71% (32/45) of targetable driver mutations via ddPCR alone. The sequential strategy increased the total number of mutations found by 17% while reducing the need for NGS analyses by 40%, optimizing resource utilization [38].
For specific mutations like EGFR L858R, advanced NGS methods like the Nonoverlapping Integrated Read Sequencing System (NOIR-SS) showed a sensitivity of 87.9%, slightly higher than ddPCR's 78.8% in matched samples. The variant allele frequencies (VAFs) between the two methods were strongly correlated (ρ = 0.90) [34].
Breast Cancer
In early-stage breast cancer, detection of minimal residual disease (MRD) presents a sensitivity challenge due to low ctDNA concentrations. A 2024 study comparing the QX200 ddPCR system (Bio-Rad) with the Absolute Q plate-based dPCR system (Thermo Fisher) found >90% concordance in ctDNA positivity, with both systems achieving comparable sensitivity [26].
Innovative approaches using larger blood volumes (20-40 mL instead of conventional 5 mL) with ddPCR have demonstrated remarkable improvements. One study detected ctDNA in 100% of pre-treatment samples using increased volumes, compared to 66.6% with conventional volumes, achieving a minimum variant allele frequency of 0.003% [39].
Table 1: Performance Comparison of ddPCR vs. NGS Across Cancer Types
| Cancer Type | Study Focus | ddPCR Performance | NGS Performance | Key Findings |
|---|---|---|---|---|
| Colorectal | Localized rectal cancer detection [1] | 58.5% detection rate | 36.6% detection rate | ddPCR significantly more sensitive for baseline detection |
| Colorectal | mCRC resistance monitoring [37] | Limited to predefined mutations | Detected additional TP53 dynamics | NGS provided broader resistance mutation profile |
| Lung | Targetable mutation detection [38] | 71% of targetable mutations | Additional mutations found after negative ddPCR | Up-front ddPCR strategy reduced NGS need by 40% |
| Lung | EGFR L858R detection [34] | 78.8% sensitivity | 87.9% sensitivity (NOIR-SS) | High correlation in VAF quantification (ρ=0.90) |
| Breast | Early-stage detection [26] | >90% concordance with pdPCR | N/A | Both digital PCR platforms showed high agreement |
| Breast | MRD detection with increased volume [39] | 100% detection (20-40 mL plasma) | N/A | Superior to 66.6% with conventional 5 mL volumes |
Experimental Protocols and Methodologies
Understanding the detailed methodologies is crucial for interpreting comparative performance data and designing robust experiments.
- Tissue Sequencing: Primary tumor DNA from resection specimens underwent sequencing using Ion AmpliSeq Cancer Hotspot Panel v2 to identify somatic mutations.
- Assay Design: One to two predesigned ddPCR probes were selected based on mutations with the highest variant allele frequencies in the matched primary tumor.
- Plasma Analysis: Extracted DNA from patient plasma was partitioned into 20,000 droplets. Absolute quantification of targeted cfDNA was calculated based on PCR-positive and PCR-negative droplets.
- Sensitivity: The protocol detected somatic alterations at low frequencies (VAF 0.01%).
- Multiplex ddPCR Panel: ctDNA was analyzed using a panel of multiplex ddPCRs for EGFR (Ex19Del, G719S, L858R, L861Q, S768I), KRAS G12/G13, and BRAF V600 mutations.
- Blood Collection: Pre-treatment plasma samples were obtained before any therapeutic intervention.
- Sequential Testing: Only patients without detectable mutations in ddPCR analysis proceeded to tDNA-NGS.
- Comparison Standard: tDNA-NGS from tissue biopsies served as the reference standard.
- Sample Collection: Large-volume blood draws (20 mL plasma instead of conventional 5 mL) were collected in Streck Cell Free DNA BCT tubes.
- DNA Extraction: A novel DNA extraction procedure was applied to extract DNA from 20 mL of plasma, achieving higher purity and lower germline contamination.
- Mutation Selection: Whole exome sequencing identified patient-specific truncal mutations, with one selected as a biomarker for ddPCR detection.
- Ultra-sensitive Detection: The approach achieved a minimum variant allele frequency of 0.003% for ctDNA.
Technical Workflows and Strategic Pathways
The experimental approaches and decision pathways for ctDNA analysis differ significantly between the two technologies, impacting laboratory workflow and resource allocation.
The Scientist's Toolkit: Essential Research Reagents
Successful ctDNA analysis requires specific reagents and materials optimized for sensitive detection of low-frequency variants.
Table 2: Essential Research Reagents for ctDNA Analysis
| Reagent/Material | Function | Application Notes |
|---|---|---|
| Streck Cell-Free DNA BCT Tubes | Stabilizes blood cells prevents genomic DNA contamination | Critical for reproducible pre-analytical processing; enables sample transport [1] [39] |
| Ion AmpliSeq Cancer Hotspot Panel v2 | Targeted NGS for tumor mutation profiling | Covers ~2800 COSMIC variants in 50 genes; used for initial tumor mutation identification [1] |
| ddPCR Mutation Assays (Bio-Rad) | Target-specific probes for absolute quantification | Multiplex kits available for EGFR, KRAS, BRAF; custom designs for patient-specific mutations [38] [26] |
| Unique Molecular Identifiers (UMIs) | Tags individual DNA molecules to reduce sequencing errors | Essential for NGS-based ctDNA detection; enables error correction and accurate quantification [40] |
| Biotinylated Capture Probes | Hybridization capture for target enrichment in NGS | Used in CAPP-Seq and Guardant assays; enriches genomic regions of interest [40] |
| Methylation Analysis Kits | Bisulfite conversion for epigenomic profiling | Enables tumor type detection and tissue of origin identification via methylation patterns [40] |
Comparative Analysis and Strategic Implementation
The choice between ddPCR and NGS involves trade-offs between sensitivity, breadth, cost, and workflow complexity.
Key Performance Metrics
- Sensitivity: ddPCR generally offers superior sensitivity (0.001%-0.01% VAF) compared to standard NGS panels (0.02%-0.1% VAF) [41]. However, advanced NGS methods with molecular barcodes can approach ddPCR-level sensitivity.
- Multiplexing Capacity: NGS provides comprehensive genomic profiling in a single assay, while ddPCR is typically limited to tracking 1-5 known mutations simultaneously.
- Cost Considerations: ddPCR operational costs are approximately 5-8.5-fold lower than NGS, making it more accessible for high-volume targeted testing [1].
- Turnaround Time: ddPCR assays can be completed in 2-3 days, significantly faster than the 7-14 days typically required for NGS workflows [42].
Context-Specific Recommendations
- Treatment Monitoring: For tracking known mutations during targeted therapy, ddPCR provides sensitive, cost-effective monitoring.
- Resistance Mechanism Discovery: NGS is superior for identifying emergent resistance mutations not initially present in the tumor.
- Early-Stage Cancer: Both technologies benefit from increased blood volumes (20-40 mL) to improve detection sensitivity in low ctDNA settings [39].
- Comprehensive Profiling: For initial molecular characterization without prior knowledge of mutations, targeted NGS panels offer the most efficient approach.
The comparative analysis of ddPCR and NGS for ctDNA detection reveals complementary rather than competitive roles. ddPCR excels in sensitivity, speed, and cost-efficiency for tracking known mutations, while NGS provides unparalleled breadth for comprehensive genomic assessment. The optimal technology choice depends fundamentally on the clinical context: cancer type, disease stage, and specific research objectives. Emerging strategies that leverage both technologies sequentially—such as up-front ddPCR screening followed by reflex NGS—demonstrate promising efficiency in balancing sensitivity, breadth, and cost. As ctDNA analysis continues to evolve, understanding these nuanced performance characteristics will enable researchers and drug development professionals to implement the most appropriate technology for their specific applications.
The Emerging Role of ctDNA in Clinical Trials as an Intermediate Endpoint
Circulating tumor DNA (ctDNA) has emerged as a transformative biomarker in oncology, offering a minimally invasive method for monitoring treatment response and predicting patient outcomes. As clinical trials increasingly adopt ctDNA as an intermediate endpoint, understanding the relative performance of detection technologies like droplet digital PCR (ddPCR) and next-generation sequencing (NGS) becomes crucial for researchers and drug development professionals. This guide objectively compares the performance of these two platforms within the context of ctDNA analysis for clinical applications, supported by recent experimental data.
Performance Comparison: ddPCR vs. NGS
The choice between ddPCR and NGS involves trade-offs between sensitivity, multiplexing capability, cost, and workflow integration. The following tables summarize key performance metrics and characteristics from recent studies.
Table 1: Direct Performance Comparison in Localized Rectal Cancer (Development Cohort, n=41) [3] [1]
| Performance Metric | ddPCR | NGS Panel | p-value |
|---|---|---|---|
| Detection Rate (Baseline Plasma) | 24/41 (58.5%) | 15/41 (36.6%) | 0.00075 |
| Variant Allele Frequency (VAF) Sensitivity [1] | 0.01% | 0.01% (with adjusted threshold) | - |
Table 2: General Characteristics and Operational Considerations [1]
| Characteristic | ddPCR | NGS |
|---|---|---|
| Technology Principle | Mutation-driven, absolute quantification | Panel sequencing for multiple alterations |
| Multiplexing Capability | Low (1-2 mutations per assay) | High (multiple genes/variants in one assay) |
| Informed Approach | Tumor-informed (requires prior NGS) | Can be tumor-uninformed |
| Operational Cost [1] | 5 to 8.5-fold lower | Higher |
| Best Application | Tracking known, high-VAF mutations | Discovering novel mutations, broad profiling |
Experimental Protocols and ctDNA Dynamics
Supporting these performance comparisons are standardized experimental protocols and a growing understanding of ctDNA dynamics in response to treatment.
- Patient Cohorts: The study included a development group (n=41) and a distinct validation group (n=26) with non-metastatic rectal cancer.
- Sample Collection: Baseline plasma was collected before any neoadjuvant therapy in Streck Cell-Free DNA BCT tubes [1].
- Tumor Sequencing: Somatic alterations in primary tumor specimens were identified using the Ion AmpliSeq Cancer Hotspot Panel v2 (HS1) NGS.
- ctDNA Detection:
- ddPCR: Custom probes were designed for the 1-2 highest VAF mutations found in the matched tumor NGS. ctDNA was detected by partitioning DNA into ~20,000 droplets.
- NGS: The same HS1 panel was used, but the variant calling threshold was lowered to 0.01% VAF to enhance sensitivity for ctDNA analysis.
- Analysis: Results were classified as ctDNA-positive if any oncogenic mutation was detected.
ctDNA as a Predictive Biomarker
Beyond detection, defining a molecular response (MR) is critical for using ctDNA as an intermediate endpoint. A separate multi-trial analysis in advanced Non-Small Cell Lung Cancer (aNSCLC) evaluated MR using predefined ctDNA percent-change thresholds [43].
Table 3: Molecular Response (MR) Cutoffs and Association with Overall Survival (OS) in aNSCLC [43]
| Molecular Response (MR) Cutoff | Significant Association with Improved OS |
|---|---|
| ≥50% decrease in ctDNA (from baseline) | Yes |
| ≥90% decrease in ctDNA (from baseline) | Yes |
| 100% clearance of ctDNA (from baseline) | Yes |
Timing of Assessment: The analysis found that ctDNA reductions at both an early timepoint (T1, up to 7 weeks post-treatment) and a later timepoint (T2, 7-13 weeks post-treatment) were significantly associated with improved OS, with T2 showing marginally stronger associations [43]. Another study in metastatic NSCLC confirmed that patients achieving ctDNA clearance by week 21 had the most significant improvements in progression-free survival and overall survival [44].
Workflow and Logical Diagrams
The following diagrams illustrate the core experimental workflow and the logical relationship between ctDNA dynamics and clinical outcomes.
Experimental Workflow for ctDNA Detection
ctDNA Dynamics and Clinical Outcomes Logic
The Scientist's Toolkit: Research Reagent Solutions
The following table details essential materials and their functions for conducting similar ctDNA studies.
Table 4: Essential Research Reagents and Materials for ctDNA Analysis [3] [43] [1]
| Research Reagent / Material | Function in ctDNA Workflow |
|---|---|
| Streck Cell-Free DNA BCT Tubes | Stabilizes blood samples to prevent white blood cell lysis and preserve the native cfDNA profile during transport and storage. |
| Ion AmpliSeq Cancer Hotspot Panel v2 | A targeted NGS panel used to identify hotspot mutations in 50 genes from primary tumor tissue or plasma cfDNA. |
| Custom ddPCR Mutation Probes | Fluorescence-labeled probes designed to specifically detect and quantify the point mutations identified in the patient's tumor. |
| Cell-Free DNA Extraction Kits | For the isolation of high-purity, short-fragment cfDNA from plasma samples for downstream ddPCR or NGS analysis. |
| Bioinformatic Variant Caller (NGS) | Software to identify somatic mutations from NGS data, often with adjustable VAF thresholds (e.g., set to 0.01% for ctDNA). |
Overcoming Technical Hurdles: Optimization Strategies for Reliable ctDNA Detection
The analysis of circulating tumor DNA (ctDNA) has emerged as a pivotal tool in oncology, enabling non-invasive tumor profiling, treatment response monitoring, and residual disease detection. However, a significant challenge persists: ctDNA often represents less than 0.1% of the total cell-free DNA in plasma, with concentrations dropping to 0.01% or lower in early-stage cancers and minimal residual disease [45] [27]. This low abundance demands exceptionally sensitive detection methods to distinguish true tumor-derived signals from background noise and technical artifacts.
Two primary technological approaches have advanced to address this sensitivity challenge: droplet digital PCR (ddPCR) and next-generation sequencing (NGS). Each method offers distinct advantages, limitations, and optimal use cases. This guide provides an objective comparison of their performance characteristics, supported by experimental data from recent studies, to inform researchers and drug development professionals in selecting appropriate methodologies for their specific applications.
Technical Comparison of ddPCR and NGS
Fundamental Principles and Workflows
Droplet Digital PCR (ddPCR) employs a water-oil emulsion technology to partition a single PCR reaction into thousands of nanoliter-sized droplets, effectively creating individual reaction chambers. This partitioning allows for absolute quantification of target DNA molecules without the need for standard curves by counting positive and negative droplets after endpoint amplification. Its tumor-informed approach requires prior knowledge of specific mutations to design targeted probes [1] [46].
Next-Generation Sequencing (NGS) for ctDNA analysis encompasses various platforms that enable parallel sequencing of millions of DNA fragments. Unlike ddPCR, NGS can be either tumor-informed or tumor-uninformed and utilizes unique molecular identifiers (UMIs) to tag individual DNA molecules before amplification, facilitating error correction and distinguishing true mutations from PCR or sequencing artifacts [13] [46]. Common NGS approaches include hybrid capture-based panels (e.g., CAPP-Seq, TEC-Seq) and amplicon-based methods.
Table 1: Core Technical Characteristics of ddPCR and NGS
| Feature | Droplet Digital PCR (ddPCR) | Next-Generation Sequencing (NGS) |
|---|---|---|
| Detection Principle | Partitioning and endpoint PCR | Massive parallel sequencing with UMI error correction |
| Sensitivity | VAF as low as 0.003% [15] | VAF typically 0.01%-0.1% (varies with panel and depth) [1] [13] |
| Multiplexing Capacity | Low (typically 1-5 targets per assay) | High (dozens to hundreds of genes simultaneously) |
| Throughput | Low to medium | High |
| Tissue Requirement | Tumor-informed (requires prior mutation knowledge) | Both tumor-informed and tumor-uninformed approaches available |
| Turnaround Time | Shorter (hours to 1-2 days) | Longer (several days to weeks) |
| Key Advantage | Ultimate sensitivity for known targets | Comprehensive profiling, discovery capability |
Direct Performance Comparison Data
Recent head-to-head studies provide empirical data on the relative performance of ddPCR and NGS in clinical settings. A 2025 study on non-metastatic rectal cancer directly compared both technologies using matched patient samples. In the development group (n=41), ddPCR demonstrated significantly higher detection rates, identifying ctDNA in 24/41 (58.5%) of baseline plasma samples compared to 15/41 (36.6%) with NGS (p = 0.00075) [1] [29].
In metastatic colorectal cancer patients treated with cetuximab, a study evaluating dynamic monitoring found that while both technologies showed high concordance (R² = 0.98) for variant allele frequency (VAF) measurement, NGS provided additional mutation information beyond what ddPCR could detect, including dynamic changes in TP53 mutations that correlated with treatment response [27].
For EGFR-mutant lung cancer monitoring, plasma NGS trended toward higher sensitivity than ddPCR (78% vs. 70%) at baseline, though this difference was not statistically significant (p=0.16). Importantly, all mutations detected by ddPCR were also detected by NGS, and both methods showed similar performance in predicting treatment outcomes when assessing mutation clearance [47].
Table 2: Direct Comparative Performance in Different Cancers
| Cancer Type | ddPCR Detection Rate | NGS Detection Rate | Key Findings | Source |
|---|---|---|---|---|
| Non-Metastatic Rectal Cancer | 24/41 (58.5%) | 15/41 (36.6%) | ddPCR showed significantly higher detection (p=0.00075) | Säze Szeto et al. 2025 [1] |
| EGFR-Mutant Lung Cancer | 19/27 (70%) | 21/27 (78%) | NGS trended toward higher sensitivity (p=0.16); 79% concordance | Saw et al. 2023 [47] |
| Metastatic Colorectal Cancer | High concordance for known mutations | Additional TP53 mutations identified | NGS provided more comprehensive mutation profiling | Zhang et al. 2018 [27] |
Methodologies for Ultra-Sensitive Detection
Optimized ddPCR Protocol for ctDNA Detection
The following protocol outlines the optimized methodology for ctDNA detection using ddPCR, incorporating recent advancements from studies achieving ultra-sensitive detection:
Blood Collection and Plasma Preparation: Collect peripheral blood in cell-stabilizing tubes (e.g., Streck Cell-Free DNA BCT or Roche Cell-Free DNA collection tubes). Process within 5 days of collection. Centrifuge at 1,600g for 10 minutes, followed by a second centrifugation of the supernatant at 16,000g for 10 minutes. Aliquot and store plasma at -80°C until use [13] [15].
cfDNA Extraction: Extract cell-free DNA from plasma using a commercial kit (e.g., QIAamp Circulating Nucleic Acid Kit). For ultra-sensitive detection, increase the input plasma volume to 20-40 mL instead of conventional 5-10 mL. This increase significantly improves sensitivity, elevating detection rates from 66.6% to 100% in early breast cancer patients [15].
Assay Design: Design specific primers and hydrolysis probes (FAM/HEX) targeting mutations identified through prior tumor tissue sequencing (tumor-informed approach). For absolute quantification, optimize assays using synthetic DNA templates to determine optimal annealing temperatures and primer concentrations [1].
Droplet Generation and PCR Amplification: Prepare a 20μL reaction mixture containing 2× ddPCR Supermix, primers (250 nM), probes (900 nM), and approximately 5μL of template cfDNA. Generate droplets using a droplet generator (e.g., Bio-Rad QX200). Perform PCR amplification with the following thermal profile: 95°C for 10 minutes; 40 cycles of 94°C for 30 seconds and a primer-specific annealing temperature (e.g., 58°C) for 1 minute; 98°C for 10 minutes; and a 4°C hold [27].
Droplet Reading and Analysis: Read the plate on a droplet reader and analyze using quantification software (e.g., QuantaSoft). Set thresholds for positive/negative droplets based on no-template and wild-type-only controls. Report mutant allele concentration (copies/μL) and calculate variant allele frequency (VAF). A mutation is considered detected when a statistically significant cluster of mutant droplets is present above background noise [15] [27].
Optimized NGS Protocol for ctDNA Detection
The following protocol describes a hybrid capture-based NGS approach optimized for ctDNA detection:
Sample Collection and Processing: Follow identical blood collection and plasma preparation steps as in the ddPCR protocol. Isolate cfDNA using validated extraction kits, with the option to increase input plasma volume for low-abundance targets [13].
Library Preparation and Target Enrichment: Use a library preparation kit (e.g., Twist Library Preparation Kit) with the incorporation of unique molecular identifiers (UMIs) before any amplification steps to enable accurate error correction. Use a custom probe set (e.g., Twist Biosciences) covering relevant genomic regions. For targeted panels, design panels covering hotspot regions of 45+ genes implicated in solid tumors [13].
Sequencing: Sequence libraries on a high-throughput platform (e.g., Illumina NextSeq-500 or NovaSeq6000) to achieve a minimum deduplicated read depth of 3,000-4,000x. Higher sequencing depth directly improves detection sensitivity for low-VAF mutations [13] [27].
Bioinformatic Analysis and Variant Calling: Align sequences to the reference genome (e.g., hg19) using tools like Burrows-Wheeler Aligner (BWA). Process UMIs to generate consensus reads and remove PCR duplicates. Call variants using specialized algorithms (e.g., GATK Mutect2). Apply stringent filters: exclude variants with population frequency >0.1% (e.g., in ExAC database), require minimum supporting reads (e.g., ≥5), and filter out variants with strand bias [13].
Variant Annotation and Interpretation: Annotate remaining variants and classify them according to established guidelines (e.g., ACMG/AMP). For clinical reporting, focus on pathogenic and likely pathogenic variants in clinically relevant genes. Calculate sample- and locus-specific limits of detection based on sequencing depth and background error rates [13].
Diagram 1: Comparative Workflows of ddPCR and NGS for ctDNA Analysis. The ddPCR pathway emphasizes physical partitioning and absolute quantification, while the NGS pathway highlights library complexity and computational analysis.
The Scientist's Toolkit: Essential Research Reagents
Table 3: Essential Research Reagents for Ultra-Sensitive ctDNA Detection
| Reagent/Kit | Function | Application Notes |
|---|---|---|
| Cell-Free DNA BCT Tubes (Streck) | Stabilizes blood cells and prevents cfDNA release | Critical for reproducible results; enables sample transport [1] [13] |
| QIAamp Circulating Nucleic Acid Kit | Isolves high-purity cfDNA from plasma | Optimal for large-volume plasma processing (up to 40 mL) [13] [15] |
| ddPCR Supermix for Probes (Bio-Rad) | Enables droplet-based digital PCR | No dUTP required; optimized for droplet formation [27] |
| Twist Library Preparation Kit | Prepares sequencing libraries from low-input DNA | Maintains complexity of cfDNA fragments [13] |
| Custom Panels (Twist Biosciences) | Hybrid capture-based target enrichment | Covers 45+ genes with 117 kb footprint; customizable [13] |
| Unique Molecular Identifiers (UMIs) | Molecular barcodes for error correction | Essential for distinguishing true mutations from artifacts [13] [46] |
Strategic Application in Clinical Contexts
When to Choose ddPCR
ddPCR excels in specific clinical scenarios where ultimate sensitivity for tracking known mutations is paramount. Its exceptional sensitivity down to 0.003% VAF makes it ideal for monitoring minimal residual disease (MRD) in early-stage cancers [15]. In breast cancer patients, this ultra-sensitive detection enabled prediction of disease recurrence 7.6-34.6 months before clinical relapse [15].
The technology is particularly valuable for longitudinal monitoring of specific resistance mutations during targeted therapy. For example, in colorectal cancer patients receiving anti-EGFR therapy, ddPCR effectively tracked emerging KRAS mutations associated with treatment resistance [27]. The lower operational costs (5-8.5 fold lower than NGS) and faster turnaround times further support its use in high-volume monitoring scenarios where specific mutations are already characterized [1].
When to Choose NGS
NGS provides superior value in situations requiring comprehensive mutation profiling without prior knowledge of specific alterations. This makes it ideal for initial treatment selection in advanced cancers, where identifying all actionable mutations is critical [13] [48]. In lung cancer, NGS panels can simultaneously assess EGFR, ALK, ROS1, and other biomarkers from a single blood draw, guiding first-line therapy decisions [13].
The ability of NGS to detect unexpected resistance mechanisms and capture tumor heterogeneity represents another key advantage. In colorectal cancer patients, NGS identified TP53 mutations that were missed by ddPCR, providing additional insights into disease evolution during treatment [27]. For drug development professionals, NGS offers the discovery capability to identify novel biomarkers and resistance mechanisms across multiple gene pathways simultaneously.
Diagram 2: Decision Framework for Selecting Between ddPCR and NGS. This flowchart guides researchers in selecting the optimal technology based on their specific clinical or research question.
Emerging Trends and Future Directions
The field of ultra-sensitive ctDNA detection continues to evolve with several promising developments. Increased blood volumes (20-40 mL instead of conventional 10 mL) have demonstrated significant improvements in detection sensitivity, particularly for early-stage cancers where ctDNA abundance is minimal [15]. Multi-analyte approaches that combine ctDNA with circulating tumor cells (CTCs) provide complementary information and further enhance detection capabilities [15].
Technological advancements in both ddPCR and NGS methodologies continue to push detection limits. Newer error-correction methods for NGS, such as SaferSeqS and CODEC, promise to improve sensitivity while maintaining the broad genomic coverage of NGS approaches [46]. For ddPCR, development of more multiplexed assays within the partitioning constraints will expand its utility.
From a clinical implementation perspective, tumor-informed assays (using prior tumor sequencing to select targets) show a trend toward higher prognostic value compared to tumor-uninformed approaches across multiple cancer types [49]. The integration of ctDNA monitoring into clinical trials is accelerating, with potential applications in dynamic adaptation of treatment strategies based on real-time molecular response assessment.
Both ddPCR and NGS offer powerful solutions to the challenge of low-abundance ctDNA detection, with complementary strengths that make them suitable for different clinical and research applications. ddPCR provides the pinnacle of sensitivity for tracking known mutations, making it ideal for minimal residual disease monitoring and therapy response assessment. NGS offers comprehensive genomic profiling capabilities, enabling discovery of novel alterations and assessment of tumor heterogeneity. The choice between these technologies should be guided by the specific clinical question, required sensitivity, budgetary constraints, and necessary turnaround time. As both technologies continue to advance, their synergistic application promises to further unlock the potential of liquid biopsy in precision oncology.
In the comparative landscape of ddPCR versus next-generation sequencing (NGS) for circulating tumor DNA (ctDNA) analysis, NGS offers a distinct advantage: the ability to detect a broad spectrum of genetic alterations across multiple genes simultaneously without requiring prior knowledge of specific mutations. [16] However, this advantage is counterbalanced by significant technical challenges related to achieving the sensitivity required for reliable ctDNA detection, particularly in low-disease-burden scenarios such as minimal residual disease (MRD) monitoring or early-stage cancer detection. [16]
The fundamental hurdle stems from the ultra-low abundance of tumor-derived DNA fragments in circulation, which often constitute less than 0.1% of the total cell-free DNA (cfDNA) background, especially following curative-intent therapy. [16] This reality imposes rigorous demands on NGS methodologies, necessitating sophisticated approaches to manage sequencing depth, mitigate errors from duplicate reads, and implement molecular barcoding strategies. This article examines these core technical challenges and the solutions enabling NGS to function as a viable tool in precision oncology.
Core Technical Hurdles in ctDNA NGS
The Relationship Between Sequencing Depth and Variant Detection
The limit of detection (LoD) in ctDNA NGS is directly constrained by sequencing depth. Detecting variants with very low variant allele frequencies (VAFs) requires sufficient coverage to statistically capture the mutant molecules present in the sample. [16]
Table 1: Sequencing Depth Requirements for Variant Detection
| Target VAF | Required Coverage for 99% Detection Probability | Typical Commercial Panel Effective Coverage | Alteration Detection Rate |
|---|---|---|---|
| 1% | ~1,000x | ~2,000x | Benchmark |
| 0.5% | ~2,000x | ~2,000x | ~50% |
| 0.1% | ~10,000x | Not routinely achieved | ~80% (if achievable) |
As illustrated in Table 1, achieving a 99% probability of detecting a variant at a 0.1% VAF requires approximately 10,000x coverage after bioinformatic processing. [16] Major commercial therapy selection panels (e.g., Guardant360 CDx, FoundationOne Liquid CDx) typically achieve an effective coverage of about 2,000x, consistent with a reported LoD of approximately 0.5%. [16] While ultra-deep sequencing beyond 20,000x has been proposed to enhance sensitivity, this approach faces practical limitations in routine clinical laboratories due to prohibitively high costs and infrastructure requirements. [16]
The Problem of Duplicate Reads and False Positives
In pursuit of high sequencing depth, NGS workflows rely on PCR amplification to generate sufficient library material. This process creates numerous duplicate reads originating from the same original DNA molecule, introducing two primary issues:
- Amplification Bias: Preferential over-amplification of particular sequences can skew the representation of variants in the final data. [50] [51]
- Error Propagation: PCR is an imperfect process. Errors introduced during early amplification cycles are replicated in all subsequent duplicates, creating artefacts that can be misinterpreted as low-frequency variants. [50]
In ultra-deep ctDNA sequencing, PCR duplicates can constitute 50-90% of all reads. [50] Traditional bioinformatic tools remove duplicates based on their alignment coordinates, but this method is imperfect. It cannot distinguish between PCR duplicates and genuinely unique DNA fragments that happen to start and end at the same genomic position. [50]
Input DNA Limitations and Tumor Shedding Variability
The absolute quantity of input cfDNA presents a fundamental constraint. The sensitivity of any ctDNA assay is ultimately limited by the number of mutant DNA fragments physically present in the blood sample. [16]
For example, a 10 mL blood draw from a lung cancer patient might yield only ~8,000 haploid genome equivalents (GEs). If the ctDNA fraction is 0.1%, this provides a mere eight mutant GEs for the entire analysis, making detection statistically improbable. [16] This challenge is compounded by significant variability in cfDNA shedding across different tumor types. Liver cancers may yield ten times more cfDNA than lung cancers, directly impacting assay sensitivity for the same VAF. [16]
Key Technological and Bioinformatic Solutions
Unique Molecular Identifiers (UMIs) for Error Correction
Unique Molecular Identifiers (UMIs) are short, random nucleotide sequences ligated to each original DNA fragment during library preparation, before any PCR amplification. [52] [50] This simple yet powerful addition enables precise tracking of individual molecules throughout the NGS workflow.
How UMIs Work:
- Tagging: Each original DNA molecule receives a unique UMI barcode.
- Amplification: All PCR copies derived from the same original molecule inherit the identical UMI.
- Bioinformatic Consensus Building: Reads sharing the same UMI are grouped into "consensus families." A variant is considered "true" only if it appears across all or most reads within a family. Errors appearing in only a subset of reads within a family are discarded as technical artefacts. [50]
This process, known as UMI-based deduplication, efficiently collapses PCR duplicates into single, high-confidence consensus reads, dramatically reducing false positives and enabling confident detection of variants with VAFs as low as 0.1%. [50]
Figure 1: UMI Workflow for Error-Corrected Sequencing. Unique Molecular Identifiers (UMIs) are added to each original DNA fragment before PCR amplification. Bioinformatic analysis groups reads by UMI to build consensus families, distinguishing true variants from PCR/sequencing errors.
Strategic Bioinformatics Pipelines
Effective UMI implementation requires specialized bioinformatics tools designed to handle the additional complexity of molecular barcodes. These pipelines perform several critical functions:
- Error-Corrected Deduplication: Tools like UMI-tools, AmpUMI, and UMIAnalyzer group reads by UMI and generate consensus sequences, significantly reducing background noise. [53]
- Variant Filtering: Implementing "allowed" and "blocked" lists of known variants helps distinguish true somatic mutations from recurring sequencing artefacts or germline polymorphisms, further minimizing false positives. [16]
- Dynamic LoD Calibration: Some advanced pipelines adjust the LoD based on achieved sequencing depth and input DNA quality, providing more reliable confidence metrics for clinical interpretation. [16]
Comparative Experimental Data: NGS vs. ddPCR
A direct performance comparison in non-metastatic rectal cancer highlights the sensitivity gap between the two technologies under standardized conditions.
Table 2: Performance Comparison of ddPCR vs. NGS for ctDNA Detection in Localized Rectal Cancer [1] [3]
| Parameter | ddPCR | NGS (HS1 Panel) | P-value |
|---|---|---|---|
| Detection Rate (Baseline Plasma) | 24/41 (58.5%) | 15/41 (36.6%) | 0.00075 |
| Theoretical Limit of Detection | ~0.01% VAF | ~0.01% VAF (with optimized calling) | - |
| Multiplexing Capability | Low (1-2 mutations/assay) | High (50+ genes/panel) | - |
| Operational Cost | 5-8.5x lower than NGS [1] | Higher | - |
This study demonstrated that while ddPCR detected ctDNA in a significantly higher proportion of patients, the NGS approach provided broader mutational profiling from a single assay. [1] [3] This trade-off between sensitivity and breadth of genomic interrogation is a central consideration in selecting the appropriate technological platform.
Detailed Experimental Protocol for ctDNA NGS
The following methodology is adapted from recent studies comparing ddPCR and NGS for ctDNA analysis, providing a reproducible framework for researchers. [1]
Sample Collection and Processing
- Blood Collection: Collect 3 × 9 mL of patient blood into Streck Cell-Free DNA BCT tubes to stabilize nucleated blood cells and prevent genomic DNA contamination.
- Plasma Isolation: Centrifuge tubes within 4 hours of venipuncture at 2,000 × g for 10 minutes. Transfer the supernatant (plasma) to a fresh tube and perform a second centrifugation at 10,000 × g for 10 minutes to remove residual cells.
- cfDNA Extraction: Extract cfDNA from plasma using the DSP Circulating DNA Kit on a QIAsymphony SP instrument or equivalent. Elute cfDNA in 60 µL of elution buffer.
Library Preparation and UMI Incorporation
- Library Construction: Use a targeted NGS panel (e.g., Ion AmpliSeq Cancer Hotspot Panel v2) covering relevant cancer genes. This panel covers >2,800 COSMIC variants from 50 oncogene and tumor suppressor gene hotspots.
- UMI Ligation: Incorporate Unique Molecular Identifiers during library preparation before the PCR amplification step. This typically involves ligating UMI adapters to the blunt-ended, repaired cfDNA fragments.
- Library Amplification: Amplify the UMI-tagged libraries with an appropriate number of PCR cycles (typically 12-18 cycles) to generate sufficient material for sequencing while minimizing duplicate reads.
Sequencing and Data Analysis
- Sequencing Parameters: Sequence libraries on an appropriate NGS platform (e.g., Illumina, Ion Torrent) to achieve a minimum raw coverage of 15,000-20,000x.
- Variant Calling Pipeline:
- Demultiplexing: Separate sequencing data by sample using unique dual indexes (UDIs).
- UMI Processing: Group reads into consensus families based on their UMI sequences using specialized tools (e.g., UMI-tools).
- Alignment: Map consensus reads to the reference genome (e.g., hg19/GRCh37).
- Variant Calling: Identify somatic mutations with a lowered calling threshold (e.g., VAF ≥ 0.01%) and a minimum of 3 supporting unique reads.
- Filtering: Apply "allowed" and "blocked" lists to eliminate known artefacts and retain high-confidence variants.
Figure 2: ctDNA NGS Analysis Workflow. The process from blood draw to variant report, highlighting key steps including UMI incorporation and specialized bioinformatic analysis for error correction.
The Scientist's Toolkit: Essential Research Reagents
Table 3: Key Reagents and Tools for ctDNA NGS Analysis
| Reagent/Tool | Function | Example Products/Platforms |
|---|---|---|
| Cell-Free DNA Collection Tubes | Stabilizes blood cells to prevent background DNA release | Streck Cell-Free DNA BCT tubes |
| cfDNA Extraction Kits | Isolves fragmented circulating DNA from plasma | QIAsymphony SP DSP Circulating DNA Kit |
| UMI Adapter Kits | Labels each DNA molecule with a unique barcode before PCR | Nonacus Cell3 Target, Illumina UMI kits |
| Targeted Sequencing Panels | Enriches for cancer-relevant genomic regions | Ion AmpliSeq Cancer Hotspot Panel v2 |
| Bioinformatics Tools | Processes UMI-tagged data, calls variants | UMI-tools, AmpUMI, UMIAnalyzer |
NGS presents a powerful but technically demanding approach for ctDNA analysis, characterized by a fundamental trade-off between the breadth of genomic profiling and absolute detection sensitivity. The implementation of Unique Molecular Identifiers, combined with strategic bioinformatic pipelines, is critical for overcoming inherent limitations in sequencing depth and managing PCR-derived errors. While current NGS methodologies demonstrate slightly lower sensitivity compared to ddPCR for detecting ultra-low frequency variants, they provide substantially more comprehensive genomic information from a single assay. The ongoing development of more efficient UMI strategies, enhanced bioinformatic tools, and standardized protocols will be essential for advancing the clinical utility of NGS in the dynamic field of liquid biopsy.
The analysis of cell-free DNA (cfDNA) and circulating tumor DNA (ctDNA) has emerged as a cornerstone of liquid biopsy applications in oncology and other medical fields. The pre-analytical phase, encompassing all steps from sample collection to nucleic acid extraction, represents a critical determinant of data quality and assay reliability. This guide provides a comparative analysis of blood collection tubes and processing protocols, offering evidence-based insights to optimize cfDNA yield and quality for downstream molecular analyses, with particular relevance to ddPCR and next-generation sequencing (NGS) platforms.
Comparative Analysis of Blood Collection Tubes
The choice of blood collection tube fundamentally influences cfDNA integrity, yield, and the prevention of genomic DNA contamination. Different tube chemistries are designed to either facilitate immediate processing or stabilize cellular components for extended storage.
Performance Characteristics by Tube Type
Table 1: Comparative Performance of Common Blood Collection Tubes for cfDNA Analysis
| Tube Type | Mechanism of Action | Recommended Processing Timeline | Impact on cfDNA Yield | Risk of gDNA Contamination | Suitability for Delayed Processing |
|---|---|---|---|---|---|
| K2EDTA | Anticoagulant, prevents coagulation | ≤4-6 hours [54] [55] | Increases significantly with delayed processing [56] | High with delayed processing (>6 hours) [55] | Poor - requires immediate processing |
| Streck cfDNA BCT | Chemical crosslinking stabilizes blood cells [56] | Up to 3-14 days [55] | Stable yield over time [56] [55] | Low, maintains stability [56] [55] | Excellent - designed for shipping and storage |
| PAXgene Blood ccfDNA | Prevents apoptosis [56] | Up to 7 days [56] | Moderate increase over time [56] | Moderate [56] | Good for medium-term storage |
| Norgen cf-DNA/cf-RNA | Osmotic cell stabilizers [56] | Information missing | Stable yield over time [56] | Information missing | Information missing |
Quantitative cfDNA Yield Comparisons
Table 2: Experimental cfDNA Yields Across Tube Types and Processing Times
| Tube Type | cfDNA Yield at 0 hours (ng/mL plasma) | cfDNA Yield at 48 hours (ng/mL plasma) | cfDNA Yield at 168 hours (ng/mL plasma) | Study Characteristics |
|---|---|---|---|---|
| K2EDTA | 2.41 [56] | 7.39 [56] | 68.19 [56] | 23 healthy individuals, 649 total samples [56] |
| Streck | 2.74 [56] | 2.69 [56] | 2.38 [56] | 23 healthy individuals, 649 total samples [56] |
| PAXgene | 1.66 [56] | 1.85 [56] | 2.48 [56] | 23 healthy individuals, 649 total samples [56] |
| Norgen | 0.76 [56] | 0.77 [56] | 0.74 [56] | 23 healthy individuals, 649 total samples [56] |
Experimental Protocols for Pre-analytical Workflow Assessment
Standardized Plasma Processing Protocol
The following methodology, adapted from multiple studies [56] [55] [57], represents a consensus approach for obtaining high-quality plasma for cfDNA analysis:
Blood Collection: Collect venous blood using standard phlebotomy techniques, filling tubes to the recommended volume (typically 10 mL) to ensure proper blood-to-additive ratio.
Tube Mixing: Immediately after collection, invert tubes 8-10 times to ensure proper mixing with additives.
Initial Centrifugation: Centrifuge tubes at 1,600 × g for 10 minutes at room temperature using a swing-out rotor. Apply a smooth braking profile to prevent disturbing the buffy coat layer.
Plasma Transfer: Carefully transfer the supernatant plasma to a fresh 15 mL tube, leaving approximately 500 μL of plasma above the buffy coat to avoid cellular contamination.
Secondary Centrifugation: Centrifuge the transferred plasma at 6,000 × g for 10 minutes at room temperature to pellet any remaining cells.
Final Plasma Allocation: Transfer the supernatant to fresh tubes, leaving 300 μL above the pellet, and aliquot into cryotubes for storage at -80°C.
Workflow Diagram: Pre-analytical Processing
Impact on Downstream ctDNA Analysis in ddPCR vs NGS
The pre-analytical variables discussed directly influence the performance and concordance between ddPCR and NGS platforms for ctDNA detection.
Detection Performance in Rectal Cancer
A 2025 study by Szeto et al. directly compared ddPCR and NGS for ctDNA detection in localized rectal cancer [3] [1]:
- Detection Rate with ddPCR: 58.5% (24/41) in baseline plasma
- Detection Rate with NGS: 36.6% (15/41) in baseline plasma (p = 0.00075)
- Association with Clinical Factors: Positive ctDNA results correlated with higher clinical tumor stage and lymph node positivity on MRI
This performance disparity highlights how pre-analytical conditions affecting cfDNA yield and quality can have platform-specific impacts, with ddPCR demonstrating higher sensitivity for detecting low-frequency variants in this application.
Molecular Response Monitoring
The short half-life of ctDNA (approximately 1-2 hours) enables real-time monitoring of treatment response through molecular response assessment [42]. The choice of blood collection system directly impacts the reliability of this approach:
- K2EDTA Tubes: Suitable for immediate processing in controlled clinical settings
- Stabilizer Tubes: Essential for multi-center trials requiring sample shipping
Molecular response calculation methods include:
- ctDNA Clearance: Binary assessment of detectable vs. non-detectable ctDNA
- Delta VAF (dVAF): Change in variant allele frequency between timepoints
- Ratio VAF Methods: Proportional change accounting for residual ctDNA
Quality Assessment Methodologies
Multiplexed ddPCR for cfDNA Quality Control
A robust quality control method utilizing multiplexed droplet digital PCR (ddPCR) has been developed to simultaneously assess cfDNA concentration and fragment size [57]:
- Assay Design: Nine single-copy genomic loci with:
- Five short amplicons (mean 71 bp, FAM-labeled)
- Four long amplicons (mean 471 bp, TET-labeled)
- Quality Metrics:
- Total amplifiable DNA concentration
- Low molecular weight (LMW) fraction calculation
- Genomic DNA contamination assessment
This method enables rapid quality assessment prior to costly downstream sequencing applications, with studies showing strong correlation between ddPCR quantification and sequencing library diversity (Pearson r = 0.938, p = 2.48 × 10⁻⁷) [57].
gDNA Contamination Assessment
The ratio between long and short amplicons serves as a sensitive indicator of genomic DNA contamination:
- qPCR-based Methods: LINE-1 assay with 96 bp vs. 402 bp amplicons [55]
- Capillary Electrophoresis: Fragment size distribution analysis [56]
- Sequencing-based Methods: Deviation from characteristic nucleosomal peak patterns [58]
The Researcher's Toolkit: Essential Reagents and Materials
Table 3: Key Research Reagent Solutions for cfDNA Analysis
| Reagent/Material | Function | Example Products | Performance Considerations |
|---|---|---|---|
| Blood Collection Tubes | Sample acquisition and stabilization | Streck cfDNA BCT, PAXgene Blood ccfDNA, K2EDTA | Choice depends on processing timeline and shipping requirements |
| cfDNA Extraction Kits | Nucleic acid isolation from plasma | QIAamp Circulating Nucleic Acid Kit, QIAamp MinElute ccfDNA Midi Kit | Magnetic bead-based vs. spin column methods show yield variability [57] |
| Quantification Assays | cfDNA concentration and quality assessment | ddPCR assays, LINE-1 qPCR, Fluorometric analysis | Multiplexed ddPCR provides simultaneous quantity and quality metrics [57] |
| Enzymatic Reagents | Library preparation and amplification | Ligation Sequencing Kits, PCR master mixes | Platform-specific optimization required for ddPCR vs. NGS |
The selection of appropriate blood collection tubes and processing protocols represents a fundamental decision in cfDNA analysis that significantly impacts downstream results. Stabilizing tubes like Streck cfDNA BCTs provide robust performance for samples requiring storage or transportation, while K2EDTA tubes remain suitable for immediate processing scenarios. The demonstrated differences in cfDNA yield and gDNA contamination risk across tube types underscore the necessity of standardizing pre-analytical conditions, particularly in multi-center studies and clinical trials where ctDNA analysis informs treatment decisions. As liquid biopsy applications continue to expand toward minimal residual disease detection and early cancer screening, meticulous attention to these pre-analytical variables will be essential for achieving reliable, reproducible results across ddPCR and NGS platforms.
The analysis of circulating tumor DNA (ctDNA) has emerged as a transformative approach in oncology, enabling non-invasive tumor genotyping, therapy monitoring, and minimal residual disease detection. However, a significant technical challenge persists: the reliable detection of rare mutant molecules within a vast background of wild-type cell-free DNA. In early-stage cancers or minimal residual disease settings, ctDNA can represent ≤ 0.1% of total cell-free DNA, pushing conventional sequencing and analysis methods to their limits [26]. This technical comparison guide examines the bioinformatic pipelines for error suppression and variant calling required for low-frequency mutation detection, contextualized within the ongoing methodological comparison between droplet digital PCR (ddPCR) and next-generation sequencing (NGS) approaches in ctDNA research.
The fundamental challenge stems from the error profiles inherent to NGS technologies. Standard Illumina sequencing exhibits a background error rate of approximately 5 × 10⁻³ per nucleotide, which is orders of magnitude higher than the true variant allele frequencies (VAFs) of clinical interest in liquid biopsy applications [59]. These errors originate from multiple sources throughout the NGS workflow, including DNA damage during sample processing, polymerase errors during PCR amplification, and sequencing instrument errors [59]. Without sophisticated error suppression strategies, these technical artifacts are indistinguishable from true low-frequency variants, severely limiting the sensitivity and specificity of mutation detection in ctDNA analysis.
Comparative Performance of ddPCR and NGS in ctDNA Analysis
Detection Sensitivity and Clinical Performance
Direct comparisons between ddPCR and NGS reveal significant differences in their capabilities for detecting low-frequency mutations in ctDNA. A 2025 study examining localized rectal cancer demonstrated that ddPCR detected ctDNA in 58.5% (24/41) of baseline plasma samples, while an NGS panel detected ctDNA in only 36.6% (15/41) of the same samples (p = 0.00075) [1]. This substantial difference in detection rates highlights the superior sensitivity of ddPCR for targeted mutation detection in applications where the mutations of interest are known in advance.
The same study also noted that ddPCR operational costs were 5-8.5-fold lower than NGS for ctDNA detection, making it a more accessible technology for focused applications [1]. However, this sensitivity advantage is context-dependent. In advanced non-small cell lung cancer (NSCLC), both technologies demonstrate high sensitivity, with one study reporting 87.9% sensitivity for an advanced NGS method (NOIR-SS) compared to 78.8% for ddPCR in detecting EGFR L858R mutations [34]. The performance difference narrows in high tumor burden contexts where ctDNA fractions are naturally higher.
Table 1: Comparison of Detection Performance Between ddPCR and NGS in Various Cancers
| Cancer Type | ddPCR Sensitivity | NGS Sensitivity | Detection Limit | Key Findings | Citation |
|---|---|---|---|---|---|
| Localized Rectal Cancer | 58.5% (24/41) | 36.6% (15/41) | Not specified | ddPCR significantly outperformed NGS in baseline ctDNA detection (p = 0.00075) | [1] |
| Advanced NSCLC (EGFR L858R) | 78.8% (26/33) | 87.9% (29/33) | 0.01% VAF | Advanced NGS (NOIR-SS) outperformed ddPCR, especially for complex mutations | [34] |
| Early-Stage Breast Cancer | >90% concordance with pdPCR | Not assessed | ≤0.1% VAF | ddPCR showed higher variability but comparable sensitivity to plate-based dPCR | [26] |
| Various Solid Tumors | 0.01% VAF (typical) | 0.004-0.1% VAF (method-dependent) | Varies by method | ddPCR optimal for ≤10 loci; NGS better for comprehensive profiling | [60] |
Technical Specifications and Limitations
The divergent performance characteristics between ddPCR and NGS stem from their fundamental technological approaches. ddPCR achieves high sensitivity through physical partitioning of DNA molecules into thousands of droplets, followed by endpoint PCR amplification and fluorescent probe-based detection. This approach allows absolute quantification without calibration curves and enables detection of mutations at frequencies as low as 0.01% variant allele frequency (VAF) for well-validated hotspots [60]. However, its major limitation is the inability to detect unexpected mutations beyond the specifically targeted variants.
NGS methods, particularly those incorporating unique molecular identifiers (UMIs), can achieve comparable or even superior sensitivity in some contexts through deep sequencing and bioinformatic error suppression. The recently developed Concatenating Original Duplex for Error Correction (CODEC) method achieves 1000-fold higher accuracy than conventional NGS while using up to 100-fold fewer reads than duplex sequencing [46]. Nevertheless, NGS remains vulnerable to specific error patterns, with elevated C>T/G>A errors showing strong sequence context dependency and C>A/G>T errors being influenced by sample-specific effects [59].
Table 2: Technical Specifications of ddPCR and NGS Platforms for Low-Frequency Variant Detection
| Parameter | ddPCR | Targeted NGS with UMIs | Whole Genome Sequencing with Duplex UMIs |
|---|---|---|---|
| Theoretical Detection Limit | 0.01% VAF | 0.004-0.1% VAF | ≤0.01% VAF across genome |
| Multiplexing Capacity | 1-4 loci per reaction | 150-300 kb (amplicon) or 0.5-2 Mb (hybrid capture) | Entire genome |
| Error Sources | Probe specificity, droplet quality | PCR errors, DNA damage, index hopping | Strand coordination efficiency |
| Data Output | Absolute mutant copies/mL | Variant allele frequency + coverage metrics | Comprehensive variant profile + copy number |
| Cost Considerations | 5-8.5x lower than NGS | Moderate to high | Highest |
| Turnaround Time | Rapid (hours) | Moderate to long (days to weeks) | Longest (weeks) |
Error Suppression Methodologies in NGS Bioinformatic Pipelines
Molecular Barcoding and Consensus Approaches
Advanced error suppression strategies in NGS rely primarily on unique molecular identifiers (UMIs) to distinguish true biological variants from technical artifacts. UMIs are short random nucleotide sequences that are ligated to each DNA fragment before PCR amplification. The fundamental principle involves grouping reads originating from the same original molecule by their UMI sequences and generating consensus sequences to correct for amplification and sequencing errors.
Several sophisticated UMI implementations have been developed to address different error sources. Duplex Sequencing, introduced in 2012, represents the gold standard for high-accuracy sequencing by tagging and sequencing both strands of each DNA duplex independently [46]. This method identifies true mutations when they appear in the same position on both strands, dramatically improving error correction. More recently, CODEC was developed to overcome the inefficiency of generating duplex consensus sequences, enabling 1000-fold higher accuracy than conventional NGS with significantly fewer reads [46]. Other methods like SaferSeqS, NanoSeq, and Singleton Correction offer alternative approaches with different trade-offs between efficiency, accuracy, and applicability [46].
The effectiveness of these bioinformatic error suppression techniques is substantial. Computational approaches can suppress substitution error rates to 10⁻⁵ to 10⁻⁴, representing a 10- to 100-fold reduction compared to the error rates typically reported in the literature (10⁻³) [59]. This level of error suppression enables reliable detection of hotspot variants at frequencies as low as 0.1% to 0.01% with current NGS technology [59].
Error Profiling and Source Attribution
Effective error suppression requires understanding the distinct error profiles attributable to different steps in the NGS workflow. Comprehensive analyses have revealed that error rates differ significantly by nucleotide substitution type, ranging from approximately 10⁻⁵ for A>C/T>G, C>A/G>T, and C>G/G>C changes to 10⁻⁴ for A>G/T>C changes [59]. Furthermore, specific error types correlate with particular workflow steps:
- C>T/G>A errors exhibit strong sequence context dependency, often attributable to cytosine deamination processes [59].
- C>A/G>T errors show sample-specific effects, potentially linked to oxidative DNA damage during sample processing or storage [59].
- Target-enrichment PCR introduces approximately a 6-fold increase in overall error rate compared to non-enriched approaches [59].
This detailed understanding of error origins enables development of specialized bioinformatic filters that can preferentially remove likely technical artifacts while preserving true biological variants. For example, algorithms can weight the credibility of observed variants based on their substitution type, sequence context, and strand representation in duplex sequencing data.
Diagram 1: NGS Error Sources and Suppression Strategies. This workflow illustrates the relationship between experimental steps in NGS, the specific error types they introduce, and the corresponding error suppression strategies used in bioinformatic pipelines.
Experimental Protocols for Method Comparison Studies
ddPCR Protocol for ctDNA Detection
The standard ddPCR protocol for ctDNA analysis begins with blood collection in specialized cell-free DNA BCT tubes (e.g., Streck Cell Free DNA BCT), which contain preservatives that prevent white blood cell lysis and stabilize cfDNA profiles for up to 7 days at room temperature [1] [33]. Plasma is separated through two-step centrifugation (typically 1,600-2,000 × g for 10-20 minutes followed by 13,000-16,000 × g for 10 minutes) to remove cells and debris. Cell-free DNA is then extracted using commercial kits (e.g., QIAamp Circulating Nucleic Acid Kit) with elution volumes of 20-50 μL [1].
For mutation detection, ddPCR reactions are prepared with 2-9 μL of extracted cfDNA combined with mutation-specific assays. The reaction mixture is partitioned into 20,000 nanodroplets using a droplet generator. Endpoint PCR amplification is performed with cycling conditions optimized for the specific assays. Following amplification, droplets are analyzed on a droplet reader that counts the number of positive and negative droplets for mutant and wild-type sequences. Mutant allele frequency (MAF) is calculated using Poisson correction based on the ratio of mutant to wild-type droplets [1] [34].
Key quality control measures include:
- Assessment of droplet count and quality to ensure sufficient partitioning
- Comparison with negative controls to establish background signal
- Use of positive controls with known mutation frequencies to validate assay performance
- Analysis of both mutant and wild-type probe signals to confirm specific amplification
NGS Protocol with Error Suppression
The NGS workflow for low-frequency variant detection incorporates additional steps specifically designed to minimize and correct errors. Library preparation begins with cfDNA quantification and quality assessment using fluorometric methods and fragment analyzers. Library construction employs specialized kits designed for low-input cfDNA (e.g., NEXTFLEX Cell-free DNA-Seq Library Prep Kit 2.0) that incorporate dual-indexed unique molecular identifiers (UMIs) to tag each original DNA molecule [60].
The critical steps for error suppression include:
- UMI ligation: Each cfDNA fragment receives unique barcodes before PCR amplification
- Limited-cycle PCR amplification: Typically 10-15 cycles to minimize polymerase errors
- Hybrid capture or amplicon-based target enrichment: For focused panels
- High-depth sequencing: Typically achieving 25,000× raw coverage for targeted panels, yielding ~4,000× deduplicated depth after UMI consensus building [60]
Bioinformatic processing follows this workflow:
- Demultiplexing: Separating reads by sample using unique dual indices (UDIs)
- UMI consensus building: Grouping reads sharing the same UMI and genomic coordinates
- Error correction: Generating high-accuracy consensus sequences for each original molecule
- Variant calling: Identifying mutations above background noise thresholds
For ultra-sensitive applications, duplex sequencing methods may be employed, where both strands of the original DNA duplex are independently tracked and true mutations are only called when supported by both strands [46] [61].
Diagram 2: Comparative Workflows: ddPCR vs. NGS for ctDNA Analysis. This side-by-side comparison illustrates the fundamental differences in experimental approach between targeted ddPCR and comprehensive NGS methods for low-frequency variant detection.
Essential Research Reagents and Materials
Successful detection of low-frequency mutations in ctDNA requires careful selection of reagents and materials throughout the workflow. The following table details key solutions and their critical functions in both ddPCR and NGS approaches.
Table 3: Essential Research Reagents for Low-Frequency Mutation Detection
| Reagent Category | Specific Examples | Function | Considerations for Low-Frequency Detection |
|---|---|---|---|
| Blood Collection Tubes | Streck Cell Free DNA BCT, PAXgene Blood ccfDNA tubes | Preserve cfDNA profile by preventing white blood cell lysis | Enable room temperature storage for up to 7 days; critical for minimizing background wild-type DNA [33] |
| DNA Extraction Kits | QIAamp Circulating Nucleic Acid Kit | Isolation of high-quality cfDNA from plasma | Optimized for low DNA concentrations; minimal contamination risk |
| ddPCR Reagents | Bio-Rad ddPCR Supermix, mutation-specific assays | Partitioned PCR with fluorescent probe detection | Requires validation of probe specificity for each mutation; optimal droplet generation is critical [26] |
| NGS Library Prep Kits | NEXTFLEX Cell-free DNA-Seq Library Prep Kit 2.0 | Library construction from low-input cfDNA | Incorporates UMIs for error suppression; optimized for fragmented cfDNA [60] |
| Target Enrichment | Hybrid capture panels (e.g., Illumina TruSight Oncology 500 ctDNA) | Selection of genomic regions of interest | Balance between target size and sequencing depth; impacts final sensitivity [60] |
| Polymerases | Q5 High-Fidelity DNA Polymerase | PCR amplification with minimal errors | High-fidelity enzymes essential for minimizing artifacts during amplification [59] |
The comparison between ddPCR and NGS for detecting low-frequency mutations in ctDNA reveals a clear paradigm: technology selection must align with clinical and research objectives. ddPCR offers superior sensitivity and cost-effectiveness for applications involving a limited number of predefined mutations, with detection limits reaching 0.01% VAF for validated hotspots [60]. Its operational simplicity and rapid turnaround make it ideal for monitoring known mutations in therapy response assessment and minimal residual disease detection.
NGS approaches, while generally more complex and costly, provide comprehensive mutational profiling capabilities essential for discovery applications and heterogeneous cancers. Through advanced error suppression strategies like UMI-based consensus sequencing and duplex sequencing, NGS can achieve sensitivities approaching 0.004% VAF in optimized workflows [46] [60]. The continuing evolution of bioinformatic pipelines for error suppression will further enhance the sensitivity and specificity of both platforms, ultimately expanding the clinical utility of ctDNA analysis across cancer stages and types.
For researchers and clinicians, the decision framework should consider:
- Mutation burden and pre-test certainty: Known mutations favor ddPCR; exploratory profiling requires NGS
- Sample material limitations: Both perform well with limited plasma volumes (2×10 mL blood)
- Operational constraints: ddPCR offers faster turnaround; NGS provides broader genomic context
- Cost considerations: ddPCR is 5-8.5-fold less expensive for targeted applications [1]
As both technologies continue to advance, their complementary strengths suggest an ongoing role for each in the precision oncology toolkit, with selection guided by the specific clinical question, resource constraints, and required performance characteristics.
The choice between Droplet Digital PCR (ddPCR) and Next-Generation Sequencing (NGS) for circulating tumor DNA (ctDNA) analysis represents a critical strategic decision for molecular researchers and drug development professionals. This decision hinges on a fundamental trade-off: achieving the utmost sensitivity for tracking known mutations versus obtaining a comprehensive genomic profile from a single, minimally invasive assay. ctDNA, the fragmented DNA released by tumor cells into the bloodstream, is a powerful biomarker for cancer monitoring and treatment selection. However, it exists in a background of normal cell-free DNA, often at very low frequencies (0.01% to <10%), demanding highly sensitive detection technologies [1]. ddPCR excels in the ultrasensitive, absolute quantification of a limited number of predefined mutations, while NGS offers a broad, hypothesis-free approach for multigene mutation discovery. This guide provides an objective, data-driven comparison of these two platforms, framing their performance within the practical constraints of research budgets, operational workflows, and specific experimental goals.
Performance Metrics: A Quantitative Side-by-Side Comparison
The following tables summarize key performance characteristics and cost considerations for ddPCR and NGS, based on recent comparative studies.
Table 1: Performance and Operational Comparison of ddPCR and NGS for ctDNA Analysis
| Parameter | Droplet Digital PCR (ddPCR) | Next-Generation Sequencing (NGS) |
|---|---|---|
| Core Principle | Target-specific PCR amplification in thousands of nanodroplets | Massively parallel sequencing of DNA fragments |
| Sensitivity (VAF) | Can detect variants down to 0.01% VAF [1] | Typically 0.1% - 0.5% VAF with common panels; can be lower with advanced error-correction [62] [16] |
| Throughput | Low to medium; ideal for tracking a few known mutations across many samples | High; can screen hundreds of genes across a sample in a single run [63] |
| Multiplexing Capability | Limited; typically 1-4 colors/targets per reaction | High; capable of detecting thousands of variants simultaneously [37] |
| Turnaround Time | Fast (~2-3 days from sample to result) [42] | Longer (several days to weeks), dependent on sequencing depth and bioinformatics |
| Mutation Discovery | No; requires a priori knowledge of the target sequence | Yes; enables discovery of novel and unexpected alterations [63] |
| Data Output | Absolute quantification of target molecules (copies/μL) | Sequence data and variant allele frequency (VAF) |
Table 2: Cost and Practical Considerations in a Research Setting
| Consideration | Droplet Digital PCR (ddPCR) | Next-Generation Sequencing (NGS) |
|---|---|---|
| Cost per Sample | Low for a few targets; custom probe costs can add up [1] | Higher per-sample cost, but cost per base is lower |
| Operational Costs | 5–8.5-fold lower than NGS for targeted ctDNA detection [1] | Higher due to reagents, sequencing, and data storage [1] [16] |
| Expertise Required | Standard molecular biology skills | Requires specialized bioinformatics support [16] |
| Ideal Application | - High-sensitivity longitudinal tracking of known mutations- Minimal Residual Disease (MRD) detection- Therapy response monitoring [42] | - Unbiased mutation discovery & tumor heterogeneity studies- Comprehensive genomic profiling for therapy selection- Identifying resistance mechanisms [37] [63] |
Experimental Data: Head-to-Head Detection Performance
Recent comparative studies provide empirical data on how these platforms perform in real-world research scenarios.
Detection Rate in Rectal Cancer: A 2025 study by Szeto et al. directly compared ddPCR and an NGS panel for detecting ctDNA in patients with non-metastatic rectal cancer. In the development cohort (n=41), ddPCR demonstrated a significantly higher detection rate, identifying ctDNA in 58.5% (24/41) of baseline plasma samples compared to 36.6% (15/41) for the NGS panel (p=0.00075) [3] [1]. This highlights ddPCR's superior sensitivity for oligomarker detection in localized cancers.
Sensitivity in HPV-Associated Cancers: A meta-analysis of HPV-associated cancers found that the sensitivity of ctDNA detection was greatest with NGS, followed by ddPCR and then qPCR. The study concluded that NGS had superior sensitivity overall, and specifically, plasma NGS-based testing may be the most sensitive approach for detecting circulating tumor HPV DNA [64]. This demonstrates that the superior breadth of NGS can also translate to higher overall detection rates in certain contexts.
Complementary Performance in Lung Cancer: A study of 356 lung cancer patients compared a sequencing method using Molecular Amplification Pools (MAPs) against ddPCR. The NGS assay showed a sensitivity of 98.5% and specificity of 98.9% using ddPCR as a reference. The study concluded that the accuracy of this NGS approach was similar to ddPCR down to a 0.1% allele frequency, but due to broader coverage, NGS detected additional actionable mutations that ddPCR would have missed [62].
Experimental Protocols: Core Methodologies for ctDNA Analysis
Tumor-Informed ddPCR for ctDNA Detection
This protocol is adapted from studies that used a tumor-informed approach to achieve high-sensitivity detection [3] [1].
- Tumor Sequencing and Target Selection: First, sequence the primary tumor tissue using an NGS panel (e.g., Ion AmpliSeq Cancer Hotspot Panel v2) to identify somatic mutations. Select the 1-2 mutations with the highest variant allele frequencies (VAF) for ddPCR assay design.
- Plasma Collection and cfDNA Extraction: Collect patient blood in Streck Cell-Free DNA BCT tubes. Process plasma within the recommended time frame. Extract cell-free DNA (cfDNA) using a commercial kit (e.g., QIAamp Circulating Nucleic Acid Kit).
- ddPCR Assay Setup: Design custom ddPCR assays (FAM/HEX probes) for the selected mutations. Prepare the ddPCR reaction mix containing the probe assay, ddPCR Supermix, and the extracted cfDNA.
- Droplet Generation and PCR Amplification: Generate approximately 20,000 droplets from the reaction mix using a droplet generator (e.g., Bio-Rad QX200). Perform PCR amplification on a thermal cycler with a standard ramp rate.
- Droplet Reading and Analysis: Read the plate on a droplet reader (e.g., QX200). Use analysis software (e.g., QuantaSoft) to quantify the absolute number of mutant and wild-type DNA molecules. A sample is considered ctDNA-positive if any mutant molecules are detected above a pre-defined threshold.
Targeted NGS for ctDNA Profiling
This protocol outlines a standard workflow for targeted NGS of ctDNA, incorporating error-reduction strategies [62] [16].
- Library Preparation with Unique Molecular Identifiers (UMIs): Quantify the extracted cfDNA. Prepare sequencing libraries using a targeted panel (e.g., a 56-gene oncology panel). A critical step is the ligation of UMIs to each individual DNA fragment prior to PCR amplification. This allows for bioinformatic correction of PCR and sequencing errors later.
- Target Enrichment and Amplification: Perform hybrid capture or amplicon-based PCR to enrich for the genomic regions of interest. Amplify the captured libraries to generate sufficient material for sequencing.
- High-Depth Sequencing: Pool the indexed libraries and sequence on an NGS platform (e.g., Illumina MiSeq, NextSeq). To reliably detect variants at low VAFs (e.g., 0.1%), a minimum raw sequencing depth of 15,000x-20,000x is recommended [16].
- Bioinformatic Processing and Variant Calling:
- Demultiplexing: Assign sequences to individual samples based on their index barcodes.
- UID Deduplication: Group reads originating from the same original DNA molecule using the UMIs and generate a consensus sequence to reduce sequencing noise.
- Alignment: Map the consensus reads to the human reference genome (e.g., hg19).
- Variant Calling: Use a specialized variant caller (e.g., ERASE-Seq) with a lowered threshold (e.g., 3 supporting reads) to identify somatic variants while minimizing false positives from technical artifacts [62] [16].
Diagram 1: Comparative workflows for ddPCR and NGS ctDNA analysis.
The Scientist's Toolkit: Essential Reagents and Materials
Table 3: Key Research Reagent Solutions for ctDNA Analysis
| Reagent/Material | Function | Example Products/Brands |
|---|---|---|
| Cell-Free DNA Blood Collection Tubes | Preserves blood samples and prevents genomic DNA contamination from white blood cell lysis during transport and storage. | Streck Cell-Free DNA BCT tubes |
| cfDNA Extraction Kits | Isolate and purify short-fragment cfDNA from plasma with high efficiency and reproducibility. | QIAamp Circulating Nucleic Acid Kit (Qiagen) |
| ddPCR Supermix & Probe Assays | Enable the partitioning and ultrasensitive, sequence-specific amplification of target mutations. | Bio-Rad ddPCR Supermix for Probes, Custom TaqMan Assays |
| Targeted NGS Panels | Designed to capture and sequence a curated set of cancer-related genes from low-input cfDNA libraries. | Ion AmpliSeq Cancer Hotspot Panel v2, Swift 56G Pan-Cancer Panel |
| Unique Molecular Indices (UMIs) | Short nucleotide tags added to each DNA fragment during library prep to enable error correction and accurate quantification. | Integrated into various NGS library prep kits (e.g., from Illumina, Twist Bioscience) |
The choice between ddPCR and NGS is not a matter of identifying a superior technology, but of selecting the right tool for the specific research question and context. ddPCR is the unequivocal choice for maximum sensitivity and cost-efficiency when the genomic targets are known and limited, making it ideal for longitudinal monitoring of specific mutations in studies of minimal residual disease or molecular response [42]. In contrast, NGS is indispensable for exploratory discovery, comprehensive genomic profiling, and situations where tumor heterogeneity is a primary concern, despite its higher operational cost and bioinformatic complexity [37] [63].
The future of ctDNA analysis lies in the strategic integration of both platforms. A common and powerful approach is to use NGS for initial marker discovery in tumor tissue, followed by the development of highly sensitive, patient-specific ddPCR assays for affordable and frequent monitoring throughout a study or treatment course. As NGS technologies continue to evolve, with improvements in error-correction and cost reduction, the sensitivity gap is narrowing. However, for researchers working under budget constraints and requiring the absolute highest sensitivity for defined targets, ddPCR remains an essential and powerful workhorse in the precision oncology toolkit.
Head-to-Head Performance: Validating ddPCR and NGS with Clinical Evidence
In the era of precision oncology, the analysis of circulating tumor DNA (ctDNA) has emerged as a pivotal tool for cancer monitoring, treatment selection, and recurrence risk assessment. This minimally invasive "liquid biopsy" approach provides a real-time snapshot of tumor heterogeneity and dynamics, overcoming limitations of traditional tissue biopsies [46]. Among the various technologies available for ctDNA analysis, droplet digital PCR (ddPCR) and next-generation sequencing (NGS) have become prominent methods, each with distinct advantages and limitations. ddPCR offers ultra-sensitive, quantitative detection of known mutations, while NGS provides a broader, untargeted approach for multigene analysis [1] [65]. Understanding their relative performance is crucial for researchers and clinicians seeking to implement these technologies in clinical trials and practice. This comparison guide objectively evaluates detection rates, concordance, and technical performance of ddPCR versus NGS across multiple cancer types, with particular emphasis on colorectal and rectal cancers, synthesizing evidence from recent direct comparison studies to inform method selection for specific research applications.
Detection Performance: Quantitative Comparison Across Studies
Detection Rates and Concordance
Table 1: Direct Comparison of ddPCR and NGS Performance in ctDNA Detection
| Cancer Type | Study Details | ddPCR Detection Rate | NGS Detection Rate | Concordance | Key Findings | Reference |
|---|---|---|---|---|---|---|
| Non-Metastatic Rectal Cancer | Development group (n=41); pre-therapy plasma | 24/41 (58.5%) | 15/41 (36.6%) | - | Significantly higher detection with ddPCR (p=0.00075) | [1] [3] |
| Early-Stage Breast Cancer | 46 samples from early-stage patients | Comparable to pdPCR | Comparable to ddPCR | >90% | Both systems showed comparable sensitivity | [26] |
| Cetuximab-Treated Colorectal Cancer | 15 patients (8 male, 7 female) | High for targeted mutations | 87.5% sensitivity | R²=0.98 for VAF correlation | NGS detected additional mutations (e.g., TP53) | [37] |
| Asymptomatic vs Symptomatic CRC | Two independent cohorts | Lower in asymptomatic patients after adjustment | Lower in asymptomatic patients after adjustment | - | Asymptomatic patients showed lower ctDNA detection and recurrence risk | [66] |
Technical Performance Metrics
Table 2: Technical Specifications and Performance Characteristics
| Parameter | ddPCR | NGS |
|---|---|---|
| Limit of Detection (LoD) | Can detect VAF as low as 0.01% [1] | Typically 0.5% for commercial assays; can be improved to 0.1% with specialized protocols [65] |
| Theoretical Coverage | Limited to predefined mutations | >2800 COSMIC variants across 50 genes with cancer hotspot panel [1] |
| Throughput | Low throughput, single-plex or limited multiplexing [65] | High throughput, capable of detecting multiple alteration types simultaneously [46] |
| Cost Considerations | 5-8.5-fold lower operational costs than NGS [1] | Higher cost, but provides more comprehensive genomic information [1] [65] |
| Variant Type Detection | Limited to specific targeted mutations | Can identify point mutations, copy number variations, fusions, and structural variants [65] |
| Turnaround Time | Rapid for known mutations | Longer due to library preparation and bioinformatics analysis [46] |
Experimental Protocols: Methodologies from Key Studies
Rectal Cancer Study Protocol (Szeto et al., 2025)
The 2025 rectal cancer comparison study implemented a rigorous methodology for direct technology assessment [1]. Pre-therapy plasma and rectal tumor samples were collected from a development group (n=41) and validation group (n=26) with non-metastatic rectal cancer. Tumor tissue mutations were first identified using Ion AmpliSeq Cancer Hotspot Panel v2 (HS1) sequencing, which covers hotspot regions of 50 cancer-related genes. For ctDNA detection, the study employed both tumor-informed ddPCR and tumor-uninformed NGS approaches. ddPCR assays used one to two predesigned probes targeting mutations with the highest variant allele frequencies identified in matched primary tumor NGS, partitioning 2-9μL of extracted DNA into 20,000 droplets to absolutely quantify targeted cfDNA. The NGS approach utilized the same HS1 panel optimized for ctDNA, with the variant calling threshold lowered to 0.01% variant allele frequency (VAF) based on ddPCR results. All ctDNA analyses were performed by an experienced hospital geneticist, with samples classified as ctDNA-positive if any oncogenic mutation was detected [1].
Breast Cancer Comparison Protocol
In the early-stage breast cancer comparison study, researchers analyzed 5mL of baseline plasma samples collected prior to any treatment from 46 patients [26]. They compared the QX200 droplet digital PCR system from Bio-Rad (considered the gold standard) with the Absolute Q plate-based digital PCR system from Thermo Fisher Scientific. Both systems were evaluated for their ability to detect ctDNA at low frequencies (≤0.1% of cell-free DNA), with mutant allele frequency as the primary comparison metric. The study also explored associations between ctDNA levels and clinicopathological features including Ki67 score, estrogen receptor status, and triple-negative breast cancer subtypes, demonstrating the relationship between ctDNA detection and tumor biology [26].
Technology Selection Framework
Decision Framework for ddPCR vs NGS Selection
Key Research Reagent Solutions
Table 3: Essential Materials and Reagents for ctDNA Analysis
| Category | Specific Product/Technology | Function/Application | Considerations |
|---|---|---|---|
| Blood Collection Tubes | Streck Cell-Free DNA BCT | Preserves blood sample integrity for up to 7 days at room temperature | Minimizes genomic DNA contamination from blood cell lysis [1] [33] |
| NGS Panels | Ion AmpliSeq Cancer Hotspot Panel v2 | Targeted sequencing of hotspot regions in 50 cancer genes | Covers >2800 COSMIC variants; theoretical coverage of 99% in rectal cancer [1] |
| Digital PCR Systems | Bio-Rad QX200 ddPCR System | Gold-standard droplet digital PCR for ctDNA detection | Partitions samples into 20,000 droplets; detects VAF as low as 0.01% [1] [26] |
| Digital PCR Systems | Thermo Fisher Absolute Q Digital PCR | Plate-based digital PCR system | Comparable performance to ddPCR; more stable compartments and less hands-on time [26] |
| cfDNA Extraction Kits | QIAamp Circulating Nucleic Acid Kit | Isolation of high-quality cfDNA from plasma | Manual or automated on QIAsymphony; critical for yield and purity [66] [33] |
| Unique Molecular Identifiers (UMIs) | Various commercial systems | Molecular barcodes to distinguish true mutations from sequencing errors | Essential for error correction in NGS; requires skilled bioinformatic analysis [65] |
The direct comparison between ddPCR and NGS for ctDNA detection reveals a complementary rather than competitive relationship between these technologies. ddPCR demonstrates superior sensitivity for tracking known mutations, particularly in monitoring minimal residual disease and treatment response in localized cancers like rectal cancer, where it detected ctDNA in 58.5% of pre-therapy samples compared to 36.6% with NGS [1]. Its cost-effectiveness and technical accessibility make it ideal for focused monitoring applications. Conversely, NGS provides unparalleled breadth of genomic coverage, enabling discovery of novel mutations, tracking tumor evolution, and identifying resistance mechanisms during targeted therapy, as demonstrated in cetuximab-treated colorectal cancer patients where NGS detected additional TP53 dynamics [37]. The choice between these technologies should be guided by research objectives: ddPCR for sensitive tracking of known targets, and NGS for comprehensive genomic profiling or when tumor mutations are unknown. Future methodological improvements, particularly enhancing NGS sensitivity to 0.1% LoD and standardizing pre-analytical protocols, will further solidify the role of both technologies in advancing precision oncology research [65] [33].
The analysis of circulating tumor DNA (ctDNA) has emerged as a cornerstone of liquid biopsy, offering a non-invasive window into tumor genomics for cancer detection, monitoring, and treatment selection. Two principal technologies dominate this landscape: Droplet Digital PCR (ddPCR) and Next-Generation Sequencing (NGS). The choice between these methods involves critical trade-offs among sensitivity, breadth of genomic interrogation, cost, and clinical workflow integration. This guide provides an objective, data-driven comparison of their performance, synthesizing recent evidence to inform researchers, scientists, and drug development professionals. Understanding these nuances is essential for selecting the appropriate tool for specific applications in precision oncology, from monitoring minimal residual disease (MRD) to comprehensive genomic profiling.
Performance Comparison: ddPCR vs. NGS
Key Performance Metrics and Clinical Utility
The following table summarizes the comparative performance of ddPCR and NGS based on recent clinical studies.
Table 1: Performance Comparison of ddPCR and NGS for ctDNA Analysis
| Performance Metric | Droplet Digital PCR (ddPCR) | Next-Generation Sequencing (NGS) |
|---|---|---|
| Sensitivity (Detection Rate) | Detected ctDNA in 58.5% (24/41) of baseline plasma samples in non-metastatic rectal cancer [3] [1]. | Detected ctDNA in 36.6% (15/41) of the same samples; the difference was statistically significant (p=0.00075) [3] [1]. |
| Analytical Sensitivity (LoD) | Highly sensitive for known mutations, capable of detecting variant allele frequencies (VAF) as low as 0.01% [1]. | LoD is highly dependent on sequencing depth. At a typical ~2000x deduplicated coverage, LoD is ~0.5%. Ultra-deep sequencing (>10,000x) is required for lower VAFs [16]. |
| Concordance with Tissue | In advanced NSCLC, a ctDNA-NGS first strategy was 71.2% concordant with standard tissue genotyping. In 3.4% of cases, ctDNA-NGS missed an actionable driver [13]. | |
| Multiplexing Capability | Limited; typically analyzes one to a few pre-defined mutations per assay [1]. | High; can simultaneously analyze dozens to hundreds of genes in a single assay [13] [37]. |
| Key Clinical Utility | • MRD & Prognostication: Highly prognostic in triple-negative breast cancer (TNBC); non-detection post-therapy linked to 95% relapse-free survival [4].• Therapy Monitoring: Effective for tracking known mutations during treatment [46]. | • Comprehensive Profiling: Identifies a broad spectrum of alterations (SNVs, fusions, CNVs) without prior knowledge of tumor mutations [13] [37].• Resistance Monitoring: Can detect emergent resistance mutations during therapy [37]. |
| Cost & Workflow | Lower operational costs (5–8.5-fold lower than NGS). Requires tumor tissue to inform probe selection (tumor-informed) [1]. | Higher cost per assay. Can be performed without tumor tissue (tumor-uninformed), though tumor-informed approaches exist for MRD [1]. |
Analysis of Comparative Data
The data from a 2025 study in non-metastatic rectal cancer highlights a fundamental trade-off: ddPCR demonstrated significantly higher sensitivity for detecting ctDNA when targeting known mutations [3] [1]. This superior sensitivity is attributed to its ability to precisely quantify absolute numbers of mutant DNA molecules against a wild-type background without the need for complex bioinformatic correction [46].
Conversely, the same study showed that an NGS panel missed a substantial number of cases that ddPCR identified. However, NGS offers the distinct advantage of being a hypothesis-free approach, capable of discovering novel and co-occurring mutations. For instance, in a study monitoring metastatic colorectal cancer patients treated with cetuximab, NGS successfully tracked not only KRAS mutations but also dynamic changes in TP53, which provided additional insights into disease progression [37]. This makes NGS indispensable for comprehensive genomic profiling at diagnosis.
Experimental Protocols and Workflows
Detailed Methodology from a Key Comparative Study
The 2025 study by Szeto et al. provides a robust, directly comparative experimental framework [3] [1] [18].
Patient Cohorts:
- Development Group: 41 patients with non-metastatic rectal cancer.
- Validation Group: 26 patients from the SYNCOPE clinical trial (NCT04842006).
Sample Collection:
- Baseline Plasma: Collected from all patients before any neoadjuvant therapy in Streck or Roche Cell-Free DNA blood collection tubes to stabilize nucleated cells [1].
- Tumor Tissue: Collected from surgical specimens (development cohort) or pre-therapy biopsies (validation cohort) [1].
Wet-Lab Procedures:
- Tumor Sequencing: Somatic alterations in tumor DNA were identified using the Ion AmpliSeq Cancer Hotspot Panel v2 (HS1) on an Ion GeneStudio S5 system. This panel covers hotspot regions in 50 genes, including KRAS, BRAF, APC, and EGFR, with an average sequencing coverage of 2000x [1].
- ctDNA Detection with ddPCR: Based on the primary tumor NGS results, one or two mutations with the highest variant allele frequencies were selected. Custom ddPCR assays were designed for these specific mutations. The extracted cell-free DNA was partitioned into ~20,000 droplets, and PCR amplification was performed. The platform quantified the absolute number of mutant and wild-type DNA molecules, enabling detection down to 0.01% VAF [1].
- ctDNA Detection with NGS: The same HS1 panel used for tumor tissue was applied to the plasma cfDNA samples. To ensure a fair comparison, the variant calling threshold for the NGS assay was lowered to 0.01% VAF, matching the ddPCR's level of sensitivity [1].
Data Analysis:
- A sample was classified as "ctDNA-positive" if any oncogenic mutation was detected by either method.
- Statistical analyses (Fisher's exact test, Mann-Whitney U test) were used to correlate ctDNA status with clinicopathological features [1].
Workflow Diagram
The following diagram illustrates the parallel paths of the tumor-informed ddPCR and the tumor-uninformed NGS workflows as described in the protocols.
Technological and Biological Challenges
Despite advances, both technologies face significant hurdles in ctDNA analysis. A primary challenge is the low abundance of ctDNA, especially in early-stage disease or MRD settings, where it can constitute less than 0.1% of total cell-free DNA [67] [16].
Limitations of NGS: The sensitivity of NGS is constrained by sequencing depth and the inherent error rates of PCR amplification. Without error correction, the limit of detection (LoD) for standard panels is around 0.5% VAF [16]. The use of Unique Molecular Identifiers (UMIs) is critical to tag and deduplicate reads, mitigating these errors. However, this process drastically reduces the final, unique read depth. For example, an initial 20,000x coverage may yield only ~2,000x after deduplication, which is insufficient for reliably detecting variants below 0.1% VAF [16]. The quantity of input DNA is another critical factor; a 10 mL blood draw from a low-shedding tumor (e.g., lung cancer) may yield only ~8,000 haploid genome equivalents, making the detection of a 0.1% VAF variant statistically improbable [16].
Limitations of ddPCR: While exquisitely sensitive for known targets, ddPCR is a low-throughput technology. It cannot discover novel mutations or comprehensively assess complex biomarkers like tumor mutational burden (TMB) [1] [46].
Emerging Solutions: New technologies are being developed to overcome these barriers. These include:
- Structural Variant (SV)-based assays that target tumor-specific chromosomal rearrangements, potentially offering parts-per-million sensitivity [67].
- Nanomaterial-based electrochemical sensors that promise attomolar sensitivity and rapid results [67].
- Enhanced library preparation methods that exploit the shorter fragment length of ctDNA compared to normal cfDNA, enriching the tumor-derived fraction [67].
Clinical Decision Pathway
The choice between ddPCR and NGS is dictated by the specific clinical or research question. The following diagram outlines a decision-making framework.
The Scientist's Toolkit: Essential Research Reagents and Materials
Successful ctDNA analysis relies on a suite of specialized reagents and tools. The following table details key components for setting up these experiments.
Table 2: Essential Research Reagents and Materials for ctDNA Analysis
| Item | Function | Example Products / Methods |
|---|---|---|
| Cell-Stabilizing Blood Collection Tubes | Preserves nucleated cells to prevent genomic DNA contamination and cfDNA degradation during transport and storage. | Streck Cell-Free DNA BCT, Roche Cell-Free DNA Collection Tubes [13] [1]. |
| cfDNA Extraction Kits | Isolates high-purity, short-fragment cfDNA from plasma for downstream molecular analysis. | QIAamp Circulating Nucleic Acid Kit (Qiagen) [13] [1]. |
| Tumor NGS Panels | Identifies somatic mutations in tumor tissue to inform the design of patient-specific ddPCR assays. | Ion AmpliSeq Cancer Hotspot Panel v2 (Thermo Fisher) [1]. |
| ddPCR Mutation Assays | Custom-designed probes and primers for the ultrasensitive quantification of specific tumor-derived mutations in cfDNA. | Bio-Rad ddPCR Mutation Assays [1] [4]. |
| Targeted NGS Panels for ctDNA | Enables hybrid-capture-based sequencing of a targeted gene set from cfDNA libraries. | Custom panels (e.g., Twist Biosciences), Guardant360 CDx, FoundationOne Liquid CDx [13] [16]. |
| Unique Molecular Identifiers (UMIs) | Short DNA barcodes ligated to each DNA fragment before PCR amplification to correct for amplification errors and duplicates, enabling accurate variant calling. | xGEN UMI adapters (Integrated DNA Technologies) [13]. |
| Bioinformatics Pipelines | Software for processing raw sequencing data, including UMI deduplication, variant calling, and filtering to distinguish true mutations from artifacts. | GATK Mutect2, custom in-house pipelines [13] [16]. |
The shift toward precision oncology has made comprehensive genomic profiling a cornerstone of cancer management. For years, tumor tissue biopsy has served as the gold standard for molecular analysis. However, the emergence of liquid biopsy, which analyzes circulating tumor DNA (ctDNA) from blood plasma, presents a minimally invasive alternative [68]. ctDNA consists of short DNA fragments released into the bloodstream by apoptotic or necrotic tumor cells, typically representing 0.1% or less of total cell-free DNA in cancer patients [68] [41]. While tissue and plasma genotyping aim to identify the same therapeutically targetable genomic alterations, their methodological differences lead to distinct strengths and limitations. This guide objectively compares the performance of tissue and plasma next-generation sequencing (NGS) within the broader context of ctDNA research technologies, including ddPCR.
Performance Comparison: Tissue vs. Plasma NGS
Evidence from multiple clinical studies reveals a complex relationship between tissue and plasma NGS findings. The table below summarizes key performance metrics from recent studies.
Table 1: Overall Detection Metrics from Clinical Studies
| Study and Patient Population | Sample Size | Tissue Sensitivity | Plasma Sensitivity | Overall Concordance | Key Findings |
|---|---|---|---|---|---|
| Lung Cancer (Multi-center) [69] | 423 patients | 85.63% | 74.62% | 69.27% | Plasma plus tissue increased detection to 77.30% and sensitivity to ~100%. |
| NSCLC [70] | 190 patients | 95.0% | 71.9% | 78.9% | Concordance rose to 91.2% in the 137 patients with detectable ctDNA. |
| NCI-MATCH Trial [71] | 243 patients (central testing) | - | - | 81.1% | Focused on detection of the specific tissue alteration leading to trial enrollment. |
| Chinese Lung Cancer Cohort [72] | 146 patients | - | 53.9% (variant-level) | >80% (patient-level) | High sensitivity for specific drivers: EGFR 19del (90%), ALK fusion (85.7%), KRAS p.G12C (85.7%). |
Detection Performance by Genomic Alteration Type
A critical differentiator between the two methods is their ability to detect various types of genomic alterations. Plasma NGS demonstrates a significant technical limitation for certain variant classes.
Table 2: Performance Variation by Alteration Type
| Alteration Type | Tissue NGS Performance | Plasma NGS Performance | Supporting Evidence |
|---|---|---|---|
| Single Nucleotide Variants (SNVs) & Indels | High sensitivity and reliability. | High sensitivity, comparable to tissue for many common mutations. | In lung cancer, EGFR p.Leu858Arg and p.Glu746_Ala750del were frequently detected in both sources [69]. |
| Gene Fusions (e.g., ALK, ROS1, RET) | Robust detection, considered the reference method. | Significantly less capable of detection [70]. | ALK fusions were identified in 10 tissue samples vs. 10 plasma samples in one study [69], but another noted plasma's lower proficiency [70]. |
| Copy Number Variations (CNVs) | Robust detection, considered the reference method. | Poor sensitivity and reliability [70]. | In lung cancer, EGFR CNV amplification was found in 35 tissue samples vs. only 8 plasma samples; MET CNV in 17 tissue vs. 3 plasma [69]. |
Experimental Protocols and Methodologies
Standardized Workflows for Comparative Studies
To ensure valid comparisons between tissue and plasma NGS, studies follow rigorous and standardized protocols. The diagram below illustrates a typical workflow for a concordance study.
Key Methodological Details:
- Sample Collection: For valid comparison, paired samples should be collected concurrently (ideally within 1-4 weeks) before initiation of systemic therapy to avoid confounding factors [72] [70]. Blood samples are collected in specialized tubes (e.g., Streck Cell-Free DNA BCT) to preserve ctDNA [1].
- DNA Extraction: DNA is extracted from FFPE tissue sections using kits like the QIAamp DNA FFPE Tissue Kit. For plasma, cell-free DNA is isolated using kits designed for low concentrations, such as the QIAamp Circulating Nucleic Acid Kit [72].
- Sequencing & Analysis: Both sample types are often sequenced on the same platform (e.g., Illumina) using the same gene panel to minimize technical bias. Bioinformatic pipelines (e.g., Burrows-Wheeler Aligner for alignment, GATK and VarScan for variant calling) are standardized [69] [72]. A higher sequencing depth is typically used for plasma (e.g., ≥7000x) compared to tissue (e.g., ≥1000x) to detect low-frequency variants [69].
The Scientist's Toolkit: Essential Research Reagents
Table 3: Key Reagents and Kits for Tissue-Plasma Concordance Studies
| Item | Function | Example Product |
|---|---|---|
| cfDNA Preservation Blood Tubes | Stabilizes nucleated cells and prevents cfDNA release, ensuring accurate plasma cfDNA profiles. | Streck Cell-Free DNA BCT [1] |
| Nucleic Acid Extraction Kits | Isolate high-quality DNA from FFPE tissue or low-concentration cfDNA from plasma. | QIAamp DNA FFPE Tissue Kit; QIAamp Circulating Nucleic Acid Kit [72] |
| Targeted NGS Panels | Hybridization-based gene panels for capturing and sequencing cancer-related genes. | 168-gene panel (Burning Rock Biotech) [72] [70] |
| Library Prep Kits | Prepare sequencing libraries from fragmented DNA, ligating adapters for amplification. | NGS Fast DNA Library Prep Set (Thermo Fisher) [69] |
Decision Framework and Clinical Context
The choice between tissue and plasma testing is not binary but must be guided by clinical context. The following pathway provides a strategic approach for researchers and clinicians.
Factors Influencing Concordance and Detection:
- Tumor Burden and Stage: Plasma ctDNA detection is highly correlated with tumor stage and burden. Studies consistently show significantly higher detection rates and concordance in Stage IV cancers compared to Stage I-II diseases [69] [72]. In early-stage disease, the low shed of tumor DNA into the bloodstream often limits the sensitivity of plasma NGS.
- Tumor Histology and Metastatic Sites: The anatomic site of the tumor and its metastatic pattern can influence the amount of ctDNA released into the circulation. For instance, certain metastasis locations (e.g., brain) may release less ctDNA, and histology (e.g., adenocarcinoma vs. non-adenocarcinoma in NSCLC) can affect detection rates [73].
- Technical Factors: The limit of detection (LOD), sequencing depth, and variant allele frequency (VAF) thresholds are critical. Plasma assays often use a lower VAF threshold (e.g., ≥0.1%) than tissue (e.g., ≥1%) to identify low-frequency variants [69] [72].
Tissue NGS remains the reference standard for comprehensive molecular profiling, offering high sensitivity and unique reliability in detecting CNVs and fusions. Plasma NGS serves as a powerful, minimally invasive tool with high clinical value for detecting SNVs/Indels, especially when tissue is unavailable, and for tracking genomic evolution over time. The most effective approach in modern oncology research and practice is a complementary one. Combining both methods maximizes the detection of therapeutically actionable alterations, providing a more complete picture of the tumor's genomic landscape and bringing us closer to the goal of truly personalized cancer therapy.
The integration of circulating tumor DNA (ctDNA) analysis into clinical oncology represents a significant advancement for precision medicine. This minimally invasive "liquid biopsy" approach provides real-time genomic snapshots of heterogeneous tumors from simple blood draws, enabling applications from early detection and molecular profiling to treatment response monitoring and minimal residual disease (MRD) assessment [16] [46]. Two primary technologies have emerged for ctDNA analysis: droplet digital PCR (ddPCR) and next-generation sequencing (NGS). Each offers distinct advantages and limitations, necessitating rigorous validation frameworks to establish clinical utility. The regulatory pathway for these technologies requires robust evidence generation through standardized experimental protocols, analytical validation, and clinical correlation studies. This guide objectively compares the performance characteristics of ddPCR and NGS platforms, providing researchers and drug development professionals with critical experimental data and methodologies to support clinical adoption.
Performance Comparison: Quantitative Data Analysis
Direct comparative studies provide the most compelling evidence for technology selection. The table below summarizes key performance metrics from recent validation studies.
Table 1: Direct Performance Comparison of ddPCR vs. NGS in Clinical Validation Studies
| Study Context | Detection Rate (ddPCR) | Detection Rate (NGS) | Statistical Significance | Key Findings | Citation |
|---|---|---|---|---|---|
| Non-Metastatic Rectal Cancer (n=41) | 24/41 (58.5%) | 15/41 (36.6%) | p = 0.00075 | ddPCR demonstrated significantly higher detection sensitivity in baseline plasma. | [3] [1] [18] |
| Lung Cancer (Methylation Markers) | 38.7% - 46.8% (Non-metastatic); 70.2% - 83.0% (Metastatic) | Not Reported | Not Applicable | Sensitivity varied with disease stage and cut-off method, highlighting context-dependent performance. | [12] |
| Epithelial Ovarian Cancer | 8/10 mutations detected | Identified mutations for targeting | Not Applicable | ddPCR effectively monitored personalized mutations identified initially by NGS. | [10] |
| Actionable Mutations in NSCLC (Liquid Biopsy) | Not Directly Compared | Sensitivity: ~80% (EGFR, BRAF, KRAS); Specificity: 99% | Not Applicable | NGS showed high specificity but variable sensitivity for different mutation types in liquid biopsy. | [74] |
Beyond detection rates, practical considerations significantly impact clinical implementation. The following table compares critical operational and analytical parameters.
Table 2: Analytical and Operational Characteristics of ddPCR and NGS
| Parameter | ddPCR | NGS (Targeted Panels) | Context & Implications |
|---|---|---|---|
| Limit of Detection (LoD) | Very high (VAF ~0.01% reported) [1] | Moderate (LoD ~0.5% commercial panels) [16] | ddPCR is superior for ultra-low frequency targets (e.g., MRD). NGS LoD can be improved with ultra-deep sequencing. |
| Throughput | Low throughput, targets 1-2 mutations per assay [46] | High throughput, detects 10s-1000s of variants simultaneously [16] [46] | NGS is suitable for broad genomic profiling; ddPCR is ideal for tracking specific known mutations. |
| Cost | 5–8.5-fold lower than NGS per assay [1] | Higher cost per sample [1] | Cost-effectiveness makes ddPCR attractive for high-volume, repetitive monitoring of established markers. |
| Turnaround Time | Rapid (hours), suitable for rapid results | Longer (days), complex data analysis [74] | Shorter TAT with ddPCR benefits time-sensitive clinical decisions. |
| Variant Types Detected | Limited to predefined point mutations/indels [46] | Comprehensive (SNVs, indels, CNVs, fusions) [16] | NGS provides a broader genomic landscape, crucial for discovering resistance mechanisms. |
| Input DNA Quantity | Requires less input DNA | Requires high input (e.g., ~60 ng for 20,000x coverage) [16] | Low cfDNA yield from low-shedding tumors (e.g., lung) can challenge NGS sensitivity [16]. |
Experimental Protocols for Method Validation
Tumor-Informed ctDNA Detection Workflow
A common validation strategy involves a tumor-informed approach, where tissue is first sequenced to identify patient-specific mutations, which are then tracked in plasma using a more sensitive method like ddPCR.
Table 3: Key Research Reagent Solutions for Tumor-Informed ctDNA Analysis
| Reagent / Material | Function in Protocol | Example Use Case |
|---|---|---|
| Streck Cell-Free DNA BCT Tubes | Stabilizes blood samples to prevent genomic DNA release from white blood cells, preserving the ctDNA profile. | Used for prospective blood collection in validation studies [1]. |
| Targeted NGS Panels (e.g., Ion AmpliSeq Cancer Hotspot Panel v2) | Identifies somatic mutations (SNVs, indels) in FFPE tumor tissue DNA to define patient-specific targets. | Used to find tumor-specific mutations in rectal and ovarian cancer studies [1] [10]. |
| ddPCR Mutation Assays | Ultra-sensitive and absolute quantification of specific mutations identified by NGS in plasma cfDNA. | Custom probes were designed to track mutations in ctDNA for rectal cancer and ovarian cancer monitoring [1] [10]. |
| QIAsymphony DSP Circulating DNA Kit / Similar cfDNA Kits | Automated, standardized extraction of cell-free DNA from plasma samples, ensuring high yield and purity. | Used for plasma cfDNA extraction in method validation studies [12] [75]. |
| Bisulfite Conversion Kits (e.g., EZ DNA Methylation-Lightning) | Chemically converts unmethylated cytosines to uracils, allowing methylation-specific assays to distinguish methylated alleles. | Essential for preparing DNA for methylation-specific ddPCR multiplex assays [12]. |
| Unique Molecular Identifiers (UMIs) | Short barcodes added to DNA fragments pre-amplification to tag original molecules, enabling error correction and deduplication in NGS. | Critical for distinguishing low-frequency true variants from PCR/sequencing errors in NGS workflows [16] [46]. |
Analytical Validation of Assay Performance
A critical step in the validation framework is establishing the analytical performance of the ctDNA assay. A multi-platform approach using quality control materials (QCMs) is often employed.
Table 4: Key Experimental Steps for Analytical Validation
| Validation Step | Protocol Detail | Purpose & Outcome Measure |
|---|---|---|
| Limit of Detection (LoD) | Serially dilute reference materials or clinical samples with known VAF in wild-type cfDNA. Test multiple replicates (e.g., n=4) at each dilution (e.g., 5%, 2.5%, 1%, 0.5%, 0.1% VAF). | Determine the lowest VAF at which the assay can reliably detect a variant. The LoD95 is the concentration detected with 95% probability [75]. |
| Precision & Reproducibility | Run replicates of the same sample (both QCMs and clinical samples) within the same run (repeatability) and across different runs, days, and operators (reproducibility). | Assess assay consistency. Measures include standard deviation and coefficient of variation for quantitative assays like ddPCR [75]. |
| Linearity & Quantitative Range | Analyze samples with a range of VAFs (e.g., 0.1% to 5%) and compare measured VAF to expected VAF using linear regression. | Confirm the assay provides accurate quantitative measurements across its intended use range [75]. |
| Specificity | Test plasma or cfDNA from healthy individuals or patients with non-malignant diseases to confirm the absence of false-positive signals. | Establish the true negative rate and ensure mutations are not detected in non-cancerous conditions [12]. |
Navigating Technical Hurdles and Standardization
Key Technical Challenges in ctDNA Analysis
Despite its promise, the clinical adoption of ctDNA analysis faces several technical hurdles that validation frameworks must address. A primary challenge is the low abundance of ctDNA, particularly in early-stage cancers or low-shedding tumors, which demands exceptionally sensitive detection methods [16] [46]. The absolute number of mutant DNA fragments in a sample is a critical constraint; for example, a 10 mL blood draw from a lung cancer patient might yield only ~8,000 genome equivalents, making the detection of a variant at 0.1% VAF (approximately 8 mutant fragments) statistically challenging [16].
For NGS, sequencing coverage and depth present significant barriers. Detecting variants at 0.1% VAF with 99% confidence requires a depth of coverage of approximately 10,000x, which remains prohibitively expensive for routine clinical use [16]. Furthermore, the efficiency of unique molecular identifiers (UMIs) for deduplication must be considered, as a depth of 20,000x before deduplication might yield only 2,000x afterwards, limiting effective sensitivity [16]. The quantity and quality of input DNA are also major limiting factors, with low cfDNA concentrations posing a greater challenge for NGS than for ddPCR due to the former's higher input requirements [16].
Standardization and Quality Control
Addressing these challenges requires rigorous standardization. The use of quality control materials (QCMs) from commercial manufacturers has been advocated to facilitate cross-assay comparisons and validation studies [75]. However, recent functional characterization studies reveal that QCMs can show unexpected performance differences compared to clinical samples, and variability can exist between different manufacturers' materials and across different assay platforms [75]. This underscores the need for laboratories to include well-characterized clinical samples in their validation processes and not rely solely on synthetic standards.
Standardized bioinformatic pipelines are equally crucial. Implementing strategies with "allowed" and "blocked" variant lists can enhance accuracy while minimizing false positives [16]. The variant calling threshold must be carefully calibrated; while n=5 supporting reads may work for tissue DNA, this may need to be lowered to n=3 for ctDNA analysis to achieve the required sensitivity, taking advantage of the fact that cfDNA is less prone to formalin-induced artifacts like cytosine deamination [16].
The evidence generated through rigorous performance comparison and standardized validation protocols is foundational for the clinical adoption of ctDNA technologies. The data clearly indicate that ddPCR and NGS are complementary technologies with distinct clinical niches. ddPCR excels in scenarios requiring ultra-sensitive detection of known mutations, such as MRD monitoring and rapid assessment of specific resistance mutations, offering superior sensitivity at a lower cost. NGS provides unparalleled breadth for comprehensive genomic profiling, discovery of novel alterations, and guiding initial therapy selection, despite its higher cost and more complex workflow.
The future regulatory landscape will likely require continued technological refinement to improve sensitivity, particularly for low-shedding tumors, and the establishment of universally accepted reference materials and bioinformatic standards. Successful clinical integration will depend on developing context-specific validation frameworks that match the appropriate technology—whether ddPCR, NGS, or a combined approach—to the specific clinical question, whether for early detection, therapy selection, or disease monitoring. By systematically building this evidence base through well-designed comparative studies and standardized analytical validation, researchers and drug development professionals can accelerate the responsible integration of ctDNA analysis into routine cancer care.
In circulating tumor DNA (ctDNA) research, the choice between Droplet Digital PCR (ddPCR) and Next-Generation Sequencing (NGS) is not a matter of selecting a superior technology, but of applying the right tool for the specific research question. These technologies offer complementary strengths, enabling a powerful, integrated approach to cancer genomics. This guide provides an objective comparison of their performance and outlines protocols for their synergistic application in oncology research and drug development.
Direct Performance Comparison: ddPCR vs. NGS
The analytical performance of ddPCR and NGS differs significantly, influencing their suitability for various applications. The table below summarizes key performance metrics based on recent comparative studies.
Table 1: Analytical Performance Comparison of ddPCR and NGS for ctDNA Analysis
| Performance Characteristic | Droplet Digital PCR (ddPCR) | Next-Generation Sequencing (NGS) |
|---|---|---|
| Detection Sensitivity | High; can detect variants at a Variant Allele Frequency (VAF) of 0.01% [1] [76] | Moderate; Limit of Detection (LoD) typically ~0.1% to 0.5% VAF [16] [77] |
| Quantitative Capability | Excellent; provides absolute quantification without need for standard curves [78] [79] | Semi-quantitative; relies on bioinformatics pipelines and is less precise at low VAF [16] |
| Multiplexing Capacity | Low; typically 1 to 5 targets per reaction [80] [76] | High; can profile dozens to hundreds of genes simultaneously [16] [80] |
| Throughput & Breadth | Targeted analysis of known, pre-defined mutations [80] | Discovery-based; capable of detecting novel, unknown mutations across a broad genomic landscape [16] [80] |
| Turnaround Time | Fast; same-day results possible [80] | Slower; requires days or weeks for data analysis [80] |
| Cost per Sample | Relatively low cost for targeted analysis [1] [80] | Higher cost, especially for large panels and ultra-deep sequencing [1] [16] |
| Operational Cost | 5–8.5-fold lower than NGS for ctDNA detection [1] | Higher due to reagents, sequencing, and bioinformatics resources [1] [16] |
A 2025 study on non-metastatic rectal cancer provided direct experimental evidence for these comparisons, finding that ddPCR detected ctDNA in 58.5% (24/41) of baseline plasma samples, significantly outperforming an NGS panel, which detected ctDNA in only 36.6% (15/41) of the same samples (p=0.00075) [1] [3]. This demonstrates ddPCR's superior sensitivity for detecting low-frequency variants in a clinical research setting.
Experimental Protocols for ctDNA Analysis
Complementary Testing Workflow
A synergistic research paradigm uses NGS for broad mutation discovery and ddPCR for sensitive longitudinal tracking. The following diagram illustrates this integrated workflow.
Detailed ddPCR Experimental Protocol
Objective: To achieve high-confidence detection and quantification of specific point mutations in ctDNA [76].
Key Reagent Solutions: Table 2: Essential Reagents for ddPCR ctDNA Analysis
| Research Reagent | Function | Example |
|---|---|---|
| cfDNA Extraction Kit | Isolate cell-free DNA from plasma samples. | QIAamp Circulating Nucleic Acid Kit, Promega ccfDNA Plasma Kit [76] |
| ddPCR Supermix | Provides optimized buffer for droplet generation and PCR. | Bio-Rad ddPCR SuperMix for Probes (no dUTP) [76] |
| Sequence-Specific Probes | Fluorescently-labeled probes for mutant and wild-type allele detection. | PrimeTime LNA probes (FAM/HEX-labeled) [76] |
| Droplet Generation Oil | Creates stable water-in-oil emulsion for partitioning. | Bio-Rad Droplet Generation Oil for Probes [76] |
| Control gDNA | Validates assay performance and specificity. | Horizon Discovery gDNA Reference Standards [76] |
Methodology:
- Sample Collection & cfDNA Extraction: Collect blood in Streck Cell-Free DNA BCT tubes. Isulate cfDNA from 2-4 mL of plasma using a validated kit. Elute in a low-bind tube to maximize DNA recovery [1] [76].
- Assay Design & Optimization: Design primers and dual-labeled hydrolysis probes (e.g., FAM for mutant allele, HEX/VIC for wild-type allele). Incorporate Locked Nucleic Acid (LNA) bases into probes to enhance allele discrimination [76]. Optimize primer and probe concentrations to minimize false positives and ensure clear cluster separation.
- Reaction Setup & Droplet Generation: Prepare a 22 µL reaction mix containing 11 µL of 2x ddPCR Supermix, primers, probes, and template DNA (typically 2-9 µL of extracted cfDNA). Generate approximately 20,000 droplets using a droplet generator [1] [76].
- Endpoint PCR Amplification: Perform PCR on a thermal cycler. A standard protocol: 95°C for 10 min (enzyme activation), then 40 cycles of 94°C for 30 sec (denaturation) and 55-60°C for 1 min (annealing/extension), followed by a 98°C hold for 10 min [76].
- Droplet Reading & Data Analysis: Read the plate on a droplet reader. Use Poisson statistics to calculate the absolute concentration (copies/µL) of mutant and wild-type DNA molecules from the count of positive and negative droplets [78] [76]. The variant allele frequency (VAF) is calculated as [mutant concentration / (mutant + wild-type concentration)].
Detailed NGS Experimental Protocol
Objective: To perform broad, unbiased profiling of somatic mutations across a gene panel in ctDNA [1] [16].
Methodology:
- Library Preparation: Using 10-50 ng of input cfDNA, construct sequencing libraries. This involves end-repair, adapter ligation, and amplification. A critical step is the incorporation of Unique Molecular Identifiers (UMIs)—short random barcodes added to each original DNA fragment before amplification. UMIs allow for bioinformatic correction of PCR errors and duplication, significantly improving detection sensitivity [16].
- Target Enrichment & Sequencing: Hybridize the libraries with biotinylated probes designed to capture genes of interest (e.g., cancer hotspot panels). The 2025 rectal cancer study used the Ion AmpliSeq Cancer Hotspot Panel v2, which covers >2800 COSMIC variants in 50 genes [1]. Sequence the enriched libraries on a high-throughput platform.
- Bioinformatic Analysis: Process the raw sequencing data through a specialized pipeline:
- Demultiplexing & UMI Processing: Assign sequences to samples and group reads by their UMI to generate consensus sequences, reducing sequencing noise [16].
- Alignment & Variant Calling: Map reads to a reference genome (e.g., hg19) and call variants using sensitive algorithms. To achieve the sensitivity needed for ctDNA, the variant calling threshold is often lowered, for example, requiring a minimum of 3 supporting reads for a variant call instead of the typical 5 used for tissue DNA [16].
- The final output is a list of detected mutations with their corresponding VAFs.
Decision Framework: When to Use Each Technology
The choice between ddPCR and NGS is dictated by the research objective. The following diagram outlines a strategic decision framework.
Indications for ddPCR
- Longitudinal Monitoring of Known Mutations: Once a tumor-specific mutation is identified (e.g., via NGS), ddPCR is the ideal tool for serial tracking of treatment response and emergence of resistance due to its sensitivity, precision, and cost-effectiveness [81] [80].
- Minimal Residual Disease (MRD) Detection: The high sensitivity of ddPCR (VAF ~0.01%) makes it suitable for detecting molecular recurrence after curative-intent therapy, often before clinical or radiological evidence [81] [78].
- Rapid and Cost-Sensitive Applications: When budget or time constraints are paramount and targets are defined, ddPCR provides a rapid, economical solution [1] [80].
Indications for NGS
- Comprehensive Biomarker Discovery: NGS is indispensable for the initial unbiased profiling of a tumor's mutational landscape to identify all potential therapeutic targets and resistance mechanisms [80].
- Analysis of Complex Alterations: NGS can detect a wide range of variant types, including single nucleotide variants (SNVs), insertions/deletions (Indels), gene fusions, and copy number variations (CNVs), which are challenging for ddPCR [16] [77].
- When Tumor Tissue is Unavailable: In cases where a tissue biopsy is not feasible, NGS on ctDNA provides a broader alternative to ddPCR for identifying actionable mutations [82].
ddPCR and NGS are not competing but complementary technologies in the ctDNA research toolkit. NGS offers a wide-angle lens for discovery and initial profiling, while ddPCR provides a powerful telephoto lens for focused, sensitive monitoring of specific targets. The most effective research paradigms strategically integrate both, using NGS to map the genomic territory and ddPCR to meticulously chart the course of disease over time. This synergistic approach accelerates drug development and empowers high-confidence, data-driven cancer research.
Conclusion
The choice between ddPCR and NGS for ctDNA analysis is not a matter of one technology being superior, but rather a strategic decision based on the specific clinical or research question. ddPCR offers unmatched sensitivity and cost-effectiveness for tracking known mutations in minimal residual disease and longitudinal monitoring. In contrast, NGS provides a comprehensive, hypothesis-free approach for initial genomic profiling, discovering resistance mechanisms, and agnostic screening. Future directions will likely see greater integration of both technologies in complementary workflows, increased standardization of assays, and the continued validation of ctDNA as a surrogate endpoint in oncology drug development. For researchers and drug developers, mastering the strengths and limitations of each platform is essential for advancing precision medicine and bringing effective therapies to patients faster.
References
- 1. Performance Comparison of Droplet Digital PCR and Next ... [https://pmc.ncbi.nlm.nih.gov/articles/PMC12062871/]
- 2. Droplet digital PCR of viral DNA/RNA, current progress ... [https://pmc.ncbi.nlm.nih.gov/articles/PMC8013307/]
- 3. Performance Comparison of Droplet Digital PCR and Next- ... [https://pubmed.ncbi.nlm.nih.gov/40346007/]
- 4. Clinical Validation of Digital PCR-based ctDNA detection ... [https://www.medrxiv.org/content/10.1101/2025.07.02.25330747v1]
- 5. Clinical validation of droplet digital PCR assays in ... [https://pubmed.ncbi.nlm.nih.gov/40250457/]
- 6. Sample Multiplexing | Multiplex sequencing with indexes [https://www.illumina.com/techniques/sequencing/ngs-library-prep/multiplexing.html]
- 7. Sequencing 101: How multiplexing with long-read ... [https://www.pacb.com/blog/sequencing-101-how-multiplexing-with-long-read-sequencing-makes-genomic-research-faster-cheaper-and-smarter/]
- 8. Multiplex PCR and Next Generation Sequencing - NCBI - NIH [https://www.ncbi.nlm.nih.gov/books/NBK305477/]
- 9. Fundamentals of multiplexing with digital PCR - PMC [https://pmc.ncbi.nlm.nih.gov/articles/PMC5154634/]
- 10. Tumor-informed circulating tumor DNA detection for ... [https://www.sciencedirect.com/science/article/pii/S2352551725000538]
- 11. Clinical applications of cell-free DNA-based liquid biopsy ... [https://www.sciencedirect.com/science/article/pii/S1936523325002505]
- 12. Development and validation of a methylation-specific ... [https://www.nature.com/articles/s41598-025-15228-w]
- 13. Clinical utility of liquid biopsy next-generation sequencing ... [https://www.nature.com/articles/s41598-025-13667-z]
- 14. Clinical utility and future perspectives of liquid biopsy in ... [https://www.nature.com/articles/s43856-025-00852-4]
- 15. Increased blood draws for ultrasensitive ctDNA and CTCs ... [https://www.nature.com/articles/s41523-024-00642-6]
- 16. Real-World Technical Hurdles of ctDNA NGS Analysis [https://pmc.ncbi.nlm.nih.gov/articles/PMC12564474/]
- 17. Validation of a liquid biopsy assay with increased ... [https://www.sciencedirect.com/science/article/pii/S2950195425000384]
- 18. Performance Comparison of Droplet Digital PCR and Next- ... [https://researchportal.helsinki.fi/en/publications/performance-comparison-of-droplet-digital-pcr-and-next-generation]
- 19. Tumor-naive versus tumor-informed approaches to ... [https://haystackmrd.com/tumor-naive-versus-tumor-informed-approaches-to-mrd-testing/]
- 20. Τumor-informed Vs Tumor-naïve [https://genomictestingcooperative.com/tumor-informed-vs-tumor-naive/]
- 21. Tumor-informed or tumor-agnostic circulating tumor DNA ... [https://pmc.ncbi.nlm.nih.gov/articles/PMC9909342/]
- 22. Circulating Tumor DNA–Guided Risk Stratification in... - The ASCO Post [https://ascopost.com/issues/june-10-2025/circulating-tumor-dna-guided-risk-stratification-in-colorectal-cancer-evolving-evidence-and-future-utility/]
- 23. Clinical Applications of Minimal Residual Disease Assessments by... [https://pmc.ncbi.nlm.nih.gov/articles/PMC8471730/]
- 24. The Ultimate Guide to ddPCR Services in 2021 [https://mogene.com/the-ultimate-guide-to-ddpcr-services/]
- 25. Measurable residual disease monitoring by ddPCR in the ... [https://pmc.ncbi.nlm.nih.gov/articles/PMC11061929/]
- 26. Comparative study of droplet-digital PCR and absolute Q ... [https://www.sciencedirect.com/science/article/pii/S0009898123004758]
- 27. Advantage of Next-Generation Sequencing in Dynamic Monitoring of Circulating Tumor DNA over Droplet Digital PCR in Cetuximab Treated Colorectal Cancer Patients - PMC [https://pmc.ncbi.nlm.nih.gov/articles/PMC6297189/]
- 28. Application of droplet digital PCR in minimal residual ... [https://www.nature.com/articles/s41598-024-57016-y]
- 29. Performance Comparison of Droplet Digital PCR and Next-Generation Sequencing for Circulating Tumor DNA Detection in Non-Metastatic Rectal Cancer - PubMed [https://pubmed.ncbi.nlm.nih.gov/40346007/?fc=None&ff=20250511212225&v=2.18.0.post9+e462414]
- 30. Comparative analysis of EGFR mutations in circulating ... [https://www.nature.com/articles/s41598-025-85160-6]
- 31. Comprehensive Genomic Profiling (CGP) | Cancer ... [https://www.illumina.com/areas-of-interest/cancer/ngs-in-oncology/cgp.html]
- 32. Next-Generation Sequencing: A Review of Its Transformative ... [https://pmc.ncbi.nlm.nih.gov/articles/PMC12523276/]
- 33. Improvement of the sensitivity of circulating tumor DNA- ... [https://www.explorationpub.com/Journals/etat/Article/1002333]
- 34. Comparative assessment of NOIR-SS and ddPCR for ... [https://www.nature.com/articles/s41598-021-94592-9]
- 35. FoundationOne CDx | Foundation ... [https://www.foundationmedicine.com/test/foundationone-cdx]
- 36. Comprehensive genomic profiling reveals a unique ... [https://www.nature.com/articles/s41598-025-94762-z]
- 37. Advantage of Next-Generation Sequencing in Dynamic ... [https://www.sciencedirect.com/science/article/pii/S1936523318305576]
- 38. Up-front mutation detection in circulating tumor DNA by ... [https://pmc.ncbi.nlm.nih.gov/articles/PMC9679361/]
- 39. Increased blood draws for ultrasensitive ctDNA and CTCs ... [https://pmc.ncbi.nlm.nih.gov/articles/PMC11096188/]
- 40. Use of ctDNA in early breast cancer: analytical validity and ... [https://www.nature.com/articles/s41523-024-00653-3]
- 41. Revolution of Circulating Tumor DNA: From Bench ... [https://www.mdpi.com/1467-3045/47/6/428]
- 42. Molecular response assessment using circulating tumor ... [https://www.nature.com/articles/s41416-023-02445-1]
- 43. Molecular response cutoffs and ctDNA collection ... [https://pmc.ncbi.nlm.nih.gov/articles/PMC12458711/]
- 44. Evaluating Circulating Tumor DNA Clearance as an Early ... [https://www.sciencedirect.com/science/article/pii/S2666364325001250]
- 45. Circulating Tumor DNA Detection by Digital-Droplet PCR in ... [https://pmc.ncbi.nlm.nih.gov/articles/PMC7956845/]
- 46. Circulating tumor DNA to monitor treatment response in ... [https://www.nature.com/articles/s41698-025-00876-y]
- 47. Droplet Digital Polymerase Chain Reaction Versus Plasma ... [https://www.sciencedirect.com/science/article/pii/S266636432300142X]
- 48. Detection of Circulating Tumor DNA in Liquid Biopsy [https://www.mdpi.com/1422-0067/26/2/861]
- 49. Circulating tumor DNA predicts prognosis at different time ... [https://pmc.ncbi.nlm.nih.gov/articles/PMC12507613/]
- 50. Unique Molecular Identifiers (UMIs) [https://nonacus.com/blog-unique-molecular-identifiers-unmask-low-frequency-variants/]
- 51. What are Unique Molecular Identifiers (UMIs) and Why do ... [https://www.lexogen.com/blog/rna-lexicon-what-are-unique-molecular-identifiers-umis-and-why-do-we-need-them/]
- 52. Unique Molecular Identifiers (UMIs) - Sequencing [https://www.illumina.com/techniques/sequencing/ngs-library-prep/multiplexing/unique-molecular-identifiers.html]
- 53. Challenges in UMI-UDI Data Analysis for NGS Workflows [https://www.revvity.com/blog/challenges-analyzing-data-umi-udis-next-generation-sequencing]
- 54. The impact of preanalytical variables on the analysis of cell ... [https://pmc.ncbi.nlm.nih.gov/articles/PMC11111958/]
- 55. Pre-Analytical Evaluation of Streck Cell-Free DNA Blood Collection Tubes for Liquid Profiling in Oncology - PMC [https://pmc.ncbi.nlm.nih.gov/articles/PMC10093569/]
- 56. Evaluation of automatic cell free DNA extraction metrics using different blood collection tubes | Scientific Reports [https://www.nature.com/articles/s41598-025-03508-4]
- 57. Evaluation of pre-analytical factors affecting plasma DNA ... [https://www.nature.com/articles/s41598-018-25810-0]
- 58. Comparative analysis of cfDNA collection tubes for nanopore sequencing [https://nanoporetech.com/document/requirements/cfDNA-collect-tubes]
- 59. Analysis of error profiles in deep next-generation sequencing ... [https://genomebiology.biomedcentral.com/articles/10.1186/s13059-019-1659-6]
- 60. Cell-free DNA: dynamic regulation and NGS strategies for ... [https://www.revvity.com/blog/cell-free-dna-dynamic-regulation-and-ngs-strategies-ultra-low-frequency-variant-detection]
- 61. Next-generation sequencing methodologies to detect low ... [https://www.sciencedirect.com/science/article/abs/pii/S1383574223000194]
- 62. Sensitivity, specificity, and accuracy of a liquid biopsy ... [https://www.nature.com/articles/s41598-021-89592-8]
- 63. Leveraging the Full Potential of Sensitive Circulating ... [https://www.insideprecisionmedicine.com/news-and-features/leveraging-the-full-potential-of-sensitive-circulating-tumor-dna-analyses/]
- 64. Comparing the Diagnostic Performance of Quantitative ... [https://www.sciencedirect.com/science/article/pii/S1525157823002921]
- 65. Real-World Technical Hurdles of ctDNA NGS Analysis [https://www.mdpi.com/2079-9721/13/10/312]
- 66. Circulating tumour DNA and risk of recurrence in patients ... [https://www.nature.com/articles/s41416-024-02867-5]
- 67. Monitoring and Assessment of Circulating Tumor DNA in ... [https://pmc.ncbi.nlm.nih.gov/articles/PMC12550271/]
- 68. Liquid biopsy in cancer: current status, challenges and ... [https://www.nature.com/articles/s41392-024-02021-w]
- 69. Plasma ctDNA increases tissue NGS-based detection of ... [https://pmc.ncbi.nlm.nih.gov/articles/PMC10063947/]
- 70. Comparative analysis of genomic profiles between tissue ... [https://www.sciencedirect.com/science/article/abs/pii/S0169500223008206]
- 71. Concordance between tumor tissue and plasma DNA ... [https://pubmed.ncbi.nlm.nih.gov/40388547/]
- 72. Concordance of Genomic Profiles in Matched Tissue and ... [https://pmc.ncbi.nlm.nih.gov/articles/PMC9597027/]
- 73. Advantages and Challenges of Using ctDNA NGS to ... [https://pmc.ncbi.nlm.nih.gov/articles/PMC8616165/]
- 74. Diagnostic accuracy of next-generation sequencing (NGS) ... [https://link.springer.com/article/10.1007/s12094-025-04040-7]
- 75. Functional Characterization and a Real-World Clinical ... [https://pmc.ncbi.nlm.nih.gov/articles/PMC12614329/]
- 76. Optimisation of robust singleplex and multiplex droplet ... [https://www.nature.com/articles/s41598-019-49043-x]
- 77. Analytical evaluation of circulating tumor DNA sequencing ... [https://www.nature.com/articles/s41598-024-54361-w]
- 78. Digital PCR Applications | Thermo Fisher Scientific - ES [https://www.thermofisher.com/us/en/home/life-science/pcr/digital-pcr/applications.html]
- 79. Medical diagnostic value of digital PCR (dPCR) [https://www.sciencedirect.com/science/article/pii/S2667099223000221]
- 80. NGS and ddPCR technologies: The dual approach in oncology [https://www.drugdiscoverytrends.com/ngs-ddpcr-technologies-oncology/]
- 81. The Clinical Utility of Droplet Digital PCR for Profiling ... [https://pmc.ncbi.nlm.nih.gov/articles/PMC9776872/]
- 82. Comparison of solid tissue sequencing and liquid biopsy ... [https://www.sciencedirect.com/science/article/pii/S0893395222003775]