Decoding Metastasis: Biological Drivers, Experimental Models, and Therapeutic Strategies in Solid Tumors
Metastasis is responsible for over 90% of cancer-related deaths, making its understanding a paramount challenge in oncology.
Decoding Metastasis: Biological Drivers, Experimental Models, and Therapeutic Strategies in Solid Tumors
Abstract
Metastasis is responsible for over 90% of cancer-related deaths, making its understanding a paramount challenge in oncology. This article provides a comprehensive analysis of the biological processes underpinning metastatic spread in solid tumors, tailored for researchers and drug development professionals. It systematically explores the foundational molecular and cellular mechanisms, including the metastatic cascade, Epithelial-to-Mesenchymal Transition (EMT), and the role of the tumor microenvironment. The review further evaluates advanced in vitro and in vivo methodological approaches for studying metastasis, addresses key challenges in modeling and therapeutic targeting, and validates strategies through comparative analysis of preclinical models and emerging clinical data. The synthesis aims to bridge fundamental research with translational applications, highlighting future directions for innovative anti-metastatic therapies.
The Multistep Metastatic Cascade: Core Mechanisms and Cellular Plasticity
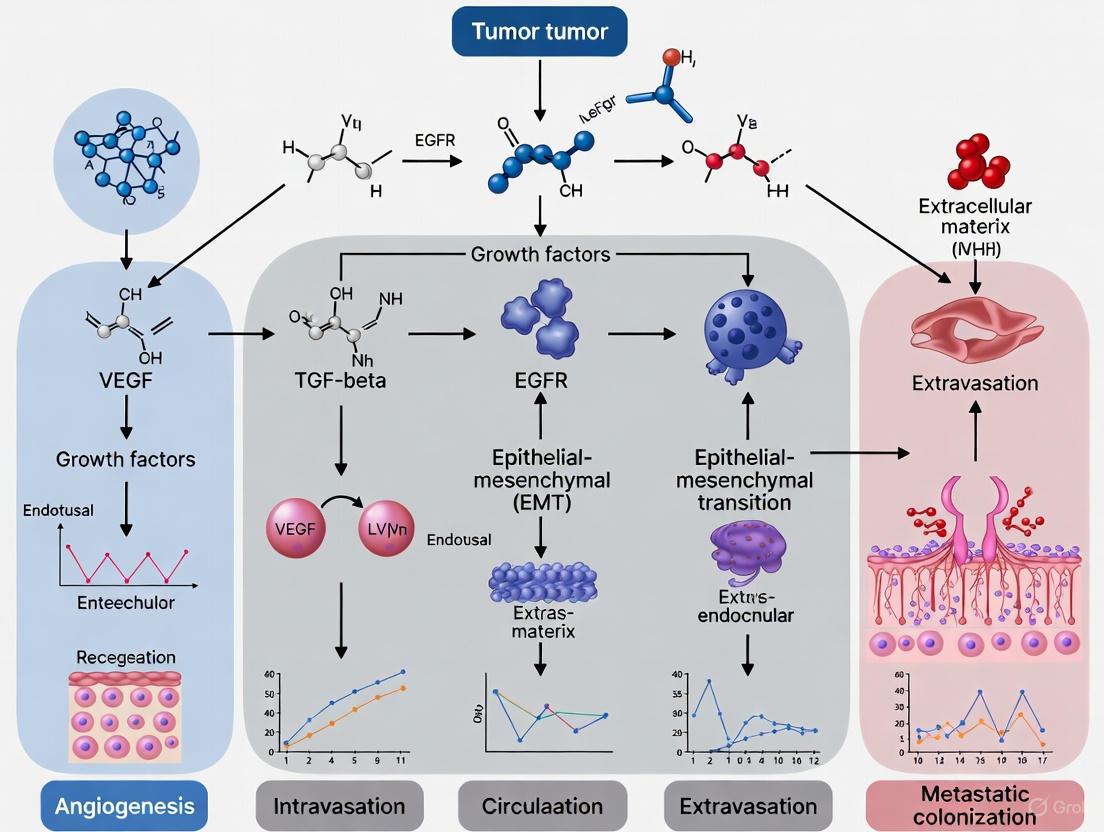
Metastasis, the dissemination of cancer cells from a primary tumor to distant organs, is a complex, multi-step process and the primary cause of cancer-related mortality, accounting for over 90% of cancer deaths [1] [2]. This cascade represents a major therapeutic challenge in oncology. The progression of malignancy involves a sequence of biological events where cancer cells must successfully navigate through a series of hostile environments to eventually colonize distant sites [1]. Understanding the intricate mechanisms underlying this process is paramount for developing effective therapeutic strategies to combat advanced cancer [1] [2].
The Metastatic Cascade: A Step-by-Step Breakdown
The journey of a cancer cell from the primary tumor to a distant metastatic site involves a well-defined sequence of steps. The following diagram illustrates this complex, multi-stage process, from initial local invasion to the final stage of metastatic colonization in a distant organ.
Step 1: Local Invasion and Epithelial-Mesenchymal Transition (EMT)
The first step involves cancer cells acquiring invasive capabilities to breach the basement membrane and invade the surrounding stroma [2]. A pivotal mechanism in this process is the Epithelial-Mesenchymal Transition (EMT), a transdifferentiation process where epithelial cells lose cell-cell adhesion and polarity, and gain a mesenchymal phenotype with enhanced motility and invasiveness [3] [2].
- Molecular Drivers: EMT is orchestrated by transcription factors like Snail, Twist, and ZEB1, which repress epithelial markers (e.g., E-cadherin) and activate mesenchymal genes [3]. This process is not a simple binary switch but a spectrum of intermediate states, granting cancer cells remarkable plasticity [2].
- ECM Remodeling: Invading cells secrete enzymes such as Matrix Metalloproteinases (MMPs) to degrade the extracellular matrix (ECM), creating paths for migration [3]. This is facilitated by interactions with the tumor microenvironment (TME), including cancer-associated fibroblasts [2].
Step 2: Intravasation
After invading the surrounding tissue, cancer cells must enter the circulatory system, a process called intravasation. They migrate towards and penetrate the endothelial wall of blood or lymphatic vessels to become Circulating Tumor Cells (CTCs) [3] [4].
Step 3: Survival in the Circulation
CTCs face a perilous journey in the bloodstream, confronting hemodynamic shear stress and immune surveillance [3]. To survive:
- Immune Evasion: CTCs may express PD-L1 to inhibit immune cells, secrete immunosuppressive factors like TGF-β, or downregulate MHC I molecules to avoid detection by T-cells [3].
- Cluster Formation: CTCs often form clusters or associate with platelets, which provide physical protection from shear forces and NK cell-mediated cytotoxicity [3]. The survival of CTCs in circulation is a major bottleneck, with less than 0.1% of cells thought to survive to form metastases [2].
Step 4: Extravasation
Arrested at distant organ capillary beds, CTCs exit the circulation by adhering to the endothelium and transmigrating through the vessel wall [1]. The mechanism of extravasation is particularly critical for organ tropism. In the case of brain metastasis, this requires overcoming the specialized Blood-Brain Barrier (BBB), a major obstacle that restricts entry into the brain parenchyma [3].
Step 5: Formation of Micrometastases and Dormancy
After extravasation, cancer cells must adapt to the new microenvironment of the distant organ. Many cells undergo apoptosis or enter a dormant state at this stage [3]. Successful cells establish micrometastases, small clusters of cells that may remain viable but non-proliferative for extended periods, evading detection and treatment [4].
Step 6: Metastatic Colonization and Macrometastasis Formation
The final step involves the outgrowth of micrometastases into clinically detectable macrometastases. This requires:
- Colonization: Cancer cells must hijack local survival signals. For instance, in the brain, astrocytes can secrete TGF-β2, which promotes colonization [3].
- Angiogenesis: To grow beyond a minimal size, the metastatic lesion must recruit its own blood supply by inducing the formation of new vessels, often driven by factors like Vascular Endothelial Growth Factor (VEGF) [3] [5].
- Secondary Dissemination: Established metastases can themselves become a source for further dissemination, releasing secondary metastasis-initiating cells (secMICs) that are often more efficient at colonizing the same or other organs [4].
Quantitative Data on Metastasis
Table 1: Organ-Specific Metastasis Incidence and Impact
| Metastasis Site | Common Primary Cancers | Approximate Incidence in Advanced Cancer | Impact on Survival / Key Complications |
|---|---|---|---|
| Bone | Breast, Prostate, Lung | 75% (Breast), 70-85% (Prostate), 40% (Lung) [1] | Reduces 3-year survival in prostate cancer by ~15-30% [1]; Skeletal-Related Events (SREs) [1] |
| Brain | Lung, Breast, Melanoma | 20-25% of advanced Breast Cancer (higher in TNBC/HER2+) [3] | Median overall survival ~1 year after diagnosis [3]; Severe neurological complications [1] |
| Liver | Colorectal, Breast, Pancreatic | ~5% of all cancer patients [1] | 1-year survival rate: 15.1% (vs. 24.0% without liver mets) [1] |
| Lung | Lung, Colorectal | 13% of Primary Lung Cancer patients [1] | Overall survival significantly lower than patients without lung metastasis [1] |
Table 2: Key Molecular Pathways and Players in Metastasis
| Pathway / Process | Key Molecules | Functional Role in Metastasis | Experimental/Targeting Insights |
|---|---|---|---|
| EMT | Snail, Twist, ZEB1, E-cadherin (loss) [3] [2] | Enhances motility, invasion, and resistance to apoptosis [2] | Inhibition of pathways (e.g., STAT3, NF-κB, Notch, Wnt) can reverse EMT [3]. |
| Circulatory Survival & Immune Evasion | PD-L1, TGF-β, MHC I (downregulation) [3] | Protects CTCs from immune destruction [3] | Immune checkpoint inhibitors (anti-PD-1/PD-L1) target this mechanism [6] [7]. |
| Angiogenesis | VEGF, VEGFR-2, FGF, Angiopoietins [5] | Promotes new blood vessel formation in primary and metastatic tumors [5] | Anti-VEGF/VEGFR therapies (e.g., Bevacizumab, Sunitinib) are clinically approved [5]. |
| Metabolic Rewiring | HIF-1α, MCT1, Asparagine Synthetase [2] | Promotes adaptation to hypoxia and oxidative stress in circulation and new microenvironment [2] | Dietary asparagine restriction or L-asparaginase treatment reduced metastasis in mouse models [2]. |
| Premetastatic Niche (PMN) Formation | Tumor-derived exosomes, LOX, miR-10b [2] | Priming a supportive microenvironment in distant organs before arrival of cancer cells [2] | Detection of exosomal content (e.g., miRNAs, proteins) in liquid biopsies serves as a potential biomarker [2]. |
Experimental Models and Methodologies
Studying the complex, multi-step process of metastasis requires robust experimental models that recapitulate key stages of the cascade.
In Vivo Models for Tracking Metastatic Dissemination
The gold standard for studying metastasis is the use of animal models, particularly mouse models. The workflow involves injecting luciferase-tagged cancer cells into immunocompromised or syngeneic mice and tracking their dissemination and growth over time using bioluminescent imaging. Key methodologies include:
- Intracardiac Injection: Direct injection into the left ventricle to model hematogenous spread and study organ-specific colonization (e.g., bone, brain) [3].
- Tail Vein Injection: Injection into the venous system to model lung colonization and study later steps of the metastatic cascade (extravasation and colonization) [3].
- Orthotopic Implantation: Injection of cancer cells into the corresponding native tissue (e.g., mammary fat pad for breast cancer) to study the entire metastatic cascade from a physiologically relevant primary site [3].
The following diagram outlines a typical experimental workflow for investigating organ-specific metastasis in an animal model.
In Vitro Models for Probing Specific Mechanisms
- BBB Transmigration Assays: To study brain metastasis extravasation, researchers use in vitro models of the BBB. These typically involve culturing brain microvascular endothelial cells on a transwell filter and quantifying the ability of cancer cells to migrate through this endothelial barrier [3].
- EMT Induction and Analysis: Cells can be induced to undergo EMT using growth factors (e.g., TGF-β). Confirmation involves Western Blot or immunofluorescence to monitor loss of E-cadherin and gain of vimentin or N-cadherin, alongside functional assays for increased migration/invasion (e.g., Boyden chamber assays) [3] [2].
The Scientist's Toolkit: Key Research Reagents and Platforms
| Category | Item / Technology | Specific Example / Application | Function in Metastasis Research |
|---|---|---|---|
| In Vivo Models | Immunocompromised Mice | NOD/SCID/NSG mice | Host for human-derived xenografts to study human cancer metastasis in vivo [3]. |
| Syngeneic Mouse Models | 4T1 (breast), B16-F10 (melanoma) | Study metastasis in an intact immune system, allowing investigation of immunotherapies [3]. | |
| Cell-Based Reagents | Metastatic Cell Lines | MDA-MB-231-BR (brain-tropic breast cancer) [3] | Tool to study organ-specific metastatic mechanisms and for testing therapeutic efficacy. |
| Molecular & Biochemical Reagents | Pathway Inhibitors | PI3K/AKT inhibitors, STAT3 inhibitors [3] | To dissect the functional contribution of specific signaling pathways to metastatic steps. |
| Recombinant Cytokines/Growth Factors | TGF-β, HGF, EGF | To induce EMT or other pro-metastatic phenotypes in vitro [3] [2]. | |
| Antibodies | Phospho-Specific Antibodies | Anti-pVEGFR2, Anti-pERK [5] | To assess activation status of signaling pathways in tumor tissues via IHC. |
| Antibodies for Flow Cytometry | CD45, CD3, CD8, CD4, CD11b, Gr-1 | To profile and quantify immune cell populations in the tumor microenvironment [6] [7]. | |
| Advanced Platforms | LLM-Powered Bioinformatics Tool | DrBioRight 2.0 [8] | Allows intuitive, natural language querying of large-scale functional proteomics data (e.g., RPPA500 dataset) to explore protein-centric cancer mechanisms. |
| Bioinformatics Plugin | Metscape 2 for Cytoscape [9] | Enables integrated visualization and analysis of metabolomics and gene expression data in the context of human metabolic networks. |
The sequential steps of metastasis—from local invasion driven by EMT, through the perilous journey in circulation, to the eventual colonization of a distant organ—represent a profound biological challenge and the main cause of mortality in cancer patients. This complex cascade is governed by dynamic interactions between genetically and epigenetically altered cancer cells and a multitude of microenvironments. While significant progress has been made in elucidating the molecular principles and signaling pathways involved, metastasis remains a formidable clinical obstacle. The integration of advanced experimental models, high-throughput omics technologies, and sophisticated bioinformatics tools is paving the way for a deeper understanding of this process. Future research must continue to dissect the vulnerabilities within the metastatic cascade to develop the next generation of therapies aimed at preventing or eradicating metastatic disease.
Epithelial-to-Mesenchymal Transition (EMT) is a fundamental cellular process that enables stationary epithelial cells to acquire motile, invasive mesenchymal characteristics. This review delineates the critical role of EMT in cancer metastasis, detailing the molecular mechanisms, regulatory networks, and cytoskeletal changes that drive cell motility and invasion. We provide a comprehensive analysis of current experimental models and methodologies for investigating EMT, with a focus on their application in metastasis research and therapeutic development. The article further explores emerging concepts such as partial EMT states, therapeutic resistance mechanisms, and computational approaches that are refining our understanding of EMT dynamics. This technical guide serves as a resource for researchers and drug development professionals working to translate basic EMT research into clinical applications for combating metastatic cancer.
Within the context of solid tumor research, the epithelial-to-mesenchymal transition (EMT) is recognized as a pivotal mechanism driving the initial steps of the metastatic cascade. EMT is a reversible biological process wherein epithelial cells lose their polarity and cell-cell adhesion properties, and gain migratory and invasive capabilities to become mesenchymal cells [10]. This transition is co-opted by carcinoma cells to facilitate local invasion, intravasation into blood or lymphatic vessels, and dissemination to distant organs [11] [12].
The process is characterized by a distinct molecular signature: the downregulation of epithelial markers such as E-cadherin, occludin, and cytokeratin, coupled with the upregulation of mesenchymal markers including N-cadherin, vimentin, and fibronectin [12] [10]. These changes are orchestrated by the activation of key transcription factors—such as SNAIL, SLUG, TWIST, and ZEB—which reprogram epithelial gene expression patterns to a mesenchymal state [12] [10]. Beyond facilitating physical dissemination, EMT also contributes to tumor initiation, stemness, and resistance to therapy, making it a multifaceted target for anticancer strategies [11] [10]. Understanding EMT is therefore imperative for addressing metastasis, the leading cause of cancer-related mortality.
Molecular Mechanisms and Signaling Pathways
The execution of EMT is governed by a complex regulatory network involving multiple signaling pathways, transcription factors, and epigenetic mechanisms. These elements collectively orchestrate the cytoskeletal and adhesive changes that confer motility and invasiveness.
Core Transcription Factors and Regulatory Networks
The EMT program is initiated and maintained by a core set of transcription factors that repress epithelial genes and activate mesenchymal genes.
- SNAIL Family: SNAIL1 (Snail) is a primary repressor of E-cadherin (CDH1) expression, a cornerstone of epithelial adhesion [12] [10]. It also activates mesenchymal genes like vimentin and fibronectin.
- ZEB Family: ZEB1 and ZEB2 bind to E-box elements in gene promoters, repressing epithelial genes such as E-cadherin and CRB3, while activating mesenchymal genes [10].
- bHLH Factors: TWIST1 and TWIST2 promote mesenchymal differentiation and are potent inducers of cell motility and invasion [10].
The expression and activity of these transcription factors are regulated by a complex network involving mutual inhibition with epithelial-specific microRNAs (e.g., the miR-200 family) and various signaling pathways, creating a series of bistable switches that can push cells toward a mesenchymal fate [10] [13].
Key Signaling Pathways
Multiple extracellular signaling cues converge on the core transcription factor network to induce EMT. The following pathways are most prominently involved:
- TGF-β Pathway: Transforming Growth Factor-beta is one of the most potent inducers of EMT. It activates SMAD complexes, which translocate to the nucleus and promote the expression of SNAIL, SLUG, and ZEB factors [12] [10].
- Wnt/β-catenin Pathway: Activation of Wnt signaling stabilizes β-catenin, allowing it to translocate to the nucleus and form complexes with TCF/LEF to transcriptionally activate targets like SNAIL and TWIST [12] [10].
- Receptor Tyrosine Kinases (RTKs) and Mechanotransduction: Growth factor receptors (e.g., c-MET, EGFR) and mechanical cues from the tumor microenvironment also drive EMT. For instance, Fluid Shear Stress (FSS) activates the mechanotransducer YAP, which is released from integrin β subunits and translocates to the nucleus to promote the expression of SNAI1, thereby inducing EMT in hepatocellular carcinoma [14].
The diagram below illustrates the integration of these key signaling pathways in regulating the core EMT transcription factor network.
Proteolytic Systems in ECM Remodeling
A critical functional outcome of EMT is the acquired ability to degrade the extracellular matrix (ECM), a necessity for invasion. The urokinase plasminogen activator (uPA) system and matrix metalloproteinases (MMPs) are central to this process.
- The uPA System: The interaction of uPA with its receptor (uPAR) leads to the conversion of plasminogen to plasmin, which directly degrades ECM components and activates pro-MMPs [12]. This system is a well-established prognostic factor in major carcinoma types, including breast, gastrointestinal, and ovarian cancers [12].
- Matrix Metalloproteinases (MMPs): Specific MMPs are upregulated during EMT to facilitate invasion. MMP-2 and MMP-9 degrade type IV collagen, a major component of basement membranes. MMP-3 and MMP-7 can process ECM components and also cleave E-cadherin, directly disrupting cell-cell adhesion. MMP-14 (MT1-MMP) is a membrane-type protease that activates pro-MMP-2 and directly degrades the ECM [12] [15].
Table 1: Key Proteases in EMT-Driven ECM Degradation and Invasion
| Protease | Primary Function in EMT and Invasion | Clinical/Experimental Association |
|---|---|---|
| uPA/uPAR | Activates plasminogen to plasmin; initiates proteolytic cascade; interacts with integrins [12]. | Prognostic factor in breast, GI, ovarian, prostate cancers; linked to MRD and dormancy [12]. |
| MMP-2 | Degrades type IV collagen of basement membranes; facilitates cell invasion [15]. | Upregulated during EMT; activity associated with increased invasive potential [15]. |
| MMP-9 | Degrades type IV collagen and remodels ECM; linked to increased cell motility [15]. | Associated with poor prognosis; identified in multi-omics EMT signatures [15]. |
| MMP-3 | Degrades ECM components; activates other MMPs (e.g., MMP-9); induces vimentin expression [15]. | Promoter of EMT; predictor of invasion in machine learning models [15]. |
| MMP-14 (MT1-MMP) | Membrane-bound; activates pro-MMP-2; directly degrades ECM components [15]. | Critical for cell migration and invasion; feature in prognostic models [15]. |
Experimental Models for Investigating EMT
A diverse arsenal of in vitro and in vivo models is available to dissect the functional role of EMT in metastasis. The choice of model depends on the specific step of the metastatic cascade under investigation.
In Vitro Models and Assays
In vitro platforms allow for controlled, quantitative analysis of specific cellular behaviors.
Classical Migration and Invasion Assays: These are foundational for assessing the functional outcome of EMT.
- Protocol - Transwell Invasion Assay: Cells are seeded in a transwell insert coated with a basement membrane matrix (e.g., Matrigel). Serum or chemoattractants are placed in the lower chamber as a stimulus. After an incubation period (typically 24-48 hours), non-invading cells are removed from the top surface, and invaded cells on the bottom surface are fixed, stained, and counted. This assay directly quantifies the ability of cells to degrade the matrix and migrate [12].
- Wound Healing/Scratch Assay: A confluent cell monolayer is scratched to create a "wound." The rate of gap closure through cell migration is monitored by time-lapse microscopy, providing a simple measure of migratory capacity [12].
Advanced 3D and Co-culture Models: These provide more physiologically relevant contexts.
- Spheroids and Organoids: Three-dimensional cultures that recapitulate aspects of tumor architecture and cell-cell interactions. They can be used to model invasion into surrounding collagen matrices and test drug penetration [11] [12].
- Microfluidics: "Organs-on-a-chip" platforms can simulate fluid shear stress and complex microenvironments, allowing for the study of intravasation and the effects of mechanical forces on EMT [11] [14].
In Vivo and Intravital Models
In vivo models are essential for validating findings within a complete biological system and studying later stages of metastasis.
- Mouse Models: A range of models are used, including cell line-derived xenografts (CDX), patient-derived xenografts (PDX), syngeneic (immunocompetent), and genetically engineered mouse models (GEMMs). These models allow researchers to study intravasation, site-specific metastasis, and treatment response in a physiologically relevant context [11] [12].
- The Chorionallantoic Membrane (CAM) Assay: The CAM of developing chick embryos is a highly vascularized membrane that can support tumor engraftment. It is a low-cost, rapid alternative to mammalian models for studying tumor angiogenesis, invasion, and experimental metastasis [11].
- Intravital Microscopy (IVM): This powerful technique allows for real-time, high-resolution imaging of cellular dynamics within live animals. For example, using an EMT-driven fluorescent color-switching mouse model (e.g., MMTV-PyMT; Rosa26-RFP-GFP; Fsp1-Cre), researchers can visualize the conversion of RFP-positive epithelial cells to GFP-positive mesenchymal cells in vivo, track their migration, and characterize their interaction with blood vessels and response to targeted therapies like the c-MET inhibitor Cabozantinib [16].
Table 2: Experimental Models for Studying EMT and Metastasis
| Model Type | Key Applications | Advantages | Limitations |
|---|---|---|---|
| Migration/Invasion Assays (e.g., Transwell) | Quantifying cell motility and matrix degradation capacity [12]. | High-throughput, quantitative, controlled variables. | Limited physiological complexity; 2D environment. |
| 3D Spheroids & Organoids | Modeling tumor architecture, cell-ECM interactions, and drug response in 3D [11]. | More physiologically relevant than 2D; recapitulates some TME aspects. | Lack of full TME (immune cells, vasculature). |
| Mouse Xenograft/GEMMs | Studying the full metastatic cascade, from primary tumor growth to distant colonization [11] [12]. | Complete in vivo system; models complex host-tumor interactions. | Costly, time-consuming; species-specific differences. |
| Intravital Microscopy (IVM) | Real-time visualization of EMT, cell migration, and vessel interactions in vivo [16] [17]. | Unprecedented dynamic and spatial resolution in live animals. | Technically challenging; limited imaging depth and field of view. |
The Scientist's Toolkit: Essential Research Reagents and Materials
This section details key reagents and tools essential for designing and executing experiments in EMT research.
Table 3: Key Research Reagent Solutions for EMT Investigation
| Reagent / Material | Function and Application in EMT Research |
|---|---|
| Recombinant TGF-β | A potent soluble inducer of EMT; used to stimulate the EMT program in various in vitro cell culture models [12] [10]. |
| c-MET Inhibitors (e.g., Cabozantinib) | Small molecule tyrosine kinase inhibitor; used to probe the role of HGF/c-MET signaling in EMT and to suppress EMT conversion, as demonstrated in in vivo imaging studies [16]. |
| Fluorescent Reporter Cell Lines (e.g., RFP-GFP Fsp1-Cre) | Genetically engineered models that enable visual tracking of EMT initiation (switch from RFP to GFP) in real-time, both in vitro and in vivo via intravital microscopy [16]. |
| Matrigel / Basement Membrane Extract | A complex ECM protein mixture used to coat transwell inserts for invasion assays or as a 3D substrate for organoid culture, mimicking the in vivo basement membrane [12]. |
| Antibodies for EMT Markers | Epithelial: E-cadherin, Cytokeratin. Mesenchymal: N-cadherin, Vimentin. Transcription Factors: SNAIL, SLUG, TWIST. Used for immunoblotting, immunohistochemistry, and immunofluorescence to validate EMT status [12] [16]. |
| Microfluidic Devices | Chip-based systems to apply controlled fluid shear stress (e.g., 1.4 dyn/cm² for HCC studies) and model biomechanical cues from the tumor microenvironment that influence EMT [14]. |
EMT Plasticity and Therapeutic Implications
The traditional binary view of EMT has evolved to encompass a spectrum of intermediate states, which hold significant clinical implications.
Partial EMT and Metastatic Plasticity
Cells can stably reside in a partial EMT (or hybrid E/M) state, co-expressing both epithelial and mesenchymal markers. This state is now strongly associated with high metastatic potential, stemness, and therapy resistance [10] [13]. Single-cell RNA-sequencing (scRNA-seq) and mathematical modeling have identified consensus genes associated with these intermediate states, such as SFN (Stratifin) and ITGB4 (Integrin β4), which were previously ambiguously classified as either epithelial or mesenchymal [13]. The plasticity to transition between states, rather than a fixed mesenchymal identity, is crucial for successful metastasis, as the reverse process (MET) is thought to be necessary for metastatic outgrowth at distant sites [11] [10].
The following diagram illustrates the spectrum of EMT states and their associated metastatic properties.
Therapeutic Challenges and Targeting Strategies
Targeting EMT remains a formidable challenge but offers promising avenues for novel therapies.
- Therapy Resistance: Cells undergoing EMT, particularly in intermediate states, exhibit enhanced resistance to conventional chemotherapy and targeted therapies [10]. This is mediated through multiple mechanisms, including increased expression of drug efflux pumps, enhanced DNA damage repair, and avoidance of apoptosis.
- Emerging Targeting Approaches:
- Inhibiting EMT Transcription Factors: Directly targeting core TFs like SNAIL or TWIST is challenging due to their disordered structure, but strategies using small molecule inhibitors or indirect targeting are in development [10].
- Targeting Signaling Hubs: Molecules like urokinase receptor (uPAR) and integrins, which sit at the intersection of multiple signaling pathways and regulate ECM degradation, dormancy, and proliferation, are being re-evaluated as therapeutic targets and biomarkers [12].
- Leveraging Computational Biology: Machine learning and multi-omics data integration (genomics, transcriptomics, proteomics) are being used to identify novel EMT-related biomarkers and predictive signatures for patient stratification and treatment planning, especially in aggressive subtypes like triple-negative breast cancer [15] [13].
EMT stands as a master regulatory program of cell motility and invasion, playing an indisputable role in the metastatic cascade of solid tumors. Its complexity, governed by a dynamic network of transcription factors, signaling pathways, and proteolytic systems, necessitates the use of a sophisticated toolkit of experimental models—from 3D organoids to intravital imaging. The recent paradigm shift toward understanding EMT as a plastic spectrum, with critical intermediate states, opens new avenues for therapeutic intervention. Future research focused on targeting this plasticity, overcoming associated therapy resistance, and validating biomarkers in clinical cohorts will be crucial for translating our deep mechanistic understanding of EMT into effective strategies to curb cancer metastasis.
Ion Channels and Bioelectric Signaling as Novel Regulators of Cancer Cell Migration
Cancer metastasis is a multifaceted process driven by dynamic cellular and molecular interactions, with ion channels and bioelectric signaling emerging as critical regulators of migratory behaviors. This technical review synthesizes current mechanistic insights into how voltage-gated sodium, potassium, and calcium channels control key metastatic processes including epithelial-mesenchymal transition, directed migration, and invasion through confined microenvironments. We present quantitative analyses of channel expression patterns across cancer types, detailed experimental protocols for investigating channel-driven migration, and visual schematics of underlying signaling pathways. Therapeutically, we evaluate pharmacological channel modulators—including FDA-approved repurposing candidates—that demonstrate efficacy in preclinical models. This resource provides cancer researchers and drug development professionals with both foundational knowledge and practical methodologies for advancing this rapidly evolving field toward clinical translation.
The bioelectric properties of cancer cells, established through the regulated flux of ions across the plasma membrane, constitute a fundamental regulatory layer controlling metastatic dissemination. The resting membrane potential (RMP), traditionally considered a hallmark of excitable cells, is now recognized as a key determinant of proliferative and migratory phenotypes across carcinomas [18] [19]. Migratory cells exhibit characteristic RMP depolarization compared to their non-migratory counterparts, with aggressive triple-negative breast cancer (TNBC) cells displaying RMP values between -40 mV and -20 mV, significantly depolarized relative to normal mammary epithelial cells [19]. This bioelectric shift activates voltage-sensitive signaling pathways and facilitates the cytoskeletal remodeling necessary for motility.
Ion channels—including voltage-gated sodium channels (VGSCs), potassium channels, calcium channels, and chloride channels—serve as primary conductors of bioelectric signaling by regulating specific ionic gradients [20]. Their expression and activity are frequently dysregulated in malignancy, creating a pro-migratory bioelectric state classified as an "oncochannelopathy" [21]. Beyond cell-autonomous effects, bioelectric signaling operates at the tissue level, enabling coordinated cellular behaviors during collective migration and establishing pre-metastatic niches [18] [22]. This review examines the pathophysiological mechanisms, experimental approaches, and therapeutic opportunities targeting ion channel networks in metastatic cancer.
Ion Channel Families in Cancer Migration
Sodium Channels
Voltage-gated sodium channels (VGSCs) are strongly implicated in enhancing the invasive and migratory capabilities of diverse carcinoma cells. Their expression correlates directly with metastatic aggressiveness across cancer types [23].
Table 1: Sodium Channel Expression and Functions in Cancer Migration
| Channel Subtype | Cancer Type | Pro-Migratory Mechanisms | Experimental Evidence |
|---|---|---|---|
| Nav1.5 | Breast Cancer | Enhances invasion via increased Na+/H+ exchanger (NHE1) activity, promoting ECM degradation through extracellular acidosis [23] [20]. | TTX-sensitive Nav1.5 knockdown reduces invasiveness by >50% in MDA-MB-231 cells [23]. |
| Nav1.7 | Prostate Cancer | Promotes invasion through MACC1-NHE1 signaling axis; upregulated under hypoxia [20]. | Nav1.7 silencing decreases invadopodia formation and Matrigel invasion in PC-3 cells [23]. |
| nNav1.5 | Breast Cancer | Neonatal splice variant enhances persistent Na+ current, driving invasion particularly in hypoxic microenvironments [20]. | Selective nNav1.5 inhibition with ranolazine reduces invasion by 60-70% in vitro [23]. |
The neonatal splice variant nNav1.5 is of particular clinical interest as it is predominantly expressed in breast cancer cells with minimal detection in healthy adult tissues, offering a promising therapeutic window [23]. VGSCs promote invasion through multiple interconnected mechanisms: (1) regulating intracellular pH via NHE1 to facilitate ECM degradation; (2) activating proteolytic enzymes; and (3) enhancing cell motility through calcium signaling pathways [23].
Potassium Channels
Potassium channels maintain the negative RMP, and their dysregulation significantly impacts migratory behavior. Channel inhibition or genetic manipulation that depolarizes the membrane potential enhances in vitro invasion and in vivo metastasis in TNBC models [24] [25].
Table 2: Potassium Channels in Cancer Migration and Metastasis
| Channel | Cancer Type | Migratory Role | Genetic/Pharmacological Evidence |
|---|---|---|---|
| KCNMA1 (BK) | Gastric, Endometrial | Regulates apoptosis and proliferation; promotes migration through MAPK signaling [21]. | KCNMA1 knockdown increases apoptosis and reduces invasion [21]. |
| Kv1.3 | Melanoma | Modulates immune microenvironment and cancer cell survival via caveolin-Kv1.3 axis [21]. | Channel blockade induces apoptosis in B16F10 melanoma models [21]. |
| Kir2.2 | Prostate Cancer | Promotes proliferation via NF-κB/cyclin D1 pathway [21]. | Kir2.2 overexpression increases proliferation and migration in PC-3 cells [21]. |
| EAG1 | Breast Cancer | Regulates cell cycle progression; overexpression hyperpolarizes membrane and accelerates G1/S transition [24]. | FDA-approved blocker amiodarone reduces metastasis by 50% in mouse models [25]. |
Functional studies demonstrate that potassium channel-driven hyperpolarization provides the electrochemical driving force for calcium influx, which subsequently activates Rho GTPases and cytoskeletal remodeling necessary for migration [18] [24]. In TNBC, potassium channel overexpression hyperpolarizes the membrane potential and increases invasion both in vitro and in vivo, while pharmacological blockade with amiodarone restores normal RMP and reduces metastatic burden by approximately 50% in mouse lung metastasis models [24] [25].
Calcium and Chloride Channels
Calcium channels serve as critical downstream effectors of potassium and sodium channel activity, translating bioelectric signals into biochemical responses that direct migration.
Table 3: Calcium and Chloride Channels in Migration Signaling
| Channel Type | Example Channels | Role in Migration | Mechanistic Insights |
|---|---|---|---|
| Voltage-Gated Calcium Channels | Cav1.3, CACNA1E | Promote proliferation and invasion in endometrial and non-small cell lung cancers [21]. | Activate GPER, ERK1/2, and CREB signaling; modulate EGFR/p-Akt/p-Erk pathways [21]. |
| Store-Operated Channels | Orai1, STIM1 | Enhance cervical and gastric cancer proliferation [21]. | Regulate cell cycle via p21 and cyclin D1; Orai1 modulates PD-L1 expression in extracellular vesicles [21]. |
| TRP Channels | TRPC6, TRPC1 | Promote proliferation in liver and thyroid cancers [21]. | Activate SOCE and cyclin pathways; TRPC1 knockdown reduces cyclin D2/D3 and CDK6 [21]. |
| Chloride Channels | ClC-3, ANO1 | Enhance proliferation in nasopharyngeal and breast cancers [21]. | Regulate cell cycle via p21/p27 and CDK4/6; activate EGFR/CAMK signaling [21]. |
Calcium transients regulate the actomyosin contractility required for rear retraction during migration and control the turnover of focal adhesions at the leading edge [18] [20]. Chloride channels facilitate cell volume adjustments necessary for migration through confined spaces and contribute to RMP regulation alongside potassium channels [26] [21].
Nuclear Mechanosensing in Confined Migration
During migration through spatially restricted microenvironments—such as pores ranging from 1-20 μm in diameter that cells encounter in vivo—the nucleus transitions from a passive mechanical obstacle to an active mechanosensory organelle [26]. The nuclear envelope, supported by lamin networks, perceives and responds to compressive forces, with lamin-A conferring nuclear stiffness and lamin-B contributing to elastic recovery [26]. Nuclear deformation during confinement activates mechanosensitive signaling through several mechanisms:
- Nuclear pore complex dilation: Physical distortion of the nuclear envelope widens pore diameters, altering nucleocytoplasmic transport and exposing the nuclear interior to regulatory factors [26].
- Lamin-dependent chromatin reorganization: Mechanical stress triggers chromatin remodeling through lamin-associated domains (LADs), potentially altering transcriptional programs to support adaptive migration [26].
- Linker of nucleoskeleton and cytoskeleton (LINC) complex-mediated signaling: The LINC complex transmits cytoskeletal forces directly to the nuclear interior, activating mechanotransductive pathways [26].
The interplay between nuclear mechanosensing and ion channel activity creates a integrated regulatory system during confined migration, where nuclear deformation may trigger calcium influx through mechanosensitive channels to further facilitate adaptive responses [26].
Experimental Approaches and Methodologies
Impedance-Based Migration Assays
Electric cell-substrate impedance sensing (ECIS) and related technologies provide label-free, real-time quantification of cell migration, proliferation, and barrier integrity [27].
Diagram 1: Impedance-Based Migration Assay Workflow. This automated system applies alternating current to cell monolayers and measures impedance changes as cells migrate following wound introduction, providing continuous kinetic data without manual intervention.
Protocol: Impedance-Based Wound Healing Assay
- Cell Seeding: Plate breast cancer cells (MCF-7, MDA-MB-231, HCC1806) at 50,000 cells/well in poly-D-lysine coated 96-well plates with integrated electrodes [27].
- Culture Conditions: Maintain in RPMI-1640 medium with 10% FBS at 37°C, 5% CO₂ until full confluence is achieved (typically 24-48 hours) [27].
- Wound Formation: Using the Maestro Z system (Axion Biosystems), apply an elevated electrical signal (2000-4000 Hz) for 15-30 seconds to create a precise, reproducible wound by electroporating and detaching cells in a defined area [27].
- Impedance Monitoring: Continuously monitor impedance at multiple frequencies (e.g., 100 Hz, 1 kHz, 10 kHz) every 15 minutes for 24-36 hours post-wounding [27].
- Data Analysis: Calculate normalized cell index values. Migration rate is quantified by the time taken for impedance to recover to 50% of pre-wound values. Barrier integrity is assessed via trans-epithelial electrical resistance (TEER) derived from low-frequency impedance [27].
This methodology enables simultaneous assessment of multiple cellular parameters—migration kinetics, proliferation rates, and barrier function—within a single experiment, providing a comprehensive profile of metastatic behavior [27].
Channel Modulation and Membrane Potential Manipulation
Direct investigation of ion channel contributions to migration requires specific genetic and pharmacological approaches:
Genetic Manipulation Protocol
- Channel Overexpression: Transfect TNBC cells (MDA-MB-231) with potassium channel (KCNMA1) plasmids using lipid-based transfection; select stable clones with puromycin (1-2 μg/mL) for 2 weeks [24].
- Channel Knockdown: Transduce cells with lentiviral shRNAs targeting specific VGSC subunits (e.g., Nav1.5); validate knockdown efficiency via Western blotting and patch clamp electrophysiology after 72 hours [23] [24].
- Membrane Potential Measurement: Load cells with DiBAC₄(3) fluorescent dye (500 nM for 30 minutes) and analyze using flow cytometry or fluorescence microscopy. Hyperpolarized states decrease fluorescence intensity, while depolarization increases intensity [24] [25].
Pharmacological Modulation Protocol
- Channel Blocker Screening: Treat TNBC cells with FDA-approved channel blockers—amiodarone (K+ channel, 10 μM), ranolazine (Na+ channel, 100 μM), lidocaine (Na+ channel, 500 μM)—for 24-48 hours [23] [25].
- Migration Assessment: Evaluate treatment effects using impedance-based assays (as above) or Boyden chamber transwell assays with Matrigel coating (8 μm pores) [24].
- Downstream Analysis: Extract RNA and protein post-migration for qPCR (cadherin-11, MMPs) and Western blot (p-ERK, RhoA) to identify affected pathways [24].
Signaling Pathways in Channel-Driven Migration
The pro-migratory effects of ion channels are mediated through interconnected signaling networks that coordinate cytoskeletal dynamics, cell adhesion, and matrix remodeling.
Diagram 2: Ion Channel Signaling in Cancer Cell Migration. Key pathways through which sodium and potassium channels activate downstream effectors to drive migratory processes. VGSC activation increases intracellular pH via NHE1, facilitating protease activity, while potassium channel-mediated hyperpolarization enhances calcium influx, activating MAPK/ERK signaling and EMT programs.
Key pathway interactions include:
- VGSC→NHE1→Protease Activation: Sodium influx through VGSCs activates the Na+/H+ exchanger NHE1, elevating intracellular pH and optimizing conditions for matrix-degrading enzymes including MMPs and cathepsins [23].
- K+ Channel→Ca2+ Signaling→Cytoskeletal Dynamics: Potassium efflux maintains the electrochemical gradient that drives calcium influx through voltage-gated calcium channels, activating calpain proteases and Rho GTPases that regulate focal adhesion turnover and actomyosin contractility [20] [24].
- Channel-Mediated MAPK/ERK Activation: Multiple channel types converge on the MAPK pathway; for example, Nav1.7 in prostate cancer activates ERK signaling through the MACC1 pathway, while potassium channels in TNBC regulate cadherin-11 expression through MAPK to influence collective migration [21] [24].
Therapeutic Translation and Clinical Outlook
The strategic repositioning of FDA-approved ion channel modulators represents a promising near-term therapeutic approach for metastatic disease.
Table 4: Ion Channel-Targeted Agents in Cancer Therapeutic Development
| Therapeutic Agent | Primary Target | Original Indication | Anticancer Evidence | Proposed Mechanism in Cancer |
|---|---|---|---|---|
| Ranolazine | Voltage-gated Na+ channels | Chronic angina | Reduces breast cancer cell invasion by 60-70% in vitro [23]. | Inhibits nNav1.5 activity, disrupting pH regulation and invadopodia formation. |
| Amiodarone | K+ channels | Cardiac arrhythmia | Decreases metastatic burden by ~50% in TNBC mouse models [25]. | Restores normal RMP, inhibits MAPK/cadherin-11 signaling. |
| Lidocaine | Voltage-gated Na+ channels | Local anesthesia | Inhibits invasion in breast, prostate, and colon cancer models [23]. | Blocks VGSC activity, reducing perioperative metastatic risk. |
| Tetrodotoxin (TTX) | Voltage-gated Na+ channels | Experimental tool | Suppresses invasion in multiple cancer cell lines [23]. | Selective inhibition of TTX-sensitive Nav isoforms. |
Clinical development considerations:
- Therapeutic Windows: Cardiac and neuronal channel targets require careful dosing strategies to minimize off-target effects [20].
- Biomarker Development: Nav1.5 expression in circulating tumor cells may serve as predictive biomarker for VGSC-targeted therapies [23].
- Combination Strategies: Channel inhibitors demonstrate synergy with conventional chemotherapy; for example, ranolazine enhances cisplatin efficacy in TNBC models [20].
Phase 0/I clinical trials are anticipated within 1-2 years for repurposed agents like amiodarone and ranolazine, focusing initially on metastatic TNBC patients with limited treatment options [25].
The Scientist's Toolkit: Essential Research Reagents
Table 5: Key Reagents for Ion Channel Migration Research
| Reagent/Cell Line | Specifications | Research Application | Example Source |
|---|---|---|---|
| MDA-MB-231 | Triple-negative breast cancer (ER-/PR-/HER2-) | Model for aggressive, highly metastatic cancer; responsive to channel modulation [27] [24]. | ATCC |
| MCF-7 | Luminal breast cancer (ER+/PR+) | Less aggressive comparison cell line; depolarized RMP [27]. | ATCC |
| Maestro Z System | Impedance-based live cell analysis | Label-free, real-time monitoring of migration, proliferation, and barrier function [27]. | Axion Biosystems |
| IonFlux Mercury | Automated patch clamp system | High-throughput ion channel screening for drug discovery [25]. | Fluxion Biosciences |
| DiBAC₄(3) | Fluorescent membrane potential dye | RMP measurement via flow cytometry or fluorescence microscopy [24]. | Multiple suppliers |
| Amiodarone HCl | Potassium channel blocker | Investigational tool for RMP manipulation in migration studies [24] [25]. | Sigma-Aldrich |
| Ranolazine | Sodium channel blocker | Research tool for nNav1.5 inhibition studies [23]. | Sigma-Aldrich |
| Anti-Nav1.5 Antibody | SCN5A-specific | Detection of VGSC expression in cancer cells and tissues [23]. | Multiple suppliers |
The expanding recognition of bioelectric signaling as a cancer hallmark opens several promising research avenues. Technologically, advanced voltage-sensitive fluorescent proteins (e.g., ASAP1) now enable real-time visualization of membrane potential dynamics in migrating cancer cells [18]. The development of channel isoform-specific inhibitors remains a priority, particularly for neonatal Nav1.5 and cancer-associated potassium channel variants [23] [24]. From a clinical perspective, understanding channel-mediated therapy resistance may inform combination strategies, while the diagnostic potential of bioelectric signatures in liquid biopsies warrants exploration [20].
In conclusion, ion channels and bioelectric signaling constitute a fundamental regulatory system coordinating cancer cell migration and metastatic dissemination. Their therapeutic targeting offers a promising approach for addressing the critical unmet need in metastatic disease, with several repurposed agents positioned for near-term clinical evaluation. As our understanding of bioelectric networks deepens, these insights will likely establish membrane potential manipulation as a fourth modality of cancer treatment alongside conventional chemotherapy, radiation, and targeted biological therapies.
The tumor microenvironment (TME) is a complex and dynamic ecosystem that plays a critical role in cancer progression and metastasis. Comprising cancer cells, stromal cells, immune cells, and the extracellular matrix (ECM), the TME exhibits unique physicochemical properties that distinguish it from normal tissue environments [28]. Among these properties, hypoxia (low oxygen tension) and acidity (low extracellular pH) represent two hallmark features that drive tumor aggressiveness, therapeutic resistance, and immune evasion [28] [29]. These elements do not function in isolation but engage in a complex interplay that rewires tumor cell metabolism and initiates extensive ECM remodeling [29] [30].
This review examines how the synergistic relationship between hypoxia, acidity, and ECM dynamics creates a permissive environment for metastasis. We will explore the underlying molecular mechanisms, detail key experimental methodologies for studying these phenomena, and discuss emerging therapeutic strategies that target the TME to combat cancer progression.
The Physicochemical Hallmarks of the TME
Hypoxia: Oxygen Deprivation as a Driver of Malignancy
Hypoxia in solid tumors arises from an imbalance between oxygen supply and consumption, driven by aberrant vasculature and rapid tumor cell proliferation [28] [29]. Oxygen diffusion is limited to approximately 100–200 μm from blood vessels, creating chronic hypoxic regions even in areas adjacent to vasculature [28] [29]. Tumor cells adapt to oxygen levels as low as 0.5-1.5% through a transcriptional program mediated by hypoxia-inducible factors (HIFs), which promote angiogenesis, metabolic reprogramming, and invasion [28].
Acidity: The Consequences of Metabolic Reprogramming
The metabolic shift to glycolysis in cancer cells, known as the Warburg effect, results in massive lactate and proton production [28] [29]. Tumor cells maintain a reversed pH gradient, with an intracellular pH (pHi) of 7.12-7.56 (favoring proliferation) while acidifying the extracellular space to pH 6.2-6.9 [29]. This acidic TME is maintained by various transport proteins, including monocarboxylic acid transporters (MCTs), carbonic anhydrases (CAs), vacuolar-type H+-ATPase (V-ATPase), and Na+/H+ exchangers (NHE) that export protons [28].
Table 1: Physicochemical Properties of Normal vs. Tumor Microenvironments
| Parameter | Normal Tissue | Tumor Tissue |
|---|---|---|
| Extracellular pH (pHe) | 7.3-7.4 [29] | 6.2-6.9 [29] |
| Intracellular pH (pHi) | 6.99-7.20 [29] | 7.12-7.56 [29] |
| Lactate Concentration | 1.5-3.0 mM [28] | 10-30 mM [28] |
| Oxygen Pressure | Normal physiological levels | Frequently hypoxic (≤1.5% O₂) [29] |
| Interstitial Fluid Pressure | Normal | Elevated [29] |
Molecular Mechanisms of TME-Mediated Metastasis
Signaling Pathways in Hypoxia and Acidity
The following diagram illustrates the core signaling pathways activated by hypoxia and acidity in the tumor microenvironment, driving progression and metastasis:
Pathway Dynamics and Clinical Impact: Hypoxia stabilizes HIF-1α, which transcriptionally activates genes promoting glycolytic metabolism [28] [29]. This accelerates lactate production, further exacerbating extracellular acidosis. The acidic TME in turn activates additional signaling cascades, including NF-κB and IL-8, which promote cell migration and blood vessel formation [28]. Together, these pathways induce epithelial-mesenchymal transition (EMT), enhancing invasive potential and ultimately leading to metastasis [28] [31].
Extracellular Matrix Remodeling
The ECM undergoes extensive remodeling in the TME, transitioning from a physiological scaffold to a pathology-promoting milieu. Key alterations include:
- Increased Deposition and Cross-linking: Upregulation of collagen, fibronectin, and laminin enhances ECM stiffness, creating a physical barrier to immune cell infiltration [30].
- Proteolytic Activity: Matrix metalloproteinases (MMPs), cathepsins, ADAM/ADAMTS family proteases, and serine proteases degrade ECM components, facilitating cancer cell invasion [30].
- Biochemical Signal Alteration: Remodeled ECM serves as a reservoir for growth factors and cytokines that promote tumor progression and modulate immune cell function [30].
ECM stiffness alone can impair T cell receptor signaling by mechanomodulation, contributing to immune evasion [30]. Furthermore, cancer-associated fibroblasts (CAFs) are key effectors of ECM remodeling, depositing and organizing matrix components that support metastatic dissemination [30].
The Pre-Metastatic Niche: Preparing for Dissemination
The concept of the pre-metastatic niche (PMN) has redefined our understanding of metastasis. Primary tumor-derived factors, particularly extracellular vesicles (EVs), prime distant organ sites for metastatic colonization before tumor cell arrival [31]. Hypoxia and acidity significantly enhance EV release and modify their cargo, loading them with oncogenic proteins, miRNAs, and DNA fragments that reprogram recipient cells in distant organs [29] [31].
Table 2: Key Components of the Pre-Metastatic Niche
| PMN Component | Function in Metastasis | Influencing TME Factors |
|---|---|---|
| Extracellular Vesicles (EVs) | Transfer metastatic information; modify soil at distant sites [29] [31] | Enhanced release under hypoxia and acidity [29] |
| Bone Marrow-Derived Cells | Establish immunosuppressive microenvironment; promote angiogenesis [31] | Recruited by tumor-derived factors including EVs |
| ECM Remodeling | Create a permissive scaffold for circulating tumor cell attachment | Regulated by proteases (MMPs, cathepsins) [30] |
| Immunosuppression | Inactivate anti-tumor immune responses; promote tolerance | Driven by lactic acid, acidic pH, regulatory T cell recruitment [28] |
| Angiogenesis | Enhance vascular permeability for tumor cell extravasation | Stimulated by VEGF, IL-8 upregulated in acidic TME [28] |
The formation of PMNs follows a sequential process: priming, licensing, initiation, and progression [31]. This sophisticated preparation ensures that circulating tumor cells (CTCs) encounter a supportive environment upon arrival at secondary sites, significantly increasing the likelihood of successful metastatic colonization.
Experimental Approaches for TME Analysis
TME-Analyzer: A Tool for Spatial Analysis
The TME-Analyzer represents a significant advancement in spatial biology, enabling interactive visualization and quantification of cellular distributions within the TME [32]. This Python-based graphical user interface processes multiplexed immunofluorescence images to extract critical spatial metrics, including immune cell densities and intercellular distances.
Experimental Workflow for Spatial TME Analysis:
Application and Validation: The TME-Analyzer has been benchmarked against established platforms like inForm and QuPath, demonstrating high concordance (<20% root mean square error) for quantifying immune cell densities and spatial distributions [32]. In triple-negative breast cancer, this tool identified a 10-parameter classifier based predominantly on cellular distances that significantly predicted overall survival [32].
Extracellular Vesicle Isolation and Characterization
Studying EV-mediated communication in the TME requires specialized methodologies, particularly under conditions of hypoxia and acidity.
Protocol for EV Analysis in Acidic/Hypoxic TME:
- Culture Conditions: Expose tumor cells to hypoxia (0.5-1.5% O₂) and acidic pH (6.5-6.8) using specialized incubator systems for 24-72 hours [29].
- EV Isolation: Collect conditioned media and isolate EVs using differential ultracentrifugation, density gradient centrifugation, or size-exclusion chromatography [29].
- EV Characterization:
- Size and Concentration: Nanoparticle tracking analysis (e.g., Nanosight) to determine EV size distribution and concentration.
- Protein Markers: Western blot analysis for tetraspanins (CD9, CD63, CD81), ESCRT components (Alix, TSG101), and Syntenin-1 [29].
- Cargo Analysis: RNA sequencing for miRNA/content, proteomic analysis for protein cargo.
- Functional Assays: Treat recipient cells with isolated EVs and assess phenotypic changes including migration, invasion, and gene expression profiling.
The Scientist's Toolkit: Essential Research Reagents
Table 3: Key Research Reagents for TME Investigation
| Reagent/Category | Specific Examples | Function/Application |
|---|---|---|
| Hypoxia Chamber | Coy Laboratory Products, BioSpherix | Creates low-oxygen environments for cell culture |
| pH Modulators | Carbonic anhydrase inhibitors, V-ATPase inhibitors, MCT inhibitors | Modulate extracellular and intracellular pH [28] |
| EV Isolation Kits | Total Exosome Isolation Kit, qEV size-exclusion columns | Isolate EVs from conditioned media or biological fluids |
| Spatial Analysis Software | TME-Analyzer, inForm, QuPath | Quantify spatial distribution of immune and tumor cells [32] |
| Metabolic Assays | Seahorse XF Glycolysis Stress Test, lactate assays | Measure glycolytic flux and lactate production |
| ECM Remodeling Assays | MMP activity assays, collagen contraction assays, 3D invasion assays | Evaluate protease activity and cell invasion through ECM |
| Acidity Probes | pHLIP, SNARF-1 | Measure intracellular and extracellular pH in live cells |
Therapeutic Targeting of the TME
Therapeutically exploiting TME vulnerabilities represents a promising frontier in cancer treatment. Current strategies focus on neutralizing the protumorigenic effects of hypoxia, acidity, and ECM remodeling.
Targeting Tumor Acidity
Several classes of inhibitors targeting acid-regulating proteins are under investigation:
- Carbonic Anhydrase (CA) Inhibitors: Block conversion of CO₂ and H₂O to HCO₃⁻ and H⁺, reducing proton availability [28].
- Monocarboxylic Acid Transporter (MCT) Inhibitors: Prevent lactate export, disrupting pH homeostasis and inducing intracellular acidosis [28].
- V-ATPase Inhibitors: Disrupt proton pumping across membranes, particularly effective in combination with chemotherapy [28].
- NHE Inhibitors: Block sodium-hydrogen exchange, a key mechanism for pH regulation in cancer cells [28].
Despite promising preclinical results, only proton pump inhibitors targeting V-ATPase have reached clinical application, highlighting the need for more specific agents and predictive biomarkers [28].
ECM-Targeted Therapies
ECM-directed approaches aim to normalize the tumor matrix to improve drug delivery and immune cell infiltration:
- Enzyme-Based Strategies: Hyaluronidase (PEGPH20) degrades hyaluronic acid to reduce interstitial pressure and improve vascular perfusion [30].
- MMP Inhibitors: Earlier generations failed clinically due to lack of specificity and toxicity; newer agents target specific MMPs with higher precision [30].
- LOXL2 Inhibitors: Target lysyl oxidase-like 2, which cross-links collagen and increases matrix stiffness [30].
- Integrin Antagonists: Block mechanosensing pathways that promote survival signaling in tumor cells [30].
These strategies are most effective when combined with conventional therapies or immunotherapy, as ECM normalization can enhance drug penetration and restore anti-tumor immunity [30].
The tumor microenvironment, characterized by hypoxia, acidity, and extensive ECM remodeling, is a key determinant of metastatic competence. These interconnected features create a self-reinforcing cycle that promotes immune evasion, therapeutic resistance, and metastatic dissemination. Understanding the molecular mechanisms driving these processes provides critical insights for developing novel therapeutic interventions.
Future research directions should focus on spatiotemporal dynamics of TME evolution, improving preclinical models to better recapitulate human TME complexity, and developing highly specific agents that target pathological aspects of the TME while preserving physiological functions. Combining TME-targeting strategies with conventional therapies and immunotherapies represents the most promising approach to overcome therapeutic resistance and prevent metastatic progression.
Disseminated Tumor Cells (DTCs) represent a critical component of Minimal Residual Disease (MRD) and are responsible for metastatic relapse in solid tumors years after initial treatment. These cells, which have disseminated from the primary tumor to distant sites such as bone marrow, exhibit unique biological properties including dormancy, therapy resistance, and phenotypic plasticity that allow them to evade conventional treatments. This technical review examines the molecular mechanisms underlying DTC persistence, current methodologies for detection and characterization, and emerging therapeutic strategies targeting these elusive cells. Understanding DTC biology is paramount for developing effective interventions to prevent metastatic recurrence and improve long-term survival for cancer patients.
Despite complete surgical resection of primary tumors and administration of adjuvant therapy, a significant proportion of cancer patients experience metastatic recurrence, often after extended disease-free intervals. This clinical observation points to the presence of occult residual disease that persists below the detection threshold of conventional imaging techniques. MRD encompasses DTCs found in distant organs like bone marrow and Circulating Tumor Cells (CTCs) in peripheral blood [33] [34].
The prognostic significance of DTCs is well-established, particularly in breast cancer where their detection in bone marrow at diagnosis independently predicts poor clinical outcome (Level 1 evidence) [34]. Approximately 30-40% of primary breast cancer patients present with DTCs in bone marrow, and these patients have significantly worse survival compared to DTC-negative patients [34]. Similar findings have been reported across various solid tumors, underscoring the fundamental role of DTCs in the metastatic cascade.
Table 1: Clinical Significance of DTC Detection in Solid Tumors
| Cancer Type | DTC Detection Rate | Prognostic Impact | References |
|---|---|---|---|
| Breast Cancer | 30-40% at diagnosis | Reduced DFS and OS; HR 2.0 | [34] |
| Triple-Negative Breast Cancer | 56% (45/80 patients) | Associated with lack of pCR after NACT | [35] |
| Various Epithelial Cancers | 13-99% (method-dependent) | Shorter progression-free survival | [36] |
Biological Foundations of DTC Persistence
The Metastatic Cascade: From Primary Tumor to Dormant DTCs
The establishment of MRD begins with tumor cell dissemination through a multi-step process known as the metastatic cascade. CTCs detach from the primary tumor, intravasate into circulation, endure shear stress and immune surveillance in the bloodstream, and extravasate into distant tissues where they become DTCs [37] [2]. These DTCs may then enter a dormant state, persisting for years before potentially awakening to form overt metastases.
Figure 1: The Metastatic Cascade from Primary Tumor to Overt Metastasis
Molecular Mechanisms of DTC Dormancy and Survival
DTCs employ several sophisticated biological strategies to survive in hostile microenvironments and resist therapeutic interventions:
Dormancy Programs: DTCs frequently exit the cell cycle (G0 phase) and display low proliferation markers like Ki-67, enabling them to resist antiproliferative therapies [37] [34]. This quiescent state is actively maintained by signaling from the bone marrow microenvironment.
Epithelial-Mesenchymal Transition (EMT): DTCs often undergo EMT, losing epithelial markers like E-cadherin and gaining mesenchymal markers such as vimentin. This transition enhances mobility, invasiveness, and resistance to anoikis [35] [37]. Importantly, EMT exists along a spectrum rather than as a binary switch, with hybrid E/M states potentially possessing the highest metastatic potential [37].
Metabolic Adaptations: DTCs exhibit unique metabolic profiles, often relying on monocarboxylate transporter 1 (MCT1) for lactate uptake to manage oxidative stress [2]. Hypoxia-inducible factors (HIFs) allow adaptation to low-oxygen environments in bone marrow niches.
Immune Evasion: DTCs demonstrate reduced expression of MHC class I molecules, limiting their recognition by T-cells [34]. They may also recruit immunosuppressive cells or exploit immune checkpoint molecules like PD-L1 [35].
Table 2: Characteristic Molecular Features of DTCs
| Biological Feature | Molecular Markers | Functional Significance | Therapeutic Implications |
|---|---|---|---|
| Dormancy | Low Ki-67, p27, p21 | Cell cycle arrest, therapy resistance | Need for cycling-cell independent approaches |
| EMT/Mesenchymal State | Vimentin+, N-cadherin+, TWIST, SLUG | Enhanced motility, invasion | Marker-dependent detection challenges |
| Stemness | CD44+, CD24-, ALDH1 | Self-renewal capacity, plasticity | Target stemness signaling pathways |
| Metabolic Adaptation | MCT1, HIF-1α, HIF-2α | Survival in hypoxic niches | Metabolic inhibitors |
| Immune Evasion | Reduced MHC-I, PD-L1+ | Avoidance of immune surveillance | Immune checkpoint inhibitors |
Detection and Characterization Methodologies
DTC Enrichment and Detection Platforms
The rarity of DTCs (approximately 1 per 10^6-10^8 bone marrow cells) necessitates highly sensitive detection methods [33] [34]. Current approaches typically combine enrichment strategies with sophisticated detection assays.
Enrichment Techniques:
- Density Gradient Centrifugation: Separates mononuclear cells from other blood components based on density [33] [34].
- Immunomagnetic Selection: Uses antibodies against epithelial markers (e.g., EpCAM, cytokeratins) for positive selection or leukocyte markers (e.g., CD45) for negative selection [33].
- Microfluidic Platforms: CTC-chip and similar technologies use antibody-coated microposts or size-based sorting under controlled laminar flow conditions [36] [33].
Detection Methods:
- Immunocytochemistry/Fluorescence: Antibody-based detection of epithelial (cytokeratin, EpCAM) and tissue-specific markers, allowing morphological assessment [35] [34].
- Nucleic Acid-Based Assays: RT-PCR targeting epithelial or tissue-specific mRNA transcripts (e.g., CK19, mammaglobin, HER2) [33] [34].
- Multi-parameter Analysis: Advanced staining protocols enabling simultaneous assessment of multiple markers on single DTCs [35].
Experimental Protocol: Multi-parameter DTC Characterization
A recent study on Triple-Negative Breast Cancer (TNBC) exemplifies contemporary DTC analysis methodology [35]:
Sample Collection and Preparation:
- Obtain bone marrow aspirates from bilateral anterior iliac crest during surgical tumor resection
- Process using density gradient centrifugation to isolate mononuclear cells
- Transfer cell suspensions onto glass slides (1×10^6 cells per slide) via cytospin centrifugation
- Fix with ice-cold methanol and store at 4°C until staining
Multi-parameter Immunofluorescence Staining:
- Apply sequential staining protocol targeting:
- Pan-cytokeratin (Pan-CK) as epithelial marker
- Vimentin (Vim) as EMT marker
- Ki67 as proliferation marker
- HER2 and PD-L1 as therapy-related markers
- Include appropriate controls for staining specificity
- Image using automated microscopy systems
DTC Identification and Enumeration:
- Screen slides for cytokeratin-positive (CK+) and cytokeratin-negative (CK-) cells
- Apply morphological criteria to distinguish DTCs from hematopoietic cells
- Classify DTCs into subpopulations based on marker expression profiles
- Validate findings by two independent observers to minimize false positives
This approach revealed 20 different DTC subpopulations in TNBC patients, with the CK+Vim+Ki67+ profile being most frequent (n=75 cells) [35]. Notably, CK- DTCs were significantly correlated with PD-L1 and HER2 positivity, suggesting distinct biological subsets with potential clinical relevance.
The Scientist's Toolkit: Essential Research Reagents
Table 3: Key Reagents for DTC Research
| Reagent/Category | Specific Examples | Application/Function | Technical Notes |
|---|---|---|---|
| Enrichment Antibodies | Anti-EpCAM, Anti-MUC1 | Immunomagnetic separation of epithelial cells | Efficiency varies by tumor type |
| Detection Antibodies | Pan-cytokeratin, Vimentin, HER2, PD-L1 | DTC identification and phenotyping | Multi-parameter staining enables subpopulation analysis |
| Nuclear Stains | DAPI (4',6-diamidino-2-phenylindole) | Nuclear counterstain for cell identification | Essential for confirming cell integrity |
| Exclusion Markers | CD45 (leukocyte common antigen) | Hematopoietic cell exclusion | Critical for specificity |
| Nucleic Acid Assays | CK19, MGB1, HER2, EpCAM mRNA | RT-PCR-based DTC detection | High sensitivity but potential false positives |
| Commercial Platforms | CellSearch, AdnaTest BreastCancer | Standardized DTC/CTC detection | FDA-approved for prognostic use in metastatic cancer |
Signaling Pathways Governing DTC Biology
Multiple interconnected signaling pathways regulate critical DTC behaviors including survival, dormancy, and reactivation.
Figure 2: Key Signaling Pathways Regulating DTC Fate and Behavior
The bone marrow microenvironment plays a crucial role in maintaining DTCs through several mechanisms:
TGF-β Signaling: Secreted by platelets and stromal cells, TGF-β activates SMAD pathways in DTCs to promote and sustain EMT phenotypes, enhancing metastatic potential [37].
NOTCH Pathway: Polymorphonuclear myeloid-derived suppressor cells (PMN-MDSCs) form heterotypic clusters with DTCs, engaging Jagged1-NOTCH1 interactions that promote survival and stemness [37].
WNT/β-catenin Signaling: Particularly important in bone metastasis, WNT activation drives mesenchymal-epithelial transition (MET) and proliferation during metastatic outgrowth [2].
Hypoxia-Inducible Factors (HIFs): Activated in hypoxic bone marrow niches, HIFs regulate adaptation to low oxygen, promote dormancy, and enhance therapy resistance [2].
Clinical Translation and Therapeutic Targeting
MRD Detection in Clinical Trials
Liquid biopsy-based MRD detection has become a central biomarker in clinical trials, particularly using circulating tumor DNA (ctDNA) analysis [38]. Both tumor-informed (e.g., Signatera, RaDaR) and tumor-naïve (e.g., Guardant Reveal) approaches are being evaluated for their ability to identify high-risk patients who might benefit from treatment intensification.
In non-small cell lung cancer (NSCLC), MRD status has been incorporated into randomized clinical trials as a stratification and predictive biomarker [38]. Similar efforts are underway in breast cancer and other solid tumors, with the goal of using MRD detection to guide adjuvant therapy decisions.
Emerging Therapeutic Strategies
Current research focuses on several promising approaches to target DTCs and prevent metastatic recurrence:
Dormancy Disruption: Therapeutic awakening of dormant DTCs could render them vulnerable to conventional therapies, though this approach requires careful timing and combination strategies.
Immune Targeting: Since DTCs often express PD-L1 [35], immune checkpoint inhibitors may help eliminate these cells, particularly when combined with other modalities.
HER2-Targeted Therapy: The frequent HER2 positivity of DTCs in HER2-negative primary tumors [34] suggests potential benefit from HER2-targeted agents in selected patients based on DTC profiling.
Microenvironment Modulation: Targeting the protective bone marrow niche through bisphosphonates or other microenvironment-disrupting agents may sensitize DTCs to elimination.
DTCs represent the cellular mediators of MRD and constitute a major therapeutic challenge in oncology. Their biological properties—including dormancy, phenotypic plasticity, and adaptive signaling—enable these seeds of relapse to persist despite aggressive multimodality therapy. Advances in detection technologies now allow unprecedented characterization of DTC heterogeneity at the single-cell level, revealing distinct subpopulations with varying metastatic potential and therapeutic vulnerabilities.
Future progress will require integrated approaches combining sophisticated DTC detection with mechanistic studies of dormancy regulation and innovative therapeutic strategies. Clinical trials incorporating DTC analysis as biomarkers for patient stratification and treatment guidance are essential to translate biological insights into improved outcomes. Ultimately, targeting the fundamental biology of DTCs offers the promise of preventing metastatic recurrence and transforming cancer into a consistently curable disease.
Advanced Experimental Models and Therapeutic Targeting Strategies
Cancer metastasis, a multi-step process where cancer cells disseminate from the primary tumor to colonize distant organs, remains the principal cause of cancer-related mortality [39]. Understanding the initial invasion of cancer cells into the surrounding stroma is critical for developing strategies to prevent metastatic spread. For decades, conventional two-dimensional (2D) cell culture has been the cornerstone of in vitro cancer research. However, its limitations are now starkly apparent; cells grown as flat monolayers on plastic surfaces cannot mimic the three-dimensional architecture, cell-ECM interactions, and metabolic gradients characteristic of in vivo tumors [40] [41]. This oversimplification results in misleading data, particularly concerning cell migration, invasion, and drug response, with an estimated 95% of anticancer drugs failing in clinical trials due in part to these inadequate preclinical models [42].
The transition to three-dimensional (3D) in vitro models represents a paradigm shift in cancer research, bridging the gap between 2D cultures and animal models. These advanced systems—including spheroids, organoids, and microfluidic platforms—recapitulate the tumor microenvironment's complexity, enabling the study of invasion within a physiologically relevant context [43] [44]. This technical guide details the establishment, application, and analysis of these 3D models, framing them within the broader thesis of unraveling the biological processes driving metastasis in solid tumors. By providing researchers with robust, standardized protocols and analytical frameworks, we aim to accelerate the development of therapeutic interventions that can effectively halt cancer invasion and metastasis.
The 3D Model Arsenal: Spheroids, Organoids, and Microfluidic Systems
The term "3D cell culture" encompasses several distinct technologies, each with unique advantages, limitations, and applications. The following table provides a comparative overview of the primary models used in invasion studies.
Table 1: Comparison of 3D Models for Cancer Invasion Research
| Feature | Spheroids | Organoids | Microfluidic Systems (Organoids-on-Chip) |
|---|---|---|---|
| Definition & Cellular Source | Spherical aggregates of cell lines, primary cells, or multicellular mixtures; form via self-assembly [43] [40]. | 3D structures that self-organize and differentiate to mimic organ/tumor histology; derived from adult stem cells, induced pluripotent stem cells, or tumor tissues [43] [39]. | Micro-engineered devices that integrate spheroids/organoids with continuous perfusion to mimic dynamic TME [43] [45]. |
| Key Advantages | Simple, cost-effective; mimic nutrient/oxygen gradients and cell-cell interactions; suitable for high-throughput screening [43] [44]. | Retain patient-specific tumor heterogeneity, genetics, and histology; suitable for biobanking and personalized medicine [43] [39]. | Precise control over biochemical/physical gradients (flow, shear stress); model intravasation/extravasation; enable real-time imaging [39] [45]. |
| Limitations for Invasion Studies | Limited histological complexity; may not fully recapitulate the native TME and ECM [43]. | Access to patient tissue required; may lose immune/stromal cells in long-term culture; methods can lack standardization [39]. | Technically complex; low-to-medium throughput; unified analytical tools are still developing [43] [45]. |
| Primary Applications in Invasion/Metastasis | Studying collective cell migration, EMT, and drug penetration [46]. | Modeling patient-specific invasion pathways, drug screening for personalized therapy [39]. | Dissecting the roles of fluid shear stress and endothelial barriers in intravasation and extravasation [39] [45]. |
Tumor Spheroids: Structural and Functional Mimicry of Early Tumors
Spheroids are arguably the most accessible entry point into 3D culture. Their structure recapitulates key pathophysiological features of early, avascular tumors. A hallmark of spheroids is their spatial organization into three distinct zones: an outer layer of proliferating cells, an intermediate layer of quiescent cells, and a central core of necrotic cells resulting from hypoxic and acidic conditions [40] [46]. This organization creates gradients of nutrients, oxygen, and pH, which drive invasive behavior and confer resistance to chemo- and radiotherapy [40] [46].
Spheroids can be broadly classified as scaffold-based or scaffold-free. Scaffold-free methods are popular for their simplicity and include techniques like the hanging drop method, ultra-low attachment plates, and pellet culture, all of which promote cell-cell adhesion and spontaneous aggregation [40] [47]. Scaffold-based methods utilize natural (e.g., Matrigel, collagen) or synthetic hydrogels to provide a biomimetic ECM that supports more complex cell-matrix interactions critical for invasion [41].
Patient-Derived Organoids: Personalized Avatars for Metastatic Research
Organoid technology represents a significant leap forward. Patient-derived organoids (PDOs) are established directly from patient tumor biopsies and, when cultured in 3D matrices with specific growth factor cocktails, self-organize into structures that histologically and genetically resemble the original tumor [43] [39]. This fidelity makes them invaluable for studying the cellular and molecular drivers of invasion unique to individual patients. For instance, PDOs derived from metastatic colorectal cancer have revealed that metastatic cells exhibit greater cell-intrinsic plasticity than their primary tumor counterparts, enabling them to adopt unique transcriptional programs that facilitate invasion and colonization [39].
A key application of PDOs is in co-culture systems where they are combined with autologous immune cells, cancer-associated fibroblasts (CAFs), or other stromal components to reconstitute a more complete TME. This allows for the investigation of tumor-stroma crosstalk that is essential for invasion [39] [42].
Microfluidic Platforms: Controlling the Dynamic Microenvironment
Microfluidic devices, often referred to as "Organs-on-Chip," integrate 3D models with microscale fluidics to emulate the dynamic aspects of the TME that are impossible to capture in static cultures [43] [45]. These platforms allow researchers to apply physiological flow rates and wall shear stresses, which are critical for modeling the intravasation and extravasation steps of metastasis [39].
Innovative platforms like the ReSCUE microfluidic system further enhance these capabilities by enabling the generation and recovery of patient-derived organoids with defined, non-spherical shapes. This is crucial because research indicates that organoid shape directly influences collective cancer cell invasion, with proliferative cells preferentially locating at high-curvature regions [45]. These systems can be designed to model specific biological barriers, such as the blood-brain barrier, by co-culturing endothelial cells, pericytes, and astrocytes, thereby providing unprecedented insight into the organ-specific nature of extravasation [39].
Modeling Invasion: Key Applications and Biological Insights
Recapitulating the Steps of the Metastatic Cascade
The metastatic cascade is a multi-step process, and 3D models are uniquely equipped to dissect its individual components, particularly the early stages of local invasion.
- Invasion and Migration: Spheroids and organoids can be embedded in 3D ECM hydrogels (e.g., collagen, Matrigel) to study their invasive potential. In this assay, cancer cells at the spheroid periphery undergo epithelial-to-mesenchymal transition (EMT), adopt a migratory phenotype, and collectively invade the surrounding matrix, forming protrusions [46]. This process is driven by complex signaling between cancer cells and stromal components.
- Intravasation and Extravasation: Microfluidic devices excel at modeling these critical steps. These systems can incorporate a perfused endothelial layer, allowing researchers to observe and quantify how cancer cells transmigrate through the vascular wall in response to chemotactic gradients or physical forces [39].
- Collective Cell Invasion: The ReSCUE platform has demonstrated that the geometry of the tumor mass dictates the pattern of collective invasion. Cells tend to collectively stream from regions of high positive curvature, providing direct evidence that the macroscopic shape of a tumor can orchestrate its microscopic invasive behavior [45].
Signaling Pathways Driving Invasion in 3D Cultures
The biochemical and biophysical cues from the 3D TME activate a network of signaling pathways that drive invasion. The following diagram synthesizes the key signaling interactions between tumor cells and the TME that promote invasion, as elucidated through 3D co-culture studies.
Diagram Title: TME-Driven Pro-Invasive Signaling Network
This interplay of pathways, which can only be fully observed in 3D co-culture systems, highlights that invasion is not a cell-autonomous process but is critically dependent on the dynamic crosstalk between malignant and stromal cells within the TME.
The Scientist's Toolkit: Reagents and Protocols
Research Reagent Solutions for 3D Invasion Studies
Table 2: Essential Reagents and Materials for 3D Invasion Models
| Category & Item | Function in Invasion Studies | Example Application |
|---|---|---|
| Basement Membrane Matrix | Provides a physiologically relevant 3D scaffold for cell invasion; contains ECM proteins like laminin and collagen. | Used to embed spheroids for invasion assays; serves as a substrate for organoid growth and invasion [40] [41]. |
| Natural Hydrogels (e.g., Collagen I) | Tunable, defined 3D matrix that allows for study of cell-matrix interactions and proteolytic invasion. | Adjustable stiffness to study impact of mechanical cues on invasion; used in microfluidic devices to create invasion channels [41] [46]. |
| Synthetic Hydrogels | Defined, reproducible matrices with controllable biochemical and mechanical properties. | Used in scaffold-based 3D cultures to study specific integrin-ligand interactions during invasion [41]. |
| Aldehyde-functionalized Cellulose Nanocrystals (a-CNCs) | Forms a supportive microgel for molding and maintaining defined organoid shapes in microfluidic devices. | Key component in the ReSCUE platform to generate non-spherical organoids for shape-dependent invasion studies [45]. |
| EMT Antibody Panel | Detects expression of epithelial (E-cadherin) and mesenchymal (Vimentin, N-cadherin) markers. | Immunofluorescence staining of invasive cells in 3D cultures to confirm EMT activation [46]. |
| Cytokine Cocktails | To supplement co-cultures and recruit or activate stromal cells (e.g., CAFs, immune cells). | Studying paracrine signaling between tumor and stromal cells that drives collective invasion [42] [46]. |
Detailed Experimental Protocols
Protocol 1: Scaffold-Free Spheroid Formation Using Ultra-Low Attachment Plates
This is a robust and simple method for generating uniform spheroids for invasion and drug screening assays [40] [47].
- Cell Preparation: Harvest and count cells. Prepare a single-cell suspension at a pre-optimized density (e.g., 1,000 - 10,000 cells per well, depending on cell type and desired spheroid size) in complete growth medium.
- Seeding: Gently pipet the cell suspension into the wells of a round-bottom ultra-low attachment (ULA) microplate. Avoid creating bubbles.
- Centrifugation: Centrifuge the plate at a low speed (e.g., 300-500 x g for 3-5 minutes) to aggregate cells at the bottom of each well.
- Culture: Incubate the plate for 48-96 hours. Spheroids should form compact, spherical structures within this period.
- Quality Control: Visually inspect spheroid morphology and uniformity using an inverted microscope before proceeding to invasion assays.
Protocol 2: Spheroid-Based 3D Invasion Assay
This protocol assesses the invasive potential of cancer cells from a pre-formed spheroid into a surrounding ECM [46].
- ECM Preparation: Thaw Basement Membrane Extract (BME) or Collagen I solution on ice. Keep all tips and tubes pre-cooled.
- Spheroid Harvest: Using a wide-bore tip, carefully transfer pre-formed spheroids from the ULA plate to a microcentrifuge tube. Let spheroids settle by gravity or gentle centrifugation.
- ECM Embedding: Aspirate most of the medium. Gently resuspend the spheroid pellet in the chilled ECM solution. Pipet a drop (e.g., 50 µL) of the spheroid-ECM mixture into the center of a well in a pre-warmed 96-well plate. Avoid bubbles.
- Polymerization: Place the plate in a 37°C incubator for 15-30 minutes to allow the ECM to polymerize and form a gel.
- Overlay with Medium: Once polymerized, carefully overlay the gel with complete culture medium.
- Imaging and Quantification: Image the spheroids immediately (Day 0) using a brightfield or confocal microscope. Return the plate to the incubator and acquire images at regular intervals (e.g., 24, 48, 72 hours). Quantify invasion by measuring the area of cell outgrowth from the spheroid core using image analysis software (e.g., ImageJ). The invasive index is often calculated as (Area at T=final - Area at T=0) / Area at T=0.
Protocol 3: Establishing a Microfluidic Model of Extravasation
This outlines the workflow for creating a complex microfluidic model to study tumor cell extravasation, a key step in metastasis [39] [45].
- Device Priming: Introduce a PBS buffer into the microfluidic channels of the device to remove air bubbles and prime the system.
- Endothelial Tubule Formation: Seed human umbilical vein endothelial cells (HUVECs) or other endothelial cells into the device's vascular channel. Under physiological flow conditions, the cells will form a confluent, lumenized endothelial tubule.
- Introduction of Tumor Cells: Once the endothelial barrier is established, introduce fluorescently labeled tumor cells (as single cells or pre-formed spheroids) into the vascular channel via perfusion. Allow cells to adhere to the endothelium.
- Extravasation Assay: Continue perfusion with medium. Monitor the device in real-time using live-cell imaging to track the transmigration of tumor cells through the endothelial layer and into the surrounding ECM matrix (e.g., collagen) of the adjacent tissue chamber.
- Endpoint Analysis: After a set period (e.g., 24-48 hours), fix and stain the device for confocal imaging. Analyze for markers of endothelial junction integrity (VE-Cadherin) and tumor cell invasion (F-actin). Quantify extravasation efficiency by counting the number of cells that have fully crossed the endothelial barrier.
The adoption of 3D spheroid, organoid, and microfluidic models marks a transformative period in cancer research. By faithfully recapitulating the physicochemical and biological complexities of the TME, these platforms provide unprecedented physiological relevance for studying the fundamental process of cancer invasion. They have moved the field beyond the oversimplified 2D paradigm, enabling the discovery of novel, clinically pertinent insights into the mechanisms of metastasis, from the role of tumor geometry in collective invasion to the dynamics of circulating tumor cell extravasation.
The integration of these technologies—for instance, by cultivating patient-derived organoids within advanced microfluidic chips—heralds the future of personalized oncology. These integrated systems promise to generate highly predictive avatars of a patient's disease, enabling high-throughput functional drug screening and the discovery of personalized therapeutic vulnerabilities. As standardization and accessibility improve, these 3D models are poised to become indispensable tools, not only in academic research but also within industrial drug development pipelines, ultimately accelerating the delivery of effective anti-metastatic therapies to patients.
Metastasis, the spread of cancer cells from a primary tumor to distant organs, accounts for approximately 90% of cancer-related deaths, representing the central challenge in oncology [48] [49]. This biological process is a highly complex, multi-step cascade wherein cancer cells must invade surrounding tissue, intravasate into the circulatory system, survive transport, extravasate at distant sites, and proliferate in new microenvironments—all while evading immune detection and adapting to foreign tissue conditions [39] [49]. Despite decades of progress in treating primary tumors, metastatic disease remains largely incurable with current therapeutic modalities, creating a critical unmet need for more effective interventions [48] [50].
Within this context, representative preclinical models that faithfully mimic human cancer biology and metastatic progression are essential for improving treatment efficacy and patient prognosis [51]. In vivo models provide indispensable platforms for studying the full complexity of the metastatic process, including dynamic interactions between tumor cells, stromal components, and immune populations that cannot be fully recapitulated in vitro [52]. This technical guide examines three cornerstone in vivo approaches in contemporary metastasis research: Patient-Derived Xenograft (PDX) models, Genetically Engineered Mouse Models (GEMMs), and humanized models, focusing on their respective applications, methodological considerations, and integration into the broader framework of metastasis biology and therapeutic development.
Model Systems: Technological Foundations and Applications
Patient-Derived Xenograft (PDX) Models
PDX models are established by directly implanting fresh tumor tissue from patients into immunocompromised mice, preserving key biological characteristics of the original malignancy [53]. These models have demonstrated significant superiority over traditional cell line models in maintaining the gene expression profiles, histopathological features, intratumor heterogeneity, and drug response patterns of patient tumors [51] [53].
Establishment Protocol: The standard workflow for PDX generation involves several critical phases [53]:
- Tissue Acquisition & Processing: Fresh tumor tissues from surgical resection or biopsy are collected in transport media and processed within short timeframes (typically <1 hour). Tissues are cut into fragments approximately 2-3 mm in diameter using sterile techniques, preserving tissue architecture.
- Implantation: Fragments are implanted into recipient mice using one of three primary approaches:
- Subcutaneous (s.c.) implantation: Injection into the flank; technically straightforward and enables easy monitoring.
- Orthotopic (ortho) implantation: Engraftment into the anatomically corresponding organ (e.g., mammary fat pad for breast cancer, hepatic parenchyma for liver cancer); requires advanced surgical techniques but better recapitulates the native tumor microenvironment.
- Alternative sites: Intracapsular fat pad, anterior eye chamber, or renal capsule for specialized applications.
- Engraftment & Propagation: Successful engraftment typically requires 1-6 months. Upon reaching 1-2 cm³ (first generation, F1), tumors are harvested, segmented, and reimplanted for passage to expand the model. Engraftment rates vary significantly by cancer type, with stabilization of growth kinetics typically occurring by 3-5 passages.
Strengths and Limitations in Metastasis Research: PDX models excel in preserving tumor heterogeneity and clinical relevance, making them particularly valuable for drug screening and biomarker discovery [51] [53]. However, their utility in metastasis studies depends critically on implantation site. While orthotopic PDX models can recapitulate metastatic spread to specific organs, subcutaneous models rarely metastasize, limiting their application for studying later stages of the metastatic cascade [54]. Additional limitations include the absence of a fully functional human immune system in conventional PDX models and potential for gradual molecular drift during serial passaging [53].
Table 1: Comparison of Implantation Methods in PDX Models
| Parameter | Subcutaneous Implantation | Orthotopic Implantation |
|---|---|---|
| Technical Difficulty | Low; minimal surgical skill required | High; requires microsurgical expertise |
| Tumor Monitoring | Straightforward via caliper measurements | Often requires advanced imaging technologies |
| Metastatic Potential | Limited; rarely spontaneous metastasis | Preserved; can recapitulate organ-specific metastasis |
| Stromal Recruitment | Mouse-derived, non-tissue-specific | Mouse-derived but tissue-specific |
| Throughput | High; suitable for drug screening | Lower; limited by technical complexity |
| Stromal Gene Expression | Non-specific profile | Reflects native tissue microenvironment [54] |
| Tumor Gene Expression | Highly conserved compared to orthotopic [54] | Highly conserved compared to subcutaneous [54] |
Genetically Engineered Mouse Models (GEMMs)
GEMMs are immune-competent models that develop cancer spontaneously through defined genetic alterations, enabling study of metastasis from the earliest stages of tumor initiation within an intact microenvironment [39] [52]. These models leverage technologies including Cre-loxP systems, tetracycline-inducible promoters, and viral vector delivery to control the timing, tissue specificity, and combinatorial nature of oncogene activation and tumor suppressor inactivation.
Applications in Metastasis Research: GEMMs provide unparalleled opportunities to investigate the cellular and molecular events throughout the metastatic cascade in an immunologically intact context [39]. Researchers can trace metastatic evolution from initial transformation through dissemination and colonization of distant sites, studying both cell-autonomous and non-autonomous mechanisms. For example, Ren and colleagues utilize GEMMs of breast cancer to investigate how the lung microenvironment ("soil") influences the seeding and survival of metastatic cancer cells ("seeds") by focusing on stromal and immune cell interactions that enable tumor cell colonization [52].
Limitations and Considerations: While GEMMs offer physiological relevance, most tumorigenic GEMMs do not reliably generate metastasis, and the spectrum of organs affected is often limited compared to human disease [39]. For instance, few GEMMs reliably develop brain metastases, creating a significant gap in modeling neurotropic spread [39]. Additionally, the stochastic nature of tumor development in some GEMMs can introduce variability that complicates experimental design and interpretation.
Humanized Mouse Models
Humanized models are created by engrafting human immune cells or tissues into immunocompromised mice, thereby reconstituting a human immune system that can interact with co-engrafted human tumors [53]. These models address a critical limitation of conventional PDX systems—the absence of human immune components—enabling evaluation of immunotherapies and investigation of immune-mediated mechanisms in metastasis.
Establishment Approaches: Two primary methodologies exist for humanization:
- Peripheral blood lymphocyte (PBL) model: Injection of human peripheral blood mononuclear cells (PBMCs) into mice.
- Human bone marrow-liver-thymus (BLT) model: Co-implantation of human fetal liver and thymus tissue followed by hematopoietic stem cell transplantation.
When combined with PDX tumors (creating "avatar" or clinical trial-in-a-mouse" platforms), these models allow for preclinical evaluation of immunotherapy response and investigation of tumor-immune interactions throughout the metastatic process [53].
Utility in Metastasis Research: Humanized models enable study of how human immune cells influence various stages of metastasis, from initial dissemination through dormant micrometastasis and eventual outgrowth [39]. They are particularly valuable for evaluating immunotherapies including immune checkpoint inhibitors, CAR-T cells, and bispecific antibodies in a context that more closely mirrors human immunobiology. Despite being labor-intensive and technically challenging, these models are increasingly recognized as essential for advancing immunotherapy research for metastatic disease [39].
The Scientist's Toolkit: Essential Research Reagents
Table 2: Key Reagents for Advanced In Vivo Cancer Modeling
| Reagent/Category | Specific Examples | Research Application |
|---|---|---|
| Immunodeficient Mouse Strains | NOD/SCID, NSG, NOG, BALB/c nude | Host for PDX engraftment and humanized system generation [53] |
| CRISPR Components | Cas9 mRNA, guide RNAs, HDR templates, base editors | Genetic engineering of cell lines and organoids; in vivo screens [55] |
| Stem Cell & Organoid Culture Media | Matrigel, specialized growth factor cocktails | Establishment and propagation of PDOs for subsequent implantation [39] |
| Lipid Nanoparticles | Formulations for mRNA/gRNA delivery | In vivo delivery of CRISPR components [56] |
| Humanization Components | CD34+ HSCs, PBMCs, fetal liver/thymus tissue | Generation of humanized mouse models with functional immune systems [53] |
| In Vivo Imaging Agents | Luciferin, fluorescent dyes, contrast agents | Longitudinal monitoring of tumor growth and metastasis [52] |
Methodological Spotlight: Core Technical Protocols
Orthotopic Implantation for Metastasis Studies
Orthotopic implantation places tumor tissue in its anatomically corresponding environment, critical for studying organ-specific metastasis [54]. The procedure varies by tumor type:
Mammary Fat Pad Implantation (Breast Cancer):
- Anesthetize mouse and make small incision in skin overlying ventral thoracic area.
- Carefully expose mammary fat pad through blunt dissection.
- Implant 2-3 mm³ tumor fragment using forceps or trocar.
- Secure fragment in place with absorbable suture if necessary.
- Reposition fat pad and close incision with wound clips or sutures.
Hepatic Parenchyma Implantation (Liver Cancer):
- Perform laparotomy under sterile conditions to expose liver.
- Create small superficial incision in left liver lobe using micro-scissors.
- Insert tumor fragment into parenchymal space.
- Secure with absorbable suture to prevent dislodgement.
- Return liver to abdominal cavity and close in two layers.
Post-operative monitoring includes regular imaging (e.g., ultrasound, bioluminescence) to track tumor growth and metastatic dissemination. This approach models the "seed and soil" hypothesis of metastasis by maintaining tissue-specific interactions [52].
CRISPR-Mediated Gene Editing in Cancer Models
CRISPR-Cas9 technology enables precise genetic manipulation in cancer models to study metastasis genes and mechanisms [55] [56]. A representative protocol for restoring chemotherapy sensitivity:
- gRNA Design: Design guide RNAs targeting mutation-specific PAM sites (e.g., targeting NRF2 R34G mutation in lung squamous cell carcinoma) [56].
- Component Delivery: Formulate CRISPR-Cas9 ribonucleoprotein complexes or mRNA/gRNAs in lipid nanoparticles.
- Tumor Treatment: Administer via intratumoral injection (dose range: 1-5 µg CRISPR components per 100 mm³ tumor volume).
- Efficiency Validation: Assess editing efficiency (typically 20-40% in vivo) via next-generation sequencing of target region.
- Functional Assessment: Evaluate phenotypic consequences through downstream analyses (e.g., RNA-seq for pathway analysis, chemotherapy challenge).
This approach demonstrates that even modest editing efficiency (20-40%) can significantly impact therapeutic response, highlighting the potential of CRISPR in reversing drug resistance mechanisms in metastatic disease [56].
Integrative Modeling: Mapping the Metastatic Cascade
The metastatic cascade represents a sequential journey that disseminated tumor cells must complete to establish secondary lesions. Different model systems offer unique advantages for studying specific stages of this process.
Figure 1: Modeling the Metastatic Cascade. Different preclinical models provide unique advantages for investigating specific stages of the metastatic process. GEMMs excel at studying initiation and dissemination, organotypic and organ-on-chip (OOC) models facilitate analysis of local invasion and extravasation, while orthotopic PDX and humanized models are valuable for investigating metastatic colonization and outgrowth.
Technical Workflow: From Model Generation to Analysis
Establishing and utilizing these advanced models requires integrated workflows that combine classical techniques with modern multi-omics approaches.
Figure 2: Integrated Preclinical Model Workflow. The synergistic application of PDX, GEMM, and humanized models creates a comprehensive platform for metastasis research and therapeutic development. Multi-omics profiling and advanced analytics enable biomarker discovery and mechanism elucidation.
The complexity of metastatic cancer necessitates a diversified modeling approach that leverages the unique strengths of PDX, GEMM, and humanized systems. PDX models excel in preserving human tumor heterogeneity and clinical relevance, GEMMs provide unparalleled insight into metastasis within immunocompetent contexts, and humanized models bridge critical gaps in immunotherapy evaluation. The integration of these platforms—complemented by advanced technologies including CRISPR screening, multi-omics profiling, and sophisticated imaging—creates a powerful arsenal for deconstructing the biological processes driving metastasis and accelerating the development of effective interventions for this ultimately lethal aspect of cancer.
Targeting EMT and Cancer Stem Cells (CSCs) with Novel Inhibitors
The metastatic cascade in solid tumors is driven by complex biological processes, chief among them Epithelial-Mesenchymal Transition (EMT) and the activity of Cancer Stem Cells (CSCs). EMT is a cellular reprogramming event where epithelial cells lose their polarity and cell-cell adhesion, gaining a mesenchymal phenotype that enhances motility, invasiveness, and resistance to apoptosis [57] [12]. CSCs constitute a minor subpopulation within tumors characterized by self-renewal capacity, differentiation potential, and inherent resistance to conventional therapies; they are primary drivers of tumor initiation, metastasis, and relapse [58] [59]. A critical mechanistic link exists between these two processes: the activation of EMT can impart stem-like properties to cancer cells, thereby expanding the CSC pool [60]. This interplay creates a formidable barrier to effective cancer treatment. Consequently, the development of novel inhibitors targeting EMT and CSCs represents a pivotal frontier in oncology, aiming to undercut the root causes of metastatic spread and therapeutic failure [57] [60].
Molecular Mechanisms and Key Signaling Pathways
The regulation of EMT and CSC maintenance is orchestrated by a network of evolutionarily conserved signaling pathways and transcription factors. Understanding this intricate circuitry is essential for developing targeted inhibitors.
Core Signaling Pathways
- TGF-β Pathway: A primary inducer of EMT, the TGF-β pathway activates transcription factors (TFs) like Snail, Slug, and ZEB1/2, leading to the repression of epithelial markers (e.g., E-cadherin) and upregulation of mesenchymal markers (e.g., N-cadherin, vimentin) [57] [61]. In the context of CSCs, TGF-β signaling promotes the maintenance of stemness and resistance [59].
- Wnt/β-catenin Pathway: In the absence of a Wnt signal, cytoplasmic β-catenin is degraded by a destruction complex. Upon Wnt activation, β-catenin stabilizes and translocates to the nucleus, forming a complex with TCF/LEF to activate target genes such as c-MYC and CYCLIN D1, thereby driving EMT and CSC self-renewal [58] [59].
- Notch Pathway: This pathway, activated via cell-cell contact, undergoes regulated intramembrane proteolysis, releasing the Notch Intracellular Domain (NICD). NICD translocates to the nucleus and associates with the CSL transcription factor, activating genes like HES and HEY that promote EMT and stemness [57] [59].
- Hedgehog (Hh) Pathway: In the active state, the Hh ligand binds to Patched (PTCH1), relieving its inhibition of Smoothened (SMO). This leads to the activation of GLI transcription factors, which regulate genes involved in CSC maintenance and EMT [59].
The following diagram illustrates the core signaling pathways regulating EMT and CSCs:
Post-Translational Regulation via Ubiquitination
The stability and activity of key EMT transcription factors are critically regulated by post-translational modifications, particularly ubiquitination. The ZEB1 protein, for instance, is controlled by the CDK4/6-USP51 axis [62]. CDK4/6 kinase activity, which is higher in sparse, migrating cells, promotes the deubiquitination and stabilization of ZEB1 by the deubiquitinase USP51. Conversely, inhibition of CDK4/6 or knockdown of USP51 leads to increased ZEB1 ubiquitination and proteasomal degradation, thereby attenuating the mesenchymal phenotype and cell migration [62]. This regulatory mechanism highlights the dynamic control of EMT and presents a promising therapeutic vulnerability.
Emerging Therapeutic Strategies and Novel Inhibitors
Targeting the dynamic and plastic nature of EMT and CSCs requires innovative approaches. Current strategies extend beyond simple pathway inhibition to include disruption of protein stability, induction of novel cell death mechanisms, and the use of novel metal-based compounds.
Table 1: Selected Novel Inhibitors Targeting EMT and CSCs
| Therapeutic Agent / Class | Molecular Target / Mechanism | Experimental Context / Cancer Type | Key Outcome(s) |
|---|---|---|---|
| CDK4/6 Inhibitors (e.g., Palbociclib) | Inhibits CDK4/6 kinase activity, disrupting USP51-mediated deubiquitination of ZEB1 [62]. | MCF10A mammary epithelial cells; MDA-MB-231 breast cancer cells [62]. | Promotes ZEB1 degradation, suppresses cell migration, and reverses EMT phenotypes [62]. |
| FSP1 Inhibitors (e.g., icFSP1) | Blocks ferroptosis suppressor protein 1 (FSP1), inhibiting a key pathway that protects cells from ferroptosis [63]. | Lung adenocarcinoma (LUAD) mouse models [63]. | Triggers ferroptotic cell death, reduces tumor growth by up to 80% [63]. |
| Ruthenium-based Complexes | Induces mitochondrial dysfunction, disrupts redox homeostasis, and blocks pro-survival signaling (e.g., NF-κB, Akt/mTOR) [64]. | Preclinical CSC models of glioblastoma, colorectal, liver, and other cancers [64]. | Selective cytotoxicity against CSCs, loss of stemness potential [64]. |
| Ubiquitin-Proteasome System Targeting | Inhibitors of specific E3 ligases or deubiquitinases (DUBs) to modulate stability of EMT-TFs and signaling nodes [65]. | Conceptual/theoretical based on mechanistic review [65]. | Reverses EMT-induced progression and chemoresistance [65]. |
Experimental Models for Validating Inhibitors
Robust experimental models are crucial for evaluating the efficacy of novel EMT and CSC inhibitors. The following workflow outlines a standard methodology for testing a candidate inhibitor, from in vitro validation to in vivo confirmation:
The Scientist's Toolkit: Essential Research Reagents and Models
Advancing research on EMT and CSCs relies on a suite of specialized reagents, assays, and experimental models.
Table 2: Key Research Reagent Solutions for EMT and CSC Investigations
| Category / Reagent | Specific Example(s) | Function / Application in Research |
|---|---|---|
| Cell Line Models | MCF10A (normal mammary epithelium), MDA-MB-231 (mesenchymal breast cancer) [62]. | Used to model EMT dynamics, test inhibitors, and study ZEB1 regulation in a controlled context [62]. |
| EMT-Inducing Factors | Recombinant TGF-β, Oncostatin M [60]. | Tools to experimentally induce EMT and study associated molecular events and cellular behaviors. |
| CSC Markers (for FACS) | Antibodies against CD44, CD133, ALDH assay kits [58] [59] [60]. | Enable isolation and enrichment of CSC subpopulations from heterogeneous tumor cell cultures for functional studies. |
| Key Assays | Boyden Chamber/Transwell assays [12], Sphere Formation Assay [60], 3D Organoid Culture [58] [12]. | Quantify cell migration/invasion, assess self-renewal capacity of CSCs, and model tumor architecture and drug response in a more physiologically relevant setting. |
| In Vivo Models | Patient-Derived Xenografts (PDX), Genetically Engineered Mouse Models (GEMMs) [12]. | Provide a physiologically relevant microenvironment to study metastasis, tumor-stroma interactions, and therapeutic efficacy in vivo. |
The concurrent targeting of EMT and CSCs presents a powerful strategy to combat metastasis and therapy resistance in solid tumors. The current research landscape is moving beyond broad-pathway inhibition towards more nuanced strategies, including targeting protein stability via the ubiquitin-proteasome system [62] [65], inducing novel cell death mechanisms like ferroptosis [63], and developing metal-based complexes such as ruthenium compounds to disrupt CSC functionality [64]. Future progress hinges on overcoming the challenges of tumor heterogeneity, CSC plasticity, and the dual role of EMT in cancer versus normal tissue repair [57] [59]. The integration of single-cell multi-omics, advanced in vivo models, and AI-driven drug discovery will be instrumental in translating these novel inhibitory strategies into successful clinical applications, ultimately improving outcomes for patients with advanced and metastatic cancers.
Harnessing Radiopharmaceuticals and Bispecific Antibodies for Precision Therapy
The relentless progression of malignant tumors to metastatic disease represents the central challenge in oncology, accounting for approximately 90% of cancer-related deaths [48] [1]. This whitepaper examines the transformative potential of two precision therapeutic modalities—radiopharmaceuticals and bispecific antibodies—in reshaping the therapeutic landscape for advanced solid tumors. By simultaneously engaging multiple biological pathways and delivering targeted cytotoxicity, these platforms address the complex pathophysiology of metastasis through distinct yet complementary mechanisms. We provide a comprehensive technical analysis of their molecular designs, mechanisms of action, and experimental applications, with particular emphasis on their integration within the context of metastatic cascade biology. Structured data presentation, detailed methodologies, and visual workflow schematics offer researchers a foundational resource for therapeutic development in this rapidly evolving field.
Metastasis is not a random process but follows a well-orchestrated biological sequence whereby tumor cells disseminate from primary sites to colonize distant organs. This process involves dynamic interactions between cancer cells (the "seed") and receptive microenvironments in distant organs (the "soil") [1]. The metastatic cascade encompasses local invasion, intravasation, survival in circulation, extravasation, and colonization at distant sites. Different cancers exhibit distinct organ tropism patterns; for instance, breast and prostate cancers frequently metastasize to bone (incidence of 75% and 70-85%, respectively), while the liver and lungs are common sites for gastrointestinal cancers [1]. Understanding these organ-specific preferences is crucial for developing effective targeted therapies.
The tumor microenvironment (TME) plays a pivotal role in metastatic progression, creating immunosuppressive conditions that foster immune evasion and treatment resistance [48]. This biological framework establishes the therapeutic rationale for both radiopharmaceuticals and bispecific antibodies, which are engineered to precisely target and disrupt these complex metastatic processes through mechanisms beyond the capabilities of conventional therapies.
Bispecific Antibodies: Engineering and Mechanisms
Structural Design and Classification
Bispecific antibodies (BsAbs) are synthetic immunoglobulin constructs engineered to simultaneously bind two distinct antigens or epitopes, enabling therapeutic effects that extend beyond mere superposition of two monoclonal antibodies [66]. The structural landscape of BsAbs is broadly categorized into two classes based on the presence or absence of an Fc region:
IgG-like BsAbs incorporate an Fc domain, conferring longer half-lives through FcRn-mediated recycling, increased stability, and Fc-mediated effector functions including antibody-dependent cell-mediated cytotoxicity (ADCC), complement-dependent cytotoxicity (CDC), and antibody-dependent cellular phagocytosis (ADCP) [66] [67]. Prominent engineering platforms in this category include:
- Duobody: Utilizes controlled Fab-arm exchange between two individually engineered IgG1 molecules [67]
- Knobs-into-holes: Introduces complementary mutations in CH3 domains to ensure correct heavy chain pairing [66] [67]
- CrossMAbs: Employ precise engineering to guarantee proper heavy and light chain pairing, enhancing stability and functionality [67]
Non-IgG-like BsAbs lack Fc regions, avoiding Fc-mediated effector functions and potential associated toxicities [66]. Key formats include:
- Bispecific T-cell Engagers (BiTEs): Comprise tandem single-chain variable fragments (scFvs) connected via flexible peptide linkers [66]
- Immune-mobilizing monoclonal TCR Against Cancer (ImmTAC): Fuses a high-affinity T-cell receptor with an anti-CD3 scFv to target intracellular antigens [66]
Table 1: Classification and Characteristics of Bispecific Antibody Formats
| Category | Format | Structural Features | Key Advantages | Representative Agents |
|---|---|---|---|---|
| IgG-like | Duobody | Full-length IgG with engineered CH3 domains | Longer half-life, Fc-mediated effector functions | Amivantamab, Epcoritamab |
| Knobs-into-holes | Full-length IgG with complementary CH3 mutations | Precise heavy chain pairing, reduced mispairing | Mosunetuzumab | |
| CrossMab | Full-length IgG with cross-paired Fab regions | Correct heavy-light chain pairing, enhanced stability | Glofitamab, Faricimab | |
| Non-IgG-like | BiTE | Tandem scFvs with flexible linkers | Small size, enhanced tissue penetration, reduced immunogenicity | Blinatumomab |
| ImmTAC | TCR fused to anti-CD3 scFv | Targets intracellular antigens | Tebentafusp |
Functional Mechanisms in Metastatic Disease
BsAbs exert anti-tumor effects through several distinct mechanistic paradigms, particularly relevant in the context of metastatic disease:
Bridging Immune and Tumor Cells: T-cell engaging BsAbs represent the most established mechanism, simultaneously binding CD3 on T-cells and tumor-associated antigens (e.g., BCMA, GPRC5D, CD19) on cancer cells [66] [68]. This direct physical linkage activates T-cells independently of MHC-mediated antigen presentation, forming a cytolytic immune synapse that induces apoptosis of tumor cells [66]. This mechanism is particularly valuable against metastatic lesions that have evolved to evade endogenous immune recognition.
Dual Pathway Inhibition: These BsAbs simultaneously target two distinct signaling pathways driving tumor progression and metastasis. For instance, amivantamab concurrently targets EGFR and MET receptors, addressing key resistance mechanisms in NSCLC [67]. Similarly, cadonilimab simultaneously engages PD-1 and CTLA-4 immune checkpoints, demonstrating superior efficacy compared to combination monoclonal antibody therapy [66] [67].
Pretargeting Strategies: A novel application involves using BsAbs as pretargeting vehicles for radiopharmaceutical delivery. One arm binds a tumor-associated antigen (e.g., oxMIF, CEA, HER2), while the other serves as a docking site for subsequently administered radioligands [69]. This approach separates antibody localization from radiation delivery, optimizing tumor targeting while minimizing systemic radiation exposure.
Clinical Efficacy and Safety Profiles
BsAbs have demonstrated significant clinical activity across various metastatic malignancies. In hematological malignancies, pooled analysis of 850 patients with relapsed/refractory multiple myeloma showed an overall response rate of 69%, with 42% achieving complete response or better [68]. The pooled rate of duration of response for at least one year was 71%, with estimated one-year progression-free and overall survival of 56% and 72%, respectively [68].
Table 2: Clinical Efficacy of BsAbs in Relapsed/Refractory Multiple Myeloma (Pooled Analysis)
| Efficacy Parameter | Pooled Rate (%) | Number of Studies | Patient Population |
|---|---|---|---|
| Overall Response Rate | 69 | 6 | 850 patients |
| Complete Response or Better | 42 | 6 | 850 patients |
| 1-Year Duration of Response | 71 | 6 | 850 patients |
| 1-Year Progression-Free Survival | 56 | 6 | 850 patients |
| 1-Year Overall Survival | 72 | 6 | 850 patients |
| MRD-Negativity Rate | 24 | 4 | Subset of patients |
The safety profile of BsAbs reveals characteristic toxicities, primarily cytokine release syndrome (CRS), which occurs in 69% of patients (any grade), though typically manageable with standard protocols [68]. Hematological toxicities are prominent, with grade ≥3 neutropenia occurring in 46% of patients, while grade ≥3 infections are observed in 29% [68]. These safety considerations necessitate specialized management protocols in clinical applications.
Radiopharmaceuticals: Precision Radiation Delivery
Radionuclide Selection and Properties
Radiopharmaceutical therapy (RPT) involves the targeted delivery of radionuclides to metastatic lesions using tumor-seeking vectors, enabling localized radiation exposure while minimizing systemic toxicity [70]. The selection of appropriate radionuclides is guided by their decay properties, emission characteristics, and compatibility with the biological targeting vehicle.
Table 3: Key Radionuclides for Radiopharmaceutical Applications
| Radionuclide | Emission Type | Half-Life | Energy/Application | Clinical Applications |
|---|---|---|---|---|
| Lutetium-177 | β¯ | 6.7 days | Medium β¯ energy (0.5 MeV) | Neuroendocrine tumors ([177Lu]Lu-DOTA-TATE), prostate cancer ([177Lu]Lu-PSMA-617) |
| Actinium-225 | α | 10 days | High LET (6-8 MeV) | Acute myelogenous leukemia, prostate cancer |
| Lead-212 | α | 10.6 hours | High LET (6-8 MeV) | Neuroendocrine tumors, small cell lung cancer |
| Radium-223 | α | 11.4 days | High LET (6-8 MeV) | Bone metastases from prostate cancer |
| Iodine-131 | β¯ | 8 days | Medium β¯ energy (0.6 MeV) | Differentiated thyroid cancer |
| Yttrium-90 | β¯ | 2.7 days | High β¯ energy (2.3 MeV) | Lymphoma (ibritumomab tiuxetan) |
The linear energy transfer (LET) varies significantly between emission types; α-particles exhibit high LET (∼80 keV/μm) compared to β¯-particles (∼0.2 keV/μm), resulting in more concentrated energy deposition and greater relative biological effectiveness [70]. α-emitters are particularly effective against micrometastases and circulating tumor cells due to their short path length (40-80 μm) and potent cytotoxicity, while β¯-emitters are better suited for larger tumor masses due to their longer penetration range (2-12 mm) [70].
Targeting Vectors and Mechanisms
The targeting specificity of radiopharmaceuticals derives from their molecular vectors, which include:
- Small molecules: [177Lu]Lu-PSMA-617 targets prostate-specific membrane antigen in prostate cancer [70]
- Peptides: [177Lu]Lu-DOTA-TATE binds somatostatin receptors overexpressed in neuroendocrine tumors [70]
- Antibodies: Trastuzumab derivatives target HER2 in breast cancer [71]
- BsAbs: Pretargeting approaches using bispecific antibodies with one arm binding tumor antigen and the other capturing administered radioligands [69]
A critical advancement in RPT is the theranostic approach, which pairs diagnostic and therapeutic radiopharmaceuticals targeting the same molecule. This paradigm enables patient stratification, dosimetry calculations, and treatment response monitoring using complementary agents such as [68Ga]Ga-DOTA-TATE/[177Lu]Lu-DOTA-TATE for neuroendocrine tumors and [68Ga]Ga-PSMA-11/[177Lu]Lu-PSMA-617 for prostate cancer [70].
Pretargeted Radioimmunotherapy
The PreTarg-it platform exemplifies innovative pretargeting methodology that enhances the therapeutic index of RPT [69]. This system employs a bispecific antibody (ON105) with one arm targeting oxidized macrophage migration inhibitory factor (oxMIF)—a tumor-specific antigen—and the other binding a histamine-succinyl-glycine (HSG) peptide. The radioligand (177Lu-IMP288, a DOTA-di-HSG peptide) is administered after a 3-5 day interval, allowing bispecific antibody accumulation in tumors and clearance from circulation [69]. This temporal separation maximizes tumor radiation dose while minimizing hematological and renal toxicity associated with conventional radioimmunotherapy.
Experimental Protocols and Methodologies
In Vitro Characterization of Bispecific Antibodies
Target Binding Affinity Assessment Surface Plasmon Resonance (SPR): Immobilize individual antigens on CM5 sensor chips using standard amine coupling. Serial dilutions of purified BsAbs (0.1-100 nM) are injected at 30 μL/min flow rate in HBS-EP buffer. Determine kinetic parameters (KD, Kon, Koff) using double referencing and global fitting to a 1:1 Langmuir binding model. Confirm dual-specific binding by demonstrating simultaneous interaction with both targets [66].
T-cell Activation and Cytotoxicity Assays Co-culture Systems: Isolate peripheral blood mononuclear cells (PBMCs) from healthy donors by Ficoll density gradient centrifugation. Label target tumor cells (endogenously expressing target antigen) with CellTrace CFSE and co-culture with PBMCs at 10:1 effector:target ratio in the presence of serially diluted BsAbs. After 24-48 hours, quantify T-cell activation by flow cytometric analysis of CD69 and CD25 expression. Measure tumor cell killing using Annexin V/propidium iodide staining or real-time cell impedance monitoring (xCELLigence) [66] [68].
Radiopharmaceutical Development and Evaluation
Radiolabeling and Quality Control Lutetium-177 Labeling of DOTA-Conjugates: Add [177Lu]LuCl3 (1-5 GBq) to 50-100 μg of DOTA-conjugated targeting vector (peptide or antibody) in ammonium acetate buffer (0.2 M, pH 5.0). Heat at 90°C for 20-30 minutes. Determine radiochemical purity (>95%) by instant thin-layer chromatography (ITLC) in 0.1 M citrate buffer (pH 5.0). Perform sterility testing by membrane filtration and endotoxin testing by LAL assay [70].
In Vivo Biodistribution Studies Murine Models: Subcutaneously implant 5-10 × 10^6 tumor cells expressing the target antigen in the flank of immunodeficient mice (e.g., BALB/c nude). Allow tumors to reach 200-300 mm³. Intravenously inject 1-5 MBq of radiolabeled compound via tail vein. Euthanize groups of animals (n=5) at predetermined time points (1, 4, 24, 48, 72 hours). Collect tumors, blood, and major organs, measure weight and radioactivity using a gamma counter. Calculate percentage injected dose per gram (%ID/g) for each tissue [69] [70].
Preclinical Efficacy Models
Metastatic Model Evaluation Experimental Lung Metastasis: Intravenously inject 0.5-1 × 10^6 luciferase-expressing tumor cells via tail vein. Monitor metastatic establishment weekly by bioluminescence imaging. Randomize animals into treatment groups when metastatic signal is detectable. Administer BsAbs (5-10 mg/kg, 2-3 times weekly), radiopharmaceuticals (10-30 MBq, single or fractionated doses), or combination therapy. Assess survival and quantify metastatic burden by ex vivo organ imaging and histopathological analysis [69] [1].
Integrated Therapeutic Approaches
Rationale for Combination Therapy
The simultaneous targeting of complementary pathways through combined BsAbs and RPT represents a promising strategy to overcome the heterogeneity and adaptability of metastatic tumors. BsAbs can modulate the TME, enhance immune cell infiltration, and reverse immunosuppressive conditions, potentially sensitizing tumors to the cytotoxic effects of RPT [72] [73]. Conversely, radiation from RPT can enhance tumor immunogenicity by promoting immunogenic cell death, releasing tumor antigens, and upregulating MHC class I expression, potentially augmenting the efficacy of BsAbs [70].
Research Reagent Solutions
Table 4: Essential Research Reagents for Combined BsAb and Radiopharmaceutical Studies
| Reagent Category | Specific Examples | Research Applications | Key Considerations |
|---|---|---|---|
| BsAb Engineering Platforms | Duobody, Knobs-into-holes, CrossMab, BiTE | Construction of bispecific molecules with defined specificity | Valency, Fc effector function, half-life, immunogenicity |
| Targeting Vectors | Anti-CEA, Anti-HER2, Anti-PSMA, Somatostatin analogs | Tumor-specific delivery of radionuclides | Target expression profile, internalization capacity, binding affinity |
| Radionuclides | 177Lu, 225Ac, 212Pb, 131I, 90Y | Cytotoxic payload for targeted radiation | Emission type, energy, path length, half-life, chelation chemistry |
| Molecular Imaging Agents | 68Ga-PSMA-11, 68Ga-DOTA-TATE, 18F-FDG | Patient stratification, dosimetry, treatment monitoring | Target specificity, pharmacokinetics, imaging timepoint |
| Animal Models | Patient-derived xenografts, Genetically engineered models, Metastatic models | Preclinical efficacy and safety evaluation | Tumor microenvironment fidelity, metastatic potential, immunocompetence |
Visualizing Key Mechanisms and Workflows
Bispecific Antibody Mechanisms in Metastasis
BsAb Mechanisms in Metastasis: This diagram illustrates how bispecific antibodies bridge immune cells and tumor cells within the metastatic microenvironment, overcoming immunosuppressive mechanisms and organ tropism through formation of cytolytic immune synapses.
Radiopharmaceutical Pretargeting Workflow
Radiopharmaceutical Pretargeting Workflow: This diagram outlines the sequential pretargeting approach that separates antibody localization from radiation delivery, enhancing tumor-specific radiation exposure while minimizing normal tissue toxicity through rapid clearance of unbound radioligand.
The integration of radiopharmaceuticals and bispecific antibodies represents a paradigm shift in precision therapy for metastatic solid tumors. By leveraging the unique strengths of each modality—BsAbs for immune recruitment and pathway modulation, and RPT for localized cytotoxic delivery—this combined approach addresses the multifaceted biological challenges of metastasis. The continued refinement of targeting vectors, radionuclide selection, and administration schedules will further enhance the therapeutic index of these innovative platforms. As research advances, the strategic combination of these technologies holds significant promise for improving outcomes in patients with advanced metastatic disease, ultimately transforming cancer from a lethal to a manageable condition.
Leveraging Nanotechnology and AI for Drug Delivery and Predictive Modeling
The biological process of metastasis is responsible for approximately 90% of cancer-associated deaths, making it the most significant challenge in oncology today [2] [74]. This complex, multi-step cascade involves local invasion, intravasation, survival in circulation, extravasation, and colonization at distant sites, creating formidable barriers to effective treatment [74]. The tumor microenvironment (TME) plays a pivotal role in this process, driving tumor growth, immune evasion, and metastasis through intricate cellular interactions [75]. Within this biological context, the convergence of nanotechnology and artificial intelligence (AI) represents a paradigm shift in therapeutic development. Nanotechnology enables precise intervention at molecular levels, while AI provides the computational power to decode metastatic complexity and predict therapeutic outcomes, together creating a powerful framework for addressing the fundamental biological drivers of metastatic disease.
Nanotechnology-Enabled Strategies for Targeting Metastatic Processes
Biological Barriers and Nanocarrier Design Principles
The journey of cancer cells during metastasis involves overcoming multiple biological barriers, a capability that nanocarriers are uniquely positioned to exploit for therapeutic purposes. The epithelial-mesenchymal transition (EMT) program confers increased motility, invasiveness, and ability to degrade extracellular matrix components - all critical for invasion and dissemination [74]. This biological process is not binary but exists along a spectrum, with cells often exhibiting mixed epithelial/mesenchymal phenotypes [2]. Nanocarriers are engineered with specific properties to navigate biological systems and target these metastatic processes through several key strategies:
- Enhanced Permeability and Retention (EPR) Effect: First-generation nanocarriers leverage the leaky vasculature and impaired lymphatic drainage of tumors for passive accumulation, with optimal sizes between 50-200 nm to balance circulation time and tissue penetration [76].
- Active Targeting Mechanisms: Second-generation systems incorporate targeting ligands (antibodies, peptides, aptamers) that recognize tumor-specific antigens or receptors overexpressed on metastatic cells, enabling selective binding and internalization [76].
- Stimuli-Responsive Release: Third-generation nanodevices respond to specific physiological conditions in the TME such as pH shifts, protease activity, or reactive oxygen species to precisely control drug release at metastatic sites [76].
Table 1: Nanocarrier Platforms and Their Applications in Metastasis Research
| Nanocarrier Type | Key Components | Metastasis-Relevant Applications | Benefits |
|---|---|---|---|
| Liposomes | Phospholipids, cholesterol | Delivery of anthracyclines (e.g., Doxil), combination therapies (e.g., CPX-351) | Improved pharmacokinetics, reduced toxicity [77] [76] |
| Polymeric Nanoparticles | PLGA, chitosan, silk fibroin | Sustained release of 5-FU, curcumin for breast cancer metastasis [77] | Biodegradability, controlled release profiles [77] [78] |
| Inorganic Nanoparticles | Mesoporous silica, gold | Functionalized MSNs for enhanced cellular uptake in lung and colon carcinomas [77] | Tunable porosity, surface functionalization [77] [78] |
| Solid Lipid Nanoparticles (SLNs) | Natural lipids, surfactants | Intranasal delivery to bypass BBB for brain metastases [77] | Enhanced brain penetration, biocompatibility [77] |
| Spherical Nucleic Acids (SNAs) | DNA/RNA shells, drug cores | Restructured 5-FU for AML, 20,000x potency increase [79] | High cellular uptake, precision targeting [79] |
Experimental Protocols in Nanocarrier Development
Protocol 1: Development and Characterization of Drug-Loaded Albumin Nanoparticles [77]
This protocol outlines the methodology for creating clarithromycin-loaded bovine serum albumin nanoparticles (CLA-BSA NPs) with enhanced anticancer and antibacterial properties:
- Formulation: Prepare 5% (w/v) bovine serum albumin solution in deionized water. Dissolve clarithromycin in minimal DMSO and add dropwise to BSA solution under constant stirring at 800 rpm.
- Cross-linking: Add glutaraldehyde (8% v/v) as crosslinking agent and continue stirring for 12 hours at room temperature.
- Purification: Centrifuge at 15,000 rpm for 30 minutes at 4°C and wash three times with phosphate buffer (pH 7.4).
- Characterization: Determine particle size and zeta potential using dynamic light scattering. Confirm drug loading through HPLC and characterize surface morphology using SEM.
- In vitro Release: Dialyze against PBS (pH 7.4) with 0.1% Tween 80 at 37°C with continuous shaking. Collect samples at predetermined intervals and analyze drug content.
- Biological Testing: Evaluate cytotoxicity against A549 lung cancer cells and normal fibroblasts using MTT assay. Assess antibacterial activity against Bacillus cereus using broth microdilution method.
Protocol 2: Synthesis of Chemotherapeutic Spherical Nucleic Acids [79]
This advanced protocol describes the transformation of conventional chemotherapy drugs into spherical nucleic acids for dramatically enhanced potency:
- SNA Construction: Chemically incorporate 5-fluorouracil (5-Fu) molecules into DNA strands coating 13-nm gold nanoparticle cores using thiol-modified oligonucleotides.
- Purification: Remove unbound drug and oligonucleotides through centrifugal filtration (100 kDa MWCO) with repeated washing cycles.
- Characterization: Confirm drug loading through UV-Vis spectroscopy and elemental analysis. Determine hydrodynamic diameter and surface charge using dynamic light scattering.
- Cellular Uptake Assessment: Incubate SNAs with acute myeloid leukemia cells for 4 hours. Quantify internalization using flow cytometry and confocal microscopy.
- Potency Evaluation: Treat AML cells with SNA constructs and free 5-Fu at equivalent concentrations. Assess cell viability after 72 hours using CellTiter-Glo assay.
- In vivo Testing: Administer to AML mouse models via tail vein injection. Monitor cancer progression through bioluminescent imaging and assess survival extension.
Diagram 1: Integration of Nanotechnology with Metastatic Cascade. The diagram illustrates how different nanotechnology strategies intervene at specific stages of the metastatic cascade, from epithelial-mesenchymal transition (EMT) at the primary site to metastatic colonization at distant organs.
AI-Driven Predictive Modeling of Metastasis and Treatment Outcomes
Machine Learning Approaches for Metastasis Prognostication
Artificial intelligence has emerged as a transformative tool for predicting metastatic progression and treatment outcomes, leveraging complex patterns in high-dimensional data that exceed human analytical capabilities. The MelanoMAP framework exemplifies this approach, integrating histology features with clinicopathological data to predict metastasis in cutaneous melanoma with significantly improved accuracy over traditional staging systems [75]. This multimodal AI model achieved a C-index of 0.82, representing a 24% improvement over AJCC staging (C-index 0.66) by incorporating TME-derived digital biomarkers with conventional prognostic factors [75]. For spinal metastases, AI models have demonstrated robust predictive performance for mortality, ambulatory status, and surgical complications, with the Skeletal Oncology Research Group machine learning algorithms (SORG-MLAs) consistently achieving AUCs >0.84 for 90-day and 1-year mortality predictions [80].
Table 2: AI Model Performance in Predicting Metastatic Outcomes
| AI Model | Cancer Type | Prediction Task | Performance Metrics | Key Predictive Features |
|---|---|---|---|---|
| MelanoMAP (Multimodal AI) | Cutaneous Melanoma | Metastatic risk in localized disease | C-index: 0.82 [75] | TME biomarkers, Breslow depth, age, mitotic count [75] |
| SORG-MLA | Spinal Metastases | 90-day and 1-year mortality | AUC >0.84 [80] | Tumor type, performance status, neurological function [80] |
| Radiomics Models | Spinal Metastases | Radiation outcomes, hidden blood loss | AUC: 0.76-0.81 [80] | Imaging features, tumor volume, bone quality [80] |
| Deep Survival Models | Multiple Cancers | Recurrence-free survival | IBS: 0.084 (improved calibration) [75] | Histological subtypes, anatomical location [75] |
Experimental Protocol for AI Model Development
Protocol 3: Development of Multimodal AI for Metastasis Prediction [75]
This protocol details the methodology for creating integrated AI systems that predict metastatic progression from multiple data modalities:
- Data Collection and Curation: Assemble retrospective cohorts with whole slide images (WSIs) of H&E-stained tissue sections and matched clinicopathological data including age, Breslow depth, mitotic count, histological subtype, and anatomical location.
- Whole Slide Image Processing: Segment WSIs into smaller patches (256×256 pixels) using a modified U-Net architecture with preprocessing to distinguish tissue regions from background. Generate segmentation masks categorizing regions into background, epidermis, and tumor compartments.
- Feature Extraction: Implement both deep learning-based features (using EfficientNet CNN architecture) and handcrafted features quantifying color intensity, gradient distribution, and cellular spatial relationships in the tumor microenvironment.
- Model Integration: Develop multiple survival models (Cox proportional hazards, random survival forest, and deep survival models) combining imaging features with clinicopathological variables using concatenation fusion.
- Validation Framework: Perform internal validation through bootstrapping with 1000 resamples and external validation on completely independent international cohorts to assess generalizability.
- Risk Stratification: Define high-risk and low-risk groups based on model predictions using thresholding of survival probabilities at clinically relevant timepoints (e.g., 60-month survival).
Diagram 2: Multimodal AI Framework for Metastasis Prediction. The workflow illustrates the integration of diverse data modalities (histology, clinical, and molecular data) through multiple AI approaches to generate predictive outputs for metastatic risk assessment and treatment guidance.
Integrated Nanotechnology and AI Approaches
The convergence of nanotechnology and AI creates synergistic capabilities for addressing metastasis through closed-loop systems where AI both guides nanocarrier design and interprets the complex biological responses to nanotherapeutics. Physics-informed machine learning approaches combine experimental data with numerical simulations of tumor growth and drug delivery to identify critical parameters for nanocarrier optimization [81]. This hybrid methodology is particularly valuable given the challenges of obtaining sufficient experimental data, enabling researchers to integrate limited experimental datasets with validated computational models to predict nanocarrier behavior in the complex tumor microenvironment [81]. The integration of AI-driven digital biomarkers with nanotherapeutic response monitoring enables dynamic adjustment of treatment strategies based on real-time assessment of metastatic progression and therapeutic resistance mechanisms [75].
Table 3: Essential Research Reagents and Platforms for Nanotechnology-AI Integration
| Research Tool | Specific Examples | Application Function | Technical Specifications |
|---|---|---|---|
| Nanoparticle Formulation | Liposomes, polymeric NPs, SNAs | Drug encapsulation and delivery | Size: 50-200 nm; Zeta potential: ±30 mV; PDI: <0.3 [77] [76] |
| Characterization Instruments | DLS, NTA, HPLC, SEM | NP physicochemical characterization | Size distribution, encapsulation efficiency, morphology [77] [78] |
| AI Development Frameworks | PyTorch, TensorFlow, Scikit-survival | Model development and training | Support for CNN, U-Net, survival analysis architectures [75] |
| Digital Pathology Platforms | Whole slide scanners, image analysis software | TME digital biomarker extraction | High-resolution scanning (40x), automated segmentation [75] |
| Biological Assays | MTT, flow cytometry, Western blot | In vitro and in vivo efficacy assessment | Cell viability, apoptosis, protein expression analysis [77] [79] |
| Computational Modeling | TCAT-based growth models, biodistribution models | Prediction of nanocarrier behavior in TME | Multiphysics simulation of mass transport [81] |
Future Directions and Translational Considerations
The future advancement of integrated nanotechnology and AI approaches for metastasis requires addressing several critical challenges. Biocompatibility and long-term safety profiles of nanocarriers demand more rigorous evaluation, particularly as targeting strategies become more sophisticated [76] [78]. The translational gap between promising preclinical results and clinical efficacy remains substantial, necessitating improved model systems that better recapitulate the human metastatic microenvironment [76]. For AI approaches, standardization of data collection and validation across diverse populations is essential to ensure generalizability and mitigate algorithmic bias [75] [80]. Emerging opportunities include the development of multimodal hybrid models that integrate real-time sensor data from nanodiagnostics with traditional clinical and imaging biomarkers to create dynamic predictive systems [80]. Additionally, the application of physics-informed neural networks that incorporate fundamental biological principles of metastasis into AI architectures holds promise for more robust and interpretable predictions [81]. As these technologies mature, ethical frameworks for responsible clinical implementation must evolve in parallel, ensuring that these powerful tools advance equity in cancer care while maintaining rigorous safety standards [80].
Overcoming Key Challenges in Metastasis Research and Drug Development
Metastasis is responsible for the vast majority of cancer-related deaths, yet it remains the least understood aspect of cancer biology [2] [74]. The failure to successfully translate preclinical findings in metastatic solid tumors to clinical success represents a critical challenge in oncology drug development. Over 70% of new oncological drugs fail to demonstrate activity in phase II trials, raising serious questions about the predictive value of current preclinical mouse models [82]. This disconnect stems from fundamental limitations in how we model the complex, multi-step process of metastasis - from initial dissemination from the primary tumor through colonization of distant organs [39] [74]. The intricate tumor-host interactions, metabolic adaptations, and dynamic microenvironmental influences that drive metastatic progression in patients are often inadequately captured in conventional models. This technical guide examines the biological and methodological sources of this translational gap and provides a framework for developing more clinically relevant preclinical approaches for metastasis research.
Limitations of Conventional Metastasis Models
Inadequate Recapitulation of Human Biology
Traditional models suffer from several inherent limitations that reduce their predictive power for human therapeutic responses:
- Simplified Microenvironments: Conventional 2D cultures fail to recapitulate the multicellular makeup and physical architecture of human tumors, lacking critical tumor-stroma interactions that drive metastasis [39].
- Genetic Drift and Loss of Heterogeneity: Continual passaging of cell lines can result in significant genetic shift and loss of heterogeneity compared to original human samples [39].
- Immune Compromise: Human tumor xenografts must be transplanted into mice lacking fully functional immune systems, eliminating critical tumor-immune interactions [82] [83].
Disconnect from Clinical Metastasis Progression
Current models often fail to incorporate the progression and microenvironmental adaptation central to clinical metastasis:
- Therapeutic Response Mismatch: The response of metastases to specific agents often cannot be predicted from, and may even oppose, their effects on subcutaneous "primary" tumors, likely due to distinct growth kinetics and host interactions [82].
- Failure to Model Residual Disease: Most available preclinical models fail to incorporate the biology of advanced cancer progression and metastasis following primary tumor resection, which more closely mimics clinical reality [82].
- Limited Metastatic Organ Range: Genetically engineered mouse models (GEMMs) currently have limited range in the organs to which they metastasize; for example, no known GEMMs reliably develop brain metastases [39].
Table 1: Quantitative Analysis of Model Limitations in Metastasis Research
| Model Type | Key Limitations | Impact on Translational Relevance |
|---|---|---|
| 2D Cell Cultures | Loss of cellular heterogeneity; unable to recapitulate physical architecture of tumors [39] | Granular examination of single steps possible, but fails to model complex tissue interactions |
| Patient-Derived Xenografts | Require immunocompromised hosts; lack functional immune interactions [82] [83] | Limited prediction of immunotherapy response; altered tumor microenvironment |
| Genetically Engineered Mouse Models | Limited range of metastatic organs; no reliable brain metastasis models [39] | Restricted study of organ-specific metastatic niches |
| Subcutaneous Implants | Fail to metastasize; cannot accurately imitate tumor microenvironment [83] | Responses often not predictive of effects on actual metastases |
Advanced Model Systems to Enhance Clinical Relevance
Complex Three-Dimensional and Organotypic Models
Novel 3D culture systems are shedding light on cellular dynamics that cannot be studied using 2D tumor cell cultures alone:
- Patient-Derived Organoids (PDOs): Cultured directly from bio-banked human specimens, PDOs preserve most of the cellular heterogeneity, histological features, and molecular profiles of the patient's original tumor tissue. They enable examination of short-term tumor-immune and tumor-stroma interactions, providing a platform for drug testing that can directly inform clinical management [39].
- Organotypic Cultures: These preserve tissue architecture and cellular makeup by placing minimally processed tissue specimens directly into culture. For example, organotypic cultures of mouse brains bearing metastatic tumors demonstrated that cancer cells can mimic and compete with capillary pericytes to co-opt the brain's vasculature [39].
- Microfluidics Devices: Novel 3D microfluidics devices incorporate multiple stromal, endothelial and immune cell types to mirror physiological morphology, flow rates, and wall shear stresses in capillary systems. These can model microvascular systems like the blood-brain barrier, enabling study of individual contributions of brain stromal cells to cancer cell extravasation [39].
Clinically Relevant Animal Models
More sophisticated animal models better replicate the clinical progression of metastatic disease:
- Immunocompetent Spontaneous Metastasis Models: Models using mouse tumors in syngeneic immunocompetent hosts demonstrate superior tumor-host interactions. When combined with primary tumor resection, they allow study of residual disease progression and response to adjuvant therapy, closely mimicking clinical scenarios [82].
- Orthotopic Implantation Models: Implantation of cancer cells in the mammary fat pad (for breast cancer) creates a disease-relevant tumor microenvironment that more closely resembles human cancer stages compared to subcutaneous models [83].
- Site-Specific Injection Models: Different injection routes produce distinct metastatic patterns: tail vein injections primarily lead to lung metastasis, portal vein injection targets the liver, and intracardiac infusions target multiple organs including bone [83].
Experimental Protocol: Spontaneous Metastasis Model with Residual Disease
This protocol, adapted from [82], recapitulates post-surgical metastatic progression:
Tumor Labeling and Preparation:
- Label archived tumor tissue (never adapted to cell culture) using lentivirus-encoded biomarkers (e.g., Pol2-Luc/GFP) via ex vivo procedure without cell culture or drug selection.
- Use an RNA polymerase II promoter for relatively low but consistent biomarker expression to minimize host immune responses.
In Vivo Cycling for Clonal Selection:
- Transplant labeled tumor subcutaneously into syngeneic immunocompetent mice (Passage 0).
- Surgically remove primary tumors at predetermined size (e.g., 500 mm³).
- Monitor lung metastasis by bioluminescence imaging.
- When chest BL flux exceeds 10⁷ photons/sec, sacrifice mice and harvest labeled lung nodules.
- Repeat this process for 2-3 passages to obtain uniformly labeled, metastatic clones.
Therapeutic Efficacy Study:
- Expand cryopreserved working stock of labeled tumor once subcutaneously.
- Transplant into required number of mice for actual drug study.
- Surgically remove primary tumors at predetermined size (500 mm³).
- Randomize mice into treatment groups immediately after surgery.
- Initiate chemotherapeutic treatments in a setting akin to adjuvant therapy.
- Monitor metastasis periodically by BL imaging.
- Assess disease-free survival and overall survival as primary endpoints.
Quantitative Validation Technologies
Advanced imaging and analysis technologies enable more precise quantification of metastatic burden:
High-Resolution Cryo-Imaging
Cryo-imaging is a section-and-imaging technique that provides single cell resolution (as good as 5 µm) and large field-of-view in 3D color anatomy and fluorescence images of a whole mouse. This technology enables precise identification of metastatic tumors using fluorescent-protein-labeled cancer cells, providing ground truth for validating other imaging modalities [84].
Deep Learning-Based Metastasis Segmentation
The massive datasets generated by high-resolution cryo-imaging (>120 GB per mouse) necessitate automated analysis approaches [84]:
Algorithm Workflow:
- Exclude exterior fluorescent regions (cryo-gel, skin, fur) using 3D color and fluorescence images
- Segment big-metastases candidates with marker-controlled 3D watershed algorithm
- Segment small-metastases candidates with multi-scale Laplacian of Gaussian filtering followed by Otsu segmentation
- Classify candidates using 3D CNN-based methods with hand-crafted intensity and morphology features
- Perform computer-assisted corrections to refine classification
Performance Metrics: This approach achieves 0.8645 ± 0.0858 sensitivity and 0.9738 ± 0.0074 specificity, reducing human intervention time from >12 hours to ~2 hours per mouse [84].
SPECT-CT Quantitative Analysis
Quantitative SPECT-CT analysis can differentiate metastatic from degenerative bone lesions with high accuracy:
- Methodology: Administer 99mTc-HDP radiotracer intravenously, acquire SPECT-CT scans ~3 hours post-injection, and reconstruct using ordered subset expectation maximization (OSEM) algorithm with scatter and attenuation correction.
- Diagnostic Accuracy: Quantitative analysis reveals significantly higher SUVmax in metastatic bone lesions versus degenerative lesions (p < 0.001), with 91.5% sensitivity and 93.3% specificity at a cut-off SUVmax of 16.6 g/mL [85].
Table 2: Quantitative Imaging Technologies for Metastasis Analysis
| Technology | Spatial Resolution | Key Metrics | Advantages |
|---|---|---|---|
| Cryo-Imaging with Deep Learning [84] | 5-10 µm | Sensitivity: 86.5%; Specificity: 97.4% | Single-cell resolution; whole-body analysis; reduced manual time |
| SPECT-CT Quantitative [85] | 1-2 mm (clinical) | SUVmax cutoff: 16.6 g/mL; Sensitivity: 91.5% | Differentiates metastatic vs. degenerative lesions; clinically translatable |
| Bioluminescence Imaging [82] | N/A (functional) | BL flux (photons/sec) | Longitudinal monitoring; high throughput |
| Light Sheet Microscopy with Tissue Clearing [84] | 10 µm | N/A | 3D visualization of intact tissues |
Emerging Paradigms: Digital Twins and Computational Modeling
The emergence of digital twins represents a transformative approach to modeling metastasis:
- Digital Twin Technology: Computational models that create high-fidelity replicas of bone metastasis can simulate how tumors grow, spread, and respond to therapies within the complex bone environment. These models integrate years of biological data - from cellular behavior to bone geometry - into a virtual environment that mirrors reality down to the micrometer [86].
- Integration of Multiple Biological Processes: Advanced digital twins capture key processes like angiogenesis and osteolysis by simulating how tumor cells generate new vessels, how oxygen and nutrient gradients change over time, and how anti-angiogenic drugs disrupt this network [86].
- Therapeutic Prediction: These models can predict dose-dependent reductions in tumor volume that closely match results from in vivo experiments, validating their predictive accuracy for drug response [86].
The Scientist's Toolkit: Essential Research Reagents and Materials
Table 3: Key Research Reagent Solutions for Metastasis Research
| Reagent/Material | Function | Application Notes |
|---|---|---|
| Pol2-Luc/GFP Lentivirus [82] | Sustainable biomarker expression in immunocompetent models | RNA polymerase II promoter provides lower but more consistent expression, minimizing immune rejection |
| Patient-Derived Organoid Media [39] | Supports growth of 3D patient-derived organoids | Formulations optimized to maintain cellular heterogeneity and tumor microenvironment interactions |
| Microfluidic Chips [39] | Models intravasation/extravasation processes | Incorporates endothelial cells, stromal components, and physiological flow conditions |
| 99mTc-HDP Radiotracer [85] | SPECT-CT bone imaging agent | Enables quantitative assessment of metastatic bone lesions versus degenerative changes |
| Cryo-Embedding Matrix [84] | Tissue preservation for cryo-imaging | Maintains structural integrity during whole-mouse sectioning and imaging |
| OSEM Reconstruction Software [85] | SPECT image reconstruction | Enables accurate quantification of radiotracer uptake with scatter and attenuation correction |
Bridging the gap between preclinical models and clinical outcomes requires a multifaceted approach that embraces biological complexity, technological innovation, and computational integration. The path forward includes adopting more physiologically relevant model systems that maintain appropriate tumor-host interactions, implementing advanced quantification methods that provide comprehensive metastatic analysis, and developing integrated computational models that can simulate therapeutic responses before clinical testing. By addressing the fundamental limitations of conventional models and leveraging emerging technologies, researchers can build a more predictive framework for metastasis research that ultimately improves translational success and patient outcomes.
Therapeutic resistance represents a defining challenge in clinical oncology, fundamentally limiting the durability of cancer treatments and contributing significantly to disease relapse and poor patient outcomes. As the principal cause of cancer-related mortality, metastasis relies heavily on cancer cells' capacity to evade therapeutic pressure through diverse molecular adaptations [87]. Drug resistance is directly and fatally linked to tumor progression, acting not as an isolated complication but as a core biological process that causes treatment failure and triggers tumor recurrence and metastasis [87]. Current estimates indicate that approximately 90% of chemotherapy failures and more than 50% of targeted or immunotherapy failures are directly attributable to resistance, creating substantial clinical burdens and wasting medical resources [87]. This comprehensive review examines the molecular foundations of drug resistance in metastatic cells, categorizing mechanisms as intrinsic (preexisting) or acquired (developed during treatment), and explores emerging strategies to overcome these barriers within the broader context of metastasis research.
Classifying Resistance: Intrinsic versus Acquired Mechanisms
The clinical landscape of drug resistance is fundamentally categorized into two distinct paradigms: intrinsic resistance and acquired resistance, each with unique temporal and mechanistic characteristics.
Clinical Definitions and Temporal Dynamics
Intrinsic resistance (primary resistance) refers to a lack of response to initial treatment, indicating that resistance mechanisms pre-exist before therapy begins. In contrast, acquired resistance (secondary resistance) develops during or after treatment, implying an initial therapeutic response followed by therapeutic escape, which severely compromises the achievement of complete remission [87]. Tumor cells possess remarkable phenotypic plasticity, enabling survival through continuous adaptation under therapeutic pressure. During phenotypic conversion, certain tumor cells undergo Darwinian passive selection and enrichment, while others actively respond to diverse internal and external stimuli [87].
Prevalence Across Therapeutic Modalities
Resistance challenges extend across all mainstream cancer therapies, as summarized in Table 1.
Table 1: Prevalence of Resistance Across Cancer Therapeutic Modalities
| Therapy Class | Primary Resistance Prevalence | Acquired Resistance Timeline | Exemplary Mechanisms |
|---|---|---|---|
| Chemotherapy | Up to 90% of treatment failures [87] | Varies by agent and cancer type | Drug efflux pumps, DNA damage repair enhancement, apoptosis evasion [87] |
| Targeted Therapy | ~50% of treatment failures [87] | 9-14 months for 1st/2nd-gen EGFR TKIs [87] | Target mutations (e.g., T790M, C797S in EGFR), alternative pathway activation [87] |
| Immunotherapy | Affects majority of solid tumor patients [88] | 5 years in melanoma; 56% progression within 4 years in NSCLC [87] | Loss of immunogenic neoantigens, defects in IFNγ signaling, immunosuppressive TME [89] |
| T-cell Engagers | Subset of hematological and solid tumor patients [90] | Develops during treatment course | Tumor antigen loss, inhibitory ligand expression, T-cell dysfunction [90] |
Molecular Mechanisms of Intrinsic Resistance
Intrinsic resistance mechanisms are encoded within cancer cells before therapeutic intervention, creating immediate barriers to treatment efficacy.
Genetic Determinants of Innate Treatment Failure
Pre-existing target mutations represent a fundamental mechanism of intrinsic resistance. In non-small cell lung cancer (NSCLC), for instance, certain rare epidermal growth factor receptor (EGFR) mutations (S768I, L861Q, G719X) demonstrate reduced sensitivity to earlier-generation EGFR tyrosine kinase inhibitors (TKIs) compared to classical mutations [91]. Tumor molecular heterogeneity further ensures that treatment-resistant subclones exist prior to therapy initiation. Single-cell analyses have revealed that pharmacodynamic tolerance can emerge from pre-adaptive transcriptional states that persist within subpopulations of cancer cells, enabling rapid adaptation upon drug exposure [92].
Efflux transporter overexpression provides another potent intrinsic resistance mechanism. ATP-binding cassette (ABC) transporters, including P-glycoprotein (ABCB1), effectively pump chemotherapeutic agents out of cancer cells, maintaining subtherapeutic intracellular drug concentrations [87]. This mechanism is particularly relevant in cancers with specialized tissue barriers, such as the blood-brain barrier in glioblastoma, where overexpression of efflux pumps significantly reduces drug concentrations and therapeutic efficacy [87].
Tumor Microenvironment-Mediated Intrinsic Resistance
The tumor microenvironment (TME) creates physical and biochemical barriers that confer intrinsic resistance. In pancreatic ductal adenocarcinoma (PDAC), the acellular matrix can constitute up to 90% of tumor volume, displaying extensive fibrosis that elevates interstitial fluid pressure, impairs vascularization, and creates a physical barrier to drug delivery [87]. Similarly, tissue-specific immune landscapes determine initial treatment responses, with immunosuppressive myeloid cells and regulatory T cells establishing microenvironments that blunt therapy efficacy before treatment initiation [89] [93].
Table 2: Key Experimental Models for Studying Intrinsic Resistance
| Experimental System | Key Applications | Technical Considerations | Resistance Insights Generated |
|---|---|---|---|
| Treatment-naïve PDX models | Assess pre-existing resistance mechanisms without therapeutic pressure | Maintains tumor heterogeneity and stromal components | Identification of innate immune evasion programs and efflux pump expression |
| Organoid co-cultures | Study tumor-stroma interactions in defined microenvironments | Enables controlled manipulation of specific cell populations | Revealed CAF-mediated protection against cytotoxic agents via soluble factors |
| Single-cell RNA sequencing | Profile transcriptional heterogeneity in untreated tumors | Requires fresh tissue; complex computational analysis | Identified pre-existing drug-tolerant persister cell states in multiple cancer types |
Mechanisms of Acquired Resistance
Acquired resistance emerges during treatment through Darwinian selection and adaptive learning processes within cancer cell populations.
Genetic Adaptation Pathways
On-target mutations that directly impair drug-binding represent a classic acquired resistance mechanism. In NSCLC, first-generation EGFR-TKIs (gefitinib, erlotinib) initially effectively target sensitizing L858R mutations, but treatment selects for clones harboring the T790M gatekeeper mutation, which sterically hinders drug binding [87]. Third-generation agents like osimertinib overcome T790M-mediated resistance but subsequently drive emergence of the C797S mutation, leading to renewed resistance [87]. Similar mutation-driven escape patterns occur with ALK inhibitors in NSCLC (G1202R, L1196M), BRAF inhibitors in melanoma (BRAF splice variants), and hormonal agents in prostate cancer (androgen receptor mutations).
Bypass signaling activation provides an alternative genetic escape route. When the primary drug target is effectively inhibited, cancer cells activate alternative signaling pathways that maintain downstream survival signals. For example, MET amplification, HER2 activation, and PIK3CA mutations have all been documented as bypass mechanisms following EGFR inhibition in NSCLC [87]. These adaptations demonstrate the remarkable signaling plasticity of cancer cells under therapeutic pressure.
Non-Genetic Adaptive Resistance Mechanisms
Cancer cell plasticity enables reversible phenotypic switching that confers resistance without permanent genetic alteration. The epithelial-to-mesenchymal transition (EMT) program enhances metastatic potential and simultaneously confers broad-spectrum drug resistance [92]. During EMT, cancer cells adopt a stem-like, mesenchymal phenotype with reduced proliferation rates, enhancing tolerance to cytotoxic therapies. Recent research has identified the AXL-TBK1-AKT3 signaling cascade as a critical regulator of EMT and metastasis in pancreatic and breast cancers, with AKT3 specifically implicated in stabilizing pro-EMT transcription factors in the nucleus [94].
Lineage plasticity represents another profound adaptation, wherein tumor cells transition to alternative cell identities that no longer depend on the targeted oncogene. In prostate adenocarcinoma treated with androgen pathway inhibitors, neuroendocrine differentiation creates aggressive variant forms that are therapy-resistant [92]. Similarly, lung adenocarcinomas with EGFR mutations can transform to small cell histology following TKI treatment, demonstrating remarkable cellular reprogramming capacity [92]. These transitions are frequently facilitated by underlying genetic alterations, particularly TP53 and RB1 loss, which lower barriers to cellular identity changes.
Therapeutic tolerance describes a reversible drug-insensitive state that can be adopted by subpopulations of cancer cells. So-called "drug-tolerant persisters" emerge at low frequencies across cancer types and exhibit distinct epigenetic and metabolic states that allow survival during treatment. These cells often demonstrate histone modification changes, altered chromatin accessibility, and reduced metabolic activity, enabling them to withstand therapeutic insult without acquiring permanent resistance mutations [92].
Experimental Approaches for Mapping Resistance Pathways
Longitudinal Sampling and Analysis
Defining resistance mechanisms requires longitudinal molecular profiling of tumors before, during, and after treatment. The following protocol outlines a comprehensive approach for mapping resistance evolution:
Protocol 1: Longitudinal Resistance Mechanism Discovery
- Baseline sampling: Collect fresh tumor tissue and matched blood before treatment initiation for whole exome sequencing, RNA sequencing, and epigenomic profiling
- On-treatment monitoring: Isolate circulating tumor DNA (ctDNA) at regular intervals (e.g., every 4-8 weeks) to monitor clonal dynamics via targeted sequencing
- Progression biopsy: Obtain fresh tumor tissue at radiographic progression for comparative multi-omic analysis
- Single-cell profiling: Perform single-cell RNA sequencing on baseline and progression samples to identify transcriptional reprogramming
- Functional validation: Establish patient-derived organoids or xenografts from baseline and progression samples for ex vivo drug testing and CRISPR screening
Single-Cell Multi-omic Profiling
Single-cell technologies have revolutionized resistance mechanism discovery by enabling deconvolution of tumor heterogeneity and identification of rare resistant subpopulations. The following workflow details a standardized approach:
Protocol 2: Single-Cell Analysis of Resistance Cell States
- Tissue processing: Generate single-cell suspensions from fresh tumor biopsies using optimized dissociation protocols
- Viability preservation: Maintain >90% viability through cold preservation and rapid processing
- Multi-omic partitioning: Partition cells for parallel single-cell RNA sequencing (10x Genomics), ATAC sequencing (assay for transposase-accessible chromatin), and surface protein quantification (CITE-seq)
- Bioinformatic integration: Use Seurat, ArchR, or similar platforms to integrate multimodal data and define cell states
- Trajectory analysis: Apply pseudotime algorithms (Monocle3, PAGA) to reconstruct resistance evolution pathways
Signaling Pathways in Drug Resistance: Visualizing Molecular Networks
The molecular circuitry governing drug resistance involves complex interactions between multiple signaling pathways. The diagram below illustrates key resistance mechanisms and their interconnections.
Diagram 1: Molecular networks of drug resistance in metastatic cells. The diagram illustrates intrinsic (red) and acquired (blue) resistance mechanisms, their convergence on downstream effects (green), and the specialized AXL-TBK1-AKT3 pathway (yellow) that promotes EMT and metastasis.
The Scientist's Toolkit: Essential Research Reagents and Platforms
Cutting-edge research on drug resistance mechanisms relies on specialized reagents and technological platforms that enable precise dissection of molecular pathways.
Table 3: Essential Research Reagents and Platforms for Resistance Studies
| Reagent/Platform Category | Specific Examples | Research Applications | Key Functional Attributes |
|---|---|---|---|
| Single-cell RNA sequencing | 10x Genomics Chromium, Parse Biosciences | Profiling tumor heterogeneity, identifying rare resistant subpopulations | High-throughput cell indexing, multimodal capability (ATAC, protein) |
| Organoid culture systems | Matrigel-embedded 3D cultures, air-liquid interface | Maintaining patient-specific tumor characteristics ex vivo | Preserves tumor heterogeneity, enables high-throughput drug screening |
| CRISPR screening libraries | Brunello, GeCKO, custom target libraries | Functional genomics to identify resistance genes | Genome-wide or focused coverage, high consistency, bioinformatic support |
| Circulating tumor DNA assays | Safe-SeqS, digital PCR, targeted NGS panels | Non-invasive monitoring of resistance evolution | High sensitivity for mutant allele detection, quantitative dynamics |
| Patient-derived xenografts | Immunodeficient mouse models (NSG, NRG) | In vivo validation of resistance mechanisms | Maintains tumor architecture and stromal interactions |
| AKT3-specific inhibitors | Experimental small molecules [94] | Functional validation of AKT3 role in metastasis | Specific AKT3 targeting without cross-inhibition of AKT1/AKT2 |
Emerging Therapeutic Strategies to Overcome Resistance
Rational Combination Therapies
The complexity of resistance mechanisms necessitates multi-targeted approaches. Vertical pathway inhibition simultaneously targets multiple nodes within the same signaling cascade to prevent bypass signaling, while horizontal co-targeting addresses parallel pathways that can compensate for each other [87]. For example, in BRAF-mutant melanoma, combined BRAF and MEK inhibition delays resistance compared to BRAF inhibition alone. Emerging evidence suggests that targeting the AXL-TBK1-AKT3 signaling axis may provide a novel approach to prevent EMT-mediated resistance in pancreatic and breast cancers [94].
Adaptive Therapy and Evolutionary Principles
Evolutionary-informed treatment strategies aim to control rather than eliminate resistant subclones by maintaining sensitive populations that suppress expansion of resistant variants. Mathematical modeling suggests that pulsed or dose-modulated therapy schedules may extend disease control by exploiting competitive interactions between tumor subpopulations [87]. Clinical trials are currently evaluating this approach in prostate and breast cancers.
Targeting the Resistance Machinery Directly
Novel therapeutic modalities directly address specific resistance mechanisms. ABC transporter inhibitors seek to reverse chemotherapeutic resistance, though clinical success has been limited by toxicity [87]. Epigenetic modulators that reverse the drug-tolerant persister state are being tested in combination with targeted therapies to prevent resistance emergence. Immune suppression-inhibiting immunotherapy (IS-IIT) represents a promising approach for targeting micrometastatic disease by shifting the immune balance toward elimination of disseminated cancer cells [91].
Future Directions and Translational Opportunities
Overcoming therapeutic resistance requires continued innovation across multiple domains of cancer research. Artificial intelligence and machine learning approaches are being leveraged to predict resistance evolution and optimize drug combinations. Recent studies demonstrate that machine learning models can achieve 98.6% accuracy in predicting drug response in colon cancer by integrating multi-omic data [95]. Liquid biopsy technologies enable real-time monitoring of resistance dynamics through circulating tumor DNA analysis, potentially allowing for intervention before radiographic progression [87]. The emerging paradigm of cancer interception seeks to prevent resistance by intervening earlier in the disease process, potentially blocking cancer development entirely [88].
The future of metastasis research will depend on comprehensive characterization of tumor ecosystems at unprecedented resolution, leveraging single-cell and spatial omics to understand how cellular communities co-evolve under therapeutic pressure. Large integrated datasets that span molecular characterization methods are essential, with platform-level data access representing a critical need [88]. By bridging deep mechanistic understanding with adaptive clinical trial designs, the field moves closer to overcoming therapeutic resistance and achieving sustained, long-term cancer control.
Strategies for Targeting Metastasis Suppressors versus Inhibiting Effectors
Metastasis is the primary cause of cancer-related mortality, accounting for over 90% of cancer deaths [1]. This complex, multi-step process involves cancer cells disseminating from the primary tumor, surviving in circulation, and colonizing distant organs. Within this framework, two distinct therapeutic strategies have emerged: the reactivation of endogenous metastasis suppressor genes (MSGs) and the direct inhibition of metastatic effector molecules. MSGs are defined by their unique ability to inhibit metastasis without affecting primary tumor growth, creating a therapeutic window distinct from conventional cytostatic agents [96] [97] [98]. In contrast, effector inhibition targets the specific molecular machinery that executing individual steps of the metastatic cascade. This technical guide delineates the molecular principles, experimental methodologies, and therapeutic applications of these complementary approaches within the broader context of solid tumor metastasis research, providing a framework for rational antimetastatic drug development.
Molecular Definitions and Key Distinctions
Metastasis Suppressor Genes (MSGs)
Metastasis suppressors constitute a class of genes and proteins that inhibit specific parameters of the metastatic cascade yet possess little to no ability to regulate primary tumor initiation or maintenance [96]. The defining characteristic of an MSG is that its ectopic re-expression decreases the formation of metastatic lesions in vivo without significantly affecting primary tumor growth [96] [97]. These genes typically experience downregulation, rather than mutation, during metastatic progression, suggesting that therapeutic strategies should focus on their re-expression or restoration of function [96]. Since the discovery of the first MSG, NM23 (NME1), over 30 genes have been validated as metastasis suppressors across various cancer types [96] [97] [98].
Metastatic Effector Molecules
Metastatic effectors represent the executive machinery that enables cancer cells to complete specific steps of the metastatic cascade. These include proteases that facilitate invasion (e.g., matrix metalloproteinases), adhesion molecules that mediate arrest in distant organs (e.g., integrins), and signaling molecules that promote survival in foreign microenvironments. Unlike MSGs, effectors are often upregulated or activated in metastatic cells and are frequently targeted for inhibition rather than reactivation.
Table 1: Core Characteristics of Metastasis Suppressors versus Effector Targets
| Characteristic | Metastasis Suppressor Genes | Metastatic Effector Molecules |
|---|---|---|
| Primary Function | Inhibit discrete steps of metastasis | Execute specific metastatic processes |
| Effect on Primary Tumor | Minimal to no growth effect | Often support primary tumor growth |
| Expression in Metastasis | Typically downregulated | Typically upregulated or activated |
| Therapeutic Strategy | Reactivation, re-expression | Inhibition, blockade |
| Mechanistic Scope | Often multifactorial, pathway-level | Frequently single-process focused |
| Context Dependency | High (organotropic, cancer-type specific) | Variable |
Core Signaling Pathways and Molecular Mechanisms
Major Pathways Regulated by Metastasis Suppressors
Metastasis suppressors regulate diverse signaling networks, with the MAPK pathway representing the most commonly targeted cascade [97]. The following diagram illustrates the key pathways and their interactions:
The MAPK pathway emerges as a central hub for metastasis suppressor activity, with multiple MSGs converging on this signaling cascade. NM23 (NME1) suppresses MEK/ERK signaling through its histidine kinase activity, phosphorylating the kinase suppressor of Ras (KSR) and altering its scaffold function [96] [97]. RKIP (PEBP1) directly binds to and inhibits RAF1 kinase activity, particularly in the context of prostate and triple-negative breast cancers [96] [97]. Stress-activated pathways involving MKK4, MKK6, MKK7, and p38 MAPK regulate metastatic dormancy induction and maintenance, with pathway specificity varying by organ tumor type [96]. Additionally, adhesion molecules such as KAI1 and CD82 function as metastasis suppressors by modulating cell-cell and cell-matrix interactions that control metastatic dissemination [96].
Context-Dependent Signaling and Organ-Specific Effects
Recent research has revealed that metastasis suppressor function is highly context-dependent, with organ-specific microenvironments significantly influencing signaling outcomes. A striking example comes from SMAD4 in pancreatic ductal adenocarcinoma, where reactivation produces diametrically opposed effects depending on the metastatic site [99]. SMAD4 restoration suppresses liver metastases but promotes lung metastases, with chromatin state analysis revealing organ-biased differences in transcriptional regulation dominated by KLF4 versus RUNX1 transcription factors [99]. This organ-specific paradigm extends to other MSGs, including MKK4, which signals through p38 in ovarian cancer but through JNK in prostate cancer [96].
Table 2: Experimentally Validated Metastasis Suppressors and Their Mechanisms
| Metastasis Suppressor | Primary Biochemical Function | Key Molecular Targets | Validated Cancer Contexts |
|---|---|---|---|
| NM23/NME1 | Histidine protein kinase, NDP kinase, 3'-5' exonuclease | KSR, ERK/MAPK pathway | Breast, melanoma, colon [96] [97] |
| RKIP/PEBP1 | RAF1 kinase inhibitor | RAF1, STAT3, GRK2, NFκB | Prostate, triple-negative breast cancer [96] [97] |
| MKK4 | Stress-activated protein kinase | p38 MAPK, JNK | Ovarian, prostate, hepatocellular carcinoma [96] |
| KAI1/CD82 | Tetraspanin family member | Adhesion signaling, angiogenesis | Multiple solid tumors [96] |
| SMAD4 | TGFβ signaling transcription factor | Cell cycle, EMT programs | Pancreatic ductal adenocarcinoma [99] |
| NDRG1 | Stress-responsive protein | Multiple signaling pathways | Breast, prostate, colon [100] |
Experimental Approaches and Methodological Frameworks
Credentialing Metastasis Suppressors: In Vivo Models
The gold standard for validating MSG function involves spontaneous metastasis assays in which a primary tumor forms and naturally seeds metastases [97] [98]. Essential in vivo models include:
Orthotopic Transplantation Models: Tumor cells are implanted into the anatomically correct organ of origin, allowing natural metastatic progression. For example, pancreatic cancer cells are implanted into the pancreas, enabling study of the complete metastatic cascade to liver and lungs [99].
Experimental Metastasis Assays: Tumor cells are introduced directly into the circulation via intravenous (lung metastasis) or intrasplenic (liver metastasis) injection, focusing on later steps of metastasis [99]. These are typically combined with separate primary tumor growth studies.
Genetically Engineered Mouse Models (GEMMs): These models enable spatial and temporal control of gene expression. The KC-shSmad4 PDAC model incorporates doxycycline-inducible shRNA against Smad4, allowing reversible inactivation and restoration studies [99].
The following workflow illustrates a comprehensive approach for MSG validation and mechanism dissection:
Molecular Mechanism Dissection
Comprehensive mechanistic studies are essential following initial in vivo validation:
Transcriptomic Profiling: RNA sequencing of tumor cells isolated via fluorescence-activated cell sorting (FACS) from different metastatic sites reveals organ-specific gene expression patterns. For example, SMAD4 restoration in liver versus lung metastases activates distinct transcriptional programs, with liver metastases showing enrichment for cell cycle and senescence pathways [99].
Epigenetic Mapping: Assay for Transposase-Accessible Chromatin with sequencing (ATAC-seq) and chromatin immunoprecipitation (ChIP-seq) identify organ-biased chromatin states and transcription factor dependencies that influence MSG function [99].
Pathway Activity Assays: Phospho-specific flow cytometry, Western blotting, and kinase activity assays quantify activation states of key signaling pathways (ERK, p38, JNK) in response to MSG manipulation [96] [97].
The Scientist's Toolkit: Essential Research Reagents
Table 3: Key Research Reagents for Metastasis Suppressor and Effector Studies
| Reagent Category | Specific Examples | Research Application | Technical Considerations |
|---|---|---|---|
| In Vivo Models | KC-shSmad4 GEMM [99]; Orthotopic PDAC models | Spontaneous metastasis studies; Tumor-stroma interactions | Doxycycline-inducible systems enable temporal control; Fluorescent reporters facilitate cell isolation |
| Cell Lines | Metastatic variant pairs (e.g., high vs low NM23 expression) [97] | Mechanistic studies in vitro; Transplantation models | Authenticate frequently; Monitor metastatic potential retention |
| Antibodies | Phospho-ERK, phospho-SMAD2, SMAD4 [99]; MSG-specific antibodies | IHC, Western blot, flow cytometry | Validate for specific applications; Species compatibility |
| Molecular Tools | Dox-inducible expression vectors [99]; CRISPRa/i systems | MSG re-expression studies; Pathway manipulation | Titrate inducer concentration; Monitor off-target effects |
| Pathway Reporters | ERK/MAPK signaling reporters; TGFβ-responsive elements | Real-time pathway activity monitoring | Context-specific validation required; Signal amplification often needed |
| Isolation Tools | FACS sorting with fluorescent reporters [99]; Immune cell depletion kits | Tumor cell purification from tissues | Maintain cell viability; Process quickly for downstream applications |
Therapeutic Translation and Clinical Applications
Targeting Strategies for Metastasis Suppressors
Therapeutic approaches for MSG reactivation present unique challenges compared to conventional inhibitory strategies:
Transcriptional Reactivation: Small molecules that target epigenetic repressors or promote transcription factor binding to MSG promoters. Histone deacetylase inhibitors (HDACi) and DNA methyltransferase inhibitors (DNMTi) can reverse epigenetic silencing of MSGs.
Stabilization of MSG Proteins: Compounds that enhance protein stability or prevent degradation offer an alternative to transcriptional approaches, particularly for MSGs with regulated turnover.
RNA-Based Therapies: mRNA delivery systems or oligonucleotides that modulate splicing represent emerging strategies for restoring MSG function in metastatic lesions.
Combination Therapy Considerations
Successful clinical translation will likely require strategic combination approaches:
Context-Informed Combinations: Therapies must account for organ-specific MSG effects, as demonstrated by SMAD4's opposing roles in liver versus lung metastases [99]. Treatment strategies may require customization based on metastatic patterns.
Vertical Pathway Targeting: Combining MSG-directed therapies with inhibitors of downstream effector molecules may yield synergistic effects while reducing compensatory resistance mechanisms.
Immunomodulatory Combinations: Emerging evidence suggests that some MSGs, including RKIP, modulate immune responses in the tumor microenvironment, creating opportunities for combination with immunotherapy [96].
The strategic dichotomy between targeting metastasis suppressors and inhibiting metastatic effectors represents a fundamental framework for antimetastatic drug development. While effector inhibition offers direct, immediate blockade of specific metastatic processes, MSG reactivation provides a broader, pathway-level approach that may better address the heterogeneity and adaptability of metastatic cells. The critical challenge moving forward lies in understanding and accommodating the profound context-dependency of MSG function, particularly the organ-specific effects dictated by metastatic microenvironments. Future research must prioritize single-cell analyses of MSG signaling across different metastatic niches, the development of sophisticated delivery systems for MSG-targeted therapies, and the design of clinical trials that account for organotropic metastasis patterns. As our understanding of the molecular principles underlying metastatic progression continues to evolve, so too will our ability to strategically manipulate these processes for therapeutic benefit.
Detecting and Eradicating Dormant DTCs to Prevent Late Recurrence
Cancer recurrence after initial successful treatment represents a paramount challenge in oncology, driven by the biological phenomenon of tumor dormancy. Disseminated tumor cells (DTCs) can enter a state of prolonged hibernation—remaining viable but non-proliferative for years to decades before reactivating to cause metastatic relapse [101]. This dormancy state mirrors hibernation mechanisms in animals, where cancer cells enter a resting phase (G0/G1 cell cycle arrest) in response to stressors like nutrient deprivation or hypoxia [102]. The clinical significance is profound: in breast cancer alone, patients can experience asymptomatic periods of up to 25 years followed by relapse, with dormant DTCs residing preferentially in protective niches like bone marrow [103] [104]. Understanding the biological processes governing DTC dormancy—including cellular quiescence, angiogenic suppression, and immune evasion—is essential for developing strategies to prevent late recurrence and transform cancer into a chronically managed disease.
Molecular Mechanisms Governing Dormancy and Reactivation
Key Signaling Pathways and Cellular Regulators
Dormancy regulation involves complex signaling networks that balance proliferation arrest with cell survival. The ERK/p38 signaling ratio serves as a critical molecular switch, where decreased ERK (extracellular signal-regulated kinase) phosphorylation coupled with increased p38 MAPK phosphorylation induces and maintains dormancy [102]. Multiple microenvironment-derived signals reinforce this dormant state, including TGF-β2 and all-trans retinoic acid (atRA) from bone marrow niches that promote growth arrest through cell cycle regulators p15, p21, and p27 [102]. Similarly, bone morphogenetic protein 7 (BMP-7) induces prostate cancer dormancy via p38 activation and upregulation of the metastasis suppressor NDRG1 [102].
The PI3K/AKT pathway plays a dual role in dormancy regulation. While AKT inhibition can induce dormancy under hypoxic conditions [102], recent research has identified AKT3 as a specific isoform promoting reactivation through an AXL-TBK1-AKT3 signaling cascade that drives epithelial-to-mesenchymal transition and metastasis [94]. This pathway represents a promising therapeutic target, as AKT3 inhibition dramatically reduces metastasis without affecting primary tumor size [94].
Table 1: Key Signaling Pathways in DTC Dormancy Regulation
| Pathway/Component | Role in Dormancy | Mechanistic Action | Therapeutic Implications |
|---|---|---|---|
| ERK/p38 Balance | Dormancy Switch | Low ERK/p38 ratio induces quiescence | Targeting balance may lock cells in dormancy |
| TGF-β/BMP Family | Dormancy Maintenance | Induces cell cycle inhibitors (p21, p27) | Potential for microenvironment-directed therapy |
| PI3K/AKT | Contextual Regulation | AKT inhibition induces dormancy; AKT3 promotes awakening | AKT3-specific inhibitors in development |
| AXL-TBK1-AKT3 Cascade | Reactivation Driver | Promotes EMT and metastatic outgrowth | Novel target for preventing metastasis |
| FBXW7 | Dormancy Enforcement | Targets cyclin E and c-Myc for degradation | Potential stabilization strategy |
Microenvironmental Niches and Immune Evasion
The tumor microenvironment plays a decisive role in maintaining DTC dormancy through direct cell-cell contact and paracrine signaling. Bone marrow mesenchymal stem cells (MSCs) drive dormancy via TGF-β and BMP signaling [102], while fascinatingly, breast cancer cells can cannibalize MSCs, potentially acquiring dormant phenotypes through TWIST1 and MAPK upregulation [102]. MSC-derived extracellular vesicles can further reduce proliferation while enhancing adhesion of cancer cells [102].
Immune interactions present a particular paradox: while the immune system can recognize and eliminate cancer cells, dormant DTCs employ multiple evasion strategies. The "relative scarcity hypothesis" proposes that extremely low DTC numbers and large physical distances from effector T cells prevent productive immune encounters [105]. Additionally, dormant DTCs actively downregulate MHC class I molecules through unfolded protein response activation, rendering them invisible to CD8+ T cells [105], and may upregulate immune checkpoint proteins like PD-L1 to resist T-cell attack [105]. Natural killer (NK) cells may paradoxically induce dormancy via interferon signaling rather than clearance [105], highlighting the complex immunobiology of dormant niches.
Diagram 1: Molecular networks regulating DTC dormancy and reactivation. Key pathways maintain dormancy (left) or drive reactivation (right), with chemotherapy-induced NETs identified as a potent reactivation signal.
Detection and Monitoring Strategies for Dormant DTCs
Current Clinical Detection Methods
The direct detection of dormant DTCs presents significant technical challenges due to their rarity and quiescence. The SURMOUNT clinical trial has demonstrated the feasibility of detecting DTCs in bone marrow of breast cancer survivors with no other evidence of disease [103]. This procedure involves bone marrow biopsies with cells drawn from the hip bone, followed by sophisticated analysis to identify rare DTCs based on cellular markers. Importantly, psychological evaluations integrated into this trial revealed that approximately 80% of participants experienced reduced distress levels after DTC testing—regardless of results—addressing concerns that such monitoring might increase patient anxiety [103].
Emerging Biomarkers and Signatures
Advanced molecular profiling is revealing potential biomarkers for identifying patients at high risk of late recurrence. Single-cell RNA-sequencing has confirmed nearly 400 genes with altered expression in dormant cancer cells within bone niches [102]. Multiomics analysis further provides insights into both genetic and non-genetic mechanisms governing dormancy across cancer types [102]. Particularly promising is AKT3 nuclear localization, which is associated with metastatic disease and worse outcomes in breast and pancreatic cancer, potentially serving as both biomarker and therapeutic target [94]. Epigenetic modifications are also emerging as key regulators, with TGF-β and p38 signals stimulating macroH2A1/2 overexpression to induce reversible dormancy in head and neck squamous cell carcinoma [102].
Table 2: Detection Methods and Biomarkers for Dormant DTCs
| Method/Biomarker | Principle | Application | Limitations |
|---|---|---|---|
| Bone Marrow Biopsy & DTC Analysis | Direct detection of rare cells in bone marrow | SURMOUNT trial: identifying patients with minimal residual disease | Invasive procedure; requires specialized analysis |
| AKT3 Nuclear Localization | Marker of AXL-TBK1-AKT3 pathway activation | Predicting metastatic risk in breast/pancreatic cancer | Not yet validated in large cohorts |
| scRNA-seq Signatures | 400+ genes differentially expressed in dormant DTCs | Understanding dormancy mechanisms | Technically challenging for routine use |
| Epigenetic Modifications | macroH2A1/2, H3K4 methylation patterns | Assessing dormancy potential across cancer types | Still in basic research phase |
| Immune Evasion Markers | MHC I downregulation, PD-L1 expression | Identifying immune-resistant DTC populations | Heterogeneous expression |
Therapeutic Approaches for Dormant DTC Eradication
Targeted Therapeutic Strategies
Novel approaches specifically designed to target dormant DTCs are showing promising results in clinical trials. The CLEVER trial (phase II) tested FDA-approved drugs that target crucial cellular pathways used by dormant cells during their hibernation state [103]. The results demonstrated that DTCs were cleared from more than 80% of patients across all study arms, with no relapses within four years among patients who achieved clearance [103]. Building on this success, two new trials—ABBY and PALAVY—are exploring additional drugs that can eliminate DTCs alone or in combination [103].
Immunotherapy strategies are being re-evaluated for dormant DTC targeting. While traditional immune checkpoint inhibitors have shown limited efficacy against dormant cells, approaches that increase T cell/DTC ratios through adoptive transfer of antigen-specific CD8+ T cells or CAR-T cells have demonstrated enhanced DTC clearance in preclinical models [105]. The challenge of "relative scarcity" may be overcome by dramatically increasing effector cell numbers, though research indicates this approach may eventually plateau rather than achieve 100% elimination [105].
Innovative Biological Approaches
Gene therapy-based strategies represent a frontier in dormancy management. One approach involves genetically modifying niche cells to produce IL-1 receptor antagonist (IL1Ra), which "switches off" IL-1β signaling and prevents reawakening of dormant cells in bone [104]. Since bone acts as a reservoir for DTCs, maintaining dormancy there could potentially reduce recurrence in other organs like lungs, liver, and brain [104].
Macrophage reprogramming offers another promising avenue. Macrophages have been shown to maintain breast cancer dormancy in the lung, and disruption of cancer-macrophage communication triggers reactivation [104]. Research is now focusing on shifting macrophages from cancer-promoting to cancer-suppressing functions through therapeutic interventions, including engineered cell therapies where macrophages are modified to consistently produce molecules with cancer-suppressive functions [104].
Experimental Models and Research Tools
Dormancy Modeling and Tracking Methodologies
Studying dormancy requires sophisticated experimental models that recapitulate the prolonged quiescence observed clinically. Label retention assays using 5-ethynyl-2'-deoxyuridine (EdU) or fluorescent cell-cycle indicators like mVenus-p27K- allow identification and tracking of quiescent populations [106]. Recent innovations include dormancy tracing tools that enable monitoring DTC fate after extended periods, helping distinguish true reactivation from expansion of rare pre-existing proliferative DTCs [106].
Organ-specific dormancy models have been developed through isolation of dormant (P2) and metastatic (P1) subpopulations from the human breast cancer cell line MCF10CA1h when inoculated into nude mice [106]. These models enable time-series analysis of DTC status with precise proliferation tracking, revealing that the majority of P2 DTCs (approximately 75%) remain in a non-proliferative state compared to their P1 counterparts [106].
The Scientist's Toolkit: Essential Research Reagents
Table 3: Key Research Reagents for Dormancy Investigation
| Reagent/Tool | Function/Application | Experimental Utility |
|---|---|---|
| mVenus-p27K- cell cycle indicator | Identifies quiescent cells and visualizes G0-G1 transition | Live monitoring of dormancy status in vitro and in vivo |
| EdU (5-ethynyl-2'-deoxyuridine) | DNA synthesis labeling for proliferation assessment | Pulse-chase experiments to identify label-retaining dormant cells |
| AKT3-specific molecular inhibitors | Selective inhibition of AKT3 isoform | Testing AKT3 role in reactivation without affecting AKT1/2 |
| Anti-C3 antibodies | Complement C3 detection in NETosis studies | Measuring chemotherapy-induced NET formation in lung |
| Dormancy tracing tools | Genetic lineage tracing of dormant DTC fate | Distinguishing true reactivation from expansion of proliferative DTCs |
| CXCL1 detection reagents | Chemokine measurement in NET formation | Assessing neutrophil recruitment and activation |
| scRNA-seq platforms | Single-cell transcriptomic profiling | Identifying heterogenous dormancy signatures in DTC populations |
Diagram 2: Experimental workflow for studying DTC dormancy and therapeutic interventions, highlighting key methodologies at each stage.
The battle against cancer recurrence requires confronting the biological challenge of dormant DTCs. Current research has illuminated key mechanisms maintaining dormancy and triggering reactivation, from microenvironmental signaling to immune evasion strategies. The development of AKT3-specific inhibitors and clinical success in clearing DTCs in over 80% of patients in the CLEVER trial represent significant advances [94] [103]. The surprising finding that chemotherapy-induced NETosis can awaken dormant DTCs underscores the need to consider unintended consequences of conventional treatments [106].
Future progress will depend on overcoming several key challenges: improving faithful dormancy models that recapitulate prolonged quiescence, especially for estrogen-receptor-positive breast cancer where latency periods are longest [104]; developing non-invasive detection methods to monitor dormant DTC burden over time; and addressing tumor heterogeneity through combination therapies that target multiple dormancy mechanisms simultaneously [102] [101]. The ongoing development of gene therapy approaches to modify niche environments and macrophage reprogramming strategies offer promising avenues for maintaining dormancy or eliminating DTCs without toxic systemic therapies [104].
As research advances, the paradigm is shifting from reactive cancer treatment to proactive prevention of recurrence. By targeting the biological processes that allow dormant DTCs to persist and reactivate, we move closer to a future where cancer survivors can live without fear of late recurrence, transforming metastatic cancer from a lethal diagnosis to a chronically managed condition.
Optimizing Clinical Trial Designs for Metastatic Prevention Therapies
Metastasis is the primary cause of cancer-related mortality, accounting for approximately 90% of cancer deaths [48] [1]. This complex, multi-step biological process involves tumor cell dissemination from the primary site, survival in circulation, and colonization of distant organs. The progression from a localized tumor to metastatic disease represents the final frontier in oncology, creating an urgent need for therapeutic strategies focused on interception and prevention [48]. The "seed and soil" hypothesis, first proposed by Paget in 1889, remains a fundamental concept, positing that successful metastasis requires compatible interactions between circulating tumor cells (the "seed") and the microenvironment of distant organs (the "soil") [1]. Modern research has expanded this to include the "multiclonal metastasis" theory, which acknowledges the collective contribution of various cancer cell subpopulations within primary tumors [1].
Understanding the biological mechanisms driving metastasis is paramount for designing effective prevention trials. Whole-genome comparisons reveal that while most cancer types maintain consistent genomic portraits between primary and metastatic stages, clear exceptions exist—including breast, prostate, thyroid, and kidney renal clear cell carcinomas—which undergo extensive genomic transformation in advanced stages [107]. These biological insights must inform clinical trial designs, particularly as the field shifts toward earlier intervention strategies and more sophisticated biomarker-driven approaches.
Key Biological Mechanisms Informing Trial Design
Molecular Drivers of Metastatic Progression
The metastatic cascade is orchestrated through dynamic interactions between cancer cells and their microenvironments. Research has identified several pivotal signaling pathways and regulatory mechanisms that represent promising targets for therapeutic intervention:
- Organ Tropism Mechanisms: Metastatic cells exhibit distinct organ-specific preferences driven by chemokine receptors, integrins, and adhesion molecules that create permissive niches in distant organs [1]. For example, the CXCR4/CXCL12 axis facilitates bone metastasis by directing cancer cells to marrow stromal cells that secrete CXCL12 [1].
- Genomic Evolution: Pan-cancer whole-genome analyses reveal that metastatic tumors generally display lower intratumour heterogeneity and conserved karyotypes compared to primary tumors, suggesting a single major subclone seeding event from the primary cancer [107]. However, specific cancer types (breast, prostate, thyroid, and kidney renal clear cell carcinomas) show significant genomic landscape transformation in advanced stages [107].
- Circulating Tumor Cell Dynamics: Recent research indicates that tumor infiltration into major blood vessels causes a sharp increase in circulating cancer cells just before death, contributing to blood clots and multiorgan failure [108]. This suggests that monitoring and targeting CTC-vessel interactions could represent a novel prevention strategy.
- Extracellular Vesicle-Mediated Pre-Metastatic Niche Formation: Tumor-derived exosomes and extracellular vesicles facilitate metastasis by modifying distant sites to support cancer cell colonization through immune modulation and tumor microenvironment reprogramming [48].
Established and Emerging Therapeutic Targets
Advances in understanding metastatic biology have revealed several promising targets for prevention therapies:
Table 1: Key Therapeutic Targets in Metastatic Prevention
| Target Class | Specific Targets | Biological Role | Therapeutic Approach |
|---|---|---|---|
| Receptor Tyrosine Kinases | EGFR, ROS1 | Drive proliferation and survival in specific cancer subtypes | Targeted inhibitors (e.g., osimertinib, zidesamtinib) |
| Signal Transduction Proteins | KRAS G12C, PIK3CA | Oncogenic drivers in multiple cancer types | Small molecule inhibitors (e.g., olomorasib, inavolisib) |
| Hormone Receptors | Estrogen Receptor (ESR1) | Key driver in hormone-responsive cancers | SERDs (e.g., camizestrant, imlunestrant) |
| Immune Checkpoints | PD-1/PD-L1 | Mediate immune evasion | Checkpoint inhibitors (e.g., pembrolizumab) |
| Cellular Stress Response | HSP90 | Chaperone protein critical for tumor development and immune evasion | HSP90 inhibitors (in development) |
Framework for Optimized Clinical Trial Designs
Biomarker-Enriched and Adaptive Trial Strategies
Modern metastasis prevention trials require sophisticated designs that account for tumor biology, resistance mechanisms, and dynamic disease evolution:
ctDNA-Guided Intervention: The phase 3 SERENA6 trial established a paradigm for real-time monitoring of resistance mutations using circulating tumor DNA (ctDNA) [109]. This approach detected ESR1 mutations during first-line treatment, enabling early therapy switching to camizestrant before radiological progression [109]. This strategy significantly improved progression-free survival and represents a novel prevention framework for addressing evolving resistance mechanisms.
Continuing Effective Backbone Therapy: The COMPEL study demonstrated that continuing osimertinib beyond progression while adding chemotherapy extended progression-free survival to 8.4 months compared to 4.4 months with chemotherapy alone in EGFR-positive lung cancer [110]. This "backbone therapy" approach maintained targeted inhibition while addressing resistance, resulting in fewer new brain metastases [110].
Treatment Escalation Based on Molecular Risk: For patients with specific molecular alterations, upfront combination therapy may prevent resistance development. The FLAURA2 trial showed that adding chemotherapy to osimertinib in first-line EGFR-mutant NSCLC extended survival to 47.5 months versus 37.6 months with osimertinib alone [110].
Diagram 1: Biomarker-guided metastasis prevention trial framework
Endpoint Selection and Patient Stratification
Optimizing endpoint selection is critical for demonstrating clinical benefit in metastasis prevention trials:
Table 2: Endpoints for Metastasis Prevention Trials
| Endpoint Category | Specific Metrics | Advantages | Considerations |
|---|---|---|---|
| Primary Efficacy Endpoints | Metastasis-Free Survival (MFS), Invasive Disease-Free Survival (iDFS) | Direct measure of prevention effect, requires smaller sample size than OS | May require longer follow-up than PFS |
| Secondary Endpoints | Overall Survival (OS), Progression-Free Survival (PFS), Quality of Life (QoL) | Established regulatory acceptance, captures overall benefit | OS may be confounded by subsequent therapies |
| Novel Biomarker Endpoints | ctDNA clearance, Circulating Tumor Cell (CTC) count reduction | Early indicator of efficacy, enables adaptive designs | Requires analytical and clinical validation |
| Patient-Reported Outcomes | Treatment tolerability, Symptom burden, Functional status | Captures patient experience, important for risk-benefit assessment | Subject to reporting bias |
Effective patient stratification requires understanding distinct risk categories:
- High-Risk Molecular Subgroups: Patients with specific genomic alterations (e.g., PIK3CA mutations in HR+ breast cancer) derive substantial benefit from targeted prevention approaches. The INAVO120 trial showed that adding inavolisib to standard therapy improved overall survival by 34 months versus 27 months in this subgroup [109].
- Early Detection of Resistance: Monitoring for emerging resistance mutations (e.g., ESR1 mutations in breast cancer) enables pre-emptive intervention before radiographic progression [109].
- Minimal Residual Disease (MRD) Positive: Patients with detectable ctDNA following curative-intent therapy represent an ultra-high-risk population ideal for intensification studies.
Experimental Protocols and Methodologies
Core Assays for Metastasis Research and Monitoring
Robust biomarker assessment requires standardized methodologies throughout the trial lifecycle:
ctDNA Analysis Protocol:
- Sample Collection: Plasma collection in cell-free DNA blood collection tubes at baseline, every treatment cycle (typically 4 weeks), and at progression
- Processing: Double-centrifugation protocol within 2-6 hours of collection to prevent genomic DNA contamination; plasma storage at -80°C
- Extraction: Cell-free DNA isolation using silica membrane or magnetic bead-based methods; quality assessment via fluorometry
- Analysis: Tumor-informed or tumor-agnostic assays using PCR or next-generation sequencing (NGS) panels covering relevant mutations
- Interpretation: Variant calling with unique molecular identifiers for error suppression; threshold of ≥0.5% variant allele frequency typically considered clinically actionable
Circulating Tumor Cell (CTC) Detection:
- Enrichment: Immunomagnetic separation using epithelial cell adhesion molecule (EpCAM) antibodies or size-based filtration approaches
- Characterization: Immunofluorescence staining for epithelial (CK8,18,19), leukocyte (CD45), and nuclear (DAPI) markers
- Enumeration: Microscopic or automated counting with cutoff of ≥5 CTCs/7.5ml blood considered prognostically significant
- Molecular Analysis: Single-cell isolation for genomic profiling or functional characterization
Novel Viral Immunotherapy Assessment:
- Mechanism: CAN-2409 uses modified adenovirus to deliver HSV-tk gene into tumor cells, followed by valacyclovir administration to trigger localized cytotoxic effect [110]
- Response Monitoring: Tumor imaging, immune cell infiltration analysis via paired biopsies, and cytokine profiling
- Efficacy: Phase 2a data in NSCLC showed overall survival of 24.5 months with 37% of patients alive at two years despite prior progression on checkpoint inhibitors [110]
The Scientist's Toolkit: Essential Research Reagents
Table 3: Essential Research Reagents for Metastasis Studies
| Reagent Category | Specific Examples | Research Application | Functional Role |
|---|---|---|---|
| Molecular Profiling | NGS panels for ESR1, PIK3CA, KRAS mutations; ctDNA isolation kits; digital PCR assays | Mutation detection, therapy selection, resistance monitoring | Enables real-time assessment of tumor evolution and treatment response |
| Cell Culture Models | Patient-derived organoids, 3D invasion matrices, circulating tumor cell lines | Studying invasion mechanisms, drug screening, microenvironment interactions | Recapitulates tumor heterogeneity and metastatic niche interactions |
| Immunoassay Kits | Multiplex cytokine panels, extracellular vesicle isolation kits, phosphoprotein assays | Tumor microenvironment analysis, signaling pathway activation | Quantifies protein-level changes in response to therapeutic intervention |
| In Vivo Imaging | Bioluminescence reporters, intravital microscopy windows, micro-CT imaging | Tracking metastatic spread in real-time, assessing treatment efficacy | Visualizes spatiotemporal dynamics of metastasis in living organisms |
| Animal Models | Patient-derived xenografts (PDX), genetically engineered mouse models (GEMMs), metastatic tail vein injection models | Preclinical efficacy testing, understanding organotropism | Provides in vivo context for metastasis prevention strategies |
Future Directions and Implementation Challenges
Emerging Therapeutic Platforms and Trial Methodologies
The landscape of metastasis prevention is rapidly evolving with several promising approaches:
- Next-Generation Targeted Therapies: PROTACs (PROteolysis TArgeting Chimeras) represent a novel therapeutic class that targets proteins for degradation rather than simple inhibition. The VERITAC-2 trial demonstrated that the PROTAC vepdegestrant significantly improved progression-free survival compared to fulvestrant (5 months vs. 2.1 months) in ER-positive breast cancer with ESR1 mutations [109].
- Antibody-Drug Conjugates (ADCs): These targeted payload delivery systems are moving into earlier treatment lines. The DESTINY-Breast09 trial showed that T-DXd with pertuzumab reduced risk of progression or death compared to standard THP regimen in HER2-positive metastatic breast cancer (70% vs. 52% at 2 years) [109].
- Cancer Vaccines: Emerging vaccine platforms target tumor-specific antigens to generate immune-mediated protection. A phase 1 αlactalbumin vaccine trial in triple-negative breast cancer showed >70% of participants had expected immune responses with favorable safety [111].
- Novel Clinical Trial Endpoints: Composite endpoints incorporating molecular response (ctDNA clearance) with traditional radiographic assessments may accelerate drug development and enable smaller, more efficient trial designs.
Implementation Challenges and Considerations
Despite promising advances, several challenges remain in optimizing metastasis prevention trials:
- Biomarker Validation: Prospective validation of predictive biomarkers requires large sample sizes and careful analytical verification before implementation in clinical trials.
- Resistance Mechanisms: Tumor plasticity and adaptive signaling necessitate combination approaches and repeated biomarker assessment throughout treatment.
- Toxicity Management: Prevention therapies in earlier disease settings require favorable therapeutic indices, as demonstrated by imlunestrant which maintained quality of life while improving efficacy [109].
- Statistical Considerations: Event-based endpoints in prevention trials may require longer follow-up, while novel surrogate endpoints need correlation with clinical benefit.
Diagram 2: Metastasis research and therapeutic development pipeline
Optimizing clinical trial designs for metastasis prevention requires deep integration of biological insights with innovative methodological approaches. The evolving understanding of metastatic mechanisms—from genomic evolution and organotropism to resistance development—provides the foundation for intercepting this lethal process. Successful trial designs will incorporate robust biomarker strategies, appropriate endpoint selection, and adaptive methodologies that respond to dynamic disease changes. As therapeutic platforms advance—including next-generation targeted therapies, immunotherapy combinations, and novel modalities like PROTACs—clinical trials must evolve in parallel to efficiently demonstrate meaningful clinical benefits. Through thoughtful trial optimization grounded in metastatic biology, the field can transform metastasis from an inevitably lethal event to a preventable complication of cancer.
Validating Targets and Comparative Analysis of Models and Modalities
The lethal progression of most solid tumors is driven by metastasis, a complex biological process wherein cancer cells disseminate from the primary tumor to establish secondary growths in distant organs. Understanding the biomarkers associated with this cascade is critical for early detection, prognosis, and therapeutic intervention. This biological continuum involves several key events: local invasion, intravasation into circulation, survival as circulating tumor cells (CTCs), extravasation at distant sites, and formation of disseminated tumor cells (DTCs) and eventual metastatic colonies [112].
Epithelial-to-mesenchymal transition (EMT) has been identified as a critical driver of metastasis, endowing cancer cells with enhanced migratory and invasive capabilities. Recent research has uncovered a key signaling cascade in which stimulation of the AXL receptor tyrosine kinase promotes EMT through activation of TBK1, which in turn specifically activates AKT3, a member of the AKT family. This AXL-TBK1-AKT3 signaling axis stabilizes proteins in the nucleus that regulate EMT and has been associated with metastatic disease and worse outcomes in breast and pancreatic cancers [94]. The detection and validation of biomarkers across this metastatic spectrum—from CTCs and DTCs to serum-based markers—represent a frontier in precision oncology with profound implications for patient management.
Circulating Tumor Cell Biomarkers: Beyond Epithelial Markers
CTCs have emerged as crucial biomarkers in cancer detection and prognosis, with their molecular profiling gaining importance in precision oncology. Liquid biopsies, which allow extraction of CTCs, circulating tumor DNA (ctDNA), or cell-free DNA (cfDNA), offer measurable advantages over traditional tissue biopsies, particularly when molecular material is difficult to obtain. However, this approach faces significant challenges, primarily due to high cellular heterogeneity, which remains the main obstacle to achieving high diagnostic accuracy [112].
The Challenge of Heterogeneity and EMT
A fundamental biological challenge in CTC detection stems from the dynamic process of EMT. Not all cells undergo EMT simultaneously, resulting in a large population of hybrid CTCs that express both epithelial and mesenchymal markers. Since traditional diagnostic tools primarily detect epithelial markers, they are often unable to detect cells with hybrid phenotypes, leading to false negatives [112].
Table 1: Emerging Biomarkers for CTC Detection
| Biomarker | Biological Function | Utility in CTC Detection |
|---|---|---|
| Vimentin | Intermediate filament protein | Mesenchymal marker for hybrid CTCs |
| TWIST1 | Transcription factor | EMT regulator detection |
| SNAI1 | Transcription factor | EMT regulator detection |
| ZEB1 | Transcription factor | EMT regulator detection |
| Cadherins | Cell adhesion proteins | Switch from E- to N-cadherin |
| CD44 | Cell surface glycoprotein | Cancer stem cell association |
| TGM2 | Enzyme | Therapy resistance association |
| PD-L1 | Immune checkpoint protein | Immunotherapy response indicator |
| GATA | Transcription factor family | Developmental pathway link |
Experimental Protocols for CTC Detection
Advanced CTC detection methodologies now employ multi-marker approaches to address cellular heterogeneity:
Enrichment Phase: Initial enrichment using negative selection (removal of hematopoietic cells via CD45 depletion) or positive selection (targeting epithelial and/or mesenchymal markers).
Detection Phase: Multi-parameter immunofluorescence staining panels encompassing:
- Epithelial markers (e.g., EpCAM, cytokeratins)
- Mesenchymal markers (e.g., vimentin, N-cadherin)
- Hybrid markers (e.g., partial EMT signatures)
- Nuclear counterstain (DAPI) for cell identification
Analysis Phase: High-content imaging or flow cytometry with algorithmic classification to distinguish CTC subtypes based on combinatorial marker expression [112].
The integration of these comprehensive marker panels enables more accurate capture of the heterogeneous CTC populations, providing a more complete picture of the metastatic cascade.
Serum-Based Biomarkers and Lead Time Analysis
Serum biomarkers offer a less invasive approach for cancer detection and monitoring, with particular value in detecting recurrence earlier than conventional imaging. The "lead time" afforded by these biomarkers—the interval between biomarker detection and clinical symptom manifestation—is critical for improving patient outcomes, especially in aggressive malignancies like pancreatic ductal adenocarcinoma (PDA).
Machine Learning-Enhanced Biomarker Panels for PDA
Recent advances have demonstrated the power of combining multiple serum biomarkers with machine learning algorithms to significantly improve diagnostic accuracy. One study developed a serum protein biomarker panel using a Luminex bead-based immunoassay to measure 47 protein biomarkers in 355 individuals [113].
The experimental protocol involved:
Sample Collection: Serum samples obtained from patients with histologically confirmed PDA before any therapeutic intervention and from healthy controls.
Protein Quantification: Simultaneous measurement of 47 candidate proteins using the Luminex 200 system with xMAP technology, employing antibody-conjugated fluorescent beads for multiplexed detection.
Machine Learning Integration: Multiple ML algorithms (Random Forest, XGBoost, LightGBM, CatBoost, SVM, KNN) were trained on the biomarker data with five-fold cross-validation.
Feature Importance Analysis: SHapley Additive exPlanations (SHAP) analysis identified the most impactful biomarkers, revealing CA19-9, GDF15, and suPAR as key predictors.
Independent Validation: The model was validated in an independent cohort of 130 individuals, confirming robust performance [113].
This ML-integrated approach demonstrated remarkable performance, with the combined panel significantly outperforming CA19-9 alone in detecting PDA across all stages (AUROC 0.992 vs. 0.952) and in early-stage PDA specifically (AUROC 0.976 vs. 0.868) [113].
Table 2: Performance Metrics of ML-Enhanced Serum Biomarker Panel for PDA Detection
| Metric | CA19-9 Alone (Early Stage) | Combined Panel (Early Stage) | Combined Panel (All Stages) |
|---|---|---|---|
| AUROC | 0.868 | 0.976 | 0.992 |
| Sensitivity | Not specified | Significantly improved | Significantly improved |
| Specificity | Not specified | Maintained high | Maintained high |
| Validation Cohort AUROC | Not applicable | 0.987 | 0.977 |
Analytical Validation of Liquid Biopsy Assays
The validation of liquid biopsy assays requires rigorous analytical characterization. A recent study validated "Northstar Select," a plasma-based comprehensive genomic profiling (CGP) assay covering 84 genes, demonstrating the advancing sensitivity of these approaches [114] [115].
The validation protocol included:
Analytical Sensitivity Determination: Estimation of the 95% Limit of Detection (LOD) for different variant types using digital droplet PCR confirmation:
- SNV/Indels: 0.15% variant allele frequency (VAF)
- Gene fusions: 0.30% VAF
- Copy number variations (CNVs): 2.11 copies for amplifications, 1.80 copies for losses
Clinical Validation: Prospective head-to-head comparison with on-market CGP liquid biopsy assays in 182 patients, demonstrating identification of 51% more pathogenic SNV/indels and 109% more CNVs compared to existing assays.
Impact Assessment: Evaluation of clinical utility through reduction in null reports (45% fewer) and detection of clinically actionable variants at low VAFs (91% of additional actionable SNV/indels detected below 0.5% VAF) [114] [115].
Regulatory Frameworks for Biomarker Validation
The validation of biomarkers for clinical use requires adherence to evolving regulatory standards. In January 2025, the FDA finalized the "Bioanalytical Method Validation for Biomarkers - Guidance for Industry," which has generated significant discussion within the bioanalytical community [116].
Key Considerations in Regulatory Validation
The new guidance highlights several critical aspects:
Context of Use (COU): While not explicitly referenced in the guidance, the bioanalytical community emphasizes that biomarker validation must be informed by the specific context of use, whether for diagnostic, prognostic, predictive, or monitoring applications.
ICH M10 Application: The guidance directs use of ICH M10, which explicitly states it does not apply to biomarkers, creating a regulatory challenge that requires careful navigation.
Endogenous Molecule Considerations: Section 7.1 of ICH M10, "Methods for Analytes that are also Endogenous Molecules," provides relevant approaches for biomarkers, including:
- Surrogate matrix methods
- Surrogate analyte approaches
- Background subtraction techniques
- Standard addition methods
Parallelism Assessments: Required for both surrogate matrix and surrogate analyte approaches to ensure antibody binding equivalence between natural and surrogate references [116].
The regulatory landscape continues to evolve, emphasizing that biomarker assays in drug development extend far beyond the limited scope of bioanalytical assays designed for drug quantitation, requiring tailored validation strategies based on specific clinical objectives.
The Scientist's Toolkit: Essential Research Reagents
Table 3: Key Research Reagent Solutions for Metastasis Biomarker Research
| Reagent/Category | Specific Examples | Research Application |
|---|---|---|
| AKT3-Specific Inhibitors | First AKT3-specific molecule inhibitor [94] | Experimental blockade of AKT3 to confirm role in metastasis |
| Comprehensive Genomic Profiling Tests | FoundationOne CDx, FoundationOne Liquid CDx [117] | Tissue and blood-based genomic alteration screening |
| Liquid Biopsy Assays | Northstar Select [114] [115] | Detection of SNV/Indels, CNVs, fusions, MSI in plasma |
| Multiplex Protein Assay Platforms | Luminex xMAP technology [113] | Simultaneous measurement of multiple protein biomarkers |
| CTC Enrichment Systems | CD45 depletion, EpCAM capture [112] | Isolation of rare circulating tumor cells |
| EMT Marker Antibody Panels | Vimentin, TWIST1, SNAI1, ZEB1 antibodies [112] | Detection of epithelial-mesenchymal transition states |
| Machine Learning Algorithms | CatBoost, XGBoost, SHAP analysis [113] | Biomarker panel optimization and interpretation |
Signaling Pathways in Metastasis
The AXL-TBK1-AKT3 signaling cascade represents a recently elucidated pathway in metastasis. The following diagram illustrates this pathway and its role in driving metastatic progression:
AXL-TBK1-AKT3 Metastasis Signaling Pathway
This pathway illustrates the molecular mechanism through which the AXL receptor tyrosine kinase promotes EMT and metastasis via sequential activation of TBK1 and specific activation of AKT3. AKT3 then stabilizes proteins in the nucleus that regulate EMT, driving the invasive and migratory capabilities of cancer cells. Genetic removal or pharmacological inhibition of AKT3 dramatically blocks invasion and metastases without affecting primary tumor size, making it a promising therapeutic target [94].
Integrated Workflow for Biomarker Validation
The following diagram outlines a comprehensive workflow for biomarker validation, integrating analytical and clinical components:
Biomarker Validation Workflow Components
This integrated approach encompasses three critical domains: analytical validation establishing technical performance (limit of detection, sensitivity, specificity); clinical validation demonstrating performance in patient populations and clinical utility; and regulatory compliance addressing context of use and adherence to evolving guidelines such as the 2025 FDA Bioanalytical Method Validation for Biomarkers [116].
The field of biomarker validation is rapidly evolving, driven by advances in our understanding of metastatic biology and technological innovations in detection methodologies. The integration of multi-analyte approaches—encompassing CTCs with hybrid phenotypes, serum protein markers, and genomic alterations in ctDNA—provides a more comprehensive view of the metastatic process. The recent identification of specific signaling cascades like the AXL-TBK1-AKT3 axis offers not only new biomarkers for metastasis risk stratification but also potential therapeutic targets for intervention. As machine learning algorithms enhance our ability to interpret complex biomarker patterns and regulatory frameworks mature to ensure analytical rigor, the translation of these advances to clinical practice holds promise for fundamentally improving outcomes for patients with solid tumors. The continued refinement of biomarker validation pipelines, from analytical fundamentals to clinical implementation, remains essential to realizing the potential of precision oncology in combating metastatic disease.
The study of cancer metastasis, a complex multi-step process responsible for the majority of cancer-related deaths, relies heavily on in vitro models that can accurately mimic the in vivo microenvironment. This technical review provides a comprehensive comparison of four fundamental in vitro models—scratch assay, Transwell system, tumor spheroids, and organ-on-a-chip technology—within the context of metastasis research. We examine the underlying principles, technical protocols, applications, and limitations of each model, with a specific focus on their capacity to recapitulate key events in the metastatic cascade. The analysis highlights a progressive evolution from simple two-dimensional techniques to sophisticated three-dimensional, physiologically relevant systems. Quantitative comparisons and detailed methodological guidelines are provided to assist researchers in model selection and implementation. As the field advances, the integration of these complementary tools presents the most promising approach for bridging the gap between preclinical findings and clinical outcomes in solid tumor research.
Cancer metastasis is the primary driver of mortality in solid tumors, particularly in breast cancer where over 90% of cancer-related deaths are attributed to metastatic disease [118]. The metastatic cascade involves a sequence of events including local invasion, intravasation into circulation, survival in vasculature, extravasation, and colonization of distant organs. Replicating this complexity in preclinical models remains a significant challenge in oncological research [118]. Traditional two-dimensional (2D) cell cultures, while simple and reproducible, fail to capture the three-dimensional (3D) architecture, cell-extracellular matrix (ECM) interactions, and heterogeneous nature of in vivo tumors. Consequently, approximately 95% of cancer drugs effective in preclinical trials fail in clinical settings, with only 7.5% progressing beyond Phase I trials [118].
The scientific community has responded by developing increasingly sophisticated in vitro models that bridge the gap between conventional 2D cultures and animal models. This evolution is driven by the need for systems that better predict human responses while addressing ethical concerns associated with animal experimentation, as encapsulated by the 3R (Replacement, Reduction, and Refinement) principle [119]. This review systematically evaluates four prominent in vitro approaches—scratch assays, Transwell systems, tumor spheroids, and organ-on-a-chip platforms—focusing on their technical implementation, applications in metastasis research, and respective capacities to mimic physiological processes in solid tumors.
The selected models represent a technological continuum from simple, cost-effective methods to complex, physiologically relevant systems. Each offers unique advantages and suffers from distinct limitations, making them differentially suitable for specific research applications within the metastatic cascade.
Table 1: Core Characteristics of In Vitro Models in Metastasis Research
| Model Type | Dimensionality | Key Measured Parameters | Throughput | Relative Cost | Physiological Relevance |
|---|---|---|---|---|---|
| Scratch Assay | 2D | Collective migration rate, wound closure kinetics | High | Low | Low |
| Transwell System | 2.5D | Chemotactic migration, invasive capacity | Medium-High | Low-Medium | Low-Medium |
| Tumor Spheroid | 3D | Radial invasion, drug penetration, gradient formation | Medium | Medium | Medium-High |
| Organ-on-a-Chip | 3D Microphysiological | Dynamic interactions, shear stress responses, multi-tissue crosstalk | Low-Medium | High | High |
The progression from 2D to 3D models introduces critical physiological parameters absent in simpler systems. Three-dimensional models like spheroids spontaneously develop microenvironments with nutrient, oxygen, and metabolic gradients that create distinct cellular zones—proliferating on the exterior, quiescent in the middle, and necrotic at the core [119] [120]. This architecture closely mimics the cellular heterogeneity found in solid tumors and significantly influences treatment responses [120]. Furthermore, advanced models incorporate dynamic fluid flow and mechanical cues, essential factors in metastasis that are completely absent in static cultures.
Scratch Assay
Principles and Applications
The scratch assay, also known as the wound healing assay, is a straightforward, cost-effective method for measuring collective two-dimensional cell migration [121]. This technique simulates a wound-like scenario in a confluent cell monolayer, allowing researchers to monitor and quantify the rate at cells move to close the artificial gap. The assay is particularly valuable for initial screening of factors influencing cell motility, including pharmacological agents, growth factors, or genetic modifications [121] [122].
In the context of metastasis research, scratch assays provide insights into the initial stages of local invasion, where cancer cells migrate away from the primary tumor mass. The method enables the analysis of whole cell masses for collective migration behavior, which is relevant for epithelial cancers that often invade collectively rather than as single cells [121]. However, a significant limitation is its inability to replicate three-dimensional extracellular matrix interactions or the complex microenvironmental conditions that influence migration in vivo [118].
Detailed Experimental Protocol
Materials Required:
- Confluent monolayer of cells (e.g., breast cancer cell lines)
- 12-well or 24-well culture plates
- Appropriate growth medium (with serum, growth factors)
- Serum-free medium for synchronization
- Pipette tips (200 μL or 1000 μL for creating scratch)
- Sterile phosphate-buffered saline (PBS)
- Inverted microscope with digital camera
- Image analysis software (e.g., ImageJ with appropriate macros) [122]
Procedure:
- Cell Seeding and Culture: Seed cells in a multi-well plate at optimized densities. For primary human dermal fibroblasts, approximately 10,000 cells/well in a 24-well plate (5,263 cells/cm²) is appropriate, while for human epidermal keratinocytes (HEKa), 60,000 cells/well (31,578 cells/cm²) is recommended [122]. Culture until 90-100% confluent.
Cell Cycle Synchronization: Replace growth medium with serum-free basal medium for 18-24 hours to synchronize cells at the quiescent stage (G0) of the cell cycle. This minimizes the contribution of proliferation to wound closure [122].
Scratch Formation: Using a sterile pipette tip (200 μL or 1000 μL), create a straight, full-thickness scratch through the cell monolayer. Ensure the tip makes consistent contact with the bottom of the plate along the entire scratch length. Larger tips (1000 μL) create wider scratches (approximately 1100 μm vs. 800 μm for 200 μL tips), allowing for longer observation periods (36 hours vs. 24 hours) [122].
Washing and Media Replacement: Gently wash wells with PBS to remove detached cells and debris. Add serum-free medium containing minimal growth factors needed for cell survival, or experimental treatments.
Image Acquisition and Analysis: Immediately capture images of the scratch at marked locations using an inverted microscope. Re-image the exact same locations at predetermined intervals (e.g., 12, 24, 36 hours). Analyze images using software like ImageJ to measure scratch width or area at each time point. Calculate percentage wound closure as: (Initial area - Final area) / Initial area × 100 [121] [122].
Figure 1: Scratch Assay Workflow
Limitations and Mitigation Strategies
Despite its widespread use, the scratch assay presents several limitations. Manual scratch creation introduces variability in width, impacting closure kinetics and data interpretation [122]. The absence of ECM interactions and three-dimensional architecture significantly reduces physiological relevance [118]. Additionally, cell proliferation can confound migration measurements if not properly controlled through serum starvation or mitotic inhibitors [121].
To enhance reproducibility, researchers can implement standardized scratching tools (e.g., specialized pipette tips, mechanical scratchers), use uniform cell seeding densities, employ serum-free conditions during migration, and utilize automated image analysis protocols [122]. The ring assay variant, which confines cells within a barrier on ECM-coated surfaces, offers improved standardization of initial wound size and cell distribution [118].
Transwell Migration and Invasion Assay
Principles and Applications
The Transwell assay, also known as the Boyden chamber assay, measures directed cell migration (chemotaxis) and invasion through a porous membrane toward a chemoattractant gradient [123]. This system consists of two medium-filled chambers separated by a microporous membrane, with cells seeded in the upper chamber and chemoattractant placed in the lower chamber. The migration assay assesses spontaneous or chemotactic movement through uncoated membranes, while the invasion assay incorporates an extracellular matrix (e.g., Matrigel) barrier that only permits passage of cells with invasive capabilities [123] [118].
In metastasis research, Transwell assays model critical steps in the metastatic cascade, including local invasion through basement membranes and intravasation/extravasation across endothelial barriers [118]. The system enables quantitative comparison of migratory and invasive capacities between different cell types or treatment conditions, making it valuable for screening potential anti-metastatic compounds [123]. A recent study combining Transwell and scratch assays demonstrated that MitoQ, a mitochondria-targeted ROS inhibitor, effectively suppressed breast cancer cell migration, highlighting its potential as an early anti-metastatic agent [118].
Detailed Experimental Protocol
Materials Required:
- Transwell inserts (6.5 mm diameter, 5.0-8.0 μm pore size)
- Appropriate cell lines (e.g., B16-F10 melanoma, breast cancer cells)
- Cell culture medium with serum
- Migration buffer (e.g., DMEM + 10 mM HEPES + 0.1% BSA)
- Chemoattractant (e.g., recombinant SDF-1α, fibroblast-conditioned medium)
- Matrigel (for invasion assay)
- Crystal violet solution (0.2% w/v) or DAPI (1 μg/mL) for staining
- Cotton-tipped applicators
- Fixative (70% ethanol) [123]
Migration Assay Procedure:
- Cell Preparation: Culture cells to 80-90% confluence. For adherent cells, detach using trypsin-EDTA, wash with PBS, and resuspend in migration buffer at 1 × 10⁶ cells/mL [123].
Assay Setup: Add 600 μL migration buffer containing chemoattractant to the lower chamber. Place transwell insert, then add 100 μL cell suspension (1 × 10⁵ cells) to the upper chamber. Incubate at 37°C, 5% CO₂ for 2-5 hours (time varies by cell type) [123].
Post-Incubation Processing: For adherent cells, remove non-migrated cells from the apical side of the membrane using a cotton-tipped applicator. Fix migrated cells on the basal side with 70% ethanol for 10-15 minutes.
Staining and Quantification: Stain fixed cells with crystal violet or DAPI. For crystal violet, visualize using colorimetric detection; for DAPI, use fluorescence microscopy. Count migrated cells in multiple fields or extract and measure stain intensity [123].
Invasion Assay Modifications:
- Pre-coat transwell membranes with 50-100 μL diluted Matrigel (1:1 to 1:2 with sterile water) and incubate at 37°C for 30-60 minutes to allow gel formation.
- Seed cells onto the solidified Matrigel layer.
- Extend incubation time to 16-24 hours to permit matrix degradation and invasion.
- After incubation, carefully remove Matrigel and non-invaded cells using cotton-tipped applicators before fixation and staining [123].
Figure 2: Transwell Assay Workflow
Limitations and Research Gaps
The Transwell assay, while more advanced than scratch assays, still presents significant limitations. The system lacks real-time visualization capacity, preventing observation of dynamic migratory behaviors [118]. It oversimplifies cell-ECM interactions by presenting a two-dimensional membrane surface rather than a three-dimensional matrix, and lacks critical microenvironmental conditions such as fluid shear stress and complex stromal interactions [118]. Additionally, the establishment of a stable chemoattractant gradient can be challenging, particularly during longer incubation periods.
Recent adaptations have aimed to address some limitations. Co-culture systems incorporating endothelial cells on the membrane better model intravasation/extravasation events [118]. However, the assay remains fundamentally limited in its ability to replicate the complexity of in vivo invasion, necessitating complementary approaches for comprehensive metastasis research.
Tumor Spheroid Models
Principles and Applications
Tumor spheroids are three-dimensional cellular aggregates that recapitulate critical features of solid tumors, including architectural organization, gradient-driven heterogeneity, and cell-ECM interactions [119] [124]. As scaffold-free systems, spheroids form through self-assembly of cells that produce their own extracellular matrix, creating a more physiologically relevant microenvironment than 2D cultures [119]. Large spheroids (diameter >500 μm) develop distinct concentric zones: an outer proliferating layer, intermediate quiescent region, and central necrotic core—mimicking the cellular heterogeneity and metabolic gradients of in vivo tumors [120].
In metastasis research, spheroid models are particularly valuable for studying local invasion, drug penetration, and therapeutic resistance mechanisms [124]. When embedded in ECM-mimetic hydrogels (e.g., collagen, Matrigel), invasive cells extend protrusions radially into the surrounding matrix, enabling quantitative assessment of invasion potential [118]. This approach effectively distinguishes between aggressive (e.g., triple-negative breast cancer) and less invasive subtypes, with mesenchymal-like cells demonstrating greater invasiveness than luminal types [118]. Spheroid models also facilitate investigation of tumor cell interactions; for example, studies have shown that invasive cells can promote the migration of non-invasive neighbors through matrix degradation and invadopodia formation [118].
Spheroid Formation Techniques
Multiple methods exist for generating tumor spheroids, each with distinct advantages and limitations:
Table 2: Comparison of Spheroid Formation Techniques
| Technique | Principles | Advantages | Disadvantages |
|---|---|---|---|
| Liquid Overlay | Cells cultured on non-adherent surfaces (agar/agarose) prevent attachment, promoting self-aggregation [119] | Simple, economical, suitable for co-cultures | Limited control over spheroid size, variability in spheroid formation |
| Hanging Drop | Cells placed in hanging drops forced to aggregate at liquid-air interface [124] | Reproducible size and shape, simple setup | Low throughput, difficult to manipulate, limited spheroid size |
| Pellet Culture | Centrifugal force pellets cells to bottom of tube, encouraging aggregation [119] | Rapid formation, controllable size via cell number | Low yield (one spheroid/tube), unmanageable for high-throughput |
| Rotary Cell Culture System | Cells grown in continuously rotating vessels maintained in free-fall [120] | High yield, uniform spheroids, suitable for large spheroids | Specialized equipment required, longer formation time |
Recommended Protocol for Pellet Culture:
- Prepare single-cell suspension at appropriate density (e.g., 200,000 cells for 800-900 μm spheroids).
- Transfer to conical centrifuge tube and pellet cells by centrifugation (e.g., 200-250 × g for 5 minutes).
- Carefully remove supernatant without disturbing pellet.
- Resuspend pellet in spheroid culture medium and transfer to multi-well plates with cell-repellent surface.
- Culture for 24 hours to form compact aggregates before experimental use [119] [120].
Spheroid Invasion Assay and Quantification
Materials Required:
- Pre-formed tumor spheroids
- ECM hydrogel (e.g., collagen, Matrigel)
- 24-well or 96-well plates
- Serum-free medium
- Inverted microscope with imaging capabilities
- Image analysis software (e.g., AnaSP) [120]
Procedure:
- Spheroid Embedding: Mix pre-formed spheroids with ECM solution (e.g., collagen at 2-3 mg/mL concentration) on ice. Quickly transfer to multi-well plates and incubate at 37°C for 30 minutes to allow gel polymerization.
Media Overlay: Carefully add serum-free medium or treatment solutions on top of the polymerized gel.
Image Acquisition: Capture brightfield images at regular intervals (e.g., 0, 24, 48, 72 hours) using an inverted microscope. Maintain consistent imaging positions and magnification.
Quantitative Analysis: Use specialized software (e.g., AnaSP) to measure morphological parameters including:
- Spheroid area and volume
- Invasive area (total area minus original spheroid area)
- Invasive index (ratio of invasive area to original area)
- Number and length of invasive protrusions [120]
Critical Consideration: Pre-select spheroids of homogeneous volume and shape to minimize data variability. Both spheroid volume and sphericity index significantly affect treatment response and invasion capacity [120].
Applications in Therapeutic Screening
Three-dimensional spheroid models have demonstrated particular utility in drug screening applications, providing more clinically predictive data than 2D cultures. Their resistance to chemotherapeutic agents more closely mirrors in vivo responses, attributed to factors including limited drug penetration, presence of quiescent cell populations, and altered expression of drug resistance genes [124] [120]. This enhanced predictive capacity makes spheroid models valuable for preclinical drug development, potentially reducing the high attrition rates of anticancer drugs in clinical trials.
The utility of spheroid models extends across multiple therapeutic domains:
- Conventional Chemotherapy: Evaluation of drug penetration and efficacy against heterogeneous cell populations [120]
- Radiotherapy: Assessment of radiation response in oxygen-gradient systems [119]
- Nanomedicine: Testing of nanocarrier distribution and tumor accumulation [124]
- Immunotherapy: Co-culture with immune cells to study tumor-immune interactions [124]
Organ-on-a-Chip Technology
Principles and Applications
Organ-on-a-chip (OoC) platforms represent the most advanced in vitro models, combining microfluidic technology with tissue engineering to recapitulate the minimal functional unit of human organs in a controlled microenvironment [125]. These systems typically incorporate continuous perfusion, mechanical stimuli (e.g., fluid shear stress, cyclic strain), and multi-cellular architectures that closely mimic organ-level physiology [125]. When applied to cancer research, OoC devices model critical aspects of the metastatic cascade with unprecedented physiological relevance, including intravasation, circulation under flow, and extravasation at distant sites [118].
The technology's key advantage lies in its capacity to replicate dynamic physiological events impossible to achieve in static cultures. Microfluidic platforms can simulate vascular structures, enabling real-time visualization of cancer cell intravasation or circulation under physiologically relevant shear stress conditions [118]. Multi-organ-on-a-chip systems further permit investigation of organ-specific metastasis by connecting tissue compartments via microfluidic channels, modeling the hematogenous spread of cancer cells to preferred metastatic sites [125].
Design Considerations and Fabrication
Key Design Elements:
- Microfluidic Architecture: Channel designs that recreate tissue-tissue interfaces, concentration gradients, and fluid mechanical cues relevant to specific organs [125]
- Biomimetic Materials: Shift from conventional PDMS (which absorbs small hydrophobic molecules) to alternative materials with improved properties, or surface-treated PDMS to minimize compound absorption [125]
- Cell Sources: Integration of physiologically relevant cells including patient-derived primary cells, induced pluripotent stem cells (iPSCs), and organoids to enhance clinical predictivity [125]
- Sensing Integration: Incorporation of biosensors for real-time monitoring of metabolic activity, barrier integrity, and physiological responses [125]
Basic Fabrication Workflow:
- Chip Design: Create digital designs for microfluidic channels and chambers using CAD software.
- Master Fabrication: Fabricate silicon masters using soft lithography or alternative techniques.
- Replica Molding: Cast polymer (e.g., PDMS) against master to create microfluidic features.
- Bonding: Irreversibly bond polymer layer to glass substrate or other polymer layers using oxygen plasma treatment.
- Sterilization: Sterilize chips using autoclaving, UV irradiation, or ethanol treatment.
- Extracellular Matrix Coating: Introduce appropriate ECM proteins (e.g., collagen, fibronectin) into microchannels.
- Cell Seeding: Introduce cell suspensions at appropriate densities into designated compartments. [125]
Modeling Metastasis in Organ-on-a-Chip Platforms
Organ-on-a-chip technology enables researchers to model specific steps of the metastatic cascade with high fidelity:
Intravasation Model:
- Design incorporates tumor compartment adjacent to endothelial-lined microvessel
- Applications: Real-time imaging of cancer cell transmigration across endothelium
- Parameters: Cancer cell motility, endothelial barrier integrity, role of chemoattractants [118]
Circulating Tumor Cell (CTC) Analysis:
- Design incorporates fluidic channels with physiological flow rates
- Applications: Study of CTC survival under shear stress, adhesion to vessel walls
- Parameters: Cell viability, adhesion molecule expression, interaction with blood components [118]
Extravasation and Metastatic Niche Formation:
- Design incorporates target organ microenvironment (e.g., bone, liver, lung)
- Applications: Investigation of organotropic metastasis, early colonization events
- Parameters: Cancer cell extravasation, micrometastasis formation, stromal interactions [125] [118]
Figure 3: Modeling Metastatic Cascade in Organ-on-a-Chip Platforms
Challenges in Clinical Translation
Despite their sophisticated capabilities, organ-on-a-chip platforms face significant barriers to widespread clinical adoption. The technology typically requires specialized equipment and technical expertise, limiting accessibility for many research laboratories [118]. Issues with standardization, reproducibility, and scalability further impede integration into drug development pipelines [125]. Additionally, the complexity of these systems often reduces throughput compared to simpler models, making large-scale screening campaigns challenging.
Current research focuses on addressing these limitations through:
- Standardization: Development of standardized protocols, reference materials, and quality control measures [125]
- Automation: Integration of automated fluid handling, imaging, and analysis systems to enhance throughput and reproducibility [125]
- Commercialization: Availability of commercial platforms with user-friendly interfaces and validated protocols [125]
- Multi-organ Integration: Creation of body-on-a-chip systems that better predict systemic drug effects and multi-organ metastases [119] [125]
The Scientist's Toolkit: Essential Research Reagents
Table 3: Key Reagent Solutions for In Vitro Metastasis Models
| Reagent Category | Specific Examples | Applications | Technical Considerations |
|---|---|---|---|
| Extracellular Matrix Components | Matrigel, Collagen I, Fibrin, Hyaluronic Acid | 3D culture, invasion assays, substrate coating | Matrix stiffness, composition, and density significantly influence cell behavior; Matrigel lot-to-lot variability requires validation |
| Cell Culture Supplements | Fetal Bovine Serum (FBS), Epidermal Growth Factor (EGF), Basic Fibroblast Growth Factor (bFGF) | Cell proliferation, migration, stemness maintenance | Batch-to-batch variation in FBS can affect experimental reproducibility; defined serum-free formulations reduce variability |
| Chemoattractants | SDF-1α, C5a, Fibroblast-Conditioned Medium | Transwell migration, chemotaxis studies | Concentration gradient stability critical for assay performance; pre-test chemoattractant efficacy for specific cell types |
| Detection and Staining Reagents | Crystal Violet, DAPI, Calcein-AM, Propidium Iodide | Cell quantification, viability assessment, morphology visualization | Compatibility with imaging systems; photostability for time-lapse studies; penetration depth in 3D models |
| Cell Dissociation Agents | Trypsin-EDTA, Accutase, Collagenase | Cell passaging, spheroid dissociation | Enzyme selection impacts cell surface receptor integrity and subsequent cell behavior; mechanical dissociation alternatives for sensitive cells |
| Specialized Cultureware | Ultra-Low Attachment Plates, Transwell Inserts, Microfluidic Chips | Spheroid formation, migration studies, organ-on-a-chip models | Surface treatment consistency critical for reproducibility; pre-validation of cultureware performance recommended |
The comparative analysis of scratch, Transwell, spheroid, and organ-on-a-chip models reveals a clear trade-off between physiological relevance and practical accessibility in metastasis research. Simple 2D models like scratch assays offer high throughput and technical accessibility but lack the microenvironmental complexity necessary for clinically predictive findings. Transwell systems provide valuable information on directed migration but remain limited by their static nature and simplified ECM interactions. Tumor spheroids bridge critical gaps by introducing three-dimensional architecture, gradient-driven heterogeneity, and more physiologically relevant drug responses. Organ-on-a-chip platforms represent the current state-of-the-art, incorporating dynamic fluid flow, mechanical forces, and multi-tissue interactions that most closely mimic in vivo conditions.
The optimal model selection depends heavily on research objectives, available resources, and specific questions within the metastatic cascade. For preliminary screening, simpler models may provide sufficient information, while mechanistic investigations of specific metastatic steps increasingly require the sophistication of 3D and microphysiological systems. Future advancements will likely focus on standardizing complex models, improving their accessibility, and enhancing integration between complementary platforms. As no single system currently captures the full complexity of metastasis, combining these approaches in strategic workflows offers the most promising path toward bridging the gap between preclinical findings and clinical outcomes in solid tumor research.
Head-to-Head Evaluation of Targeted Therapies in Major Solid Tumors (NSCLC, Breast, CRC)
The evolution of targeted therapies has fundamentally reshaped treatment paradigms for non-small cell lung cancer (NSCLC), breast cancer, and colorectal cancer (CRC). This technical review provides a comprehensive, head-to-head evaluation of current targeted agents, emphasizing their efficacy, resistance mechanisms, and appropriate clinical contexts. Framed within the broader understanding of metastatic biology, we synthesize data from recent clinical trials and real-world evidence to guide therapeutic selection. The analysis systematically compares tyrosine kinase inhibitors, antibody-drug conjugates, and combination strategies across these malignancies, supplemented by detailed experimental methodologies for evaluating treatment response and metastasis-relevant signaling pathways essential for preclinical and clinical translation.
Non-Small Cell Lung Cancer (NSCLC) Targeted Therapy Landscape
The treatment of NSCLC is guided by its molecular profile, with targeted therapies demonstrating superior efficacy compared to conventional chemotherapy in biomarker-selected populations. The following table summarizes key comparative data for major targeted pathways in NSCLC.
Table 1: Head-to-Head Comparison of Major Targeted Therapies in NSCLC
| Therapeutic Target | Representative Agents | Key Trial Data (PFS, ORR) | Primary Resistance Mechanisms | Strategies to Overcome Resistance |
|---|---|---|---|---|
| EGFR | Osimertinib (3rd gen) | Median PFS: ~18.9 months (FLAURA trial); ORR: 80% [126] | EGFR C797S mutation, MET amplification, HER2 amplification, histologic transformation [126] | 4th-gen EGFR-TKIs (in dev.), combos with MET inhibitors (e.g., savolitinib + osimertinib in SAVANNAH) [126] |
| ALK | Alectinib, Lorlatinib | Alectinib (1st-line): Median PFS >34 months; Lorlatinib (post-alectinib): ORR ~39-48% [126] | ALK G1202R/L1196M mutations, IGF-1R upregulation [126] | Next-gen ALK inhibitors (e.g., TPX-0131), HSP90 inhibitors, combo therapies [126] |
| KRAS G12C | Sotorasib, Adagrasib | Sotorasib: ORR ~41%, median DOR 12.3 months; Adagrasib: ORR ~42.9% [126] | Secondary KRAS mutations, EGFR/MET pathway activation [126] | Combos with EGFR/MET inhibitors, SHP2 inhibitors, pan-KRAS inhibitors (e.g., RMC-6236) [126] |
| ROS1 | Repotrectinib, Entrectinib | Repotrectinib (TKI-naïve): ORR ~93%; (TKI-pretreated): ORR ~57% [126] | G2032R mutation, brain metastasis [126] | Next-gen TKIs (lorlatinib, repotrectinib), taletrectinib [126] |
| MET | Capmatinib, Tepotinib | Capmatinib (METex14): ORR ~65.6% (1L), ~51.6% (pretreated) [126] | MET amp, mutations in downstream pathways [126] | Combos with other targeted agents (e.g., EGFRi) [126] |
| HER2 | Trastuzumab Deruxtecan (T-DXd) | ORR: ~57.7% in HER2-mutant NSCLC [126] | HER2 structural alterations, impaired ADC internalization [126] | ADC optimization, TKI + ADC combos [126] |
A critical advancement in NSCLC is the recent accelerated FDA approval of datopotamab deruxtecan (Dato-DXd) for locally advanced or metastatic EGFR-mutated NSCLC post-systemic therapy. Pooled analyses from TROPION-Lung05 and TROPION-Lung01 trials demonstrated a confirmed overall response rate (ORR) of 45% with a median duration of response of 6.5 months, offering a chemotherapy-free option with boxed warnings for interstitial lung disease and ocular toxicity [127]. For managing resistance, the ORCHARD platform trial is evaluating novel combinations, including a first-in-human investigation of osimertinib plus Dato-DXd, showing encouraging preliminary activity [126].
Breast Cancer: Subtype-Specific Therapeutic Evaluation
Breast cancer management requires a nuanced approach based on molecular subtype (luminal A/B, HER2+, TNBC), which also dictates distinct patterns of metastatic organotropism [128]. The following table compares cornerstone and emerging targeted agents.
Table 2: Head-to-Head Comparison of Major Targeted Therapies in Breast Cancer
| Therapeutic Class/ Target | Representative Agents | Key Trial Data & Clinical Context | Resistance Mechanisms | Clinical Management Notes |
|---|---|---|---|---|
| CDK4/6 Inhibitors + Endocrine Therapy | Palbociclib, Ribociclib, Abemaciclib | Improved PFS in HR+/HER2- advanced BC (e.g., MONALEESA trials); Standard 1L for metastatic disease | RB1 loss, activating alterations in PI3K/AKT/mTOR, FGFR pathways | Used with AI in 1L or with Fulvestrant after progression on AI |
| HER2-Targeted ADCs | Trastuzumab Deruxtecan (T-DXd) | DESTINY-Breast04: mPFS ~9.9 mo in HER2-low mBC; Revolutionized tx for HER2-low and HER2+ disease | ADC efflux via extracellular vesicles, impaired internalization [126] | Boxed warning for ILD; Rechallenge after G1 ILD resolution is feasible with steroid pre-treatment [129] |
| PI3K Inhibitors | Alpelisib | SOLAR-1: mPFS ~11 mo (vs 5.7 mo placebo) in PIK3CA-mutated HR+/HER2- mBC post-endocrine therapy | Activation of upstream (ER) or parallel signaling pathways | For PIK3CA-mutated tumors; Managing hyperglycemia is key |
| PARP Inhibitors | Olaparib, Talazoparib | OlympiAD: Olaparib mPFS ~7.0 mo vs 4.2 mo chemo in germline BRCA-mutated HER2- mBC | HRR restoration, drug efflux pumps | For gBRCA-mutated HER2- advanced BC |
| Trop-2 ADCs | Sacituzumab Govitecan | ASCENT: mPFS ~4.8 mo (vs 1.7 mo chemo) in pretreated mTNBC; ORR ~31% | Trop-2 downregulation, efflux pumps | Later-line option for mTNBC |
Current clinical research focuses on de-escalation and optimization strategies. The NRG-BR007 (DEBRA) trial is evaluating whether endocrine therapy alone is non-inferior to endocrine therapy plus radiotherapy in low-risk, node-negative breast cancer, aiming to reduce overtreatment [130]. Furthermore, compelling real-world evidence presented at ASCO 2025 supports the safety of T-DXd rechallenge in metastatic breast cancer patients following low-grade interstitial lung disease (ILD). A multicenter analysis showed that with steroid intervention, most patients could resume therapy with prolonged clinical benefit and a manageable recurrence of ILD [129].
Colorectal Cancer (CRC): Expanding Beyond Traditional Targets
While CRC has historically had fewer targetable drivers, recent breakthroughs are expanding options, particularly in metastatic microsatellite stable (MSS) disease, which is notoriously resistant to immunotherapy.
Table 3: Head-to-Head Comparison of Major Targeted Therapies in Colorectal Cancer
| Therapeutic Target/Strategy | Representative Agents | Key Trial Data & Biomarker Context | Resistance Mechanisms | Clinical Context |
|---|---|---|---|---|
| EGFR Inhibition | Cetuximab, Panitumumab | Standard in RAS/BRAF wild-type mCRC; ORR ~50-60% in 3L+ | RAS mutations, BRAF mutations, MET amplification, HER2/MET amplification [126] | Contraindicated in RAS mutant tumors; used +/- chemo |
| VEGF Inhibition | Bevacizumab, Aflibercept, Regorafenib | Improved OS in mCRC across lines; Regorafenib is a TKI used in refractory mCRC | Upregulation of alternative pro-angiogenic factors | Used with chemo in 1L/2L; Regorafenib is later-line |
| BRAF V600E Inhibition | Encorafenib + Cetuximab | BEACON: mOS 9.3 mo vs 5.9 mo (control) in BRAF V600E mCRC | Reactivation of MAPK signaling | Combo therapy is standard for BRAF V600E mutant mCRC |
| HER2 Amplification | Trastuzumab + Pertuzumab, T-DXd | MOUNTAINEER: ORR ~38.1% in HER2+ mCRC; DESTINY-CRC01: ORR ~45.3% | HER2 spatial heterogeneity, impaired internalization [126] | For HER2-amplified, RAS wild-type mCRC |
| NTRK Gene Fusions | Larotrectinib, Entrectinib | ORR ~75-80% in NTRK-fusion solid tumors (pooled CRC data) | On-target TRK mutations | Rare but highly actionable; requires NGS for identification |
| Immunotherapy in MSS | Vilastobart + Atezolizumab | Phase II: ORR 27% in MSS mCRC without liver metastases; ctDNA decreases confirmed efficacy [129] | Immunosuppressive TME | Breakthrough for MSS (96% of mCRC); activity is subset-specific |
A significant development in CRC is the emergence of novel TKI and immunotherapy combinations. Data from the phase 3 STELLAR-303 trial showed that zanzalintinib (XL092) combined with atezolizumab significantly improved overall survival compared to regorafenib in previously treated metastatic CRC, highlighting the power of synergistic approaches in a difficult-to-treat population [127].
The Biological Framework: Metastasis and Organotropism
The efficacy of targeted therapies is constrained by the biological processes of metastasis, a complex cascade responsible for over 90% of cancer-related deaths [1] [128]. The distribution of metastatic cells to specific organs is non-random, a phenomenon termed "organotropism," which is governed by the interplay between tumor cells ("the seed") and the microenvironment of distant organs ("the soil") [1] [128].
- Breast Cancer Organotropism: Different molecular subtypes exhibit distinct metastatic preferences, which is critical for designing surveillance strategies and understanding the context of drug efficacy. Luminal A and B subtypes are more likely to metastasize to bone (65-75% of metastatic cases), whereas HER2+ and triple-negative breast cancers (TNBC) show a higher propensity for visceral metastases, including the brain and lungs [128]. HER2+ cancers are also particularly prone to liver metastasis [128].
- The "Seed and Soil" Hypothesis in Therapy: The establishment of a metastatic niche involves dynamic communication between cancer cells and host cells (e.g., stromal and immune cells) [48]. This microenvironment can foster resistance to therapies, including immune checkpoint inhibitors, by creating an immunosuppressive barrier [48]. Understanding these mechanisms is essential for developing next-generation therapies that can disrupt the metastatic niche and overcome treatment resistance.
The following diagram illustrates the key biological processes and molecular players in the metastatic cascade, providing a framework for understanding the challenges in treating advanced solid tumors.
Experimental Protocols for Evaluating Targeted Therapies
Robust preclinical and clinical methodologies are critical for the head-to-head evaluation of targeted agents. The following protocols are standard in the field.
In Vitro Drug Sensitivity and Resistance Profiling
Objective: To quantitatively assess the potency and efficacy of targeted therapies against cancer cell lines representing different molecular subtypes. Workflow:
- Cell Culture: Maintain relevant cancer cell lines (e.g., NCI-H1975 for EGFR L858R/T790M NSCLC, HCC1954 for HER2+ breast cancer) in optimized conditions.
- Compound Preparation: Prepare a 10 mM stock solution of each targeted agent (e.g., osimertinib, T-DXd, sotorasib) in DMSO and serially dilute to create a concentration gradient.
- Cell Seeding and Treatment: Seed cells in 96-well plates and treat with compounds 24 hours post-seeding. Include DMSO-only controls.
- Viability Assay: After 72-96 hours, measure cell viability using a CellTiter-Glo Luminescent Cell Viability Assay to quantify ATP.
- Data Analysis: Calculate IC₅₀ and IC₉₀ values using non-linear regression (four-parameter logistic curve) in software like GraphPad Prism.
In Vivo Efficacy Study in Patient-Derived Xenograft (PDX) Models
Objective: To evaluate the anti-tumor activity and toxicity of candidate therapies in a physiologically relevant model that recapitulates human tumor heterogeneity. Workflow:
- Model Generation: Implant patient-derived tumor fragments or cells subcutaneously into immunodeficient mice (e.g., NSG).
- Randomization and Dosing: When tumors reach ~150-200 mm³, randomize mice into treatment and control groups (n=8-10). Administer therapies at clinically relevant doses (e.g., osimertinib 5 mg/kg oral gavage daily; T-DXd 10 mg/kg IV weekly).
- Tumor Monitoring: Measure tumor volumes and body weights 2-3 times weekly.
- Endpoint Analysis: At study endpoint, harvest tumors for downstream analyses (IHC, RNA-seq). Key efficacy metrics include: %TGI (Tumor Growth Inhibition), and log₁₀ cell kill.
Model-Informed Drug Development (MIDD) for Clinical Translation
MIDD uses quantitative modeling to integrate data from nonclinical and clinical stages, supporting dose selection and trial design [131]. Key "Fit-for-Purpose" Modeling Approaches:
- Physiologically Based Pharmacokinetic (PBPK) Modeling: A mechanistic approach to predict human pharmacokinetics and drug-drug interaction potential from preclinical data, crucial for First-in-Human (FIH) dose selection [131].
- Quantitative Systems Pharmacology (QSP): Integrates systems biology and pharmacology to generate mechanism-based predictions on drug behavior and treatment effects across different patient populations [131].
- Exposure-Response (ER) Analysis: Analyzes the relationship between drug exposure and its effectiveness or adverse effects, which is fundamental for dose optimization in later-stage clinical trials [131].
The following diagram outlines a typical integrated pharmacokinetic/pharmacodynamic (PK/PD) and efficacy workflow used in translational drug development.
The Scientist's Toolkit: Essential Research Reagents and Platforms
Table 4: Key Research Reagent Solutions for Targeted Therapy Evaluation
| Reagent/Platform | Function/Application | Specific Examples & Notes |
|---|---|---|
| Validated Cell Line Panels | In vitro screening of drug sensitivity across molecular subtypes. | NCI-60 panel; Broad Institute's Cancer Cell Line Encyclopedia (CCLE); Subtype-specific lines (e.g., MCF-7, MDA-MB-231, PC-9). |
| Patient-Derived Xenograft (PDX) Models | In vivo evaluation of drug efficacy in a context preserving tumor heterogeneity and microenvironment. | Models from The Jackson Laboratory, Champions Oncology; Characterized for genomics and histology. |
| Circulating Tumor DNA (ctDNA) Assays | Non-invasive monitoring of tumor burden, clonal evolution, and emergent resistance mutations. | Guardant360, FoundationOne Liquid CDx; Used in clinical trials to correlate tumor shrinkage with ctDNA reduction [129]. |
| Quantitative PCR & Digital PCR | Highly sensitive detection and quantification of specific genetic alterations (e.g., mutations, fusions). | TaqMan assays; Droplet Digital PCR (ddPCR) for monitoring low-frequency resistance mutations (e.g., EGFR C797S). |
| Next-Generation Sequencing (NGS) | Comprehensive genomic profiling for identifying targetable drivers and resistance mechanisms. | Whole exome (WES) or targeted panels (FoundationOneCDx, MSK-IMPACT); Essential for identifying NTRK fusions, METex14 skipping. |
| Multiplex Immunofluorescence (mIF) | Spatial profiling of tumor immune microenvironment and protein biomarker co-expression. | Akoya Biosciences' Phenocycler platform; Panels for T-cells (CD3, CD8), macrophages (CD68), and checkpoint markers (PD-L1). |
| PBPK/PD Modeling Software | Simulating drug disposition and effect to inform dosing and trial design (MIDD). | GastroPlus, Simcyp Simulator; Used for FIH dose prediction and drug-drug interaction risk assessment [131]. |
Assessing the Therapeutic Potential of Immunotherapy in Micrometastatic Disease
Micrometastatic disease represents a critical therapeutic window in oncology, where disseminated cancer cells (DCCs) persist in a state of dormancy before progressing to lethal macrometastases. This whitepaper examines the evolving paradigm of immunotherapy for targeting micrometastases within the broader context of metastatic biology. Current evidence suggests that the low tumor burden and unique immune microenvironment of micrometastases present distinct advantages for immune modulation. We analyze mechanistic insights into immune evasion during the micrometastatic phase, explore experimental and clinical immunotherapeutic strategies, and provide detailed methodologies for investigating this promising frontier. The integration of novel biomarkers, spatial proteomics, and artificial intelligence-driven models is poised to accelerate the development of effective interventions aimed at eradicating minimal residual disease and achieving definitive cures in solid tumors.
The metastatic cascade represents the most lethal aspect of cancer progression, accounting for approximately 90% of cancer-related mortality [48] [1]. Within this cascade, micrometastatic disease constitutes a critical intermediate state where disseminated cancer cells (DCCs) have colonized distant organs but remain undetectable by conventional imaging modalities. The era of targeted therapies has significantly advanced our understanding of cancer growth and metastasis, yet intrinsic or acquired drug resistance remains a major challenge, rendering clinically overt metastatic disease incurable in most patients [50] [91]. Recent research has refocused attention on the micrometastatic niche as a therapeutic target for achieving definitive cures in advanced solid tumors.
The biological processes driving metastasis involve a complex multi-step cascade including local invasion, intravasation, survival in circulation, arrest at distant sites, extravasation, and colonization [1]. This process is governed by dynamic interactions between cancer cells ("seed") and the microenvironment of distant organs ("soil") [1]. Micrometastases represent a pivotal phase in this continuum where DCCs may enter prolonged dormancy or progress to clinically detectable lesions based on microenvironmental cues and immune interactions. The low tumor burden and distinct immune contexture of micrometastases present a unique window of opportunity for therapeutic intervention before the establishment of robust immunosuppressive networks that characterize macrometastatic disease [50].
Biological Basis of Micrometastatic Disease
The Seed and Soil Hypothesis in Micrometastasis
The "seed and soil" theory, introduced by Paget in 1889, provides a fundamental framework for understanding organ-specific metastasis patterns [1]. This theory posits that successful metastasis requires compatible interactions between circulating tumor cells (the "seed") and specific microenvironments of distant organs (the "soil"). In micrometastatic disease, this interplay determines whether DCCs remain dormant or progress to overt metastases. More recently, the "multiclonal metastasis" theory has highlighted the contribution of various cancer cell subpopulations within primary tumors to the metastatic process, underscoring the inherent heterogeneity of micrometastases [1].
Table 1: Key Signaling Pathways in Organ-Specific Micrometastasis
| Metastatic Site | Key Signaling Molecules | Biological Functions |
|---|---|---|
| Bone | RANK/RANKL, PTHrP, TGF-β, BMPs | Osteoclast activation, bone remodeling, niche formation |
| Liver | TGF-β, CXCL12, LOXL2 | Stromal activation, vascular co-option, immune suppression |
| Lung | TGF-β, VEGF, COX-2, MMPs | Extravasation, angiogenesis, inflammatory signaling |
| Brain | COX-2, HB-EGF, ST6GALNAC5 | Blood-brain barrier penetration, astrocyte interaction |
Immune Evasion Mechanisms in Micrometastasis
Micrometastases employ sophisticated mechanisms to evade immune surveillance, which differ substantially from those used by established macrometastases. Recent research has identified TIM3+ breast cancer cells as critical mediators of immune evasion during micrometastatic outbreak [132]. These cells demonstrate enhanced capacity for immune editing and utilize γδ T cells to establish an immunosuppressive niche. The transition from dormant micrometastases to proliferative lesions involves dynamic reprogramming of both cancer cells and their immune microenvironments.
The tumor microenvironment (TME) of micrometastases is characterized by a delicate balance between immune effector cells and immunosuppressive elements. In this early phase, the lower tumor burden correlates with reduced immune suppression compared to established metastases [50] [91]. This balance creates an opportunity for productive immune manipulation that becomes increasingly challenging as metastatic lesions progress and develop more complex immunosuppressive networks involving regulatory T cells (Tregs), myeloid-derived suppressor cells (MDSCs), and M2-polarized tumor-associated macrophages [133].
Diagram 1: Immune Evasion Mechanisms in Micrometastatic Progression. TIM3+ cancer cells and γδ T cell recruitment facilitate immune editing and dormancy maintenance, eventually progressing to macrometastases following immune equilibrium breakdown.
Therapeutic Strategies for Micrometastatic Disease
Immune Suppression-Inhibiting Immunotherapy (IS-IIT)
A novel therapeutic approach specifically designed for micrometastatic disease involves immune suppression-inhibiting immunotherapy (IS-IIT) [50] [91]. This strategy leverages the unique immunological characteristics of micrometastases, where lower tumor burden and reduced immune suppression create a favorable environment for immune manipulation. The mechanistic basis for IS-IIT protocols involves using serum tumor markers to track otherwise undetectable micrometastatic disease, providing a lead time for intervention before clinical manifestation [50] [91].
The proposed IS-IIT protocol aims to shift the immune balance toward effective anti-tumor responses by inhibiting immune suppression, potentially stabilizing the dormant state of DCCs in unstable metastatic niches or enabling innate and adaptive immune responses to eliminate cancer cells [91]. This approach contrasts with immunotherapy in established metastases, where higher tumor burden and entrenched immune suppression favor cancer cell proliferation and drug resistance [50].
Neoadjuvant and Intratumoral Immunotherapy
Neoadjuvant immunotherapy administered prior to surgery represents a promising strategy for targeting micrometastatic disease [133]. This approach aims to stimulate systemic anti-tumor immunity that can eradicate disseminated cells before they establish detectable metastases. Intratumoral immunotherapy (ITIT) enhances this effect by delivering immune stimulatory agents directly into the tumor, reversing local immune suppression while generating systemic anti-tumor responses through the "abscopal effect" [133].
ITIT modalities include:
- Oncolytic viruses (e.g., T-VEC, the first FDA-approved oncolytic virus)
- Cytokine-based therapies (e.g., IL-2, GM-CSF)
- Pattern recognition receptor agonists (e.g., TLR7/8/9 agonists, STING pathway agonists)
- Gene therapies (e.g., IL-12 plasmid, CD40 mRNA)
- Cell-based therapies (e.g., dendritic cell vaccines)
Table 2: Clinical Efficacy of Immunotherapy Approaches Across Solid Tumors
| Cancer Type | Therapeutic Approach | Clinical Outcomes | References |
|---|---|---|---|
| Triple-Negative Breast Cancer | Pembrolizumab + Chemotherapy (neoadjuvant) | Improved pCR, EFS, and OS | [134] |
| dMMR mCRPC | Anti-PD-(L)1 monotherapy | ORR: 46%, PSA decline ≥50%: 60%, median PFS: 7.7 mo | [135] |
| NSCLC (EGFR+) | Osimertinib (3rd-gen EGFR-TKI) | mPFS: 18.9 mo vs. 10.2 mo (comparator) | [91] |
| Various Solid Tumors | Intratumoral Immunotherapy | Local immune activation with systemic abscopal effects | [133] |
Overcoming Drug Resistance in Micrometastatic Therapy
Drug resistance remains a significant challenge in targeted therapies and immunotherapies for advanced cancers. Resistance mechanisms include:
- Target sequence mutations that impair drug-target binding
- Activation of alternative pathways that bypass target inhibition
- Tumor microenvironment-mediated suppression of immune responses
- Epigenetic dysregulation of key signaling pathways [91]
Spatial proteomics technologies have been pivotal in profiling tumor immune microenvironments at single-cell resolution, advancing our understanding of resistance mechanisms and identifying key cell populations in solid tumors [136]. These technologies enable researchers to investigate immunosuppressive cell populations that mediate cancer resistance, specifically regarding their localization, protein signatures, and surrounding interactions.
Experimental Models and Methodologies
In Vivo Models of Micrometastatic Disease
Murine models of metastatic breast cancer have provided crucial insights into immune evasion mechanisms during micrometastatic outbreak. The following protocol outlines key methodology for investigating TIM3-mediated immune evasion:
Experimental Protocol 1: Investigating TIM3-Mediated Immune Evasion in Breast Cancer Micrometastases
Cell Line Preparation:
- Utilize murine breast cancer cell lines (e.g., 4T1, E0771) or patient-derived xenografts
- Engineer luciferase-expressing variants for in vivo tracking
- Perform TIM3 knockout using CRISPR/Cas9 or knockdown with shRNA
Animal Modeling:
- Use immunocompetent syngeneic mice (e.g., BALB/c for 4T1, C57BL/6 for E0771)
- Inject 1×10^5 - 5×10^5 cells orthotopically into mammary fat pads or intravenously for experimental metastasis
- Monitor tumor growth weekly using caliper measurements and bioluminescent imaging
TIM3 Blockade Therapy:
- Administer anti-TIM3 monoclonal antibodies (e.g., RMT3-23 clone)
- Dosage: 100-200μg intraperitoneally, 2-3 times weekly
- Initiate treatment at various timepoints: early (day 3-7 post-injection) or late (established micrometastases)
Metastasis Analysis:
- Harvest organs (lungs, liver, bones, brain) at endpoint (4-6 weeks)
- Quantify metastatic burden through:
- Ex vivo bioluminescence imaging
- Histological examination (H&E staining)
- Immunofluorescence staining for cytokeratins
- Process for single-cell suspension and flow cytometry analysis of immune populations
Immune Profiling:
- Analyze tumor-infiltrating lymphocytes by flow cytometry (CD45+CD3+CD4+CD8+)
- Quantify immunosuppressive populations (Tregs: CD4+CD25+FoxP3+, MDSCs: CD11b+Gr-1+)
- Assess T cell functionality through intracellular cytokine staining (IFN-γ, TNF-α)
- Evaluate γδ T cell populations (CD3+TCRγδ+)
Spatial Proteomics for Micrometastatic Microenvironment Analysis
Spatial proteomics technologies enable comprehensive profiling of the tumor immune microenvironment at single-cell resolution, providing critical insights into therapeutic resistance mechanisms [136]. The following protocol details the application of spatial proteomics to micrometastatic disease:
Experimental Protocol 2: Spatial Proteomic Analysis of Micrometastatic Niches
Sample Preparation:
- Collect fresh-frozen or FFPE tissue sections from primary tumors and metastatic sites
- Prepare 5μm thick sections for spatial protein analysis
- Perform antigen retrieval optimized for phospho-epitope preservation
Multiplexed Ion Beam Imaging (MIBI):
- Conjugate antibodies with rare metal isotopes
- Incubate tissue sections with antibody panel (30-40 markers)
- Include markers for:
- Cancer cells: Pan-cytokeratin, EpCAM
- Immune cells: CD45, CD3, CD4, CD8, CD68, CD11b, CD11c
- Immune checkpoints: PD-1, PD-L1, TIM3, LAG3, CTLA-4
- Signaling molecules: pSTAT3, pAKT, pERK
- Functional markers: Ki67, cleaved caspase-3
Data Acquisition:
- Analyze sections using MIBI-TOF mass spectrometer
- Acquire images at 256×256 or 512×512 pixel resolution
- Collect data for 4-8 regions of interest per sample
Computational Analysis:
- Segment cells using nuclear and membrane markers
- Extract single-cell expression data for all markers
- Perform cluster analysis to identify cell phenotypes
- Conduct spatial analysis (neighborhood analysis, spatial autocorrelation)
- Map cell-cell interactions and communication networks
Diagram 2: Spatial Proteomics Workflow for Micrometastatic Niche Analysis. This pipeline enables comprehensive mapping of cellular interactions and microenvironment composition in micrometastases.
Serum Tumor Marker Kinetics for Monitoring Micrometastatic Burden
The lead time provided by serum tumor markers offers a valuable experimental approach for tracking otherwise undetectable micrometastatic disease progression [50] [91]. This methodology forms the mechanistic basis for novel protocols aimed at preventing relapse in high-risk cancer patients.
Experimental Protocol 3: Serum Tumor Marker-Guided Intervention for Micrometastatic Disease
Patient Selection:
- Identify high-risk patients following definitive treatment for primary tumors
- Include cancers with validated serum markers (e.g., CEA for colorectal, CA15-3 for breast, PSA for prostate)
- Establish baseline marker levels post-treatment
Monitoring Protocol:
- Collect serum samples monthly for the first year, quarterly for years 2-3
- Measure tumor markers using standardized immunoassays
- Define significant rise as: >50% increase from baseline or consecutive increases over 3 measurements
Intervention Trigger:
- Initiate IS-IIT protocol upon confirmed marker elevation in absence of radiographic disease
- Utilize immune suppression-inhibiting regimen rather than conventional chemotherapy
Response Assessment:
- Monitor marker kinetics following intervention
- Correlate marker changes with circulating tumor cell counts
- Validate with advanced imaging (PSMA-PET, FDG-PET) if markers continue to rise
Research Reagent Solutions for Micrometastasis Studies
Table 3: Essential Research Reagents for Micrometastasis and Immunotherapy Investigations
| Reagent Category | Specific Examples | Research Applications |
|---|---|---|
| Immune Checkpoint Modulators | Anti-TIM3 (RMT3-23), Anti-PD-1 (RMP1-14), Anti-PD-L1 (10F.9G2), Anti-CTLA-4 (9D9) | Blockade of inhibitory pathways in micrometastatic immune niches |
| Cytokine and Signaling Analysis | LEGENDplex panels, ProcartaPlex immunoassays, Phospho-kinase arrays | Multiplexed quantification of immune signatures and signaling pathways |
| Spatial Proteomics Platforms | CODEX, MIBI, Imaging Mass Cytometry | High-dimensional tissue analysis of micrometastatic microenvironment |
| In Vivo Tracking Reagents | Luciferase substrates, Near-infrared dyes, Quantum dots | Longitudinal monitoring of metastatic burden in animal models |
| Cell Isolation and Characterization | Magnetic bead separation kits, Flow cytometry antibodies, intracellular staining kits | Immune cell population analysis from limited micrometastatic samples |
| Extracellular Vesicle Analysis | Exosome isolation kits, NanoFCM instruments, CD63/81 antibodies | Investigation of pre-metastatic niche formation and intercellular communication |
Future Directions and Clinical Translation
The therapeutic targeting of micrometastatic disease represents a paradigm shift in oncology, moving intervention earlier in the metastatic cascade when eradication may still be achievable. Future research directions include:
Integrated Technological Approaches
The convergence of nanotechnology, artificial intelligence-driven predictive models, and advanced biomarker platforms is expected to transform micrometastasis detection and targeting in the coming decade [50] [91]. Nanocarriers can enhance drug delivery to metastatic sites, while AI algorithms can integrate multi-omics data to predict metastatic potential and optimize therapeutic schedules. Spatial proteomics and single-cell technologies will continue to elucidate the complex ecosystem of micrometastatic niches, identifying novel therapeutic targets [136].
Biomarker-Driven Clinical Trials
Future clinical trials should incorporate serial biomarker monitoring to identify micrometastatic disease progression before radiographic appearance. The lead time provided by serum tumor markers, circulating tumor DNA, and immune signatures enables a window for intervention when tumor burden remains low and immune microenvironments may be more amenable to manipulation [50] [91]. Adaptive trial designs that dynamically adjust therapies based on biomarker kinetics will be essential for advancing this field.
Combination Immunotherapy Strategies
The complexity of micrometastatic immune evasion necessitates rational combination strategies that address multiple resistance mechanisms simultaneously [134] [133]. Potential approaches include:
- IS-IIT combined with targeted therapies to address both immune and oncogenic signaling pathways
- Neoadjuvant intratumoral immunotherapy to generate systemic immunity against micrometastases
- Bispecific antibodies engaging multiple immune activation pathways
- Micrometastasis-specific delivery of immunomodulators using advanced nanoplatforms
Micrometastatic disease represents both a critical clinical challenge and a transformative therapeutic opportunity in oncology. The unique biological features of micrometastases—particularly their low tumor burden and distinct immune contexture—create a window for intervention before the establishment of robust immunosuppressive networks. Immunotherapeutic approaches specifically designed for this disease state, including immune suppression-inhibiting immunotherapy and neoadjuvant intratumoral strategies, hold significant promise for preventing metastatic progression and achieving definitive cures. Advanced experimental models, spatial proteomics technologies, and biomarker-guided clinical trials will be essential for translating these concepts into effective therapies that address the predominant cause of cancer mortality.
The metastasis of solid tumors remains a formidable challenge in oncology, driven by complex biological processes that hinge on specific molecular targets. Among the most promising are the KRAS oncogene, G-protein coupled receptors (GPCRs), and the ubiquitin-proteasome system (UPS), which collectively influence cellular proliferation, signaling, and survival. KRAS, once considered "undruggable," is now being targeted with allele-specific inhibitors and degraders, showing significant clinical promise despite emerging resistance mechanisms [137]. GPCRs, as master regulators of cellular communication, contribute critically to tumorigenesis and the tumor microenvironment (TME) [138]. Meanwhile, the UPS offers a powerful approach for targeted protein degradation, enabling the direct dismantling of key oncogenic drivers [139] [140]. This whitepaper provides an in-depth technical guide to the validation of these three target classes, summarizing current quantitative data, detailing essential experimental protocols, and visualizing core signaling pathways to equip researchers and drug development professionals with the tools necessary to advance novel therapeutics.
KRAS: From Undruggable to Actionable
The Kirsten rat sarcoma viral oncogene homolog (KRAS) is one of the most frequently mutated oncogenes in human cancers, playing a critical role in pancreatic, colorectal, and non-small cell lung cancers (NSCLC) [141] [137]. KRAS functions as a membrane-bound molecular switch, cycling between an active GTP-bound state and an inactive GDP-bound state. Oncogenic mutations, most commonly at codon 12 (e.g., G12C, G12D), disrupt this cycle, locking KRAS in its active conformation and leading to constitutive signaling through downstream pathways like RAF-MEK-ERK and PI3K-AKT-mTOR, which drive uncontrolled cell growth and proliferation [137].
Clinical Development of KRAS-Targeted Agents
Recent years have witnessed a breakthrough in direct KRAS targeting. Table 1 summarizes the latest clinical efficacy data for novel KRAS inhibitors presented at the 2025 ESMO Congress.
Table 1: Clinical Efficacy of Novel KRAS Inhibitors in Advanced Solid Tumors (ESMO Congress 2025 Data)
| Therapeutic Agent | Target | Tumor Type | Patient Population | Objective Response Rate (ORR) | Disease Control Rate (DCR) |
|---|---|---|---|---|---|
| HRS-7058 [142] | KRAS G12C | NSCLC | G12Ci-naïve (n=69) | 43.5% | 94.2% |
| NSCLC | G12Ci-pre-treated (n=34) | 20.6% | 91.2% | ||
| CRC (n=41) | 34.1% | 78.0% | |||
| PDAC (n=4) | 75.0% | 100% | |||
| HRS-4642 [142] | KRAS G12D | NSCLC | All comers | 23.7% | 76.3% |
| PDAC | All comers | 20.8% | 79.2% | ||
| INCB161734 [142] | KRAS G12D | PDAC | 600 mg qd (n=25) | 20% | 64% |
| PDAC | 1200 mg qd (n=29) | 34% | 86% |
Key Observations:
- HRS-7058: Demonstrates robust efficacy in G12Ci-naïve NSCLC and notable activity in pre-treated patients, suggesting potential to overcome certain resistance mechanisms [142].
- G12D Inhibitors (HRS-4642, INCB161734): Show encouraging early activity, particularly in pancreatic cancer, a disease with high unmet need [142].
- Toxicity Profile: Grade ≥3 treatment-related adverse events (TRAEs) were observed in 14.1% of patients with HRS-7058 and 23.8% with HRS-4642, including one treatment-related death with the latter. Hypertriglyceridemia and neutropenia were notable toxicities for G12D inhibitors [142].
Novel Modalities: KRAS G12D Protein Degraders
Beyond inhibition, targeted protein degradation is emerging as a powerful strategy. ASP3082, a KRAS G12D selective protein degrader, harnesses the ubiquitin-proteasome system to break down and eliminate the KRAS G12D protein [142]. Early-phase data suggest this novel mechanism may be associated with less toxicity than KRAS G12D inhibitors, with only 5% of patients experiencing grade ≥3 TRAEs [142]. A phase 1 study of another degrader, ASP4396, is currently enrolling patients with KRAS G12D-mutant solid tumors (NCT06364696) [140].
Experimental Protocol: Assessing KRAS Inhibition Efficacy In Vivo
Objective: To evaluate the anti-tumor activity and pharmacodynamic effects of a novel KRAS inhibitor in a patient-derived xenograft (PDX) model of KRAS-mutant NSCLC.
Materials:
- NOD-scid IL2Rgamma[null] (NSG) mice.
- KRAS G12C or G12D mutant NSCLC PDX model.
- Test article: KRAS inhibitor (e.g., HRS-7058, HRS-4642) and vehicle control.
- Calipers, microvette for blood collection, tissue homogenizer.
Methodology:
- Model Establishment: Implant KRAS-mutant tumor fragments subcutaneously into the flank of 6-8 week old NSG mice.
- Randomization & Dosing: When tumor volumes reach 150-200 mm³, randomize mice into vehicle and treatment groups (n=8-10/group). Administer test article via oral gavage or intraperitoneal injection at the predetermined dose daily.
- Tumor Monitoring: Measure tumor dimensions and body weight twice weekly. Calculate tumor volume using the formula: V = (Length × Width²) / 2.
- Circulating Tumor DNA (ctDNA) Analysis:
- Sample Collection: Collect plasma from retro-orbital bleeding at baseline, day 7, and day 21.
- DNA Extraction & Analysis: Isolate ctDNA from plasma using a commercial kit. Quantify KRAS mutant allele frequency (MAF) using droplet digital PCR (ddPCR) or next-generation sequencing (NGS).
- Termination and Tissue Collection: Euthanize mice at the study endpoint (e.g., when control tumors reach 1500 mm³). Harvest tumors and snap-freeze for downstream analysis or fix in formalin for immunohistochemistry (IHC).
- Downstream Analysis:
- Immunoblotting: Analyze tumor lysates for levels of phospho-ERK, total ERK, phospho-AKT, and total AKT to confirm pathway inhibition.
- IHC: Stain tumor sections for markers of proliferation (Ki-67) and apoptosis (cleaved caspase-3).
This protocol, incorporating serial ctDNA assessments, is aligned with methodologies used in clinical trials (e.g., INCB161734 study) where early molecular response in ctDNA served as a useful surrogate marker of response [142].
KRAS Signaling and Resistance Pathways
The following diagram illustrates the core KRAS signaling axis and key mechanisms of resistance to targeted therapies, which include upstream receptor tyrosine kinase (RTK) activation, alternative pathway signaling, and acquired KRAS mutations.
G-Protein Coupled Receptors (GPCRs) as Metastatic Regulators
GPCRs represent the largest family of membrane receptors in humans and are pivotal hubs in cancer pathogenesis. They transmit diverse extracellular signals to regulate critical cellular processes, including proliferation, apoptosis, invasion, and metastasis, while establishing complex interplay networks within the tumor microenvironment (TME) [138].
GPCR Expression and Function in Solid Tumors
Aberrant GPCR expression and signaling are closely associated with tumor progression. Table 2 outlines key GPCRs implicated in gastric cancer (GC), exemplifying their broader role in solid tumors.
Table 2: Key GPCRs in Gastric Cancer Pathogenesis and Progression
| GPCR Name | Ligand(s) | Expression in Cancer | Proposed Mechanism in Cancer | Biological Function |
|---|---|---|---|---|
| GPR110 [138] | Undefined (Orphan) | Upregulated in GC | Activates MAPK/ERK signaling | Promotes cell proliferation, migration, metastasis; correlates with reduced survival |
| GPR35 [138] | Kynurenic acid, CXCL17 | Upregulated in GC | Induces M2 macrophage polarization; mediates immunosuppression | Remodels tumor immune microenvironment; promotes immune escape |
| GPR56 [138] | Collagen III | Downregulated in GC (tumor suppressor) | Inhibits RhoA/ROCK pathway; reduces cell migration | Suppresses tumor invasion and metastasis |
| GPR87 [138] | Lysophosphatidic acid (LPA) | Upregulated in GC | Activates PI3K/AKT and NF-κB pathways | Promotes cell proliferation and inhibits apoptosis |
| GPR120 (FFAR4) [138] | ω-3 fatty acids | Upregulated in GC | Promotes cell migration/invasion via EMT and PI3K/NF-κB pathways | Enhances tumor progression and chemotherapy tolerance |
| PAR1 [138] | Thrombin | Upregulated in GC | Activates NF-κB and MAPK pathways; induces EMT | Promotes tumor cell migration, angiogenesis, metastasis |
GPCRs also drive metabolic reprogramming, a hallmark of cancer. For instance, Free Fatty Acid Receptors (FFARs) like FFAR1 (GPR40) and FFAR4 (GPR120) bind dietary fatty acids and can influence cancer cell growth, with studies showing FFAR4 agonists can inhibit growth factor signaling in prostate cancer cells [143].
Experimental Protocol: GPCR Signaling and Functional Analysis in Vitro
Objective: To investigate the role of a specific GPCR (e.g., GPR35) in tumor cell migration and immune cell recruitment.
Materials:
- Human GC cell lines (e.g., MKN45, AGS).
- THP-1 monocyte cell line.
- Recombinant GPCR ligand (e.g., CXCL17 for GPR35).
- Neutralizing antibody or small molecule inhibitor against the GPCR.
- Transwell migration chambers (e.g., 8.0 μm pore size).
- Conditioned medium collection tubes.
Methodology:
- Generation of Conditioned Medium (CM):
- Culture GC cells to 70-80% confluence in complete medium.
- Serum-starve cells for 12 hours.
- Treat cells with ligand (e.g., 100 nM CXCL17) or vehicle control for 24 hours in serum-free medium.
- Collect CM, centrifuge to remove cell debris, and store at -80°C.
- Macrophage Polarization Assay:
- Differentiate THP-1 monocytes into M0 macrophages using 100 ng/mL PMA for 48 hours.
- Treat M0 macrophages with the collected CM (from step 1) for 48 hours.
- Harvest macrophages and analyze M2 polarization markers (e.g., CD206, ARG1) via flow cytometry or qRT-PCR.
- Tumor Cell Migration Assay (Transwell):
- Seed GC cells into the upper chamber of a Transwell insert in serum-free medium. Pre-treat cells with a GPCR inhibitor or isotype control for 2 hours.
- Add CM from step 1 (which may contain GPCR-induced chemokines) or standard chemoattractant (e.g., 10% FBS) to the lower chamber.
- Incubate for 24-48 hours. Non-migrated cells on the upper surface are removed with a cotton swab.
- Migrated cells on the lower surface are fixed with methanol, stained with crystal violet, and imaged/counted under a microscope.
- Downstream Analysis: Perform Western blotting on cell lysates to assess activation of downstream signaling pathways (e.g., p-ERK/ERK, p-AKT/AKT).
This protocol can validate GPCR function in autocrine/paracrine signaling, tumor cell migration, and TME remodeling, as suggested by studies showing KRASG12D-expressing tumors recruit myeloid-derived suppressor cells via chemokine axes [144].
GPCR Signaling in the Tumor Microenvironment
The diagram below outlines how GPCR signaling in cancer cells influences tumor progression both intrinsically and through remodeling the immune microenvironment.
The Ubiquitin-Proteasome System (UPS) in Targeted Protein Degradation
The UPS is the primary intracellular pathway for targeted protein degradation in eukaryotic cells, playing a central role in maintaining protein homeostasis. Its dysregulation is a hallmark of many cancers, making it an attractive therapeutic target [139].
UPS as a Therapeutic Platform
The UPS process involves a cascade: E1 (ubiquitin-activating enzyme), E2 (ubiquitin-conjugating enzyme), and E3 (ubiquitin ligase) enzymes work in concert to tag target proteins with ubiquitin chains, marking them for degradation by the 26S proteasome [139]. This system can be co-opted for cancer therapy in two primary ways:
- Proteasome Inhibitors: Drugs like bortezomib block the proteasome's activity, leading to the accumulation of toxic proteins and cell death. They are first-line agents in multiple myeloma [139].
- Targeted Protein Degraders: Molecules like Proteolysis-Targeting Chimeras (PROTACs) and molecular glues recruit E3 ligases to specific target proteins, inducing their ubiquitination and degradation. This approach is being applied to previously "undruggable" targets like KRAS G12D (e.g., ASP3082, ASP4396) [142] [140].
Research Example: UBE4B in Gastric Cancer
A 2025 study identified UBE4B, an E3/E4 ubiquitin ligase, as a key promoter of gastric cancer proliferation and metastasis. The study demonstrated that UBE4B is highly expressed in GC tissues and cell lines, and its expression correlates with poor differentiation, advanced stage, and worse survival [145].
Key Experimental Findings:
- Functional Assays: Knockdown of UBE4B inhibited GC cell proliferation, migration, and invasion, while its overexpression promoted these phenotypes [145].
- Mechanistic Insight: Quantitative proteomics (TMT) identified the tumor suppressor FAT4 as a UBE4B substrate. UBE4B directly binds to FAT4, mediating its ubiquitination and proteasomal degradation [145].
- In Vivo Validation: In a mouse xenograft model, UBE4B knockdown suppressed tumor growth, and IHC confirmed a negative correlation between UBE4B and FAT4 protein levels in human GC samples [145].
Experimental Protocol: Validating UPS-Mediated Protein Degradation
Objective: To determine if a target protein (e.g., FAT4) is degraded via the UPS by a specific E3 ligase (e.g., UBE4B).
Materials:
- HEK293T or relevant cancer cell line.
- Plasmids: HA-ubiquitin, Flag-tagged E3 ligase (e.g., UBE4B), MYC-tagged substrate protein (e.g., FAT4).
- Proteasome inhibitor (e.g., MG132, 10 μM).
- Cycloheximide (CHX, protein synthesis inhibitor, 100 μg/mL).
- Lysis buffer, protein A/G beads, anti-Flag and anti-MYC antibodies.
Methodology:
- Co-Immunoprecipitation (Co-IP) to Test Interaction:
- Co-transfect cells with MYC-substrate and Flag-E3 ligase plasmids.
- 48 hours post-transfection, lyse cells in IP lysis buffer.
- Incubate lysates with anti-Flag antibody-bound beads overnight at 4°C.
- Wash beads, elute proteins, and analyze by Western blotting using anti-MYC and anti-Flag antibodies to detect interaction.
- Ubiquitination Assay:
- Co-transfect cells with MYC-substrate, Flag-E3 ligase, and HA-ubiquitin plasmids.
- Treat cells with MG132 for 6 hours before harvesting to block degradation and allow ubiquitinated proteins to accumulate.
- Lyse cells and perform IP using an anti-MYC antibody.
- Analyze the immunoprecipitate by Western blotting with an anti-HA antibody to detect ubiquitinated substrate species (a characteristic ladder pattern).
- Cycloheximide Chase Assay to Measure Protein Half-Life:
- Co-transfect cells with MYC-substrate and control vector or Flag-E3 ligase plasmid.
- 24 hours post-transfection, treat cells with CHX to block new protein synthesis.
- Harvest cells at time points (e.g., 0, 2, 4, 8 hours) after CHX addition.
- Analyze MYC-substrate protein levels by Western blotting. Densitometry quantitation will show if the E3 ligase expression shortens the half-life of the substrate protein.
This protocol combines key techniques used to validate UPS-dependent degradation, as exemplified in the UBE4B-FAT4 study [145].
The Ubiquitin-Proteasome System Pathway
The diagram below illustrates the sequential enzymatic cascade of the UPS, from ubiquitin activation to substrate degradation, highlighting potential intervention points for cancer therapy.
The Scientist's Toolkit: Essential Research Reagents
Table 3: Key Reagents for Target Validation Studies
| Reagent / Tool | Category | Primary Function in Validation | Example Application |
|---|---|---|---|
| siRNA/shRNA | Gene Knockdown | Transient or stable knockdown of target gene (e.g., KRAS, UBE4B) to assess loss-of-function phenotypes. | Validating UBE4B's role in GC cell proliferation and migration [145]. |
| CRISPR-Cas9 | Gene Editing | Complete gene knockout for definitive functional validation; can be used for generating knock-in models. | Creating isogenic cell lines with KRAS mutations. |
| Recombinant Proteins/Ligands | Biochemical Stimulation | Activate specific receptors or signaling pathways in vitro (e.g., GPCR ligands). | Studying GPR35 activation using CXCL17 [138]. |
| Selective Inhibitors/Degraders | Pharmacological Modulation | Inhibit protein function or induce degradation to model therapeutic effect. | Testing efficacy of KRAS G12C(i) (e.g., HRS-7058) or G12D degraders (e.g., ASP4396) [142] [140]. |
| ddPCR/NGS Panels | Molecular Analysis | Precisely quantify mutant allele frequency in tumor DNA/ctDNA; detect co-mutations. | Monitoring KRAS mutant allele frequency in patient plasma for response assessment [142]. |
| Phospho-Specific Antibodies | Signaling Analysis | Detect activation status of key signaling nodes (e.g., p-ERK, p-AKT) via Western blot or IHC. | Confirming on-target pathway inhibition by a KRAS inhibitor. |
| Co-IP Validated Antibodies | Protein Interaction | Immunoprecipitate target protein and its binding partners to study complexes. | Demonstrating UBE4B binding to FAT4 [145]. |
The validation of KRAS, GPCRs, and the UPS represents the vanguard of targeted cancer therapy research. The emergence of direct KRAS inhibitors and degraders has finally cracked the "undruggable" armor of this key oncogene, though resistance remains a critical hurdle. GPCRs offer a vast and relatively untapped landscape for intervention, given their central role in regulating both tumor-intrinsic signaling and the extrinsic immune microenvironment. The UPS provides a versatile platform for a novel class of therapeutics that move beyond inhibition to complete elimination of oncogenic proteins. The future of overcoming metastasis lies in intelligently designed combination therapies that concurrently target these nodes. This requires the rigorous application of the experimental protocols and tools outlined in this whitepaper, fostering a deeper understanding of the intricate biological processes that drive solid tumor progression.
Conclusion
The fight against metastatic cancer requires a multi-pronged approach that integrates a deep understanding of foundational biology with innovative methodologies. The key takeaways highlight that metastasis is not a single event but a complex, multi-step process governed by cellular plasticity, dynamic bioelectric cues, and a supportive tumor microenvironment. While advanced 3D and in vivo models have significantly improved physiological relevance, the translational gap remains a major hurdle, necessitating more sophisticated, patient-specific platforms. Future directions must focus on therapeutically targeting the dormant niche, exploiting emerging vulnerabilities like bioelectric signaling, and designing smarter clinical trials that prioritize metastasis prevention and the eradication of minimal residual disease. The convergence of targeted therapies, immunomodulation, and AI-driven diagnostics holds the promise of transforming metastatic cancer from a lethal disease to a manageable condition.
References
- 1. Invasion and metastasis in cancer: molecular insights and ... [https://www.nature.com/articles/s41392-025-02148-4]
- 2. Molecular principles of metastasis: a hallmark of cancer ... [https://www.nature.com/articles/s41392-020-0134-x]
- 3. Molecular mechanisms and signaling pathways related ... - PMC [https://pmc.ncbi.nlm.nih.gov/articles/PMC11983435/]
- 4. Primary and secondary metastatic dissemination [https://pmc.ncbi.nlm.nih.gov/articles/PMC12281838/]
- 5. Biomarkers in Tumor Angiogenesis and Anti-Angiogenic ... [https://pmc.ncbi.nlm.nih.gov/articles/PMC3211028/]
- 6. Immunotherapy biomarkers in brain metastases: insights into ... [https://pmc.ncbi.nlm.nih.gov/articles/PMC12380822/]
- 7. Immune related biomarkers for cancer metastasis to the brain [https://ehoonline.biomedcentral.com/articles/10.1186/s40164-022-00349-z]
- 8. DrBioRight 2.0: an LLM-powered bioinformatics chatbot for ... [https://www.nature.com/articles/s41467-025-57430-4]
- 9. Metscape 2 bioinformatics tool for the analysis and ... [https://pmc.ncbi.nlm.nih.gov/articles/PMC3268237/]
- 10. The molecular mechanisms and therapeutic strategies of EMT ... [https://pmc.ncbi.nlm.nih.gov/articles/PMC9461252/]
- 11. the status quo of methods and experimental models 2025 [https://pubmed.ncbi.nlm.nih.gov/40483504/]
- 12. Epithelial-to-mesenchymal transition (EMT) and cancer ... [https://molecular-cancer.biomedcentral.com/articles/10.1186/s12943-025-02338-2]
- 13. Modeling the dynamics of EMT reveals genes associated ... [https://www.nature.com/articles/s41540-025-00512-2]
- 14. Fluid shear stress activates YAP to promote epithelial– ... [https://pmc.ncbi.nlm.nih.gov/articles/PMC8564657/]
- 15. Innovative Approaches to EMT-Related Biomarker ... [https://pmc.ncbi.nlm.nih.gov/articles/PMC12467340/]
- 16. In vivo visualization and characterization of epithelial ... [https://pmc.ncbi.nlm.nih.gov/articles/PMC4873431/]
- 17. Imaging of anticancer drug action in single cells - PMC [https://pmc.ncbi.nlm.nih.gov/articles/PMC7552440/]
- 18. Bioelectricity is a universal multifaced signaling cue in ... [https://pmc.ncbi.nlm.nih.gov/articles/PMC11809311/]
- 19. Bioelectric Membrane Potential and Breast Cancer [https://www.mdpi.com/2813-2564/4/2/9]
- 20. Targeting Ion Channels for Cancer Therapy [https://www.mdpi.com/1424-8247/18/10/1521]
- 21. Targeting ion channels: innovative approaches to combat ... [https://pmc.ncbi.nlm.nih.gov/articles/PMC11671388/]
- 22. Collective cell migration modes in development, tissue ... [https://www.nature.com/articles/s41580-025-00858-9]
- 23. Sodium ion channels as potential therapeutic targets for ... [https://www.sciencedirect.com/science/article/abs/pii/S1359644621000581]
- 24. Potassium channel-driven bioelectric signalling regulates ... [https://www.sciencedirect.com/science/article/pii/S2352396421005612]
- 25. Models show a decrease in breast cancer metastasis when ... [https://cellmicrosystems.com/blog/models-show-a-decrease-in-breast-cancer-metastasis-when-ion-channels-are-modulated/]
- 26. Coordinated in confined migration - PubMed Central - NIH [https://pmc.ncbi.nlm.nih.gov/articles/PMC11284253/]
- 27. Quantitative impedance-based characterization of breast ... [https://pmc.ncbi.nlm.nih.gov/articles/PMC12512568/]
- 28. Acidic Tumor Microenvironments and Emerging ... [https://pmc.ncbi.nlm.nih.gov/articles/PMC12479195/]
- 29. Acidity and hypoxia of tumor microenvironment, a positive ... [https://link.springer.com/article/10.1007/s13402-024-00969-z]
- 30. Extracellular matrix dynamics in tumor immunoregulation [https://jhoonline.biomedcentral.com/articles/10.1186/s13045-025-01717-y]
- 31. Multi-stage mechanisms of tumor metastasis and ... - Nature [https://www.nature.com/articles/s41392-024-01955-5]
- 32. TME-analyzer: a new interactive and dynamic image ... [https://www.nature.com/articles/s44303-024-00022-6]
- 33. Minimal residual disease and circulating tumor cells in breast ... [https://pmc.ncbi.nlm.nih.gov/articles/PMC3262191/]
- 34. The Role and Clinical Relevance of Disseminated Tumor ... [https://pmc.ncbi.nlm.nih.gov/articles/PMC3980614/]
- 35. Characterization of Disseminated Tumor Cells (DTCs) in ... [https://www.mdpi.com/2073-4409/14/12/857]
- 36. Disseminated tumour cells in bone marrow are the source of ... [https://pmc.ncbi.nlm.nih.gov/articles/PMC6237612/]
- 37. Clinical applications of circulating tumor cells in metastasis ... [https://jhoonline.biomedcentral.com/articles/10.1186/s13045-025-01733-y]
- 38. A comprehensive overview of minimal residual disease in ... [https://www.nature.com/articles/s41698-025-00984-9]
- 39. Modeling metastasis – leveraging novel tools to streamline ... [https://pmc.ncbi.nlm.nih.gov/articles/PMC12452062/]
- 40. Mimicking the Complexity of Solid Tumors: How Spheroids ... [https://pmc.ncbi.nlm.nih.gov/articles/PMC11987746/]
- 41. Scaffold-based 3D cell culture models in cancer research [https://jbiomedsci.biomedcentral.com/articles/10.1186/s12929-024-00994-y]
- 42. 3D Tumor Spheroid and Organoid to Model ... [https://www.mdpi.com/2674-1172/1/2/12]
- 43. Organoid and Spheroid Tumor Models - PubMed Central - NIH [https://pmc.ncbi.nlm.nih.gov/articles/PMC7922036/]
- 44. Breaking the mold: 3D cell cultures reshaping the future of ... [https://www.frontiersin.org/journals/cell-and-developmental-biology/articles/10.3389/fcell.2024.1507388/full]
- 45. ReSCUE微流控平台:培养及释放类器官和类肿瘤,洞察形状 ... [https://www.mems.me/mems/microfluidics_202412/13157.html]
- 46. Molecular insights of metastasis and cancer progression ... [https://www.sciencedirect.com/science/article/abs/pii/S1040842821002985]
- 47. 三维细胞培养技术及其应用进展 [https://pmc.ncbi.nlm.nih.gov/articles/PMC10307603/]
- 48. Editorial: Cancer Metastases: Mechanisms of Tumor ... [https://www.frontiersin.org/journals/immunology/articles/10.3389/fimmu.2025.1746602/full]
- 49. Mechanism insights and therapeutic intervention of tumor ... [https://www.nature.com/articles/s41392-024-01885-2]
- 50. Targeted Therapies in the Most Common Advanced Solid ... [https://pubmed.ncbi.nlm.nih.gov/41020040/]
- 51. Patient-derived xenograft models: Current status ... [https://www.sciencedirect.com/science/article/pii/S2352304225000091]
- 52. Utilizing mouse models to understand metastasis spread [https://www.jax.org/news-and-insights/2025/may/the-seed-and-the-soil-utilizing-mouse-models-to-understand-metastasis-spread]
- 53. Patient-derived xenograft models in cancer therapy [https://www.nature.com/articles/s41392-023-01419-2]
- 54. Impact of Subcutaneous Versus Orthotopic Implantations on ... [https://pmc.ncbi.nlm.nih.gov/articles/PMC12117319/]
- 55. CRISPR's impact on cancer: From fundamental models to ... [https://www.sciencedirect.com/science/article/abs/pii/S0024320525007234]
- 56. Tumour-Specific CRISPR Restores Chemotherapy Response [https://crisprmedicinenews.com/news/tumour-specific-crispr-restores-chemotherapy-response/]
- 57. Epithelial–Mesenchymal Transition in Cancer: Insights Into ... [https://pmc.ncbi.nlm.nih.gov/articles/PMC12394892/]
- 58. Cancer stem cells: landscape, challenges and emerging ... [https://www.nature.com/articles/s41392-025-02360-2]
- 59. Biology of stem cell paradox: a double-edged sword ... [https://pmc.ncbi.nlm.nih.gov/articles/PMC12560468/]
- 60. EMT and cancer stem cells: Drivers of therapy resistance ... [https://www.sciencedirect.com/science/article/abs/pii/S1368764625000792]
- 61. Advances in research regarding epithelial-mesenchymal ... [https://www.frontiersin.org/journals/cell-and-developmental-biology/articles/10.3389/fcell.2025.1583255/full]
- 62. Regulation of divergent epithelial-to-mesenchymal ... [https://www.nature.com/articles/s41598-025-17310-9]
- 63. Blocking a single protein forces cancer cells to self-destruct [https://www.sciencedaily.com/releases/2025/11/251120002606.htm]
- 64. Ruthenium-based drugs as cancer stem cell inhibitors [https://pubmed.ncbi.nlm.nih.gov/41177122/]
- 65. Role of Ubiquitin-regulated EMT in Cancer Metastasis and ... [https://pubmed.ncbi.nlm.nih.gov/41208892/]
- 66. Bispecific antibodies: unleashing a new era in oncology ... [https://pmc.ncbi.nlm.nih.gov/articles/PMC12320366/]
- 67. Mechanism of Action and Pharmacokinetics of Approved ... [https://pmc.ncbi.nlm.nih.gov/articles/PMC11535297/]
- 68. Safety and Efficacy of Bispecific Antibody Treatment in ... [https://pmc.ncbi.nlm.nih.gov/articles/PMC12427194/]
- 69. Combining precision bispecific antibodies with targeted ... [https://www.drugtargetreview.com/article/153477/combining-precision-bispecific-antibodies-with-targeted-radiotherapy/]
- 70. Radiopharmaceuticals and their applications in medicine [https://www.nature.com/articles/s41392-024-02041-6]
- 71. Radiopharmaceutical Therapy in the Era of Precision ... [https://pmc.ncbi.nlm.nih.gov/articles/PMC4119492/]
- 72. Key oncology trends to watch in 2025 [https://www.labiotech.eu/in-depth/oncology-trends-2025/]
- 73. Efficacy and safety of bispecific antibodies vs. immune ... [https://molecular-cancer.biomedcentral.com/articles/10.1186/s12943-024-01956-6]
- 74. EMERGING BIOLOGICAL PRINCIPLES OF METASTASIS - PMC [https://pmc.ncbi.nlm.nih.gov/articles/PMC5308465/]
- 75. Multimodal AI and tumour microenvironment integration ... [https://www.nature.com/articles/s41467-025-65051-0]
- 76. Developments in nanotechnology approaches for the ... [https://ehoonline.biomedcentral.com/articles/10.1186/s40164-025-00656-1]
- 77. Advances in Nanotechnology-Based Drug Delivery Systems [https://pmc.ncbi.nlm.nih.gov/articles/PMC12389492/]
- 78. the transformative potential of nanotechnology in medicine [https://www.frontiersin.org/journals/drug-delivery/articles/10.3389/fddev.2025.1556426/full]
- 79. Nanotech makes cancer drug 20000x stronger, without ... [https://www.sciencedaily.com/releases/2025/11/251105050718.htm]
- 80. Artificial Intelligence Models for Predicting Outcomes in ... [https://pubmed.ncbi.nlm.nih.gov/40869712/]
- 81. Drug delivery: Experiments, mathematical modelling and ... [https://pmc.ncbi.nlm.nih.gov/articles/PMC8317640/]
- 82. The preclinical therapeutic response of residual metastatic ... [https://pmc.ncbi.nlm.nih.gov/articles/PMC3161145/]
- 83. Animal models in preclinical metastatic breast cancer ... [https://journals.plos.org/plosone/article?id=10.1371/journal.pone.0322876]
- 84. Quantitative analysis of metastatic breast cancer in mice ... [https://www.nature.com/articles/s41598-021-96838-y]
- 85. Quantitative Analysis of SPECT-CT Data in Metastatic ... [https://pmc.ncbi.nlm.nih.gov/articles/PMC8773966/]
- 86. Modeling Bone Metastasis: Digital Twins Reproduce ... [https://www.houstonmethodist.org/leading-medicine-blog/articles/2025/oct/modeling-bone-metastasis-digital-twins-reproduce-tumor-biology-with-unprecedented-precision/]
- 87. Drug resistance in cancer: molecular mechanisms and ... [https://pmc.ncbi.nlm.nih.gov/articles/PMC12623568/]
- 88. The Future of Precision Oncology: Biomarkers and Drug ... [https://binaytara.org/cancernews/article/the-future-of-precision-oncology-biomarkers-and-drug-development]
- 89. Acquired resistance to immunotherapy in solid tumors [https://www.sciencedirect.com/science/article/abs/pii/S1471491425000619]
- 90. Mechanistic insights into resistance mechanisms to T cell ... [https://www.frontiersin.org/journals/immunology/articles/10.3389/fimmu.2025.1583044/full]
- 91. Targeted Therapies in the Most Common Advanced Solid ... [https://pmc.ncbi.nlm.nih.gov/articles/PMC12475977/]
- 92. Cancer cell plasticity and therapeutic resistance - Hereditas [https://hereditasjournal.biomedcentral.com/articles/10.1186/s41065-025-00564-8]
- 93. Deciphering organotropism reveals therapeutic targets in ... [https://www.frontiersin.org/journals/cell-and-developmental-biology/articles/10.3389/fcell.2025.1677481/full]
- 94. Study reveals biomarker for high risk of metastasis [https://www.utsouthwestern.edu/newsroom/articles/year-2025/jan-biomarker-for-high-risk-of-metastasis.html]
- 95. Machine learning-driven multi-targeted drug discovery in ... [https://www.nature.com/articles/s41698-025-01058-6]
- 96. Metastasis suppressor genes in clinical practice [https://pmc.ncbi.nlm.nih.gov/articles/PMC11629483/]
- 97. Metastasis suppressors: functional pathways [https://www.nature.com/articles/labinvest2017104]
- 98. Metastasis Suppressor Genes: At the Interface Between ... [https://pmc.ncbi.nlm.nih.gov/articles/PMC3575029/]
- 99. SMAD4 induces opposite effects on metastatic growth from ... [https://www.nature.com/articles/s43018-025-01047-5]
- 100. NDRG1 and its family members: More than just metastasis ... [https://www.sciencedirect.com/science/article/pii/S0021925825020800]
- 101. Tumor dormancy and relapse: understanding the molecular ... [https://pmc.ncbi.nlm.nih.gov/articles/PMC11812268/]
- 102. Cancer cell dormancy: An update to 2025 [https://bmrat.org/index.php/BMRAT/article/view/994]
- 103. Trials aim to make cancer relapse a thing of the past [https://www.pennmedicine.org/news/trials-aim-to-prevent-cancer-recurrence]
- 104. Ask the Experts: Breast cancer dormancy and late recurrence [https://www.oncology-central.com/ask-the-experts-breast-cancer-dormancy-and-late-recurrence/]
- 105. Immune evasion by dormant disseminated cancer cells [https://pmc.ncbi.nlm.nih.gov/articles/PMC11034720/]
- 106. Chemotherapy awakens dormant cancer cells in lung by ... [https://www.sciencedirect.com/science/article/abs/pii/S1535610825002570]
- 107. Pan-cancer whole-genome comparison of primary and ... [https://www.nature.com/articles/s41586-023-06054-z]
- 108. Study examines biological causes of cancer deaths [https://www.utsouthwestern.edu/newsroom/articles/year-2025/oct-biological-causes-cancer-deaths.html]
- 109. ASCO 2025 Metastatic Breast Cancer Updates [https://www.bcrf.org/blog/asco-2025-metastatic-breast-cancer-updates/]
- 110. New Insights in Treating Metastatic Lung Cancer ... [https://www.lungevity.org/blogs/new-insights-in-treating-metastatic-lung-cancer-from-wclc-2025]
- 111. Shining a Spotlight on Promising Clinical Trials in 2025 [https://www.komen.org/blog/spotlight-on-2025-clinical-trials/]
- 112. Biomarkers for the detection of circulating tumor cells [https://www.sciencedirect.com/science/article/pii/S001448272500151X]
- 113. Development of a serum protein biomarker panel for the ... [https://www.nature.com/articles/s41598-025-19631-1]
- 114. Validation of a liquid biopsy assay with increased ... [https://pubmed.ncbi.nlm.nih.gov/40980342/]
- 115. Validation of a liquid biopsy assay with increased ... [https://www.sciencedirect.com/science/article/pii/S2950195425000384]
- 116. FDA Guidance for Industry on Bioanalytical Method ... [https://labs.iqvia.com/blog/fda-guidance-bioanalytical-method-validation-biomarkers]
- 117. Genomically matched therapy in advanced solid tumors [https://www.nature.com/articles/s41591-025-03918-x]
- 118. in vitro approaches for studying breast cancer progression [https://www.por-journal.com/journals/pathology-and-oncology-research/articles/10.3389/pore.2025.1612179/full]
- 119. Three-Dimensional Cell Cultures: The Bridge between In Vitro ... [https://pmc.ncbi.nlm.nih.gov/articles/PMC10419178/]
- 120. 3D tumor spheroid models for in vitro therapeutic screening [https://www.nature.com/articles/srep19103]
- 121. Wound healing assay [https://www.abcam.com/en-us/technical-resources/protocols/wound-healing-assay]
- 122. A Robust and Standardized Approach to Quantify Wound ... [https://pmc.ncbi.nlm.nih.gov/articles/PMC10514857/]
- 123. Transwell In Vitro Cell Migration and Invasion Assays - PMC [https://pmc.ncbi.nlm.nih.gov/articles/PMC10335869/]
- 124. Three-Dimensional In Vitro Tumor Spheroid Models for ... [https://pmc.ncbi.nlm.nih.gov/articles/PMC10571930/]
- 125. Boosting the Clinical Translation of Organ-on-a-Chip ... [https://pmc.ncbi.nlm.nih.gov/articles/PMC9598310/]
- 126. Research progress and challenges in the treatment of ... [https://pmc.ncbi.nlm.nih.gov/articles/PMC12624810/]
- 127. The Targeted Pulse: Advancements in CLL, RCC, CRC, ... [https://www.targetedonc.com/view/targeted-pulse-june-29]
- 128. Cancer metastasis: molecular mechanisms and therapeutic ... [https://pmc.ncbi.nlm.nih.gov/articles/PMC11977077/]
- 129. Insights from ASCO 2025: Real-world evidence drives ... [https://cancerletter.com/sponsored-article/20250613_5/]
- 130. An Update on Current NRG Oncology Breast Cancer ... [https://www.nrgoncology.org/Home/News/Post/an-update-on-current-nrg-oncology-breast-cancer-clinical-trials-october-2025/]
- 131. Advancing drug development with “Fit-for-Purpose” modeling ... [https://pmc.ncbi.nlm.nih.gov/articles/PMC12436579/]
- 132. TIM3+ breast cancer cells license immune evasion during ... [https://www.sciencedirect.com/science/article/pii/S153561082500265X]
- 133. Frontiers | Intratumoral immunotherapy prior to cancer surgery... [https://www.frontiersin.org/journals/immunology/articles/10.3389/fimmu.2025.1545000/full]
- 134. Recent Advances in Immune Checkpoint Inhibitors for ... [https://pubmed.ncbi.nlm.nih.gov/40196378/]
- 135. Efficacy of Anti-PD-(L)1 Immunotherapy in Patients with ... [https://www.sciencedirect.com/science/article/pii/S2588931125001099]
- 136. Spatial proteomics for investigating solid tumor resistance ... [https://pubmed.ncbi.nlm.nih.gov/41060425/]
- 137. Novel paradigms in KRAS targeting: Unveiling strategies to ... [https://pmc.ncbi.nlm.nih.gov/articles/PMC12453332/]
- 138. G protein-coupled receptors: pivotal hubs in gastric cancer ... [https://pmc.ncbi.nlm.nih.gov/articles/PMC12330062/]
- 139. Targeting the Ubiquitin–Proteasome System for Cancer - PMC [https://pmc.ncbi.nlm.nih.gov/articles/PMC12495026/]
- 140. Abstract [https://meetings.asco.org/abstracts-presentations/252284/]
- 141. KRAS under attack: recent advances in targeted therapies ... [https://pmc.ncbi.nlm.nih.gov/articles/PMC12605144/]
- 142. KRAS G12C & G12D inhibitors show early activity in solid ... [https://dailyreporter.esmo.org/esmo-congress-2025/emerging-targets/novel-kras-g12c-and-g12d-inhibitors-show-early-signs-of-activity-in-advanced-solid-tumours]
- 143. G-protein coupled receptors in metabolic reprogramming ... [https://www.sciencedirect.com/science/article/abs/pii/S0163725825000610]
- 144. Oncogenic KRAS mutations drive immune suppression ... [https://www.nature.com/articles/s41419-025-08101-1]
- 145. UBE4B promotes gastric cancer proliferation and ... [https://www.nature.com/articles/s41419-025-07794-8]