Decoding Tumor Architecture: A Comprehensive Guide to Spatial Transcriptomics in Cancer Research
Spatial transcriptomics (ST) is revolutionizing cancer research by preserving the spatial context of gene expression, enabling an unprecedented view of the tumor microenvironment (TME).
Decoding Tumor Architecture: A Comprehensive Guide to Spatial Transcriptomics in Cancer Research
Abstract
Spatial transcriptomics (ST) is revolutionizing cancer research by preserving the spatial context of gene expression, enabling an unprecedented view of the tumor microenvironment (TME). This article provides researchers and drug development professionals with a comprehensive resource on ST, from foundational concepts to cutting-edge applications. We explore how ST uncovers distinct spatial domains like the tumor-microenvironment interface and leading edge, detail the rapidly evolving landscape of sequencing-based and imaging-based technologies, and offer guidance for platform selection and data analysis. Furthermore, we discuss the critical integration of artificial intelligence and computational validation to translate spatial discoveries into clinically actionable insights, ultimately advancing our understanding of tumor heterogeneity, progression, and therapeutic response.
Unveiling the Spatial Landscape: How ST Reveals the Architecture of the Tumor Microenvironment
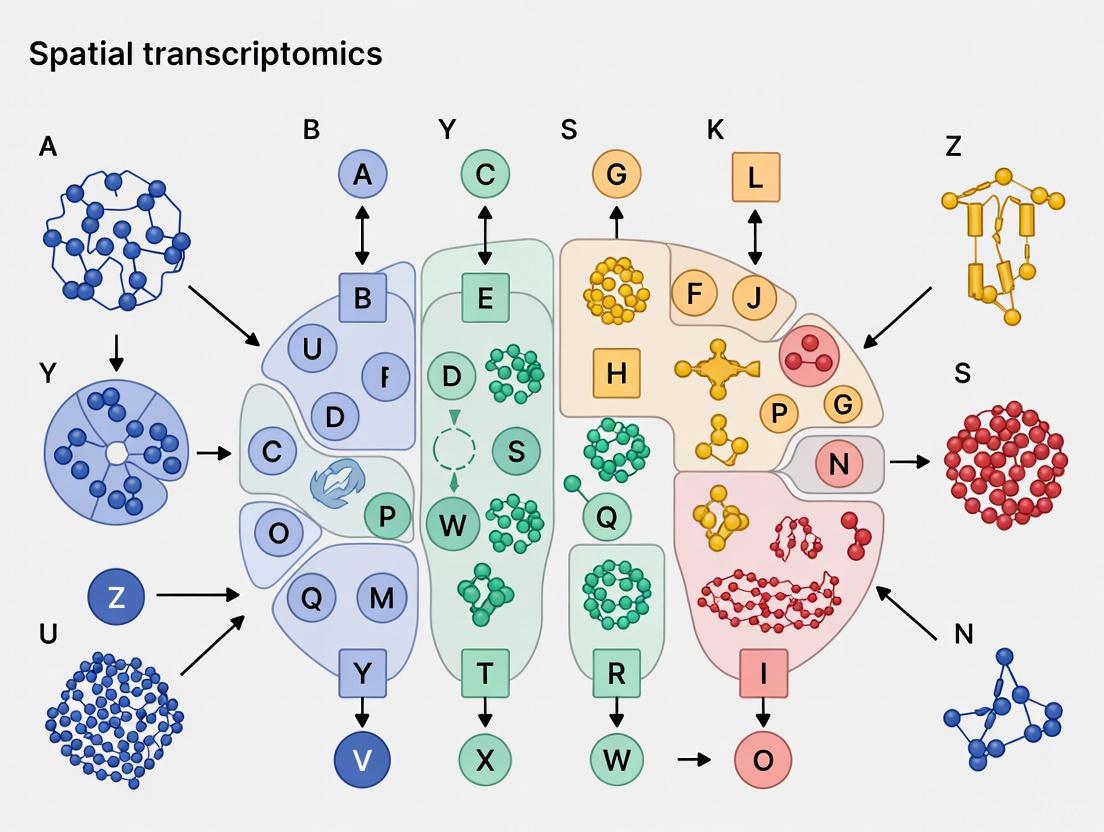
Spatial transcriptomics has emerged as a revolutionary technological paradigm that bridges the critical gap between cellular gene expression profiles and their native spatial context within tissues. This approach represents a fundamental advancement beyond single-cell RNA sequencing by preserving and quantifying the anatomical organization of transcriptomes, enabling researchers to decipher complex tissue architecture with unprecedented resolution. The core principle underpinning all spatial transcriptomics methodologies is the precise linking of quantitative gene expression data to specific physical locations within tissue sections, thereby creating comprehensive maps of transcriptional activity in situ. This technical guide examines the established and emerging technologies, computational frameworks, and experimental applications of spatial transcriptomics, with particular emphasis on its transformative potential for elucidating tumor organization architecture. As these methods continue to evolve toward higher resolution and greater multiplexing capacity, they are poised to redefine our understanding of cellular ecosystems in health and disease states.
Core Technological Principles and Methodologies
The fundamental objective of spatial transcriptomics is to measure genome-wide expression data while preserving spatial context, addressing a critical limitation of single-cell RNA sequencing technologies that require tissue dissociation [1]. The field has developed along two primary technological trajectories: sequencing-based approaches that capture positional information through spatial barcoding, and imaging-based approaches that directly visualize RNA molecules within intact tissue sections [2].
Sequencing-Based Approaches
Next-Generation Sequencing (NGS)-based methods represent one major category of spatial transcriptomics technologies. These approaches employ spatial barcoding strategies to encode positional information onto transcripts before sequencing [2]. The foundational innovation came from Ståhl et al. (2016), who developed a method to capture poly-adenylated RNA on spatially-barcoded microarray slides prior to reverse transcription, ensuring each transcript could be mapped back to its original spot using unique positional molecular barcodes [2]. This initial technology featured arrays with approximately a thousand spots, each 100μm in diameter with 200μm center-to-center spacing, enabling unbiased investigation of large tissue areas without pre-selecting gene targets [2].
Commercial implementations such as the 10x Genomics Visium platform have improved upon this foundation, offering enhanced resolution (55μm diameter spots with 100μm center-to-center spacing) and increased sensitivity (>10,000 transcripts per spot) [2]. Alternative NGS-based methods like Slide-Seq utilize randomly barcoded beads deposited onto slides for mRNA capture, achieving higher resolution (10μm) through in situ indexing of barcode positions [2]. Continued technological innovations have pushed resolutions further toward the single-cell and subcellular levels, with methods such as Seq-Scope achieving subcellular resolution spatial barcoding capable of visualizing nuclear and cytoplasmic transcripts separately [2].
The universal workflow for NGS-based approaches involves capturing RNA molecules on spatially barcoded oligos, converting them to cDNA with embedded positional information, performing high-throughput sequencing, and computationally reconstructing spatial expression patterns by mapping sequence reads back to their tissue origins using the barcode information [2].
Imaging-Based Approaches
Imaging-based spatial transcriptomics methodologies directly visualize and quantify RNA molecules within intact tissue sections through two primary strategies: in situ sequencing (ISS) and in situ hybridization (ISH) [2]. In situ sequencing-based methods involve reverse transcribing target RNAs directly in tissue, amplifying them via rolling circle amplification, and then performing sequencing-by-ligation or sequencing-by-synthesis in situ [2]. Techniques such as STARmap have incorporated advances in hydrogel chemistry with improved padlock and primer design to profile thousands of genes in complex tissues like mouse cortex [2].
In situ hybridization-based methods, including multiplexed error-robust fluorescence in situ hybridization (MERFISH) and sequential fluorescence in situ hybridization (seqFISH), use multiple rounds of hybridization with fluorescently labeled probes to detect hundreds to thousands of different RNA species [1]. These approaches can achieve subcellular resolution and high detection efficiency (recently reaching 80% relative to the gold standard smFISH) but typically require a priori selection of target genes [2].
More recently, commercial platforms such as the CosMx Human Whole Transcriptome (WTX) assay and Xenium platform have demonstrated the ability to generate spatially resolved, single-cell transcriptomic data across various tissues and experimental models, including FFPE tumors and CRISPR-edited spheroids [3]. These technologies increasingly integrate artificial intelligence-powered tools like InSituType and InSituCor to uncover spatially organized gene modules and pathway activity patterns that traditional approaches cannot resolve [3].
Table 1: Comparison of Major Spatial Transcriptomics Technology Categories
| Feature | NGS-Based Approaches | Imaging-Based Approaches |
|---|---|---|
| Gene Throughput | Unbiased, whole transcriptome | Targeted (dozens to thousands of genes) |
| Resolution | Spot-based (10-100μm), recently reaching subcellular | Single-cell to subcellular (<1μm with expansion microscopy) |
| Sensitivity | ~100 unique transcripts per square μm (rapidly improving) | High (up to 80% detection efficiency relative to smFISH) |
| Tissue Area | Standardized arrays (up to ~13.2cm for Stereo-seq) | Flexible, limited by imaging time |
| Sequence Information | Full cDNA sequence enables isoform detection | Limited to targeted sequences |
| Key Examples | 10x Visium, Slide-Seq, Stereo-seq | MERFISH, STARmap, CosMx, Xenium |
Diagram 1: Spatial transcriptomics technology classification showing two main approaches and their derivatives.
Experimental Design and Workflow Considerations
Implementing spatial transcriptomics requires careful consideration of multiple experimental parameters to ensure biologically meaningful results. Technology selection depends on the specific research question, with key factors including required resolution, gene throughput, tissue characteristics, and analytical objectives [2] [1].
Platform Selection Criteria
The choice between sequencing-based and imaging-based spatial transcriptomics methods involves balancing multiple technical and practical considerations [2]. For discovery-phase research where unbiased transcriptome coverage is prioritized, NGS-based approaches like Visium provide comprehensive gene expression profiling without requiring pre-specified targets [2]. When studying specific cellular mechanisms with known marker genes or when single-cell resolution is essential, imaging-based approaches such as MERFISH or CosMx offer superior spatial precision [2] [3].
Sensitivity requirements must also be evaluated, as imaging-based methods typically demonstrate higher detection efficiency (approximately 80% relative to smFISH) compared to NGS-based methods, though the sensitivity of the latter is rapidly improving [2]. Tissue size presents another consideration, with NGS-based methods typically utilizing standardized array sizes (approximately 6.5×6.5mm for Visium) while imaging-based methods can accommodate larger areas but require proportionally increased imaging time [2].
Recent benchmarking studies have systematically evaluated multiple sequencing-based spatial transcriptomics methods using reference tissues with well-defined histological architectures, including mouse embryonic eyes, hippocampal regions, and olfactory bulbs [4]. These comparisons revealed significant variability in performance metrics including molecular diffusion, capture efficiency, and effective resolution across different technological platforms [4].
Tissue Preparation and Workflow
Proper tissue handling and preparation are critical for successful spatial transcriptomics experiments. The optimal approach depends on whether fresh frozen or formalin-fixed paraffin-embedded (FFPE) tissue samples are available [1]. Fresh frozen tissues generally provide higher RNA quality and are compatible with both NGS-based and imaging-based methods, while FFPE tissues enable retrospective studies using clinical archives but may present challenges for RNA recovery due to cross-linking [1].
The core workflow for NGS-based methods like Visium involves cryosectioning tissue at appropriate thickness (typically 10-20μm), mounting sections on barcoded spatial capture slides, performing H&E staining and imaging for histological reference, permeabilizing tissue to release RNA for capture on spatially barcoded oligos, and then proceeding with library preparation and sequencing [2] [1]. For imaging-based methods, tissue sections undergo fixation and permeabilization followed by multiple rounds of probe hybridization and imaging for targeted approaches, or reverse transcription and amplification steps for in situ sequencing methods [2].
Quality control throughout the process is essential, including assessment of RNA integrity, optimization of permeabilization conditions for NGS-based methods, and verification of probe specificity for imaging-based approaches [1]. Integration with complementary data modalities such as histopathological imaging, protein detection, and single-cell RNA sequencing references further enhances the biological insights gained from spatial transcriptomics experiments [5] [6].
Diagram 2: Comprehensive workflow for spatial transcriptomics experiments showing parallel paths for different tissue types and technologies.
Computational Analysis Frameworks
The complex, high-dimensional data generated by spatial transcriptomics technologies demands sophisticated computational approaches for proper interpretation and biological insight extraction. The analysis workflow typically encompasses multiple stages from raw data processing to advanced spatial analytics.
Spatial Domain Identification and Clustering
A fundamental application of spatial transcriptomics data is the identification of spatial domains—groups of cells or spots exhibiting similar gene expression patterns that often correspond to functional tissue units [7]. Both non-spatial clustering methods that rely solely on gene expression (e.g., Seurat, Louvain algorithm) and spatial methods that integrate transcriptional profiles with spatial coordinates have been developed [7]. Spatial clustering methods like SpaGCN combine spatial locations and histology data to construct weighted graphs, while STAGATE employs graph attention auto-encoder networks to delineate spatial domains [7].
Recent methodological advances have introduced more sophisticated frameworks for handling complex spatial transcriptomics datasets. The spCLUE framework utilizes a graph-contrastive-learning paradigm to infer spatial domains and spot representations across both single-slice and multi-slice data [7]. Similarly, STAIG integrates gene expression, spatial coordinates, and histological images using graph-contrastive learning coupled with high-performance feature extraction, enabling integration of tissue slices without pre-alignment while effectively removing batch effects [6].
Benchmarking studies have demonstrated that these advanced methods significantly outperform traditional approaches in spatial domain identification. For human brain datasets, STAIG achieved the highest median Adjusted Rand Index (0.69 across all slices) and Normalized Mutual Information (0.71), precisely distinguishing cortical layers L1-L6 and white matter regions that correspond to known anatomical structures [6].
Cell-Type Deconvolution and Spatial Mapping
Most sequencing-based spatial transcriptomics technologies do not yet achieve true single-cell resolution, producing data where each spot contains transcripts from multiple cells [8]. Computational deconvolution methods address this limitation by estimating the cell-type composition within each spot using reference single-cell RNA sequencing data [8].
Multiple algorithmic strategies have been developed for this purpose, including probabilistic methods (RCTD, cell2location, stereoscope), non-negative matrix factorization approaches (SPOTlight), and other specialized frameworks (Tangram, DSTG) [8]. Comprehensive benchmarking of ten state-of-the-art deconvolution methods using diverse real datasets revealed that RCTD and stereoscope achieve the most robust and accurate inferences across different tissues and technological platforms [8].
These deconvolution methods enable researchers to map specific cell types within tissue architecture, revealing organizational principles such as immune cell exclusion zones in tumors or layered neuronal subtypes in brain regions [8]. When combined with spatial domain identification, deconvolution provides a comprehensive view of cellular ecosystems and their organizational logic within tissues.
Table 2: Key Computational Methods for Spatial Transcriptomics Analysis
| Method | Primary Function | Algorithm Type | Key Features |
|---|---|---|---|
| spCLUE [7] | Spatial domain identification | Graph contrastive learning | Multi-slice integration, batch effect correction |
| STAIG [6] | Spatial domain identification | Image-aided graph learning | Histology integration, alignment-free integration |
| RCTD [8] | Cell-type deconvolution | Probabilistic (Poisson) | Robust reference-based decomposition |
| stereoscope [8] | Cell-type deconvolution | Probabilistic (negative binomial) | Accurate proportion estimation |
| cell2location [8] | Cell-type deconvolution | Probabilistic (Bayesian) | Comprehensive tissue architecture modeling |
| Tangram [8] | Cell-type mapping | Optimization | Single-cell resolution mapping |
| Spaco [9] | Spatial visualization | Color optimization | Spatially-aware color assignment |
Advanced Analytical Capabilities
Beyond basic clustering and deconvolution, spatial transcriptomics data supports increasingly sophisticated analytical approaches. Cell-cell communication inference methods leverage spatial proximity information to identify potential ligand-receptor interactions between neighboring cell types [1]. Spatially variable gene detection algorithms identify transcripts with expression patterns that show significant spatial dependence, often revealing genes involved in local microenvironmental regulation [4].
Recent methodological innovations also enable the prediction of spatial transcriptomics patterns from standard H&E-stained histology images using deep learning approaches. The MISO framework demonstrates that spatial gene expression can be predicted from H&E morphology with near single-cell resolution, potentially expanding spatial transcriptomics insights to vast historical archives of histology samples [5].
Data integration frameworks have been developed to harmonize spatial transcriptomics datasets across different experiments, conditions, and technologies. Methods like SPIRAL enable joint analysis of disparate spatial datasets, facilitating meta-analyses and cross-study comparisons [5]. Visualization tools such as Spaco address the critical challenge of effectively visualizing complex spatial data by implementing spatially aware colorization that ensures biologically distinct adjacent cell types receive maximally distinguishable colors [9].
Applications in Tumor Organization Architecture
Spatial transcriptomics has proven particularly transformative in cancer research, where it has illuminated previously inaccessible dimensions of tumor architecture, heterogeneity, and microenvironment organization. The technology enables comprehensive mapping of cellular ecosystems within tumors, revealing how spatial relationships influence disease progression and therapeutic response.
Tumor Microenvironment Deconstruction
The tumor microenvironment represents a complex ecosystem comprising malignant cells, immune populations, stromal components, and vasculature organized in specific spatial patterns that dictate disease behavior [3]. Spatial transcriptomics has enabled systematic cataloging of these cellular neighborhoods and their association with clinical outcomes. In breast cancer studies, combined spatial transcriptomic and proteomic profiling has revealed distinct immune evasion signatures and microenvironmental cues across different molecular subtypes [3]. Similar approaches in triple-negative breast cancers from women of African ancestry have identified distinctive patterns of immune infiltration and checkpoint interactions that may underlie health disparities [3].
Analysis of colorectal cancer tissues using spatial whole transcriptome approaches has demonstrated superior detection of rare cell populations compared to single-cell RNA sequencing alone, while simultaneously preserving critical spatial context [3]. These analyses have revealed spatially organized gene modules and pathway activity patterns that traditional approaches cannot resolve, including epithelial-mesenchymal transition gradients and immune barrier formations [3].
Tumor-Host Interface and Metastasis
The interface between tumor tissue and adjacent normal stroma represents a critical battlefield where cancer progression is determined. Spatial transcriptomics has uncovered intricate signaling networks at these boundaries that facilitate invasion and immune evasion [1]. In cutaneous melanoma, high-plex spatial profiling has identified highly localized immunosuppressive niches containing PD-L1-expressing myeloid cells positioned at the invasive front [1].
Studies of tumor metastasis using spatial transcriptomics have revealed how cancer cells remodel distant tissue microenvironments to support secondary growth. In brain metastases, spatial profiling has demonstrated how metastatic cells co-opt local stromal signaling networks and create immune-privileged niches that protect them from elimination [1]. These insights are informing novel therapeutic strategies aimed at disrupting these supportive ecosystems.
Therapy Response and Resistance
Spatial transcriptomics provides unique insights into the mechanisms underlying variable responses to cancer therapies. By comparing pre- and post-treatment tumor samples, researchers can identify spatial patterns associated with treatment sensitivity or resistance [3]. In HER2-positive breast cancer, spatial analyses have revealed immunological correlates of complete response to targeted therapy, including specific spatial arrangements of immune cell subsets in relation to tumor cells [1].
The technology has also been deployed to study cellular dynamics in response to emerging therapeutic modalities. For example, CosMx spatial molecular imaging has been integrated with CRISPR screening to map gene edits across thousands of tumor spheroids at single-cell resolution, revealing how specific genetic perturbations alter spatial organization and cellular function [3]. Similarly, multiomic spatial profiling has enabled tracking of CAR-T cells in solid tumors, mapping their spatial distribution, persistence, and functional states within the challenging tumor microenvironment [3].
Diagram 3: Applications of spatial transcriptomics in analyzing tumor organization architecture across multiple biological scales.
Essential Research Reagents and Platforms
The successful implementation of spatial transcriptomics research requires specific reagent systems and platform technologies designed to preserve spatial information while capturing comprehensive molecular data.
Table 3: Essential Research Reagent Solutions for Spatial Transcriptomics
| Reagent/Platform | Type | Primary Function | Key Applications |
|---|---|---|---|
| 10x Visium [2] [1] | NGS-based spatial platform | Whole transcriptome spatial mapping | Tumor heterogeneity, developmental biology, neuroscience |
| CosMx Human WTX Assay [3] | Imaging-based spatial platform | Subcellular spatial transcriptomics | FFPE tumors, CRISPR-edited models, tissue microarrays |
| GeoMx Digital Spatial Profiler [3] | Multiomic spatial platform | Region-specific protein/RNA profiling | High-throughput discovery, tumor microenvironment |
| nCounter ADC Panel [3] | Targeted spatial profiling | ADC characterization in 3D models | Drug efflux, permeability studies in spheroids |
| CellScape Platform [3] | Spatial proteomics | High-plex single-cell proteomics | Immune dynamics, cell signaling, tumor-immune interactions |
| PaintScape Platform [3] | Spatial genomics | 3D genome architecture visualization | Chromatin organization, structural variants in cancer |
| Spatial Barcoded Slides [2] | Consumable | Positional mRNA capture | Whole transcriptome spatial analysis on NGS platforms |
| Multiplex FISH Panels [1] | Probe library | Targeted RNA visualization | Validation studies, focused pathway analysis |
Spatial transcriptomics has fundamentally expanded our ability to study biology in its native anatomical context, creating new opportunities to understand tissue organization in development, homeostasis, and disease. The core principle of linking gene expression to tissue location has proven exceptionally powerful across diverse research domains, particularly in cancer biology where cellular spatial relationships dictate disease behavior and therapeutic outcomes.
The field continues to evolve rapidly along several technological trajectories. Resolution improvements are progressing toward comprehensive single-cell and subcellular spatial transcriptomics, while multiplexing capacities are expanding to enable full transcriptome coverage with imaging-based methods [2]. Multiomic integration represents another frontier, with methods now simultaneously capturing spatial information for transcriptomes, proteomes, and epigenomes within the same tissue section [3]. These advances are coupled with computational innovations that extract increasingly sophisticated biological insights from complex spatial data.
For tumor organization architecture research specifically, spatial transcriptomics offers unprecedented opportunities to decode the functional ecology of cancer ecosystems. The technology enables researchers to move beyond compositional analysis to understand how cellular spatial organization influences clinical behavior, treatment response, and resistance mechanisms. As these methods become more accessible and scalable, they are poised to transform cancer diagnostics and therapeutic development by revealing spatially-defined biomarkers and targets.
In conclusion, spatial transcriptomics represents a paradigm shift in molecular biology that finally enables comprehensive mapping of gene expression within its native structural context. By linking transcriptional information to tissue location as its core principle, this approach has opened new dimensions for understanding cellular organization in health and disease, with particular significance for unraveling the complex architecture of tumors. As technologies mature and analytical frameworks become more sophisticated, spatial transcriptomics will increasingly become an indispensable tool for biomedical research and clinical translation.
The tumor-microenvironment interface and the leading edge (also known as the invasive tumor front) are critical spatial domains where dynamic interactions between cancer cells and non-malignant components directly influence tumor progression, therapeutic resistance, and patient outcomes. These regions serve as active frontiers where tumor cells interact with immune cells, fibroblasts, and other stromal components, creating specialized niches that drive key oncogenic processes. The architectural organization within these domains is not random; rather, it follows predictable patterns that can be quantified and linked to clinical phenotypes [10] [11]. Technological advances in spatial transcriptomics and multiplexed imaging have enabled researchers to move beyond merely cataloging cellular diversity to understanding how the precise spatial arrangement of cells within tumors creates functional biological systems.
This architectural perspective reveals that the leading edge represents a specialized compartment with unique molecular and cellular features distinct from the tumor core. Cells occupying this interface zone often exhibit enhanced proliferative capacity, stem-like properties, and specialized interaction patterns with adjacent non-malignant cells [12]. The clinical relevance of these spatial domains is increasingly recognized, with evidence showing that specific spatial patterns of immune cell localization relative to tumor interfaces can predict patient response to immunotherapy and overall survival outcomes across multiple cancer types [10] [13] [11]. Understanding the biological processes occurring at these spatial boundaries provides not only fundamental insights into cancer biology but also opportunities for developing spatially-informed diagnostic biomarkers and therapeutic strategies that target the tumor-stroma interaction network.
Molecular and Cellular Definitions of Key Spatial Domains
Defining the Tumor-Microenvironment Interface
The tumor-microenvironment interface is a transcriptionally distinct region where tumor cells directly contact adjacent non-malignant tissues. This domain is characterized by a specialized "interface cell state" where both tumor and microenvironment cells upregulate a common set of genes, creating a unique transitional zone between compartments. Research in zebrafish melanoma models has demonstrated that this interface is histologically invisible but transcriptionally distinct, with specialized tumor and microenvironment cells upregulating cilia genes specifically where the tumor contacts neighboring tissues [14]. This interface region displays a transcriptional profile more correlated with tumor (R = 0.33) than with adjacent muscle tissue (R = 0.06), despite histological resemblance to the latter [14]. The identification of this domain requires integrated spatial molecular profiling rather than histological examination alone.
The interface region exhibits distinct pathway activation patterns, with enrichment of biological processes related to extracellular structure organization and immune cell migration [14]. From a topological perspective, this domain typically manifests as a narrow band ranging from 50-500 micrometers in width, depending on cancer type and individual tumor characteristics [12] [14]. In intrahepatic cholangiocarcinoma (ICC), the stromal region within the interface acts as a barrier at the tumor-normal interface while also extending into the tumor region, dispersing or encircling tumor cells [12]. This compartmentalization creates physically distinct microniches that influence cellular behavior and therapeutic responses.
Characterizing the Leading Edge/Invasive Front
The leading edge or invasive tumor front represents the advancing boundary where tumor cells infiltrate adjacent normal tissues. This domain is characterized by tumor cells with enhanced proliferative activity, stemness properties, and epithelial-mesenchymal transition (EMT) features [12]. In intrahepatic cholangiocarcinoma, tumor cells at the leading edge demonstrate significantly higher proliferation rates compared to those in the tumor core, with enrichment of pathways including ribosome biogenesis, ECM receptor interaction, and cell adhesion molecules [12]. These cells exhibit elevated stemness and EMT behaviors alongside reduced hypoxic stress compared to their core counterparts [12].
The leading edge architecture typically includes a unique "triad structure" composed of POSTN+ FAP+ cancer-associated fibroblasts (CAFs), SPP1+ macrophages, and endothelial cells that collectively foster tumor growth and progression [12]. Immune cells within this region display distinct functional states, with CD8+ T cells showing a naïve phenotype with low cytotoxicity and signs of exhaustion, likely due to compromised antigen presentation by antigen-presenting cells [12]. The leading edge also serves as a compartment where mucosal-associated invariant T (MAIT) cells recruit SPP1+ macrophages within the stroma, establishing immunosuppressive networks that facilitate immune evasion [12].
Table 1: Key Characteristics of Spatial Domains in Solid Tumors
| Characteristic | Tumor-Microenvironment Interface | Leading Edge/Invasive Front |
|---|---|---|
| Cellular Composition | Mixed tumor-stroma cell types; specialized "interface" cells | Predominantly tumor cells with infiltrating immune populations |
| Transcriptional Features | Upregulation of cilia genes; ETS-factor regulated | Enrichment of proliferation, stemness, and EMT pathways |
| Spatial Organization | Narrow band (50-500µm) at tumor-stroma boundary | Advancing margin with "triad structure" of CAFs, macrophages, endothelial cells |
| Immune Context | Macrophages predominantly residing at boundaries; variable T cell infiltration | CD8+ T cells with naïve phenotype, low cytotoxicity, exhaustion markers |
| Metabolic Features | Increased antigen presentation along edges | Increased metabolic activity at center of microregions |
| Clinical Significance | Conservation across human melanoma samples | Associated with enhanced proliferation and progression in ICC |
Quantitative Methodologies for Spatial Domain Analysis
Computational Framework for Domain Identification
The accurate identification and quantification of spatial domains requires specialized computational approaches that integrate molecular, cellular, and topological features. The SpaLinker framework provides a comprehensive methodology for identifying tumor-normal interface (TNI) regions by detecting spatial distribution patterns of tumor cells rather than relying on pre-defined tumor areas [11]. This approach calculates TNI scores based on the abrupt decrease in tumor cell abundance from the tumor core side to the normal side, effectively addressing the challenge of diffusely distributed tumor cells [11]. The framework employs a stepwise identification procedure that integrates gene expression signatures with cellular co-distribution patterns to improve spatial domain recognition accuracy.
For the identification of tertiary lymphoid structures (TLS) and other specialized microdomains, SpaLinker utilizes a feature selection procedure to determine predictive features, integrating the LC.50sig gene set with the co-distribution of plasma/B cells and T cells to improve identification accuracy [11]. Validation against well-annotated renal cell carcinoma datasets demonstrated that this unit-integrated features approach consistently outperforms single-feature analysis across multiple samples, with predicted TLS scores showing high consistency with ground truth annotations [11]. The framework has been successfully validated across diverse cancer types including hepatocellular carcinoma, intrahepatic cholangiocarcinoma, breast cancer, and nasopharyngeal carcinoma, achieving precision-recall area under the curve (PR-AUC) values from 0.76 to 0.86 and precision for TLS spots from 0.56 to 0.85 [11].
Statistical Spatial Pattern Analysis
Advanced statistical frameworks are essential for distinguishing biologically significant spatial patterns from random distributions. Spatiopath provides a null-hypothesis framework that extends Ripley's K function to analyze both cell-cell and cell-tumor interactions [13]. This method uses embedding functions to map cell contours and tumor regions, enabling the quantification of spatial associations between immune cells and tumor epithelium beyond simple accumulation metrics [13]. The approach analytically computes hyperparameters rather than relying on computationally intensive Monte Carlo simulations, making it suitable for analyzing large, complex tissue regions.
Spatiopath has demonstrated utility in identifying significant spatial patterns such as mast cells accumulating near T cells and tumor epithelium in lung cancer sections, revealing distinct spatial organization patterns with mast cells clustering near the epithelium and T cells positioned farther away [13]. This statistical rigor is particularly important for interpreting immune cell localization patterns that have prognostic significance, such as the distribution of CD8+ T cells in triple-negative breast cancer or myeloid and T cell associations in colorectal cancer [13]. By providing a mathematical foundation for spatial analysis in histopathology, these tools enable robust quantification of spatial features that can serve as biomarkers for patient outcomes and immunotherapy responses.
Diagram Title: Spatial Domain Analysis Workflow
Experimental Workflows for Spatial Domain Characterization
Integrated Single-Cell and Spatial Transcriptomics Protocol
Comprehensive characterization of spatial domains requires the integration of single-cell RNA sequencing (scRNA-seq) with spatial transcriptomics (ST) technologies. A standardized protocol for leading edge analysis involves collecting matched tissue samples from three distinct regions: core tumor tissues (T), leading-edge areas (L), and corresponding non-neoplastic adjacent tissues (N) [12]. For intrahepatic cholangiocarcinoma, this approach has been applied using samples from nine patients, with seven core tumor samples, nine leading-edge samples, and nine adjacent normal samples processed for scRNA-seq, while well-preserved leading-edge samples (n=5) undergo spatial transcriptomics sequencing on the 10x Genomics Visium platform [12]. This integrated design enables the identification of approximately 230,000 high-quality single-cell transcriptomes after quality control, capturing six predominant cell types: myeloid cells, epithelial cells (including malignant tumor cells), fibroblasts, endothelial cells, T/NK cells, and B cells [12].
The analytical workflow for spatial domain characterization includes several critical steps: (1) identification of tumor cells using the inferCNV algorithm with immune cells as reference, combined with marker-based strategies; (2) extraction and re-clustering of tumor cells with identification of proliferating tumor cells based on MKI67, TOP2A, and UBE2C expression; (3) assessment of transcriptional factor regulation using SCENIC; (4) differential expression analysis between spatial domains followed by KEGG pathway enrichment; and (5) evaluation of hypoxia, stemness, and EMT behaviors using the "addmodulescore" algorithm [12]. This integrated approach has revealed that proliferating tumor cells are significantly enriched in the leading-edge area compared to the tumor-core area, with elevated expression of transcription factors E2F1 and CEBPB associated with proliferation and stemness [12].
Advanced Lineage Tracing with Spatial Mapping
The integration of lineage tracing with spatial positioning provides unprecedented insights into clonal dynamics within spatial domains. PEtracer represents an advanced lineage tracing tool that captures cellular family trees while maintaining spatial information through repeated addition of short, predetermined DNA codes to cellular genomes over time [15]. This system utilizes prime editing technology to directly rewrite stretches of DNA with minimal undesired byproducts, enabling each cell to acquire unique lineage tracing marks while maintaining ancestral marks [15]. When applied to metastatic tumors in mice, this approach enables the reconstruction of tumor growth histories by combining lineage relationships with spatial positioning and gene expression profiles [15].
The experimental workflow for PEtracer-based spatial analysis includes: (1) in vivo lineage tracing during tumor growth; (2) tissue collection and processing; (3) advanced imaging to capture lineage tracing marks, spatial positions, and RNA expression patterns; and (4) computational integration of lineage, spatial, and transcriptional data [15]. Application of this approach to lung metastases has revealed that tumors comprise four distinct cellular neighborhoods: nutrient-rich lung-adjacent regions with the highest fitness cells, diverse leading-edge regions with lower fitness, low-oxygen regions beneath the leading edge, and tumor core regions with mixed living and dead cells [15]. This methodology demonstrates that cancer cell traits are influenced by both environmental factors (evidenced by location-dependent expression of Fgf1/Fgfbp1) and inherited lineage factors (evidenced by ancestry-associated expression of Cldn4 in lung-adjacent cells) [15].
Table 2: Experimental Platforms for Spatial Domain Analysis
| Technology Platform | Spatial Resolution | Molecular Coverage | Key Applications in Domain Analysis |
|---|---|---|---|
| 10X Genomics Visium | 55μm with 45μm gap | Whole transcriptome | Mapping microregional structures; identifying spatial subclones |
| CODEX Multiplex Imaging | Single-cell | 100+ proteins | Characterizing cellular neighborhoods; immune cell localization |
| MERFISH/Vizgen MERSCOPE | Single-cell | Targeted transcript panels | High-resolution mapping of interface regions |
| PEtracer Lineage Tracing | Single-cell | Lineage barcodes + transcriptome | Reconstruction of clonal dynamics in spatial domains |
| DBiT-seq | 10μm | Whole transcriptome + proteins | Integrated multi-omics for microenvironment analysis |
The Scientist's Toolkit: Essential Research Reagents and Platforms
Spatial Transcriptomics and Multiplexed Imaging Platforms
The characterization of tumor-microenvironment interfaces and leading edges relies on specialized research platforms that enable molecular profiling while preserving spatial context. The 10X Genomics Visium platform provides spatial transcriptomics capabilities with a resolution of 55μm with 45μm gaps between spots, enabling whole transcriptome profiling of tissue sections while maintaining architectural information [16] [14]. This technology has been successfully applied to define tumor microregions and spatial subclones across breast cancer, colorectal carcinoma, pancreatic ductal adenocarcinoma, renal cell carcinoma, uterine corpus endometrial carcinoma, and cholangiocarcinoma [16]. For higher-resolution spatial mapping, MERFISH (Vizgen MERSCOPE) and NanoString CosMx platforms offer single-cell resolution through multiplexed error-robust fluorescence in situ hybridization, allowing targeted transcript profiling at subcellular levels [10].
Multiplexed protein imaging platforms are essential for validating transcriptional findings and understanding protein-level interactions at spatial domains. CODEX (Co-Detection by Indexing) enables characterization of more than 100 antibodies in a single panel through cyclic fluorescence imaging with antibody-conjugated barcodes [16] [10]. This technology has been integrated with spatial transcriptomics to identify both immune hot and cold neighborhoods and enhanced immune exhaustion markers surrounding 3D subclones [16]. Alternative approaches include imaging mass cytometry (IMC) and multiplexed ion beam imaging (MIBI), which utilize antibody-metal conjugates detected by mass spectrometry, offering resolutions of 1μm and 300nm respectively with high signal-to-noise ratios for approximately 50 protein targets [10].
Computational Tools for Spatial Analysis
The interpretation of spatial domain biology requires specialized computational tools that can extract meaningful patterns from complex spatial data. SpaLinker represents an integrated framework specifically designed to decipher spatially resolved tumor microenvironment features at molecular, cellular, and tissue structure levels [11]. This tool enables the identification of specialized architectures including tertiary lymphoid structures and tumor-normal interface regions while linking these features to clinical phenotypes by integrating bulk RNA-seq data [11]. For deep learning-based integration of spatial omics with tumor morphology, MISO (deep learning-based multiscale integration of spTx with tumor morphology) predicts spatial transcriptomics from H&E-stained histological slides, significantly outperforming competing methods in extensive benchmarks [5].
Additional computational resources include Giotto, SPATA, and Squidpy, which facilitate basic processing and analysis of various spatial transcriptomics data types [11]. For statistical analysis of spatial patterns, Spatiopath provides a null-hypothesis framework that distinguishes significant immune cell associations from random distributions, extending Ripley's K function to analyze both cell-cell and cell-tumor interactions [13]. Specialized algorithms for spatial domain detection include Morph, used to refine tumor boundaries, determine distances of spots from boundaries, and construct layers of spots indexing their depths to tumor boundaries [16]. These computational tools collectively enable the quantitative analysis of spatial relationships that define functional domains within tumors.
Diagram Title: Research Toolkit for Spatial Domains
Clinical Translation and Therapeutic Implications
Prognostic and Predictive Biomarkers from Spatial Domains
The spatial organization of cells within tumor-microenvironment interfaces and leading edges provides clinically actionable information that can inform prognosis and treatment selection. Spatial patterns of immune cell infiltration within these domains have demonstrated significant prognostic value across multiple cancer types. For example, the spatial distribution of CD8+ T cells in triple-negative breast cancer and the association distances between myeloid cells and T cells in colorectal cancer have been correlated with patient outcomes [13]. Immunophenotypes defined by the degree and pattern of immune cell infiltration at tumor interfaces can serve as predictors of tumor recurrence and response to immunotherapy [10]. The identification of these spatial biomarkers moves beyond traditional quantitative assessments of cell densities to incorporate topological relationships that more accurately reflect functional immune responses.
Computational frameworks like SpaLinker enable the de novo linking of spatial TME features with clinical phenotypes by integrating rich clinical annotation information from bulk RNA-seq data with spatial transcriptomics [11]. This approach has identified clinically relevant spatial architectures across renal cell carcinoma, hepatocellular carcinoma, and melanoma, revealing features associated with distinct clinical outcomes without requiring direct clinical annotations of spatial omics samples [11]. The application of these methods has demonstrated that tumor cells and normal cells located at leading edges display elevated levels of unique molecules linked to immunotherapy response or patient prognosis [11]. These findings highlight the potential for spatial domain analysis to generate clinically validated biomarkers that can guide personalized treatment approaches.
Therapeutic Targeting of Domain-Specific Processes
The unique biological processes occurring at tumor-microenvironment interfaces and leading edges present opportunities for developing spatially-informed therapeutic strategies. The identification of a conserved cilia-enriched interface in human melanoma samples suggests that cilia-related pathways may represent therapeutic targets for impeding melanoma invasion and progression [14]. In intrahepatic cholangiocarcinoma, the "triad structure" composed of POSTN+ FAP+ fibroblasts, SPP1+ macrophages, and endothelial cells at the leading edge represents a multiparametric therapeutic target that could disrupt the synergistic interactions promoting tumor progression [12]. The specialized immune environment at leading edges, characterized by CD8+ T cells with naïve phenotypes and compromised cytotoxicity, suggests potential for immune-modulating approaches that reverse T cell exhaustion specifically within these domains.
Advanced lineage tracing approaches have revealed that targeting the most aggressive cellular populations within specific spatial domains may improve therapeutic efficacy [15]. The observation that cancer cells in nutrient-rich lung-adjacent regions exhibit the highest fitness highlights the potential for metabolic interventions that disrupt nutrient availability in these domains [15]. Similarly, the location-dependent expression of fitness-related genes such as Fgf1/Fgfbp1 suggests that microenvironmental factors shaping cellular behavior in specific domains could be therapeutically modulated [15]. The ability to characterize different populations of cells within tumors based on their spatial positioning enables the development of therapies that target the most aggressive populations more effectively, potentially overcoming resistance mechanisms rooted in spatial heterogeneity.
This case study examines a pivotal 2021 study that integrated spatially resolved transcriptomics (SRT), single-cell RNA-seq (scRNA-seq), and single-nucleus RNA-seq (snRNA-seq) to characterize the tumor-microenvironment (TME) interactions at the boundary of invasive melanoma [17] [18]. The research identified a previously unrecognized, histologically invisible "interface" cell state at the tumor-stroma junction, characterized by a conserved enrichment of cilia-related genes regulated by ETS-family transcription factors [17]. This discovery, conserved in human patient samples, underscores the critical power of SRT in uncovering spatial mechanisms of tumor adaptation and presents a potential new target for therapeutic intervention in melanoma progression [17] [18].
The architecture of the tumor microenvironment is a critical determinant of cancer progression, invasion, and therapeutic response. While traditional sequencing methods have revealed cellular heterogeneity, they necessitate tissue dissociation, thereby destroying the spatial context essential for understanding cell-cell interactions [17]. Spatially resolved transcriptomics (SRT) has emerged as a transformative technology, preserving tissue architecture while profiling gene expression [17]. This technical guide delves into a landmark study that leveraged SRT to deconstruct the spatial architecture of the melanoma-microenvironment interface, providing a framework for how spatial biology can elucidate fundamental mechanisms of tumor organization [17] [19].
Core Discovery: The Tumor-Microenvironment Interface
Identification of a Spatially Distinct Region
The study employed the 10× Genomics Visium platform to analyze frozen sections from adult zebrafish with BRAFV600E-driven melanomas [17]. This model allowed for the analysis of the entire tumor and all surrounding tissues in a single transverse section. Unsupervised clustering of the SRT data from 7,281 array spots revealed a transcriptionally distinct cluster of spots localized exclusively to the border between the tumor and adjacent muscle tissue [17]. Despite being histologically indistinguishable from the surrounding muscle, this "interface" region possessed a unique transcriptional profile.
The correlation analysis of averaged transcriptomes showed that the interface cluster was more similar to the tumor (R = 0.33) than to the muscle (R = 0.06), indicating its unique nature [17]. This demonstrated that transcriptional specialization at the boundary is not evident from histology alone and requires spatial transcriptomic profiling.
Transcriptional Hallmarks of the Interface State
Differential gene expression analysis identified key markers upregulated in the interface relative to both the tumor core and the muscle microenvironment. These included:
- Cilia-related genes: A common set of cilia genes was upregulated at the interface.
- Translational and stress response genes: atf3 and eif3ea.
- Ribosomal genes: Indicating increased translational activity.
- Microtubule cytoskeleton genes: tuba1a and tuba1c [17].
The upregulation of these genes, particularly the cilia ensemble, pointed to a specialized biological program active only at the tumor-microenvironment boundary.
Protein-Level Validation and Conservation in Human Melanoma
Immunofluorescence validation confirmed the enrichment of cilia proteins specifically where the tumor contacts the microenvironment, corroborating the transcriptional findings [17]. Crucially, the study demonstrated that this cilia-enriched interface is conserved in human melanoma patient samples, suggesting it represents a fundamental feature of melanoma biology with potential translational relevance [17] [18].
Experimental Protocols and Methodologies
Integrated Spatial Transcriptomics Workflow
The study employed a multi-modal approach to comprehensively characterize the interface. The following diagram illustrates the integrated experimental workflow:
Detailed Methodological Breakdown
1. Sample Preparation and SRT Processing:
- Tissue Source: Frozen sections from large, invasive melanomas in adult zebrafish BRAFV600E model [17].
- SRT Technology: 10× Genomics Visium platform (6.5 mm² capture area, 55 µm spot diameter with 45 µm gaps) [17].
- Data Output: 7,281 barcoded array spots across three samples, profiling 17,317 unique genes [17].
2. Bioinformatic Analysis:
- Data Integration: Combined SRT, scRNA-seq, and snRNA-seq datasets using an "anchoring framework" to identify common cell states [17].
- Cluster Identification: Community-detection based clustering performed on the integrated dataset, yielding 13 distinct spatial clusters [17].
- Spatial Gene Expression Analysis: Computed mean expression of Gene Ontology (GO) terms and measured spatial coherence of pathways by comparing distances between high-expression spots versus a null distribution [17].
- Differential Expression: Identified interface-specific genes by comparing the interface cluster to both tumor and muscle clusters [17].
3. Validation Methods:
- Protein Validation: Immunofluorescence staining performed to validate enrichment of cilia proteins at the tumor boundary [17].
- Human Conservation Analysis: Investigated human patient samples to confirm the presence of the cilia-enriched interface [17].
Quantitative Findings and Data Analysis
Spatial Transcriptomics Data Metrics
Table 1: Summary of Spatially Resolved Transcriptomics Data Metrics
| Metric | Sample A/B | Sample C | Overall Dataset |
|---|---|---|---|
| Number of Array Spots | Information missing | Information missing | 7,281 spots [17] |
| Transcripts (UMIs) per Spot | ~1,000-15,000 [17] | Fewer than A/B [17] | Information missing |
| Unique Genes per Spot | ~500-3,000 [17] | Fewer than A/B [17] | Information missing |
| Unique Genes Detected | Information missing | Information missing | 17,317 genes [17] |
| UMIs in Tumor Regions | Higher than microenvironment [17] | Information missing | Information missing |
Key Transcriptional Signatures
Table 2: Key Upregulated Genes and Pathways in the Interface Region
| Gene/Pathway Category | Specific Examples | Function/Putative Role in Interface |
|---|---|---|
| Cilia-Related Genes | Multiple identified genes | Cell signaling, sensing microenvironmental cues [17] |
| Translational/Stress Response | atf3, eif3ea | Cellular stress response, increased protein synthesis [17] |
| Ribosomal Genes | Multiple ribosomal proteins | Increased translational capacity [17] |
| Microtubule Cytoskeleton | tuba1a, tuba1c | Structural support for cilia, cell shape [17] |
| Spatially Organized Pathways (GO Terms) | Extracellular structure organization, Lipid import, IMP biosynthetic process [17] | Tumor-stroma co-adaptation, metabolic reprogramming [17] |
Biological Mechanism: ETS-Factor Regulation of Cilia Genes
The study identified ETS-family transcription factors as key regulators of the interface state. These factors normally act to suppress cilia genes outside of the interface. At the tumor-microenvironment boundary, this suppression is alleviated, leading to the specific upregulation of cilia genes [17]. This represents a clear example of how spatial context can dictate transcriptional regulation in cancer cells. The following diagram illustrates this regulatory mechanism:
The Scientist's Toolkit: Essential Research Reagents and Solutions
Table 3: Key Research Reagents and Computational Tools for Spatial Transcriptomics
| Reagent/Tool Category | Specific Examples | Function/Application |
|---|---|---|
| SRT Platform | 10× Genomics Visium [17] | Capture probe-based spatial transcriptomics; preserves tissue architecture. |
| Sequencing Methods | scRNA-seq, snRNA-seq [17] | Characterize cellular heterogeneity at single-cell resolution. |
| Bioinformatic Tools | SPOTlight, Stereoscope [17] | Deconvolute SRT data to infer single-cell resolution. |
| Bioinformatic Tools | Anchoring framework [17] | Integrate multiple datasets (SRT, scRNA-seq) to identify common cell states. |
| Image Analysis Pipeline | MARQO [20] | Streamlines whole-slide, single-cell resolution analysis of multiplexed tissue images. |
| Nuclear Segmentation Tool | StarDist [20] | Performs AI-based nuclear segmentation for cell identification. |
| Validation Technique | Multiplex Immunofluorescence / Immunofluorescence [17] [20] | Protein-level validation of transcriptional findings. |
Discussion and Implications for Spatial Cancer Research
This case study exemplifies how SRT technologies can move beyond cataloging cell types to reveal spatially organized functional states that are invisible to histology. The discovery of the "interface" state, with its distinct cilia-based biology, challenges the traditional binary view of tumors and their microenvironment, revealing instead a specialized zone of co-adapted cells [17].
From a therapeutic perspective, this interface represents a novel target for disrupting the tumor-stroma crosstalk essential for invasion and progression. The conservation of this state in human melanoma underscores its potential clinical relevance [17] [18]. For the field of spatial biology, this study provides a methodological blueprint for integrating multi-omic spatial data to uncover the architectural principles of tumor organization, a approach that is being extended through newer technologies like hyperplex immunofluorescence and advanced computational analysis [20] [19]. Future research will likely focus on targeting this interface state and exploring its existence and role in other cancer types.
The spatial organization of the tumor microenvironment (TME) profoundly influences cancer biology and therapy response [21]. In oral squamous cell carcinoma (OSCC), a defining feature of this organization is the distinct architectural and functional relationship between the tumor core (TC) and the leading edge (LE), also known as the invasive front. Traditional sequencing methods, which require tissue dissociation, lose the critical spatial context necessary to understand the functional compartmentalization of tumors [22]. The emergence of spatial transcriptomics (ST) has overcome this limitation, enabling the precise mapping of gene expression within the intact tissue architecture [23] [22]. This case study leverages ST to perform an integrative analysis of OSCC, framing the investigation within broader research on tumor spatial architecture to comprehensively characterize the conserved and tissue-specific transcriptional programs that define the TC and LE [21]. The findings provide pan-cancer insights into mechanisms of tumor progression and invasion, with direct implications for prognosis prediction and the development of novel targeted therapies.
Biological Findings: Distinct and Conserved TC and LE Architectures
Integrative single-cell and spatial transcriptomic analysis of HPV-negative OSCC has revealed that the TC and LE are not merely morphological regions but represent functionally specialized units with unique transcriptional profiles, cellular compositions, and cell-cell communication networks [21].
Unique Transcriptional Profiles and Cellular Compositions
Unsupervised clustering of malignant spots from ST data partitions the OSCC TME into three major clusters: a definitive TC, a definitive LE, and a transitory region that shares attributes of both [21].
Table 1: Key Characteristics of OSCC Tumor Core and Leading Edge
| Feature | Tumor Core (TC) | Leading Edge (LE) |
|---|---|---|
| Key Marker Genes | CLDN4, SPRR1B, SPRR2 family genes (SPRR2D, SPRR2E, SPRR2A) [21] | LAMC2, ITGA5, COL1A1, FN1, COL1A2, TIMP1, COL6A2 [21] |
| Major Biological Pathways & Hallmarks | Keratinization, epithelial cell differentiation, antimicrobial and immune-related pathways [21] | Epithelial-mesenchymal transition (EMT), extracellular matrix (ECM) organization, angiogenesis, cell cycle [21] |
| Activated Signaling Pathways | MSP-RON in macrophages, IL-33, p38 MAPK signaling [21] | GP6, EIF2, HOTAIR regulatory pathways [21] |
| Prognostic Association | Gene signature associated with improved prognosis across multiple cancer types [21] [24] | Gene signature associated with worse clinical outcomes across multiple cancer types [21] [24] |
| Pan-Cancer Conservation | Tissue-specific transcriptional program [21] | Conserved transcriptional program across different cancer types [21] |
The TC gene signature is associated with epithelial differentiation, characterized by high expression of genes involved in keratinization (e.g., SPRR2D, SPRR2E, SPRR2A) and inhibition of epithelial-mesenchymal transition (e.g., DEFB4A, LCN2) [21]. In contrast, the LE is enriched for genes driving ECM remodeling and a partial EMT (p-EMT) program, including COL1A1, FN1, and TIMP1 [21]. Pathway analysis predicts the activation of distinct canonical pathways: the LE shows activation of GP6, EIF2, and HOTAIR regulatory pathways, which are implicated in invasion and metastasis, while the TC activates pathways like MSP-RON and IL-33 signaling, suggesting a role in immune modulation [21].
A critical finding is the conservation of the LE gene signature across various cancer types, indicating common mechanisms underlying tumor invasion. Conversely, the TC transcriptional program appears to be more tissue-specific [21]. This conservation has direct clinical relevance, as the LE gene signature is associated with worse clinical outcomes, while the TC signature correlates with improved prognosis across multiple cancers [21] [24].
Ligand-Receptor Interactions and Cellular Neighborhoods
The cellular composition and interaction networks differ significantly between the TC and LE. Spatial deconvolution analysis identifies distinct cellular neighborhoods [21] [25]. The LE demonstrates a high density of cancer-associated fibroblasts (CAFs), with specific enrichment of ecm-MYCAFs (marked by LRRC15 and GJB2) and detox-iCAFs (marked by ADH1B and GPX3) [21]. These fibroblasts create a pro-invasive microenvironment through the deposition of ECM and paracrine signaling. The unique cellular compositions facilitate spatially organized ligand-receptor interactions that drive tumor progression. For instance, information flow from the TC to the LE is a key feature of the OSCC spatial architecture, and disrupting this communication has been identified as a potential therapeutic strategy [21].
Experimental Protocols and Methodologies
The characterization of TC and LE architectures relies on a combination of sophisticated ST technologies and advanced computational analyses.
Spatial Transcriptomics Wet-Lab Protocol
The following workflow details the key experimental steps for generating ST data, as applied in the featured OSCC study [21]:
Key Steps Explained:
- Sample Preparation: The protocol begins with fresh-frozen surgically resected OSCC samples sectioned into 10 μm thick slices and mounted on a specialized glass slide from the 10x Genomics Visium platform [21] [23].
- Histological Staining and Annotation: The tissue sections are stained with Hematoxylin and Eosin (H&E) and imaged. A pathologist then meticulously annotates morphological regions, such as the tumor core, leading edge, and stroma, which is crucial for correlating molecular data with tissue histology [21].
- Spatial Barcoding and Sequencing: The tissue is permeabilized to release mRNA transcripts, which bind to spatially barcoded capture probes on the slide. Each spot on the array (~55 μm in diameter, capturing ~5-50 cells) has a unique spatial barcode [21] [23]. The bound RNA is then reverse-transcribed into cDNA, which is used to construct a sequencing library.
- Data Generation: The libraries are sequenced on a high-throughput platform. In the featured study, this yielded transcriptomes from 24,876 spots across 12 samples, with a post-normalization average of 43,648 reads per spot [21].
Computational and Bioinformatic Analysis Workflow
The raw sequencing data undergoes a multi-step computational process to identify and characterize the TC and LE regions.
Table 2: Key Computational Methods for Spatial Data Analysis
| Analytical Step | Method/Tool | Purpose and Application in OSCC Study |
|---|---|---|
| Data Preprocessing | 10x Genomics Space Ranger, SCANPY [26] | Alignment, demultiplexing, generation of count matrices, normalization, and batch effect correction. |
| Malignant Cell Identification | Copy Number Variation (CNV) inference, Deconvolution | Stringent classification of malignant spots (CNV prob. >0.99 or deconvolution score >0.99) to separate tumor from non-malignant cells [21]. |
| Spatial Domain Identification | Unsupervised Louvain Clustering, Graph Neural Networks (e.g., SpaGCN) [21] [26] | To identify spatially coherent clusters like TC, LE, and transitory regions without prior biological knowledge. |
| Differential Expression & Pathway Analysis | Differential Gene Expression Analysis (DGEA), Ingenuity Pathway Analysis (IPA) | To find marker genes for TC and LE and identify activated upstream regulators and canonical pathways [21]. |
| Cell-Cell Communication | Ligand-Receptor Analysis Tools | To infer spatially-regulated ligand-receptor interactions between TC, LE, and stromal cells [21]. |
| Developmental Trajectory | RNA Velocity, Pseudotime Analysis | To infer patterns of tumor cell differentiation and state transitions from TC to LE [21]. |
A pivotal step is the use of unsupervised Louvain clustering on the expression profiles of pre-identified malignant spots. This analysis reproducibly generates clusters corresponding to the TC and LE, which are then validated through differential expression of known markers (e.g., CLDN4 for TC; LAMC2 for LE) [21]. Artificial intelligence, particularly graph neural networks (GNNs), can further enhance this process by integrating gene expression data with spatial coordinates to achieve superior clustering accuracy and identify these spatial domains [23] [26].
The Scientist's Toolkit: Key Research Reagents and Solutions
Successfully executing a spatial transcriptomics study requires a suite of specialized reagents and platforms.
Table 3: Essential Research Reagents and Platforms for Spatial Transcriptomics
| Item | Function and Role in TC/LE Analysis |
|---|---|
| 10x Genomics Visium Platform | A widely adopted spatial barcoding platform for unbiased, whole-transcriptome capture from intact tissue sections. It was used in the foundational OSCC study to profile 24,876 spots [21] [23]. |
| Fresh-Frozen Tissue Sections | The preferred sample type for full whole-transcriptome assays with Visium. Preserves RNA integrity better than FFPE for this application, though FFPE-compatible targeted panels are available [23]. |
| Spatially Barcoded Capture Probes | Oligonucleotide probes fixed on the Visium slide that capture mRNA from the overlying tissue. Each probe's unique barcode links gene expression data to a specific spatial coordinate [21] [22]. |
| H&E Staining Reagents | Enable histological visualization of the tissue section. Pathologist annotation of H&E images is critical for correlating molecular clusters (TC, LE) with tissue morphology [21]. |
| Single-Cell RNA-Seq Reference Dataset | A publicly available scRNA-seq dataset (e.g., from HNSCC) used for deconvolution. It helps infer the cellular composition of each ST spot and stringently identify malignant cells [21]. |
| AI/ML Clustering Tools (e.g., SpaGCN) | Graph convolutional network tools designed specifically for ST data. They integrate gene expression and spatial location to more accurately identify spatial domains like the TC and LE [26]. |
Clinical Implications and Therapeutic Opportunities
The distinct biology of the TC and LE presents unique opportunities for clinical intervention and biomarker development.
- Prognostic Biomarkers: The conserved LE gene signature is a powerful biomarker for worse clinical outcomes across multiple cancer types, while the TC signature is associated with improved prognosis [21] [24]. This suggests that spatial gene signatures could enhance patient risk stratification beyond current clinical and pathological criteria.
- Novel Therapeutic Targets: The study identified spatially-regulated patterns of cell development and ligand-receptor interactions. Using in silico modeling, the authors proposed that disrupting the information flow from the TC to the LE could be a viable therapeutic strategy and identified potential drugs to achieve this [21]. The activated pathways in the LE, such as those involving GP6 and HOTAIR, represent novel targets for inhibiting invasion and metastasis [21].
- Predictive Modeling for Drug Response: The spatially-defined transcriptional architectures are predictably associated with drug response. This enables the use of computational models to simulate how drugs might affect the different tumor compartments, paving the way for more effective and targeted treatment strategies [21] [25].
This case study demonstrates that the Tumor Core and Leading Edge of OSCC are not arbitrary anatomical regions but are fundamentally distinct functional units with conserved molecular architectures. Spatial transcriptomics has been instrumental in uncovering the unique transcriptional profiles, cellular ecosystems, and communication networks that define these compartments. The conserved, pro-invasive nature of the LE across cancer types highlights it as a critical target for therapeutic intervention. The integration of these spatial insights with artificial intelligence and in silico drug modeling holds exceptional promise for developing the next generation of spatially-informed, personalized cancer therapies. The interactive spatial atlases generated from this work serve as a foundational resource for the scientific community to further explore OSCC biology and develop novel targeted therapies [21] [24].
The tumor microenvironment (TME) represents a highly complex and dynamic ecosystem where malignant cells coexist with diverse immune populations, stromal components, and the extracellular matrix (ECM) within a precise spatial architecture. The organization of these elements is not random; rather, it follows distinct patterns that dictate disease progression and therapeutic response [27] [28]. Spatial transcriptomics has emerged as a groundbreaking technological frontier that bridges the critical gap between single-cell resolution and tissue context preservation, enabling researchers to quantify gene expression patterns directly within intact tissue sections while maintaining their native spatial coordinates [22]. This advanced approach has revolutionized our understanding of how biological pathways are spatially organized, particularly the intricate interplay between ECM remodeling and immune cell migration.
The significance of this spatial relationship is profound. The ECM, once considered merely a structural scaffold, is now recognized as a dynamic signaling hub that actively regulates immune cell behavior, influencing their activation, migration, and functional phenotypes [28]. Malignant cells exploit ECM remodeling to create immunosuppressive niches that facilitate immune evasion and tumor progression. Understanding these spatially organized pathways is therefore critical for developing novel therapeutic strategies that can overcome the physical and biochemical barriers imposed by the tumor ECM [28] [29]. This technical guide explores how spatial transcriptomics technologies are illuminating these complex interactions, with practical methodological guidance for researchers investigating the spatial architecture of tumor organization.
Technological Foundations of Spatial Transcriptomics
Spatial transcriptomics encompasses a suite of technologies that can be broadly categorized into three main approaches: imaging-based methods, sequencing-based methods, and laser capture microdissection (LCM)-based techniques [22]. Each offers distinct advantages and limitations for investigating ECM-immune interactions in the TME.
Imaging-based approaches, including in situ hybridization (ISH) and in situ sequencing (ISS), utilize fluorescently labeled probes to directly detect RNA transcripts within tissues, achieving subcellular resolution. Key methodologies include multiplexed error-robust fluorescence in situ hybridization (MERFISH), sequential FISH (seqFISH), and fluorescence in situ sequencing (FISSEQ) [22]. These technologies enable highly multiplexed gene expression analysis while preserving spatial context, making them ideal for mapping intricate cellular relationships at nanoscale resolution. However, they typically require pre-defined gene panels, limiting discovery potential for novel targets.
Sequencing-based approaches employ spatially barcoded oligonucleotide arrays to capture transcriptome-wide information from tissue sections. The 10x Genomics Visium platform is a prominent example that utilizes glass slides patterned with millions of spatially barcoded spots, each capturing mRNA from adjacent tissue areas [30] [31]. While offering whole transcriptome coverage, traditional implementations have resolution limitations (55-100 μm spot size), potentially capturing multiple cells per spot. Recent advancements like Slide-seq and High-Definition Spatial Transcriptomics (HDST) have dramatically improved resolution to near-single-cell level (approximately 10 μm) [27].
LCM-based approaches combine laser capture microdissection with RNA sequencing, enabling transcriptomic analysis of specific tissue regions identified by morphological criteria [22]. While providing regional specificity, these methods are lower throughput and result in destruction of tissue architecture during microdissection.
Table 1: Comparison of Major Spatial Transcriptomics Technologies
| Technology | Resolution | Throughput | Key Advantages | Limitations |
|---|---|---|---|---|
| MERFISH/seqFISH | Subcellular (single RNA molecules) | Hundreds to thousands of genes | High multiplexing capability, single-cell resolution | Requires pre-defined gene panels |
| Visium (10x Genomics) | 55-100 μm (multi-cell spots) | Whole transcriptome | Unbiased discovery, compatible with FFPE | Lower spatial resolution |
| Slide-seq/HDST | ~10 μm (near single-cell) | Whole transcriptome | High resolution, discovery-based | Complex data analysis, lower RNA capture efficiency |
| LCM-seq | Cellular to regional | Targeted or transcriptome | Precise region selection | Destructive to tissue, lower throughput |
Spatially Organized ECM-Immune Axis in Cancer
ECM Remodeling Creates Spatial Niches for Immune Evasion
The ECM undergoes dynamic remodeling in the TME through processes mediated by cancer-associated fibroblasts (CAFs), tumor-associated macrophages (TAMs), and malignant cells themselves. These alterations include changes in composition, stiffness, and architecture that collectively establish spatially distinct immune regulatory niches [28]. Spatial transcriptomics has been instrumental in decoding these patterns across various cancer types.
In lung adenocarcinoma (LUAD), spatial analysis has revealed that CAFs represent the most abundant non-malignant cell type, playing crucial roles in TME remodeling and prognosis determination [30]. Distinct histological subtypes display unique cellular composition profiles, with the micropapillary pattern exhibiting higher macrophage proportions and distinct gene expression pathways related to extracellular matrix organization and receptor tyrosine kinase signaling [30]. These spatially restricted gene modules create microenvironments conducive to tumor progression and immune evasion.
Clear cell renal cell carcinoma (ccRCC) research using cyclic immunohistochemistry (cycIHC) has demonstrated that the tumor periphery, particularly the pseudocapsule, exhibits homogeneous organization across the 3D scale but distinct cellular distribution gradients of T and B cells [29]. These immune patterns correspond specifically to deposited collagen types I and VI, suggesting an instructive role for ECM proteins in defining immune spatial organization [29].
ECM-Mediated Immune Cell Exclusion and Dysfunction
The ECM creates physical barriers that limit immune cell infiltration into tumor cores while simultaneously transmitting biochemical signals that alter immune cell function. Spatial transcriptomic analysis of myocardial infarction models treated with ECM hydrogels has revealed that ECM composition directly influences macrophage polarization states, with specific ECM components promoting pro-reparative macrophage phenotypes (Lyve1, Lgals3, Mrc1) versus pro-inflammatory states in control conditions [31]. This demonstrates the direct instructional capacity of ECM environments on immune cell differentiation and function.
In cervical cancer, the integration of single-cell RNA sequencing and spatial transcriptomics has enabled construction of a comprehensive spatial molecular atlas, identifying 38 distinct cellular neighborhoods with unique molecular characteristics [32]. These neighborhoods exhibit specialized immune compositions, with immunoglobulin-related genes (IGLC2, IGHG1, IGHG2) showing unique spatial expression characteristics restricted to specific microenvironments [32]. This spatial compartmentalization of immune function directly impacts therapeutic response.
Table 2: Key ECM Components and Their Spatial Immune Functions in Solid Tumors
| ECM Component | Spatial Distribution | Immune Regulatory Functions | Therapeutic Implications |
|---|---|---|---|
| Collagen I & VI | Tumor periphery, pseudocapsule in ccRCC [29] | Instructs T and B cell distribution gradients [29] | Potential target for normalizing immune infiltration |
| MMP2 | Upregulated in ECM hydrogel zones in MI models [31] | ECM remodeling facilitating immune cell migration | Combination therapy with immunotherapies |
| SPP1 | ECM-rich regions in subacute MI [31] | Immune response modulation | Biomarker for immune-active zones |
| Fibronectin | Stromal regions in multiple cancers [28] | T cell dysfunction through integrin signaling | Target for overcoming T cell exclusion |
| Hyaluronic Acid | Desmoplastic regions in pancreatic and breast cancers [28] | Physical barrier to immune cell infiltration | Enzymatic degradation to improve drug delivery |
Experimental Framework for Spatial Analysis of ECM-Immune Interactions
Sample Preparation and Spatial Library Construction
Robust spatial transcriptomics analysis begins with optimal sample preparation. For FFPE tissues, assess RNA quality by calculating DV200 values following extraction using kits such as Qiagen RNeasy FFPE [30]. Section tissues at 5μm thickness and mount on appropriate slides (e.g., Sigma-Aldrich Poly Prep Slides for Visium CytAssist) [30]. After drying overnight, incubate slides at 60°C for 2 hours, then perform deparaffinization according to established protocols (e.g., Visium CytAssist Spatial Gene Expression for FFPE — Deparaffinization, Decrosslinking, Immunofluorescence Staining & Imaging Protocol) [30].
Following deparaffinization, stain sections with hematoxylin and eosin and image at 20x magnification using a high-resolution slide scanner (e.g., Leica Aperio Versa8) [30]. For sequencing-based approaches like Visium, decrosslinking of H&E-stained sections should be conducted immediately after imaging. Subsequently, apply whole transcriptome probe panels to the tissue, allowing probe pairs to hybridize to their target genes and ligate to one another [30]. Transfer the slides to the spatial transcriptomics instrument (e.g., Visium CytAssist) for RNase treatment and permeabilization, enabling the ligated probes to hybridize to spatially barcoded oligonucleotides in the capture area [30]. Finally, construct spatial transcriptomics libraries from the probes for sequencing on appropriate platforms (e.g., Illumina NovaSeq 6000 system) [30].
Data Processing and Analytical Workflow
Process raw sequencing data using dedicated spatial analysis pipelines (e.g., Space Ranger pipelines version 2.0.0) [30], which performs tissue detection, fiducial detection, read alignment, and barcode/UMI counting against an appropriate reference genome (GRCh38 for human samples). Generate feature-spot matrices based on spatial barcodes for subsequent analysis with specialized R packages (e.g., Seurat V3.1.2) [30].
To normalize sequencing depth variance across spatial spots, particularly for technical artifacts and tissue anatomy, use the SCTransform function based on regularized negative binomial regression [30]. For multi-sample studies, integrate data from multiple spatial slides using reciprocal principal component analysis (RPCA) integration workflow to correct for potential batch effects [30]. Effectiveness of batch correction can be confirmed by ensuring spots do not primarily cluster by sample origin in UMAP projections.
Perform dimensionality reduction with principal component analysis (PCA), followed by shared nearest neighbor (SNN) construction based on Jaccard index between spots using the first 50 dimensions [30]. Cluster determination can be performed using the FindClusters function at resolution 0.6 by SNN modularity optimization [30]. The top 20 PCA dimensions are typically used for UMAP dimensional reduction, with clusters visualized in UMAP space using DimPlot and SpatialDimPlot functions [30].
Identify spatially variable features using the FindSpatiallyVariables function with the markvariogram method [30]. For cell type annotation, employ multi-step approaches including cell type deconvolution using specialized packages (e.g., SpaCET R package) [30], which utilizes reference single-cell RNA sequencing datasets to estimate the proportion of various cell types within each spatial spot. Each spot can then be assigned a dominant cell type based on the highest estimated proportion.
For further characterization of functional states and pathway enrichments within annotated spots, apply gene set variation analysis (GSVA) [30]. Calculate GSVA scores for each gene set per spot, allowing assessment of relative pathway activity within spatially defined regions and cell populations.
Figure 1: Experimental workflow for spatial analysis of ECM-immune interactions
Specialized Analytical Techniques for ECM-Immune Interactions
For investigating spatial ligand-receptor interactions, use computational tools like CellPhoneDB (version 3.1.0) with built-in databases for humans [30]. Input metadata and count matrix files, with p-values calculated using the proportion of means that exceeded the actual mean, ranked based on significance [30].
To analyze cellular differentiation states and plasticity, employ trajectory inference tools such as CytoTRACE (v.0.3.3), which uses transcriptional diversity as a proxy for developmental potential and assigns CytoTRACE scores to each cell [30]. Calculate these scores for each cluster independently using default parameters, identifying cell clusters with the lowest median CytoTRACE scores as potentially representing dedifferentiated states [30].
For deeper investigation of gene co-expression relationships, apply Weighted Gene Co-expression Network Analysis (WGCNA) to identify functional gene modules [32]. Construct gene adjacency matrices and topological overlap matrices, followed by hierarchical clustering approaches for co-expressed gene module identification. For specific cell type analysis, utilize hdWGCNA methodology with dynamic tree cutting techniques to identify functional gene modules, establishing minimum module sizes of 30 genes [32].
Visualization and Interpretation of Spatial Data
Mapping Multi-gene Spatial Expression Patterns
Construct continuous spatial expression maps using spatial interpolation algorithms to predict gene expression levels in unsampled regions [32]. Identify expression boundaries and transition zones by calculating spatial gradients of gene expression for key ECM and immune markers. Systematic analysis should include spatial expression distribution patterns for epithelial markers (MUC1, CDH1, KRT16), stromal markers (COL1A1, COMP, DCN), and immune markers (CD3G, FCGR1A) [32].
Spatial autocorrelation assessment should utilize methods that evaluate spatial clustering patterns of gene expression, with Moran's I index providing quantitative measures of spatial autocorrelation degrees [32]. This approach helps identify whether specific gene expression patterns are randomly distributed, clustered, or dispersed.
Advanced Computational Integration Methods
The integration of single-cell RNA sequencing with spatial transcriptomics has emerged as a powerful strategy for resolving the spatial and functional complexity of the TME [33]. Multimodal intersection analysis (MIA) can integrate scRNA-seq and ST data to map spatial cell-type relationships, as demonstrated in pancreatic ductal adenocarcinoma where stress-associated cancer cells were found to colocalize with inflammatory fibroblasts [33].
Emerging methods like SPIRAL enable integration and alignment of spatially resolved transcriptomics data across different experiments, conditions, and technologies [5]. Deep learning approaches such as MISO (multiscale integration of spatial omics with tumor morphology) can predict spatial transcriptomics from H&E-stained histological images, significantly outperforming competing methods in extensive benchmarks and enabling near single-cell-resolution, spatially-resolved gene expression prediction [5].
Figure 2: ECM-immune signaling pathway in tumor microenvironment
Research Reagent Solutions for Spatial Transcriptomics
Table 3: Essential Research Reagents for Spatial ECM-Immune Studies
| Reagent/Technology | Function/Application | Key Features | Reference |
|---|---|---|---|
| CosMx Human Whole Transcriptome (WTX) Assay | Spatially resolved, single-cell transcriptomic and proteomic data | Subcellular resolution, wide tissue compatibility, AI-powered analysis tools | [3] |
| CellScape Precise Spatial Proteomics | High-plex spatial proteomics with multiomic integration | EpicIF technology for iterative staining cycles, customizable workflows | [3] |
| GeoMx Discovery Proteome Atlas (DPA) | 1,100+ plex protein spatial profiling | Pairs with GeoMx Whole Transcriptome Atlas for same-section multiomics | [3] |
| nCounter ADC Development Panel | High-throughput molecular characterization | Robust performance with fragmented RNA, ideal for 3D tumor models | [3] |
| PaintScape Platform | In situ visualization of 3D genome architecture | Powered by jebFISH technology, maps chromatin folding in cancer | [3] |
| Visium CytAssist Spatial Gene Expression | Spatial transcriptomics from FFPE tissues | Compatible with archived samples, whole transcriptome coverage | [30] |
| 10x Genomics Visium Platform | Capture-based spatial transcriptomics | Genome-wide expression profiling with spatial context | [32] |
Spatial transcriptomics has fundamentally transformed our understanding of the spatially organized biological pathways connecting ECM remodeling to immune cell migration in the tumor microenvironment. The experimental frameworks and analytical workflows detailed in this technical guide provide researchers with comprehensive methodologies for investigating these critical interactions. As spatial technologies continue to evolve toward higher resolution and increased multiplexing capacity, and as computational methods for data integration become more sophisticated, we anticipate accelerated discovery of novel spatially-organized biomarkers and therapeutic targets. The convergence of spatial multi-omics with artificial intelligence approaches promises to unlock unprecedented insights into the spatial architecture of tumor organization, ultimately advancing precision oncology through spatially-informed diagnostic and therapeutic strategies.
A Researcher's Toolkit: Spatial Transcriptomics Technologies and Their Applications in Oncology
Spatial transcriptomics (ST) has emerged as a pivotal technology for studying tumor biology and its microenvironment by mapping gene expression data directly within the architectural context of intact tissue sections [34]. The loss of spatial information in conventional bulk and single-cell RNA sequencing represents a critical weakness in cancer research, where the functional organization of cells defines therapeutic responses and disease progression [35]. For researchers investigating tumor organization architecture, selecting between sequencing-based and imaging-based spatial methodologies represents a fundamental strategic decision with profound implications for data quality, biological insights, and resource allocation [36]. This technical guide provides a comprehensive comparison of these core methodologies, framing their capabilities within the specific context of tumor microenvironment research.
Core Technological Principles
Imaging-Based Spatial Transcriptomics
Imaging-based technologies utilize single-molecule fluorescence in situ hybridization (smFISH) as their foundational principle, enabling highly multiplexed detection of RNA transcripts through cyclic imaging processes [35]. These platforms differ primarily in their probe design, hybridization strategies, and signal amplification approaches, but share the common advantage of providing subcellular resolution, making them exceptionally valuable for dissecting cellular heterogeneity within complex tumor ecosystems [34] [36].
Xenium: This hybrid technology combines in situ sequencing (ISS) and in situ hybridization (ISH) through a padlock probe system. An average of 8 gene-specific padlock probes hybridize to target RNA, undergo ligation to form circular DNA constructs, and are enzymatically amplified via rolling circle amplification (RCA). Fluorescently labeled oligonucleotides then bind to barcodes within these probes across multiple imaging rounds, generating unique optical signatures for each target gene [35].
MERFISH: This platform employs a binary barcoding strategy where each gene is assigned a unique barcode of "0"s and "1"s. Thirty to fifty primary probes with "hangout tails" hybridize to target genes. Fluorescent secondary probes bind these tails across multiple imaging cycles, with fluorescence detection representing "1" and its absence representing "0" in the barcode sequence. This approach reduces optical crowding and incorporates error correction [35].
CosMx SMI: This method incorporates both hybridization and optical signature approaches with an additional positional dimension. It uses pools of five gene-specific probes containing a target-binding domain and a readout domain with 16 sub-domains. Branched, fluorescently labeled secondary probes provide signal amplification, with 16 cycles of hybridization and imaging generating unique color-position combinations for each gene [35].
Sequencing-Based Spatial Transcriptomics
Sequencing-based technologies integrate spatially barcoded arrays with next-generation sequencing to determine transcript locations and abundance. These methods typically capture mRNA using polyT tails incorporated into spatially barcoded probes on arrays, with these spatial barcodes becoming incorporated into cDNA during reverse transcription [35]. The fundamental difference among platforms primarily lies in feature size, which determines spatial resolution.
Visium and Visium HD: These platforms rely on spatially barcoded RNA-binding probes attached to slides, containing spatial barcodes, unique molecular identifiers (UMIs), and oligo-dT sequences for mRNA capture. The V2 workflow, suitable for FFPE tissues, uses adjacent probe pairs that hybridize to target mRNA and ligate before capture. Visium HD maintains the same core technology but reduces spot size to 2μm, significantly enhancing resolution compared to the standard 55μm spots [35].
Stereo-seq: This technology utilizes DNA nanoball (DNB) patterning for RNA capture. Oligo probes containing barcoded sequences, coordinate identities (CIDs), molecular identifiers (MIDs), and poly(dT) are circularized and amplified via rolling circle amplification to form DNBs. These are loaded onto grid-patterned arrays, with DNBs of approximately 0.2μm diameter and 0.5μm center-to-center spacing, providing exceptionally high spatial density [35].
GeoMx DSP: This platform employs a combination of barcoded probes and region-of-interest (ROI) selection rather than comprehensive spatial mapping. UV-cleavable oligonucleotide tags bound to RNA or protein targets are released from user-selected tissue regions, collected, and sequenced to quantify expression within morphologically defined areas [35].
Figure 1: Core workflow differences between imaging-based and sequencing-based spatial transcriptomics technologies. Imaging methods detect transcripts directly in tissue through cyclic fluorescence, while sequencing methods capture RNA onto barcoded arrays for subsequent sequencing and computational mapping.
Technical Comparison of Platform Performance
Resolution, Sensitivity, and Coverage Characteristics
The choice between sequencing-based and imaging-based technologies involves fundamental trade-offs between resolution, gene coverage, and practical considerations like cost and throughput [36]. These parameters directly influence the biological questions that can be effectively addressed in tumor research.
Table 1: Technical Parameter Comparison Between Major Spatial Transcriptomics Platforms
| Platform | Technology Type | Spatial Resolution | Gene Coverage | Tissue Type Compatibility | Key Strengths |
|---|---|---|---|---|---|
| 10X Visium | Sequencing-based | 55μm spots (multi-cell) | Whole transcriptome | FFPE, Fresh Frozen | Unbiased discovery, standard workflows |
| 10X Visium HD | Sequencing-based | 2μm bins (single-cell) | Whole transcriptome | FFPE, Fresh Frozen | Single-cell resolution with full transcriptome |
| Stereo-seq | Sequencing-based | 0.5μm center-to-center (subcellular) | Whole transcriptome | FFPE, Fresh Frozen | Ultra-high resolution, large tissue areas |
| Xenium | Imaging-based | Single-cell to subcellular | Targeted panels (300-500 genes) | FFPE, Fresh Frozen | High sensitivity, precise localization |
| MERFISH | Imaging-based | Single-cell to subcellular | Targeted panels (500-1,000 genes) | FFPE, Fresh Frozen | Low error rate, quantitative accuracy |
| CosMx SMI | Imaging-based | Single-cell to subcellular | Targeted panels (1,000-6,000 genes) | FFPE, Fresh Frozen | Large panel size, high plex capability |
| GeoMx DSP | Sequencing-based | ROI-based (cellular to regional) | Whole transcriptome or targeted | FFPE, Fresh Frozen | Morphology-guided selection, high plex RNA/protein |
Performance Metrics in Tumor Samples
Recent benchmarking studies using formalin-fixed paraffin-embedded (FFPE) tumor samples provide critical performance comparisons directly relevant to cancer research. These evaluations reveal platform-specific characteristics in sensitivity, accuracy, and practical implementation.
Table 2: Experimental Performance Metrics from FFPE Tumor Tissue Evaluation [34]
| Performance Metric | CosMx | MERFISH | Xenium (Unimodal) | Xenium (Multimodal) |
|---|---|---|---|---|
| Transcripts per Cell | Highest detection | Moderate to high (tissue age dependent) | Lower than imaging | Lowest detection |
| Unique Genes per Cell | Highest detection | Moderate (improved in newer tissues) | Lower than imaging | Lowest detection |
| Negative Control Performance | Some target genes expressed at control levels | Limited data (lacks negative controls) | Minimal target genes at control levels | Few target genes at control levels |
| Cell Segmentation Basis | Morphology-based | Morphology-based | Transcript-based | Multi-modal (transcript + morphology) |
| Tissue Coverage | Limited (545μm × 545μm FOVs) | Whole tissue | Whole tissue | Whole tissue |
A 2025 systematic comparison using lung adenocarcinoma and pleural mesothelioma samples highlighted crucial performance differences. CosMx demonstrated the highest transcript and unique gene counts per cell, though it showed variability in target gene probe performance relative to negative controls, with some key markers for cell type annotation (e.g., CD3D, CD40LG, FOXP3) expressing similarly to negative controls in older tissue samples [34]. MERFISH performance was notably dependent on tissue age, with significantly better detection in newer FFPE samples, while Xenium showed more consistent performance across sample types but with lower overall sensitivity [34].
Methodological Implementation for Tumor Research
Experimental Design Considerations
Choosing between sequencing-based and imaging-based approaches depends primarily on the research objective: discovery versus validation [36]. Sequencing-based methods are ideal for unbiased exploration of tumor heterogeneity and microenvironment composition, while imaging-based approaches excel at validating spatial patterns of known markers at high resolution.
For sequencing-based approaches, Visium HD now enables true single-cell resolution across the whole transcriptome, making it suitable for comprehensive tumor atlas construction [35]. Stereo-seq offers even higher spatial density for capturing rare cell populations and subtle tumor microenvironments [35]. For imaging-based platforms, CosMx provides the largest targeted panels (up to 6,000 genes), enabling detailed characterization of specific cellular programs within tumor ecosystems [35].
Sample Preparation and Protocol Selection
FFPE tissues represent the standard for clinical cancer samples, and all major platforms now support FFPE compatibility [34]. However, tissue age and preservation quality significantly impact data quality, particularly for imaging-based methods [34]. For sequencing-based approaches, the Visium V2 workflow with CytAssist instrument simplifies the process by transferring probes from standard slides to Visium slides, optimizing handling of precious clinical samples [35].
Protocol duration and complexity differ substantially between approaches. Sequencing-based methods typically follow standardized library preparation pipelines that are more easily scalable for multiple samples [36]. Imaging-based experiments require specialized equipment, custom probe panels, and extended imaging times, increasing overall time and cost per sample [36].
Essential Research Reagents and Solutions
Table 3: Key Research Reagent Solutions for Spatial Transcriptomics
| Reagent Category | Specific Examples | Function | Platform Applications |
|---|---|---|---|
| Gene Expression Panels | CosMx Human Universal Cell Characterization Panel (1,000-plex), MERFISH Immuno-Oncology Panel (500-plex), Xenium Human Lung Panel (289-plex + custom) | Targeted gene detection for cellular phenotyping | Imaging-based platforms (Xenium, MERFISH, CosMx) |
| Whole Transcriptome Kits | Visium HD Gene Expression Kit, Stereo-seq WTA Kit | Comprehensive transcriptome coverage | Sequencing-based platforms (Visium HD, Stereo-seq) |
| Multimodal Integration Reagents | CellScape EpicIF reagents, GeoMx Protein Panels | Combined RNA and protein detection | Multiomic platforms (CellScape, GeoMx) |
| Sample Preparation Kits | Visium FFPE Tissue Optimization Kit, Xenium FFPE Protocol reagents | Tissue preparation, permeabilization, and RNA accessibility | All platforms with FFPE support |
| Signal Amplification Systems | CosMx branched readout domains, Xenium RCA reagents | Enhanced detection sensitivity | Imaging-based platforms |
Data Analysis and Visualization Approaches
Analytical Pipelines for Spatial Tumor Data
Spatial transcriptomics data analysis requires specialized computational approaches that integrate gene expression with spatial coordinates [37]. Common analytical tasks include dimensionality reduction, clustering, cell-type identification, and spatial pattern detection [37]. Popular frameworks like Seurat, Giotto, Scanpy, and Squidpy provide standardized workflows for these analyses [37] [9].
For sequencing-based data, analysis typically begins with Space Ranger for alignment, tissue detection, barcode counting, and feature-spot matrix generation [37]. Normalization methods like Scran or SCNorm address technical variability, followed by clustering using Louvain, Leiden, or other community detection algorithms [37]. Cell-type identification can be performed through projection to reference datasets (scmap, SingleR) or signature-based methods (Cell-ID) [37].
For imaging-based data, analytical workflows must account for cell segmentation challenges. As demonstrated in comparative studies, segmentation approach (transcript-based vs. morphology-based) significantly impacts cell calling and downstream analysis [34]. Methods like JSTA use deep learning for joint cell segmentation and type annotation in imaging data [37].
Visualization Strategies for Tumor Architecture
Effective visualization is crucial for interpreting spatial relationships within tumor ecosystems. Spaco (Spatial Palette Optimization) addresses the critical challenge of colorizing categorical spatial data by introducing a Degree of Interlacement (DOI) metric that models spatial relationships between cell types [9]. This ensures adjacent cell types receive maximally distinguishable colors, significantly enhancing visual interpretation in complex tumor microenvironments.
Figure 2: Spatial transcriptomics data analysis workflow with emphasis on visualization strategies. The Spaco method optimizes color assignment based on spatial relationships between cell types, enhancing interpretation of complex tumor microenvironments.
Standard visualization approaches include plotting cell positions as centroids or polygons, colored by metadata such as cell type or gene expression [38]. For exploring tumor microenvironments, highlighting specific cell types of interest while muting background cells can reveal spatial patterns of immune infiltration or stromal organization [38]. Neighborhood analysis techniques identify recurrent cellular communities within tumors, providing insights into microenvironmental organization [37].
Platform Selection Framework for Tumor Studies
Decision Framework Based on Research Objectives
The choice between sequencing-based and imaging-based spatial technologies should be guided by specific research questions, sample characteristics, and analytical requirements [36]. This decision framework provides guidance for selecting optimal approaches based on common scenarios in tumor biology research.
Choose sequencing-based technologies when:
- Conducting discovery-phase research to identify novel biomarkers or cell states
- Requiring whole transcriptome coverage without prior knowledge of key genes
- Studying heterogeneous tumors with undefined cellular composition
- Processing multiple samples in parallel for cohort studies
- Integrating with existing single-cell RNA-seq datasets
Choose imaging-based technologies when:
- Validating spatial patterns of previously identified gene signatures
- Requiring single-cell or subcellular resolution for precise localization
- Studying spatial organization of known cell types in tumor microenvironments
- Working with limited tissue samples where maximizing information from small areas is critical
- Combining RNA detection with protein markers in multiomic assays
Integrated Approaches for Comprehensive Tumor Characterization
For the most complete understanding of tumor architecture, combined approaches leveraging both sequencing-based and imaging-based methods often provide superior insights [36]. Sequencing-based spatial transcriptomics can identify novel gene signatures and cellular heterogeneity across entire tissue sections, while follow-up imaging-based validation confirms spatial localization at high resolution [36].
Additionally, integrating spatial data with single-cell RNA sequencing helps resolve mixed cellular signals in sequencing-based spatial data and informs panel design for imaging-based approaches [36]. This integrated framework enables both discovery and validation within the same research program, leveraging the complementary strengths of both technological approaches.
The complex spatial organization of cells within a tumor is a critical determinant of cancer progression, therapeutic response, and patient outcome. Traditional sequencing methods, which require tissue dissociation, irrevocably lose this architectural context. Spatial transcriptomics (ST) has emerged as a transformative technology that enables the mapping of gene expression data within the intact tissue landscape, preserving the precise spatial relationships between malignant, immune, and stromal cells [39]. This capability is particularly vital for immuno-oncology research, where the cellular composition and organization of the tumor microenvironment (TME) directly influence immune evasion and therapy efficacy [34]. By integrating deep transcriptome profiling with histological imaging, ST technologies allow researchers to visualize the functional interactions and heterogeneity that define cancer ecosystems. This technical guide provides an in-depth comparison of four major spatial platforms—10x Visium, Slide-seq, Stereo-seq, and GeoMx DSP—framed within the context of investigating tumor organization and architecture. We detail their core methodologies, present comparative performance data, and outline experimental protocols to inform platform selection for cancer research.
Spatial transcriptomics technologies can be broadly categorized into two groups: sequencing-based and imaging-based methods [35]. Sequencing-based technologies (like Visium, Slide-seq, and Stereo-seq) capture mRNA using spatially barcoded probes on a surface, followed by library preparation and next-generation sequencing (NGS) to decode the spatial origin and identity of each transcript. In contrast, imaging-based technologies (a category that includes GeoMx DSP's readout, though it differs in profiling approach) utilize in situ hybridization or sequencing to directly visualize RNA molecules within tissue sections through iterative cycles of fluorescent probing and imaging [35] [39].
The table below provides a quantitative comparison of the core technical parameters for the platforms covered in this guide.
Table 1: Core Technical Specifications of Spatial Transcriptomics Platforms
| Platform | Core Technology | Spatial Resolution | Key Strength | Tissue Compatibility | Species Compatibility | Multimodal Capability |
|---|---|---|---|---|---|---|
| 10x Visium HD | Sequencing-based (spatially barcoded 2µm spots) [40] | 2 µm spot size (single-cell scale) [40] | Balanced resolution & whole transcriptome coverage [40] | FFPE, Fresh Frozen, Fixed Frozen [40] | Human, Mouse (HD WT Panel); Agnostic (HD 3' Gene Expression) [40] | Gene Expression, Protein (IF), Morphology (H&E) [40] |
| Stereo-seq | Sequencing-based (DNA Nanoball array) [35] | 500 nm center-to-center (subcellular) [41] [35] | Extremely high resolution & massive FOV (up to 13cm x 13cm) [41] | Fresh Frozen [35] | Agnostic [35] | Information not available |
| GeoMx DSP | Sequencing-based (UV-cleavable barcoded probes from ROI) [42] | 10 µm (region-of-interest guided) [42] | Flexible, biology-driven profiling of predefined regions; high-plex RNA + protein from same section [42] [43] | FFPE, Fresh Frozen [42] | Customizable via spike-in probes [42] | Same-section RNA + Protein (1,100-plex protein, 18,000-plex RNA) [43] |
Platform-Specific Workflows and Tumor Biology Applications
10x Visium HD
Workflow: The Visium HD assay for FFPE tissue begins with tissue sectioning onto a specialized glass slide containing millions of spatially barcoded 2 µm x 2 µm spots [40]. The workflow requires the CytAssist instrument to transfer gene-specific probes from a standard glass slide onto the Visium slide, optimizing mRNA capture from potentially degraded FFPE RNA [40] [35]. After probe hybridization and ligation, the probe complexes are released, and the library is constructed for sequencing. Bioinformatic analysis then maps the sequenced reads back to their spatial coordinates using the barcodes [35].
Application in Tumor Research: Visium HD's single-cell-scale resolution is ideal for mapping intratumoral heterogeneity and delineating distinct cellular neighborhoods within the TME. Its whole transcriptome coverage supports unsupervised discovery of novel gene expression signatures directly from the spatial context of the tumor [40].
Stereo-seq
Workflow: Stereo-seq utilizes DNA Nanoball (DNB) technology. Synthesized oligo probes containing spatial coordinate barcodes are circularized and amplified via rolling circle amplification (RCA) to form DNBs [35]. These DNBs are then patterned onto a chip to create the capture array. With a DNB diameter of 220 nm and a center-to-center distance of 500 nm, this array offers nanoscale resolution [41] [35]. mRNA from fresh frozen tissue sections is captured by the poly(dT) sequences on the DNBs, followed by on-slide cDNA synthesis, library preparation, and sequencing [35].
Application in Tumor Research: Stereo-seq's combination of subcellular resolution and a massive field of view (up to 1 cm x 1 cm standard, customizable up to 13 cm x 13 cm) is uniquely powerful for pan-cancer atlas projects and studying rare tumor populations or metastatic niches across large tissue areas without the need for tiling [41].
GeoMx Digital Spatial Profiler (DSP)
Workflow: GeoMx DSP employs a fundamentally different, region-of-interest (ROI) driven approach. Tissue sections are stained with fluorescent morphology markers (e.g., for tumor, immune cell compartments) and oligonucleotide-tagged probes for RNA (and/or protein) [42]. After imaging, the user selects ROIs based on the tissue morphology. The instrument then uses a digital micromirror device to project UV light onto the selected ROIs, photocleaving and releasing the oligonucleotide barcodes for collection [42]. These barcodes are quantified via NGS or the nCounter system to determine analyte abundance in each specific ROI.
Application in Tumor Research: GeoMx DSP is exceptionally well-suited for hypothesis-driven spatial biology. It allows researchers to quantitatively compare gene expression profiles between specific, clinically relevant compartments—for instance, comparing the immune infiltrate in the tumor core versus the invasive margin, or profiling regions with high versus low PD-L1 protein expression [42] [34]. Its high-plex, same-section multiomic capability is a key asset for comprehensive biomarker discovery.
Diagram 1: GeoMx DSP workflow for spatially resolved omics.
Experimental Protocol for Tumor Analysis
This section outlines a generalized protocol for a spatial transcriptomic study of FFPE tumor tissue, integrating steps common to platforms like Visium HD and GeoMx DSP.
A. Sample Preparation and Sectioning
- Tissue Source: Use human or mouse FFPE tumor tissue blocks. Tissue Microarrays (TMAs) can be used for high-throughput cohort studies on GeoMx DSP and Visium [3] [34].
- Sectioning: Cut serial sections of 5-10 µm thickness using a microtome.
- Mounting: For Visium HD, mount sections onto the specific Visium HD slide using the CytAssist instrument for probe transfer [40]. For GeoMx DSP, mount on standard glass slides.
B. On-Slide Assay
- Deparaffinization and Rehydration: Standard xylene and ethanol series.
- Antigen Retrieval and Permeabilization: Use target retrieval solutions and proteases to expose RNA and/or epitopes.
- Probe Hybridization:
- Visium HD: Gene-specific probes are hybridized to the tissue and then transferred to the slide's capture oligos via CytAssist-mediated ligation [40].
- GeoMx DSP: Incubate tissue with the chosen RNA (Whole Transcriptome Atlas) and/or protein (Discovery Proteome Atlas) probe sets, along with fluorescent morphology markers [42] [43].
- Washing: Stringent washes to remove unbound probes.
C. Imaging and Profile Generation
- Imaging: Acquire high-resolution images of the entire tissue section using the platform's imaging system. For GeoMx DSP, this image is used to select ROIs.
- Spatial Barcode Collection:
- Visium HD: Synthesize cDNA, release the library from the slide, and prepare sequencing libraries.
- GeoMx DSP: Select ROIs and segments based on fluorescent morphology. UV light is used to cleave and collect oligonucleotide tags from the selected areas [42].
- Sequencing and Data Generation: Prepare sequencing libraries from the collected material and run on an NGS platform. The final output is a digital count matrix of gene expression (and protein abundance for GeoMx multiomics) linked to spatial coordinates or ROIs.
The Scientist's Toolkit: Essential Research Reagents and Materials
Successful spatial transcriptomics experiments rely on a suite of specialized reagents and instruments. The table below lists key components for setting up a spatial biology workflow in a cancer research lab.
Table 2: Key Research Reagent Solutions for Spatial Transcriptomics
| Item | Function | Example Kits/Assays |
|---|---|---|
| Spatial Expression Slide | Solid support with spatially barcoded oligos for mRNA capture. | 10x Visium HD Slide (2 Capture Areas) [40] |
| Gene Expression Panel | Probe sets designed to profile transcriptome or targeted gene panels. | Visium HD HD WT Panel (Human/Mouse), CosMx Human Whole Transcriptome Panel, GeoMx Whole Transcriptome Atlas [40] [43] [34] |
| Multiomics Panel | Antibody-based panels for simultaneous protein detection. | GeoMx Discovery Proteome Atlas (1,200+ proteins), CosMx Multiomics (76 proteins with RNA) [43] |
| Morphology Markers | Fluorescent antibodies or dyes to visualize tissue and cell structures for ROI selection. | Pan-cytokeratin (tumor), CD45 (immune), SYTO13 (nuclei) [42] |
| Library Prep Kit | Reagents for constructing sequencing libraries from spatially barcoded cDNA or oligos. | Illumina-Compatible Library Kit (platform-specific) |
| Data Analysis Suite | Software for processing, visualizing, and analyzing spatial data. | 10x Loupe Browser, Bruker DSPDA, STUtility [42] |
The choice of an optimal spatial transcriptomics platform is dictated by the specific research question in tumor biology. 10x Visium HD offers a robust, discovery-oriented solution with whole transcriptome coverage at a resolution suitable for analyzing cellular neighborhoods. Stereo-seq pushes the boundaries of resolution and scale, making it ideal for constructing detailed atlases and studying rare cellular events across vast tissue landscapes. GeoMx DSP provides unparalleled flexibility for targeted, hypothesis-driven research, enabling direct, quantitative comparison of predefined tissue compartments and integrated multiomic profiling from the same section. As these technologies continue to mature, their integration with advanced computational methods, such as deep learning models that predict gene expression from routine histology slides [5], promises to further democratize and enhance our ability to decode the complex architecture of cancer.
Imaging-based spatial transcriptomics (iST) has emerged as a pivotal technology for studying tumor biology and associated microenvironments by characterizing gene expression profiles within their native histological context [34]. These platforms preserve the spatial architecture of tissues while enabling single-cell or subcellular resolution mapping of RNA molecules, providing unprecedented insights into cellular states and interactions within complex tissues [44]. The ability to study the "whole panorama of cellular and molecular interactions in tissues accurately and within their functional context is vital for understanding health and disease" [34], particularly in cancer research where tumor development and accompanying immune responses depend on the location of different cell-type populations and tissue organization [45].
Among commercially available iST platforms, CosMx (NanoString), Xenium (10x Genomics), and MERFISH (Vizgen) have gained significant traction, each employing variations of fluorescence in situ hybridization (FISH) with distinct chemical approaches, probe designs, and signal amplification strategies [44]. These technologies differ fundamentally in their sample preparation protocols, amplification methods, gene selection for panel design, and cell-segmentation processes [34]. Understanding their comparative strengths and limitations is essential for researchers designing studies involving precious tumor samples, especially in translational oncology research utilizing formalin-fixed paraffin-embedded (FFPE) tissues, which represent the current standard for sample processing and archiving in pathology [34] [44].
Core Technological Specifications
Table 1: Core Technical Specifications of Major iST Platforms
| Feature | CosMx | Xenium | MERFISH |
|---|---|---|---|
| Primary Technology | Branch chain hybridization amplification [44] | Padlock probes with rolling circle amplification [44] [46] | Direct probe hybridization with transcript tiling [47] [44] |
| Spatial Resolution | Subcellular [34] | Subcellular [48] [46] | Subcellular, nanometer precision [47] |
| Gene Panel Size | 1,000-plex (standard panel) [34], 6K panel available [49] | 289-392 genes (customizable) [34], up to 5,000 genes [49] | 500-plex (standard panel) [34], customizable [47] |
| Sample Compatibility | FFPE, fresh frozen [34] | FFPE, fresh frozen [48] [46] | FFPE, fresh frozen [47] |
| Cell Segmentation | Manufacturer's algorithm + CellPose [50] | Uni/multi-modal segmentation [34], DAPI-based with expansion [46] | Cell boundary staining with manufacturer's algorithm [51] |
| Key Differentiator | Largest standard panel size [34] | High sensitivity and specificity [49] [46] | Single-molecule resolution with error-robust barcoding [47] [51] |
Technology Workflow Comparison
Performance Benchmarking in Tumor Research
Detection Sensitivity and Specificity
Systematic benchmarking studies using controlled experimental conditions with serial sections of tumor tissues provide critical insights into platform performance characteristics. A comprehensive evaluation using colon adenocarcinoma, hepatocellular carcinoma, and ovarian cancer samples revealed distinct detection patterns across platforms [49]. Xenium 5K demonstrated superior sensitivity for multiple marker genes including the epithelial cell marker EPCAM, which showed well-defined spatial patterns consistent with H&E staining and Pan-Cytokeratin immunostaining on adjacent sections [49]. In comparative analyses, Stereo-seq v1.3, Visium HD FFPE, and Xenium 5K showed high correlations with single-cell RNA sequencing (scRNA-seq) data, while CosMx 6K detected a higher total number of transcripts than Xenium 5K but showed substantial deviation from matched scRNA-seq references [49].
Specificity assessments using metrics such as Negative Co-expression Purity (NCP) reveal important distinctions between platforms. NCP quantifies the percentage of non-co-expressed genes in reference single-cell datasets that do not appear to be co-expressed in each spatial transcriptomics dataset, with values closer to 1 indicating higher specificity [46]. In such analyses, Xenium demonstrates consistently higher specificity than CosMx, which presents the lowest values among commercial platforms [46]. MERFISH quantitatively reproduces bulk RNA-seq and scRNA-seq results with improvements in overall dropout rates and sensitivity compared to sequencing-based methods [51].
Technical Performance Metrics
Table 2: Performance Benchmarking Across iST Platforms Using Tumor Samples
| Performance Metric | CosMx | Xenium | MERFISH |
|---|---|---|---|
| Transcripts/Cell | Highest in TMAs (p < 2.2e−16) [34] | 186.6 reads/cell (average) [46] | Lower in older tissues, improves in newer samples [34] |
| Unique Genes/Cell | Highest among platforms (p < 2.2e−16) [34] | Varies by segmentation mode [34] | Dependent on tissue quality and age [34] |
| Sensitivity | High total transcripts but lower correlation with scRNA-seq [49] | Superior sensitivity for marker genes [49], 1.2-1.5× higher than scRNA-seq [46] | Improved dropout rates vs. sequencing methods [51] |
| Specificity (NCP) | Lowest among commercial platforms [46] | High (>0.8), slightly lower than other platforms [46] | High specificity in gene detection [51] |
| Tissue Age Compatibility | Detected target genes expressed same as negative controls in older tissues [34] | Consistent performance across tissue ages [34] | Performance decreases in older tissues [34] |
| Cell Segmentation Accuracy | Requires filtering (30 transcripts/cell) [34] | 76.8% reads assigned to cells [46], multimodal segmentation available [34] | Relies on cell boundary staining [51] |
Experimental Design Considerations for Tumor Studies
The selection of appropriate iST platforms for tumor microenvironment studies requires careful consideration of several experimental parameters. Tissue quality and age significantly impact data quality, particularly for MERFISH and CosMx platforms. In comparative studies using lung adenocarcinoma and pleural mesothelioma samples, CosMx displayed multiple target gene probes that expressed at the same level as negative control probes across all tissue microarrays (TMAs), with this effect more pronounced in older tissue samples (19.6% in MESO1 and 31.9% in MESO2) [34]. These affected genes included important cell type annotation markers such as CD3D, CD40LG, FOXP3, MS4A1, and MYH11 [34].
Panel design represents another critical consideration, as platforms offer different degrees of customizability. CosMx provides a standard 1,000-plex panel with optional add-on genes, Xenium offers either fully customizable panels or standard panels with optional add-ons, and MERFISH provides similar customizability options [44]. For tumor immunology applications, researchers must carefully select panels that encompass relevant immune, stromal, and malignant cell markers appropriate for their cancer type.
Cell segmentation approaches vary significantly between platforms and impact downstream analysis. Xenium utilizes both unimodal (Xenium-UM) and multimodal (Xenium-MM) segmentation, with unimodal assays demonstrating higher transcript and gene counts per cell than multimodal assays (p < 2.2e−16) [34]. CosMx requires filtering of cells with fewer than 30 transcript counts and those five times larger than the geometric mean of cell area sizes [34], while MERFISH relies on cell boundary staining in conjunction with nuclear markers for segmentation [51].
Tumor Architecture Applications and Biological Insights
Mapping Tumor Microenvironment Organization
Spatial transcriptomics platforms have enabled unprecedented insights into tumor organization architecture. In high-grade serous ovarian cancer (HGSC), comprehensive mapping of over 2.5 million cells from 130 tumors revealed a fundamental macro-organization principle where "malignant cells and fibroblasts form spatially distinct compartments (which we refer to as the malignant and stromal compartments), such that T/NK cells preferentially localized in the stromal rather than the malignant compartment (P < 1 × 10⁻⁴)" [45]. This organization pattern was consistently observed across patients and validated in multiple datasets, demonstrating how spatial biology influences immune cell infiltration patterns in tumor ecosystems.
In vulvar high-grade squamous intraepithelial lesions (vHSIL) studied in relation to immunotherapy response, CosMx analysis of 20 pre-treatment lesions identified 18 cell clusters and 99 distinct non-epithelial cell states from over 274,000 single cells mapped in situ [50]. This deep profiling revealed that complete responders to immunotherapy exhibited "a higher ratio of immune-supportive to immune-suppressive cells—a pattern mirrored in other solid tumors following neoadjuvant checkpoint blockade" [50]. Key immune populations enriched in complete responders included CD4+CD161+ effector T cells and chemotactic CD4+ and CD8+ T cells, while partial responders showed increased proportions of T helper 2 cells and CCL18-expressing macrophages [50].
Analytical Workflows for Tumor Architecture
Essential Research Reagents and Experimental Protocols
Research Reagent Solutions for iST Experiments
Table 3: Essential Research Reagents for Spatial Transcriptomics Workflows
| Reagent Category | Specific Examples | Function in Workflow |
|---|---|---|
| Gene Expression Panels | CosMx Human Universal Cell Characterization Panel (1,000-plex) [34], Xenium human lung panel (289-plex + custom genes) [34], MERFISH Immuno-Oncology Panel (500-plex) [34] | Targeted transcript detection with cell type resolution |
| Sample Preparation Kits | FFPE tissue preparation kits [34] [44], Fresh frozen tissue preservation solutions [48] [47] | Tissue preservation and processing for optimal RNA integrity |
| Cell Segmentation Reagents | DAPI nuclear stain [46], Cell boundary markers [51], Antibodies for multimodal segmentation [34] | Cellular compartment identification and boundary definition |
| Signal Amplification Systems | Branch chain amplification reagents (CosMx) [44], Rolling circle amplification kit (Xenium) [44] [46], Readout probe amplifiers (MERFISH) [47] | Signal enhancement for transcript detection |
| Validation Tools | Multiplex immunofluorescence panels [34], RNAscope assays [49], CODEX protein profiling [49] | Orthogonal validation of spatial findings |
Detailed Methodological Protocols
For researchers implementing iST technologies in tumor architecture studies, several key methodological considerations emerge from benchmarking studies:
Sample Preparation Protocol: For FFPE tissues, which represent the standard in clinical pathology, sectioning at 5μm thickness provides optimal results across platforms [34]. Tissue quality assessment should include H&E staining evaluation, and when possible, RNA integrity measurement (DV200 > 60% is recommended for MERFISH) [44]. For studies involving archival tissues, note that "the more recently constructed MESO TMAs had higher numbers of transcripts and uniquely expressed genes per cell with CosMx and MERFISH than Xenium" [34], indicating that tissue age impacts performance differently across platforms.
Quality Control and Data Processing: Implement platform-specific quality thresholds, such as filtering cells with fewer than 30 transcript counts for CosMx and fewer than 10 transcripts for MERFISH and Xenium [34]. Carefully evaluate negative control probes, as some platforms exhibit target gene probes expressing at similar levels to negative controls, particularly in older tissues [34]. For cell segmentation, consider using improved algorithms like CellPose, which has been shown to be one of the most reliable methods across platforms [50].
Multi-platform Integration: When integrating iST data with complementary modalities, leverage established workflows such as the "contamination ratio metric" for pre-emptively excluding genes likely to return spurious results due to imperfect cell segmentation [50]. For cell type annotation, semi-supervised methods like InSituType can effectively classify cells using immuno-oncology-based reference profiles while allowing for unsupervised clustering to characterize novel cell states [50].
The rapid evolution of high-throughput subcellular resolution spatial transcriptomics platforms has fundamentally transformed our ability to decipher tumor architecture. CosMx, Xenium, and MERFISH each offer distinct advantages—CosMx with its large standard panel size, Xenium with its high sensitivity and robust performance across tissue ages, and MERFISH with its single-molecule resolution and error-robust barcoding [34] [49] [46]. Systematic benchmarking reveals that platform selection must be guided by specific research questions, tissue characteristics, and analytical requirements rather than assuming universal superiority of any single technology [34] [49] [44].
For tumor biology applications, these technologies have enabled the discovery of fundamental organization principles of tumor microenvironments, including spatially distinct compartments that orchestrate immune cell infiltration [45] and cellular ecosystems that determine immunotherapy responses [50]. As the field advances, increasing gene panel sizes, improving segmentation algorithms, and enhancing multi-omic integration will further empower researchers to unravel the spatial complexities of cancer. The continued benchmarking and methodological refinement of these platforms will ensure that spatial transcriptomics realizes its potential to revolutionize both basic cancer biology and translational drug development.
Spatial transcriptomics (ST) has emerged as a transformative technology in cancer research, enabling the precise quantification and visualization of gene expression within the intact spatial context of tumor tissues. Unlike conventional bulk or single-cell RNA sequencing that lose spatial organization, ST technologies preserve the architectural relationships between cells, providing critical insights into the tumor microenvironment (TME), cellular heterogeneity, and molecular interactions that drive cancer progression [52]. The spatial context of cellular interactions is particularly crucial in oncology, where tumor heterogeneity and immune microenvironment composition serve as critical components of oncologic disease progression and treatment response [52].
The evolution of ST technologies from early in situ hybridization methods to current high-plex spatial barcoding and imaging platforms has fundamentally expanded our investigative capabilities in tumor biology. These advances allow researchers to move beyond mere cataloging of cellular components toward understanding functional organization within tumors—how cellular positioning influences signaling networks, metabolic cooperation, and therapeutic vulnerability [52] [53]. This technical guide examines the key applications of ST in mapping tumor architecture, profiling immune responses, and identifying novel therapeutic targets, providing both methodological frameworks and practical considerations for implementation in cancer research.
Creating Comprehensive Spatial Maps of Tumor Ecosystems
Technological Platforms for Spatial Mapping
Spatial mapping of tumors requires platforms that balance resolution, multiplexing capability, and tissue compatibility. The selection of an appropriate technology depends on specific research objectives, whether focused on transcriptome-wide discovery or targeted high-plex validation.
Table 1: Comparison of Spatial Transcriptomics Platforms for Tumor Mapping
| Platform | Methodology | Resolution | Maximum Targets | Sample Types | Best Applications in Cancer Research |
|---|---|---|---|---|---|
| 10x Genomics Visium | Spatial barcoding with sequencing | 55 μm (single-cell with HD) | All 3' mRNA | FFPE, Fresh frozen | Tumor heterogeneity, spatial domains [52] |
| NanoString CosMx | In situ hybridization | Subcellular | 18,000+ RNAs | FFPE, Fresh frozen | Single-cell spatial phenotyping, rare cell detection [3] [52] |
| 10x Genomics Xenium | Padlock probe with rolling circle amplification | Subcellular | 5,000 RNAs | FFPE, Fresh frozen | High-plex targeted imaging, tumor microenvironments [52] |
| GeoMx Digital Spatial Profiler | UV-cleavable oligo tags | Single-cell to multicellular regions | 18,000+ RNAs (Whole Transcriptome Atlas) | FFPE, Fresh frozen | Region-specific profiling, immune oncology [3] [52] |
| CellScape | Iterative staining/bleaching cycles | Single-cell | 30+ proteins | FFPE on coverslips | Spatial proteomics, immune cell tracking [3] |
| Akoya PhenoCycler | Cyclic immunofluorescence | Single-cell | ~100 proteins | FFPE, Fresh frozen | Multiplexed tissue imaging, immune contexture [52] |
Experimental Workflow for Spatial Tumor Mapping
The standard workflow for creating spatial maps of tumor architecture involves coordinated wet-lab and computational steps:
Tissue Preparation and Processing:
- Collect fresh frozen or FFPE tumor tissues sectioned at 4-10 μm thickness [52]
- For FFPE samples, perform deparaffinization, hematoxylin and eosin (H&E) staining, and imaging prior to ST processing
- Optimize permeabilization conditions to ensure optimal mRNA capture efficiency while preserving tissue morphology
Spatial Library Preparation and Sequencing:
- For sequencing-based platforms (Visium, Xenium): Implement spatial barcoding, cDNA synthesis, and library construction followed by next-generation sequencing [52]
- For imaging-based platforms (CosMx, MERFISH): Perform sequential hybridization and imaging cycles to decode spatial RNA positions [54] [52]
- Incorporate quality control measures including RNA quality assessment (RIN >7 for fresh frozen) and control gene validation
Data Processing and Integration:
- Align sequencing reads to reference genomes and assign spatial barcodes to generate gene-spot matrices
- Implement computational alignment tools (STalign, PASTE) for integrating multiple tissue sections and constructing 3D tumor architectures [55]
- Apply spatial clustering algorithms (BayesSpace, GraphST) to identify histopathological domains and spatial expression patterns [56] [55]
Figure 1: Experimental workflow for creating spatial maps of tumor architecture, integrating both sequencing-based and imaging-based spatial transcriptomics platforms.
Computational Analysis and 3D Reconstruction
Advanced computational methods are essential for transforming raw spatial data into biologically meaningful tumor maps:
Spatial Deconvolution: Apply algorithms (Cell2location, STRIDE, SPOTlight) to infer cell-type compositions within capture spots, leveraging single-cell RNA-seq references to resolve cellular heterogeneity beyond platform resolution limits [56]. These methods use probabilistic modeling, non-negative matrix factorization, or deep learning to estimate the proportion of different cell types in each spatial location.
Multi-Slice Alignment and 3D Reconstruction: Implement tools (PASTE, STalign, SPIRAL) to align consecutive tissue sections and reconstruct three-dimensional tumor architecture [55]. These methods employ optimal transport theory, image registration, or graph-based matching to create cohesive spatial models across multiple tissue layers, preserving spatial relationships across the z-axis.
Spatial Domain Identification: Utilize clustering algorithms (BayesSpace, GraphST) that incorporate spatial neighborhood information to identify histologically and molecularly distinct tumor regions, immune niches, and stromal compartments [56] [55]. These domains often correlate with functional specializations, such as proliferative centers, invasive margins, and immunosuppressive niches.
Immune Profiling within the Spatial Context
Mapping the Tumor Immune Microenvironment
Spatial transcriptomics enables comprehensive profiling of immune cell distribution, functional states, and interactions within the tumor ecosystem. This spatial context is critical for understanding immune evasion mechanisms and predicting immunotherapy responses.
Table 2: Spatial Immune Profiling Applications in Cancer Research
| Application | Methodology | Key Readouts | Clinical Relevance |
|---|---|---|---|
| Immune Cell Typing and Localization | Integration with scRNA-seq references + deconvolution algorithms | Immune cell densities, spatial distribution, neighborhood patterns | Identification of immune-excluded vs. immune-inflamed phenotypes [57] [53] |
| Tertiary Lymphoid Structure (TLS) Characterization | High-plex protein and RNA detection (CODEX, CellScape) | Immune cell organization, germinal center formation, lymphocyte maturation | Positive prognostic indicator across multiple cancer types [3] [53] |
| Immune Checkpoint Spatial Mapping | Multiplexed protein imaging (PhenoCycler, IMC) | PD-1/PD-L1, LAG-3, TIM-3 distribution relative to tumor cells | Predictors of response to checkpoint inhibitor therapy [57] [53] |
| Tumor-Immune Interface Analysis | Spatial boundary identification + differential expression | Cytolytic activity, immunosuppressive signals, metabolic competition | Mechanisms of immune resistance and sensitivity [3] [57] |
| CAR-T Cell Tracking | Multiomic spatial profiling (CellScape) | CAR-T persistence, activation state, tumor engagement | Optimization of cell therapy protocols [3] |
Experimental Design for Spatial Immune Profiling
Effective spatial immune profiling requires strategic panel design and multimodal integration:
Targeted Panel Design:
- Select marker genes that distinguish immune cell subtypes (T cells: CD3D, CD8A; B cells: CD79A, MS4A1; Macrophages: CD68, CD163)
- Include immune activation markers (IFNG, GZMB, PRF1), checkpoint molecules (PDCD1, CTLA4, LAG3), and functional state indicators
- For protein co-detection, incorporate validated antibodies with minimal cross-reactivity in multiplexed panels
Multimodal Integration:
- Combine spatial transcriptomics with multiplexed protein detection (CODEX, PhenoCycler) to correlate transcriptional states with protein expression and post-translational modifications [57] [52]
- Integrate with spatial metabolomics (MALDI-MSI) to map nutrient availability, metabolic waste products, and oncometabolites that influence immune function [58] [59]
- Register spatial data with H&E and IHC stains to connect molecular profiles with standard pathological assessment
Spatial Analysis Framework:
- Apply neighborhood analysis to identify recurrent cellular communities and interaction patterns
- Calculate cell-cell proximity metrics to quantify immune-tumor interactions and spatial exclusion
- Perform gradient analysis to identify spatial patterns of immune activation and suppression
Figure 2: Integrated workflow for spatial immune profiling in the tumor microenvironment, combining transcriptomic, proteomic, and metabolomic data.
Analytical Approaches for Spatial Immunology
Computational methods for spatial immune profiling have evolved to capture the complexity of tumor-immune interactions:
Cell-Cell Communication Inference: Tools like CellChat and NicheNet adapted for spatial data predict ligand-receptor interactions between neighboring cells, revealing autocrine and paracrine signaling networks that shape the immune microenvironment [57].
Spatial Trajectory Analysis: Methods such as SpatiAlign and STAligner reconstruct the migration and differentiation paths of immune cells across tissue space, tracking T cell exhaustion gradients or macrophage polarization states from blood vessels into tumor cores [55].
Multiscale Integration: Frameworks like MISO employ deep learning to predict spatial gene expression patterns from standard H&E histology, potentially enabling retrospective analysis of clinical archives and connecting spatial immune features with morphological patterns recognized by pathologists [5].
Identifying Novel Therapeutic Targets
Spatial Discovery of Vulnerabilities
Spatial transcriptomics reveals therapeutic targets through identification of spatially restricted disease mechanisms, compartment-specific dependencies, and resistance pathways that are invisible to bulk analyses.
Target Identification Strategies:
Region-Specific Differential Expression: Compare gene expression between spatial domains (e.g., invasive margin vs. tumor core, treatment-resistant niches vs. sensitive regions) to identify territory-specific vulnerabilities [3] [53]
Cell Neighborhood Analysis: Identify expression programs associated with specific cellular microenvironments, such as immune-suppressive niches or stromal interaction zones that promote tumor survival [3] [53]
Spatial Synthetic Lethality: Discover gene pairs where spatial co-localization creates unique dependencies, particularly targeting interactions between tumor and stromal compartments [53]
Resistance Niche Mapping: Analyze pre- and post-treatment samples to identify spatial patterns associated with therapeutic resistance, including protected niches that serve as reservoirs for persistent cells [53] [59]
Experimental Protocols for Target Validation
Longitudinal Spatial Monitoring:
- Collect paired tumor biopsies before and during treatment from clinical trials
- Apply spatial barcoding platforms to track spatial evolution under therapeutic pressure
- Identify early spatial biomarkers of response and resistance
Functional Validation Workflow:
- Prioritize candidate targets based on spatial specificity, druggability, and clinical association
- Implement CRISPR-based perturbation (CRISPRi, CRISPRa) in 3D tumor models followed by spatial readouts (CosMx CRISPR workflow) to validate target necessity [3]
- Develop targeted therapeutic agents and assess spatial distribution using mass spectrometry imaging
- Evaluate efficacy in patient-derived organoids and xenografts with spatial endpoint analysis
Integration with Drug Development Pipelines:
- Utilize spatial biomarker signatures for patient stratification in clinical trials
- Employ spatial pharmacodynamics to assess target engagement and mechanism of action in tissue context
- Apply spatial data to optimize drug combinations that address heterogeneous tumor ecosystems
Table 3: Spatial Transcriptomics in Therapeutic Development
| Development Stage | Spatial Application | Technology Platform | Output |
|---|---|---|---|
| Target Discovery | Regional vulnerability identification | CosMx WTX, GeoMx DPA | Spatially restricted targets, microenvironmental dependencies [3] |
| Lead Optimization | Tissue distribution and penetration assessment | MALDI-MSI, DESI-MSI | Drug and metabolite spatial localization [59] |
| Preclinical Efficacy | Tumor-immune modulation tracking | CellScape, PhenoCycler | Spatial mechanisms of action, immune activation [3] |
| Biomarker Development | Response signature discovery | Visium, Xenium | Predictive spatial signatures, patient stratification [52] [53] |
| Clinical Trial Analysis | Resistance mechanism elucidation | Multi-platform integration | Spatial evolution under treatment, resistance niches [53] |
Integrated Research Workflows and Reagent Solutions
Comprehensive Spatial Multi-omics Workflow
Advanced spatial biology now integrates multiple molecular modalities to create comprehensive maps of tumor biology:
Figure 3: Integrated spatial multi-omics workflow for comprehensive tumor profiling, simultaneously capturing multiple molecular layers from a single tissue section.
Essential Research Reagent Solutions
Table 4: Key Research Reagents and Platforms for Spatial Cancer Research
| Reagent/Platform | Type | Function in Spatial Analysis | Example Applications |
|---|---|---|---|
| CosMx Human Whole Transcriptome (WTX) Assay | Panel-based assay | Subcellular spatial transcriptomics with 18,000+ RNA targets | Tumor heterogeneity, rare cell detection, CRISPR validation [3] |
| GeoMx Discovery Proteome Atlas | Protein assay | 1,100+ plex spatial proteomics paired with whole transcriptome | Immune profiling, signaling pathway activation, cell typing [3] |
| CellScape Precise Spatial Proteomics | Platform | High-plex iterative staining for protein and RNA detection | CAR-T tracking, tumor-immune interactions, checkpoint mapping [3] |
| nCounter ADC Development Panel | Targeted panel | High-throughput characterization of antibody-drug conjugates | ADC mechanism of action, resistance studies [3] |
| PaintScape Platform | Genomic architecture tool | In situ visualization of 3D genome organization | Chromatin folding, ecDNA detection, structural variation [3] |
| CellSP Computational Framework | Software tool | Identification of gene-cell modules with coordinated subcellular patterns | RNA localization patterns, functional module discovery [54] |
Spatial transcriptomics and related spatial technologies have fundamentally transformed our approach to cancer research by preserving the architectural context of molecular measurements. The applications in spatial mapping, immune profiling, and target identification provide unprecedented insights into tumor organization and therapeutic opportunities. As these technologies continue to evolve toward higher resolution, greater multiplexing capacity, and improved integration across molecular modalities, they promise to accelerate the development of precisely targeted therapies that account for the spatial complexity of human tumors. The implementation of robust experimental and computational frameworks outlined in this guide will enable researchers to fully leverage spatial approaches in advancing cancer understanding and treatment.
Integrating ST with Single-Cell RNA-seq for Enhanced Cellular Deconvolution
The tumor microenvironment (TME) is a complex ecosystem comprising malignant cells and diverse non-malignant components, including immune cells, cancer-associated fibroblasts, vascular endothelial cells, and tissue-resident stromal cells, all embedded within the extracellular matrix [33]. Traditional bulk RNA sequencing obscures cellular heterogeneity by averaging gene expression across mixed cell populations, while single-cell RNA sequencing (scRNA-seq), though providing high-resolution transcriptomic profiles, requires tissue dissociation that eliminates critical spatial context [33] [27]. Spatial transcriptomics (ST) has emerged as a revolutionary complementary technology that maps gene expression within intact tissue sections, preserving the native spatial architecture and enabling researchers to investigate cellular organization and communication within the TME [33] [27].
The integration of scRNA-seq and ST technologies provides a powerful synergistic approach for deciphering the complexity and spatial organization of the TME with unprecedented resolution [33]. This technical guide explores the computational frameworks, experimental protocols, and analytical tools that enable effective data integration, focusing specifically on their application to cellular deconvolution – the process of inferring cellular composition and organization from spatially barcoded gene expression data. By bridging single-cell resolution with spatial localization, researchers can now uncover cellular heterogeneity, stromal-immune interactions, and spatial niches that drive tumor progression and therapy resistance, ultimately advancing precision oncology through spatially-informed biomarkers and diagnostic tools [33].
Core Computational Strategies for Data Integration
Deconvolution and Mapping Approaches
Table 1: Computational Methods for scRNA-seq and ST Data Integration
| Method | Underlying Algorithm | Primary Function | Key Advantages | References |
|---|---|---|---|---|
| TACIT | Unsupervised thresholding with graph-based clustering | Cell type annotation in spatial multiomics | No training data required; handles sparse marker panels; identifies rare cell types | [60] |
| iSORT | Transfer learning via neural networks | Maps gene expression to spatial locations; identifies spatial-organizing genes | Infers pseudo-growth trajectories using SpaRNA velocity concept | [61] |
| SPOTlight | Non-negative matrix factorization | Spot deconvolution | Efficient for decomposing mixed spot expressions into constituent cell types | [61] |
| Cell2location | Hierarchical Bayesian framework | Spot deconvolution | Accounts for tissue heterogeneity and technical variations | [61] |
| Tangram | Deep neural networks | Maps single-cell data to spatial coordinates on discrete spots | High accuracy in spatial alignment of cell types | [61] |
| novoSpaRc | Optimal transport method | Predicts spatial probability distribution for individual cells | Reconstructs spatial organization without prior spatial information | [61] |
Deconvolution approaches primarily aim to resolve the cellular composition of ST spots, each of which typically captures transcriptomes from multiple cells. Sequencing-based ST platforms such as 10X Visium provide whole transcriptome coverage but at a resolution that encompasses multiple cells per spot, necessitating computational methods to infer the specific cell types contributing to each spot's expression profile [61] [27]. The integration of scRNA-seq data as a reference enables this deconvolution by providing cell type-specific gene expression signatures.
Mapping approaches focus on projecting single-cell transcriptomes onto spatial coordinates to reconstruct tissue architecture at cellular resolution. These methods use various computational frameworks to position individual cells within the spatial context of tissues, effectively "imputing" spatial information for scRNA-seq data [61].
Advanced Integration Frameworks
Recent advancements in integration methodologies have addressed specific challenges in spatial transcriptomics. The TACIT (Threshold-based Assignment of Cell Types from Multiplexed Imaging Data) algorithm employs an unsupervised approach for cell annotation using predefined signatures without requiring training data [60]. TACIT uses unbiased thresholding to distinguish positive cells from background, focusing on relevant markers to identify ambiguous cells in multiomic assays. Validation across five datasets encompassing 5,000,000 cells and 51 cell types from three biological niches (brain, intestine, gland) demonstrated that TACIT outperforms existing unsupervised methods in both accuracy and scalability [60].
The iSORT (integrative Spatial Organization of cells using density Ratio Transfer) framework utilizes transfer learning to decipher spatial organization of cells by integrating scRNA-seq and ST data [61]. iSORT trains a neural network that maps gene expressions to spatial locations, enabling the identification of spatial-organizing genes (SOGs) that drive tissue patterning, and infers pseudo-growth trajectories using a novel concept called SpaRNA velocity, which projects RNA velocity onto the physical space of ST slices [61].
For large-sized tissues that exceed the capture area of conventional ST platforms, iSCALE (inferring Spatially resolved Cellular Architectures in Large-sized tissue Environments) provides a machine learning framework that reconstructs large-scale, super-resolution gene expression landscapes by leveraging the relationship between gene expression profiles and histological image characteristics [62]. This approach enables comprehensive gene expression prediction and tissue annotation across entire large tissue sections, including regions without direct gene expression measurements, making it particularly valuable for studying sizable human tissue samples common in clinical research [62].
Experimental Protocols for Integrated Analysis
Workflow for Combined scRNA-seq and ST Profiling
Diagram: Integrated scRNA-seq and ST Analysis Workflow
A robust experimental workflow for integrating scRNA-seq and ST data begins with careful sample preparation. For colorectal cancer studies, researchers have successfully profiled 41,700 cells from three CRC tumor-normal-blood pairs using this integrated approach [63]. The protocol involves:
Sample Collection and Processing: Collect matched tumor tissues, adjacent normal tissues, and peripheral blood mononuclear cells (PBMCs) from patients. For solid tumors, process tissues immediately for either single-cell dissociation or optimal cutting temperature (OCT) compound embedding for cryosectioning [63].
Single-Cell RNA Sequencing: Generate single-cell suspensions using appropriate enzymatic digestion protocols. Perform scRNA-seq library preparation using platforms such as 10X Genomics. Sequence to a depth of approximately 150 G reads per sample, achieving median sequencing saturation of 90% or higher [63].
Spatial Transcriptomics Profiling: Prepare tissue sections of appropriate thickness (typically 10-16 μm) for ST platforms. For sequencing-based approaches like 10X Visium, follow standard protocols for tissue permeabilization and library preparation. For imaging-based platforms like CosMx or MERFISH, optimize hybridization and imaging conditions [3].
Quality Control Metrics: Apply stringent quality control filters for both scRNA-seq and ST data. For scRNA-seq, retain cells with at least 1,000 genes and 2,500 unique molecular identifiers (UMIs). Remove cells with high mitochondrial gene percentage indicative of stress or apoptosis [63].
Cell Type Annotation and Malignant Cell Identification
Diagram: Cell Type Deconvolution and Annotation Pipeline
Cell type annotation in spatial transcriptomics data leverages scRNA-seq reference data to identify both major cell populations and rare cell subtypes. A typical workflow includes:
Reference-Based Annotation: Transfer cell type labels from scRNA-seq to ST data using canonical marker genes. For colorectal cancer, major populations include epithelial cells, fibroblasts, endothelial cells, monocytes, T cells, NK cells, B cells, and mast cells, identified through expression of established markers such as EPCAM (epithelial cells), PTPRC (T cells), CD19 (B cells), and LUM (fibroblasts) [63].
Malignant Cell Identification: Distinguish malignant epithelial cells from normal epithelial cells through copy number variation (CNV) analysis. Calculate large-scale gene expression patterns across genomic regions to infer CNV alterations characteristic of cancer cells [63].
Subpopulation Analysis: Further subcluster epithelial cells to identify malignant subpopulations. In CRC, researchers have identified seven subtypes of malignant cells reflecting heterogeneous states in tumors, including tumorCAV1, tumorATF3JUN|FOS, tumorZEB2, tumorVIM, tumorWSB1, tumorLXN, and tumorPGM1, each with distinct transcriptional programs [63].
Spatial Regional Annotation: Transfer cellular annotations from scRNA-seq to ST spots to define tissue regions such as tumor core, stroma, immune infiltration zones, and normal epithelium. Validate regional annotations through histopathological examination and marker gene expression patterns [63].
Analytical Tools and Research Reagent Solutions
Computational Tools for Spatial Deconvolution
Table 2: Key Computational Tools for Spatial Deconvolution and Analysis
| Tool | Primary Function | Input Data | Output | Access |
|---|---|---|---|---|
| TACIT | Cell type annotation from multiplexed imaging data | Spatial transcriptomics/proteomics data, cell type signatures | Annotated cell types with confidence scores | Available upon request [60] |
| iSORT | Transfer learning for spatial organization prediction | scRNA-seq data, ST reference | Spatial-organizing genes, SpaRNA velocity | GitHub: xiaojierzi/iSORT [61] |
| ReDeconv | Bulk RNA-seq deconvolution accounting for transcriptome size | Bulk RNA-seq data, reference signatures | Cell type proportions with size correction | https://redeconv.stjude.org [64] |
| iSCALE | Large-scale spatial gene expression prediction | H&E images, ST training captures | Predicted gene expression for large tissues | Available upon request [62] |
| Cell2location | Bayesian deconvolution of spatial transcriptomics | scRNA-seq reference, ST data | Cell type abundance maps | Standard Python package [61] |
| Tangram | Deep learning-based spatial mapping | scRNA-seq data, ST data | Aligned single-cell spatial coordinates | Standard Python package [61] |
Research Reagent Solutions
Table 3: Essential Research Reagents and Platforms for Spatial Transcriptomics
| Platform/Reagent | Type | Key Features | Applications in Tumor Research | References |
|---|---|---|---|---|
| 10X Visium | Sequencing-based ST | Whole transcriptome, 6.5×6.5mm capture area | Spatial mapping of tumor heterogeneity and TME | [62] [27] |
| CosMx Human WTX | Imaging-based ST | Subcellular resolution, 1,000+ RNA targets | Single-cell spatial analysis in FFPE tumors | [3] |
| CellScape Platform | Spatial proteomics | High-plex protein detection (65+ markers) | Immune cell phenotyping in tumor microenvironments | [3] |
| GeoMx DPA | Spatial multiomics | 1,100+ plex protein assay with WTA | Comprehensive tumor microenvironment characterization | [3] |
| MERFISH | Imaging-based ST | Single-molecule resolution, high-plex RNA detection | Cellular neighborhoods and rare cell populations in tumors | [33] [61] |
| Akoya Phenocycler-Fusion | Spatial proteomics | 50+ protein markers, single-cell resolution | Immune contexture analysis in colorectal cancer | [60] |
Applications in Tumor Biology and Clinical Translation
Insights into Tumor Architecture and Metastasis
Integrated scRNA-seq and ST analyses have revealed fundamental principles of tumor organization and progression. Studies comparing primary hepatocellular carcinoma (HCC) and liver metastases have uncovered distinct spatial architectures: HCC displays an ordered lineage architecture with transformed hepatocyte-like tumor cells broadly dispersed across the tissue, while liver metastases show sharply compartmentalized domains including an invasion zone where proliferative stem-like tumor cells occupy TAM-rich boundaries adjacent to hypoxia-adapted tumor-core cells [65].
Notably, despite these organizational differences, both tumor types converge on shared metabolic programs, such as "porphyrin overdrive" characterized by reduced cytochrome P450 expression, enhanced oxidative phosphorylation gene expression, and upregulation of FLVCR1 and ALOX5, reflecting coordinated rewiring of heme and lipid metabolism that may represent a therapeutic vulnerability [65].
Revealing Cell-Cell Communication Networks
The integration of scRNA-seq and ST enables the inference of spatially organized cell-cell communication networks within the TME. In colorectal cancer, analyses have revealed intensive intercellular interactions between stroma and tumor regions that are extremely proximal in tissue sections. Specifically, the ligand-receptor pair C5AR1-RPS19 has been identified as playing key roles in the crosstalk between stroma and tumor regions [63].
Spatial characterization of tumor regions has identified TMSB4X as a highly expressed feature in CRC tumor regions, suggesting its potential as a diagnostic marker, while stroma regions are characterized by VIM-high expression, indicating a stromal niche fostering tumor progression [63]. These spatially resolved interactions provide potential targets for disrupting pro-tumorigenic signaling within the TME.
Biomarker Discovery and Therapeutic Implications
The integration of scRNA-seq and ST technologies is advancing precision oncology by enabling the discovery of spatially informed biomarkers. For instance, spatial analysis of lung cancer tissues has identified distinct gene expression signatures at the invasive front that correlate with metastatic potential and patient prognosis [27]. Similarly, studies in triple-negative breast cancer have revealed spatial patterns of immune cell exclusion that may predict response to immunotherapy [3].
Three-dimensional spatial profiling and multimodal integration with proteomic and epigenomic data are further enhancing our understanding of tumor biology, revealing complex relationships between genetic alterations, gene expression patterns, protein activity, and metabolic pathways within the spatial context of tumors [27]. These advances are paving the way for more precise diagnostic approaches and therapeutic strategies that target specific spatial compartments or cellular interactions within the TME.
The integration of single-cell RNA sequencing with spatial transcriptomics represents a transformative approach for deconvoluting cellular complexity within tissue architecture. Through sophisticated computational methods such as TACIT, iSORT, and deconvolution algorithms, researchers can now reconstruct cellular landscapes with unprecedented resolution, revealing spatial niches, cellular communication networks, and tissue organizational principles that drive tumor progression and therapeutic response.
As these technologies continue to evolve, with improvements in resolution, throughput, and multimodal integration, they hold immense promise for advancing precision oncology. The identification of spatially informed biomarkers and therapeutic targets will enable more effective diagnostic and treatment strategies tailored to the unique spatial architecture of individual tumors. Future developments in artificial intelligence, deep learning, and three-dimensional spatial profiling will further enhance our ability to decipher the complex spatial biology of cancer and other diseases.
Navigating Technical Challenges: A Framework for Benchmarking and Optimizing ST Data
In the field of cancer research, spatial transcriptomics (ST) has emerged as a pivotal technology for elucidating the intricate spatial organization of tumors. It bridges a critical gap left by single-cell RNA sequencing (scRNA-seq) by linking molecular profiles to their spatial context within the tissue architecture [66] [1]. The ability to study the tumor microenvironment (TME), cellular heterogeneity, and cell-cell interactions in situ has profound implications for understanding tumor initiation, progression, and therapeutic response [22]. However, the rapid evolution of commercial ST platforms necessitates a rigorous and standardized approach to evaluate their performance. For researchers investigating tumor organization, three metrics are paramount: sensitivity (the ability to detect true transcript signals), specificity (the ability to avoid false-positive signals), and spatial resolution (the minimal distance at which two distinct transcript signals can be discerned). This guide provides a technical framework for the critical assessment of these metrics, underpinned by recent benchmarking studies using human tumor samples.
Core Performance Metrics and Platform Comparison
The performance of an ST platform is not a singular characteristic but a combination of interdependent metrics that directly impact data quality and biological interpretation. Systematic benchmarking studies, which utilize serial sections from the same tumor samples and orthogonal validation datasets, provide the most objective performance assessments [66] [34].
Defining the Metrics
- Sensitivity refers to the platform's transcript capture efficiency. It is commonly measured by the number of unique molecules or transcripts detected per cell. High sensitivity is crucial for identifying rare but biologically significant transcripts and for robust cell type annotation, especially in heterogeneous tumor tissues.
- Specificity indicates the signal-to-noise ratio. It is evaluated using negative control probes and blank code words included in the assay panels. A high-specificity platform minimizes off-target hybridization, ensuring that the detected spatial patterns are biologically real and not technical artifacts [34].
- Spatial Resolution defines the smallest discernible detail in a spatial measurement. For ST, this ranges from the subcellular level (∼0.5 µm) to the multi-cellular level (∼55 µm). Higher resolution is essential for accurate cell segmentation, precise localization of transcripts within cellular compartments, and studying subcellular phenomena in tumor biology [66] [54].
Comparative Performance of Major Platforms
Recent independent benchmarking efforts have profiled the leading high-throughput, subcellular-resolution ST platforms using formalin-fixed paraffin-embedded (FFPE) human tumor samples [66] [34]. The table below synthesizes key quantitative findings from these studies.
Table 1: Performance Comparison of High-Throughput Spatial Transcriptomics Platforms
| Platform | Technology Type | Reported Sensitivity (Transcripts/Cell) | Specificity Assessment | Spatial Resolution | Key Strengths in Tumor Analysis |
|---|---|---|---|---|---|
| Xenium (10x Genomics) | Imaging-based (iST) | Consistently high; superior sensitivity for marker genes like EPCAM [66]. | High; minimal target gene probes expressed similarly to negative controls [34]. | Single-molecule precision [66]. | Excellent concordance with scRNA-seq and protein data (CODEX) [66]. |
| CosMx (NanoString) | Imaging-based (iST) | Highest raw transcript counts per cell [34]. | Some target gene probes (e.g., CD3D, FOXP3) expressed at levels similar to negative controls, potentially impacting immune cell annotation [34]. | Single-molecule precision [66]. | High-plex gene panels; capable of detecting extensive transcriptomes [34]. |
| Visium HD (10x Genomics) | Sequencing-based (sST) | High correlation with scRNA-seq gene counts; outperformed Stereo-seq in cancer cell marker detection in ROIs [66]. | N/A (Relies on poly(dT) capture; specificity managed bioinformatically). | 2 µm resolution [66]. | Unbiased whole-transcriptome analysis [66]. |
| Stereo-seq (BGI) | Sequencing-based (sST) | High correlation with scRNA-seq gene counts [66]. | N/A (Relies on poly(dT) capture; specificity managed bioinformatically). | 0.5 µm resolution [66]. | Extremely high spatial resolution for an sST platform [66]. |
| MERFISH (Vizgen) | Imaging-based (iST) | Lower transcript counts per cell in older archival samples; performance is tissue-age dependent [34]. | Lacks negative control probes for direct assessment [34]. | Single-molecule precision [22]. | High detection efficiency for targeted panels [22]. |
Experimental Protocols for Benchmarking Metrics
Robust benchmarking requires carefully controlled experiments that use serial sections from the same tumor block to eliminate biological variability and incorporate multi-omics ground truth data for validation [66] [34].
Establishing Ground Truth with Multi-Omics Profiling
To objectively evaluate ST platform performance, a foundational step is the creation of orthogonal validation datasets from the same sample.
- Sample Preparation: Collect treatment-naïve tumor samples (e.g., colon adenocarcinoma, hepatocellular carcinoma, lung adenocarcinoma) and process them into FFPE blocks. Generate serial tissue sections of 5 µm thickness for parallel profiling on different ST platforms and validation assays [66] [34].
- Orthogonal Validation Data:
- Single-cell RNA Sequencing (scRNA-seq): Perform on dissociated cells from the same tumor sample. This data serves as a spatial-agnostic reference for evaluating the sensitivity and gene detection accuracy of ST platforms [66] [34].
- Multiplexed Protein Imaging (CODEX/Immunofluorescence): Profile proteins on tissue sections adjacent to those used for ST using technologies like CODEX (co-detection by indexing) or multiplex immunofluorescence (mIF). This provides an independent spatial context to validate transcriptomic findings, especially for key tumor and immune markers [66] [34].
- Histopathological Annotation: Have trained pathologists review H&E-stained sections and mIF data to manually annotate cell types and tissue regions. This serves as the morphological ground truth for assessing cell segmentation and phenotyping accuracy [34].
Methodologies for Metric-Specific Evaluation
The following experimental and analytical procedures are used to quantify each core metric.
Evaluating Sensitivity:
- Data Processing: For each platform, generate cell-by-gene count matrices following the manufacturer's recommended bioinformatics pipeline.
- Calculation: Calculate the mean and median number of transcripts per cell and the number of unique genes detected per cell across the entire dataset and within specific, pathologist-annotated cell populations.
- Comparison: Correlate gene-wise transcript counts from the ST data with the matched scRNA-seq reference profile. A higher correlation coefficient indicates better sensitivity and accuracy in capturing the true transcriptional landscape [66].
Evaluating Specificity:
- Control Probe Analysis: For platforms that include them (e.g., CosMx, Xenium), extract the expression counts of negative control probes and blank code words. These probes are designed to not bind any biological target.
- Threshold Determination: Establish an expression threshold for true signal detection based on the distribution of counts from these negative controls (e.g., mean + 2 standard deviations).
- Signal-to-Noise Assessment: Identify and report any target gene probes whose expression falls below this established threshold, as these may not be reliably detectable above background noise [34].
Evaluating Spatial Resolution and Cell Segmentation:
- Manual Annotation: Manually segment nuclei from high-resolution DAPI or H&E images to create a "gold standard" set of cell boundaries.
- Algorithmic Segmentation: Apply each platform's native cell segmentation algorithm (e.g., unimodal based on DAPI, or multimodal incorporating protein markers) to the same tissue region.
- Performance Quantification: Calculate metrics like the F1-score for cell detection by comparing algorithmic segmentation to manual annotation. Further, assess segmentation accuracy by evaluating the co-detection of genes known to be mutually exclusive in different cell types, which can indicate erroneous segmentation or transcript diffusion [34].
Diagram 1: Experimental benchmarking workflow for ST platforms.
The Scientist's Toolkit: Essential Reagents and Materials
The following reagents and tools are critical for executing the benchmarking protocols described above and for conducting rigorous spatial transcriptomics studies of tumor tissues.
Table 2: Essential Research Reagent Solutions for Spatial Transcriptomics
| Item | Function / Explanation |
|---|---|
| Formalin-Fixed Paraffin-Embedded (FFPE) Tissue Blocks | The standard for sample processing and archiving in pathology. Essential for benchmarking with clinically relevant samples and ensures compatibility with most commercial ST platforms [34]. |
| Visium CytAssist Tissue Slide Alignment Quick Reference Card | A guide tool for 10x Genomics Visium workflows to demarcate the viable region on a microscope slide for probe transfer, ensuring the sample is positioned correctly for analysis [67]. |
| Custom-Targeted Gene Panels | Pre-designed probe sets for imaging-based platforms (e.g., CosMx, Xenium, MERFISH). Panels are often tailored to immuno-oncology, containing genes relevant to tumor, stromal, and immune cell populations [34]. |
| Negative Control & Blank Probes | Probes included in commercial panels that do not target any biological sequence. They are fundamental for quantifying background noise and establishing thresholds for assessing assay specificity [34]. |
| CODEX Antibody Panels | Multiplexed antibody panels for protein co-detection. Used on adjacent serial sections to validate protein-level expression of targets identified by ST, providing a multi-omic ground truth [66]. |
| Collagen-Coated Microscope Slides | Used in specialized protocols for profiling 2D cell cultures or engineered tissues. The coating facilitates cell adhesion when traditional tissue sectioning is not feasible [67]. |
Advanced Analysis: From Single Cells to Subcellular Modules
Beyond core metrics, advanced computational tools are now enabling the discovery of biologically meaningful patterns in the rich data generated by high-resolution ST.
Functional Interpretation with CellSP
For subcellular resolution data, tools like CellSP (Cell Subcellular Patterns) can identify "gene-cell modules"—sets of genes that exhibit coordinated spatial distribution patterns (e.g., peripheral, radial, punctate) within a common set of cells [54]. This analysis moves beyond single-gene localization to uncover systems-level organization. For example, in mouse brain and human kidney cancer data, CellSP has been used to discover modules related to myelination, axonogenesis, and immune responses that change between healthy and diseased states [54]. The process involves:
- Pattern Discovery: Using tools like SPRAWL and InSTAnT to identify significant subcellular distribution patterns for individual genes or gene pairs in each cell.
- Module Discovery: Applying a biclustering algorithm to find genes that co-exhibit the same spatial pattern in a significant subset of cells.
- Module Characterization: Interpreting modules via Gene Ontology enrichment and training machine learning classifiers to identify genes and pathways predictive of module membership [54].
Diagram 2: CellSP workflow for subcellular module discovery.
The systematic evaluation of sensitivity, specificity, and spatial resolution is a critical prerequisite for generating biologically and clinically impactful spatial transcriptomics data in cancer research. As benchmarking studies demonstrate, platform performance varies significantly, influencing the detection of key immune markers, the accuracy of cell typing, and the ability to resolve subtle spatial features of the tumor microenvironment. There is no single "best" platform; the choice depends on the specific research question, requiring a balance between whole-transcriptome discovery and targeted, high-sensitivity hypothesis testing. By adopting the standardized evaluation frameworks and protocols outlined in this guide, researchers can make informed decisions, ensure the rigor of their data, and fully leverage spatial transcriptomics to unravel the complex architecture of human tumors.
Systematic Benchmarking of ST Platforms Using Clinical Cancer Samples
Spatial transcriptomics (ST) has emerged as a revolutionary technology that bridges the critical gap between single-cell molecular profiling and tissue architecture context. In cancer research, where cellular spatial relationships and tumor microenvironment interactions dictate disease progression and therapeutic response, ST provides unprecedented insights into tumor organization. However, the rapid proliferation of commercial ST platforms with distinct technological approaches, resolutions, and sensitivities has created an urgent need for systematic benchmarking, particularly using clinically relevant formalin-fixed, paraffin-embedded (FFPE) samples. This technical review synthesizes comprehensive benchmarking data from recent studies to guide researchers in selecting appropriate platforms, designing robust experiments, and accurately interpreting spatial data within tumor architecture research.
Spatial transcriptomics technologies can be broadly categorized into sequencing-based (sST) and imaging-based (iST) platforms, each with distinct methodological foundations and performance characteristics. sST platforms utilize spatially barcoded poly(dT) oligos on arrays to capture poly(A)-tailed RNA for subsequent sequencing, enabling unbiased whole-transcriptome analysis. In contrast, iST platforms employ multiple rounds of fluorescently labeled probe hybridization, imaging, and destaining to localize transcripts through combinatorial barcoding at single-molecule resolution [49].
Recent technological advancements have produced platforms with substantially enhanced spatial resolution and gene detection capacity. Key commercial platforms now offer subcellular resolution (≤2 μm) and high-throughput gene detection (>5,000 genes), including Stereo-seq v1.3, Visium HD FFPE, CosMx 6K, and Xenium 5K [49]. These platforms represent the current state-of-the-art for clinical cancer samples, particularly FFPE tissues, which constitute over 90% of clinical pathology specimens [68].
Table 1: Technical Specifications of Major Spatial Transcriptomics Platforms
| Platform | Technology Type | Spatial Resolution | Gene Detection Capacity | FFPE Compatibility | Key Strengths |
|---|---|---|---|---|---|
| Stereo-seq v1.3 | Sequencing-based | 0.5 μm | Whole transcriptome | Yes (Fresh Frozen) | Highest resolution, unbiased detection |
| Visium HD FFPE | Sequencing-based | 2 μm | 18,085 genes | Yes | Whole transcriptome, standardized workflow |
| Xenium 5K | Imaging-based | Single molecule | 5,001 genes | Yes | High sensitivity, optimized panels |
| CosMx 6K | Imaging-based | Single molecule | 6,175 genes | Yes | Large gene panels, subcellular localization |
| MERSCOPE | Imaging-based | Single molecule | 500-1,000 genes | Yes | High specificity, custom panels |
Experimental Design for Systematic Benchmarking
Sample Selection and Preparation
Robust benchmarking requires carefully controlled experimental designs using matched clinical samples processed under uniform conditions. Recent comprehensive studies have utilized:
- Multiple cancer types: Colon adenocarcinoma (COAD), hepatocellular carcinoma (HCC), ovarian cancer (OV), and breast cancer specimens from treatment-naïve patients to represent diverse tumor biology [49].
- Tissue Microarrays (TMAs): Containing 17 tumor and 16 normal tissue types from clinical FFPE archives, enabling high-throughput platform assessment across diverse tissue contexts [68].
- Serial sectioning: Generation of consecutive tissue sections (4-5 μm thickness) from the same FFPE blocks for parallel processing across different platforms, ensuring maximal comparability.
- Multi-omics ground truth: Integration of CODEX spatial proteomics on adjacent sections and single-cell RNA sequencing (scRNA-seq) from the same samples to establish comprehensive reference datasets [49].
Platform Evaluation Framework
Systematic benchmarking should assess multiple performance dimensions critical for cancer research applications:
- Sensitivity and Specificity: Transcript detection efficiency and false positive rates using known marker genes and orthogonal validation.
- Spatial Resolution and Diffusion Control: Ability to resolve single cells and subcellular features while minimizing transcript diffusion.
- Cell Segmentation Accuracy: Performance in delineating cell boundaries using DAPI, membrane stains, or computational methods.
- Concordance with Reference Data: Correlation with matched scRNA-seq and spatial proteomics data.
- Cell Type Annotation and Spatial Clustering: Capacity to identify biologically relevant cellular neighborhoods and tissue domains.
Performance Benchmarking Results
Molecular Capture Efficiency
Marker Gene Detection: Evaluation of established cell marker genes reveals platform-specific sensitivity patterns. The epithelial cell marker EPCAM shows well-defined spatial patterns across all platforms, consistent with H&E staining and Pan-Cytokeratin immunostaining on adjacent sections [49]. Quantitative assessments within shared tissue regions demonstrate that Xenium 5K consistently achieves superior sensitivity for multiple marker genes compared to other platforms [49].
Gene Panel-Wide Performance: When assessing entire gene panels, Stereo-seq v1.3, Visium HD FFPE, and Xenium 5K show high correlations with matched scRNA-seq references (Figure 1D) [49]. CosMx 6K detects a higher total number of transcripts than Xenium 5K but shows substantial deviation from scRNA-seq reference data, indicating potential technical biases in transcript recovery [49].
Table 2: Quantitative Performance Metrics Across Platforms
| Platform | Transcripts per Cell | Genes per Cell | Correlation with scRNA-seq | Cell Segmentation Accuracy |
|---|---|---|---|---|
| Stereo-seq v1.3 | Medium | High | 0.89 | Variable (depends on segmentation method) |
| Visium HD FFPE | Medium | High | 0.85 | High (with nuclear staining) |
| Xenium 5K | High | Medium-High | 0.91 | High (with membrane staining) |
| CosMx 6K | High | Medium-High | 0.78 | Medium-High |
| MERSCOPE | Medium | Medium | 0.82 | Medium |
Spatial Resolution and Cell Segmentation
Spatial Specificity: Imaging-based platforms (Xenium, CosMx, MERSCOPE) inherently provide single-cell resolution due to their imaging-based detection system. Sequencing-based platforms achieve subcellular resolution through small capture feature sizes (0.5-2 μm) but require computational integration for single-cell analysis [49].
Cell Segmentation Performance: Assessment of nuclear and membrane segmentation reveals platform-specific strengths. Xenium demonstrates improved segmentation capabilities with additional membrane staining, while CosMx and MERSCOPE show varying degrees of segmentation accuracy depending on tissue type and autofluorescence [68]. All platforms achieve spatially resolved cell typing with varying sub-clustering capabilities, with Xenium and CosMx identifying slightly more clusters than MERSCOPE, albeit with different false discovery rates [68].
Concordance with Orthogonal Data
Spatial Proteomics Alignment: Integration with CODEX spatial proteomics data from adjacent sections reveals strong concordance for key protein-RNA pairs across platforms, validating biological findings [49]. However, instances of RNA-protein decoupling highlight the importance of multi-omics validation for comprehensive tumor characterization [69].
scRNA-seq Integration: Stereo-seq v1.3, Visium HD FFPE, and Xenium 5K demonstrate high concordance with matched scRNA-seq data, supporting their application for cell atlas construction [49]. Cross-platform comparisons reveal strong concordance among these three platforms, highlighting their consistent ability to capture biologically relevant gene expression variation [49].
Experimental Protocols
Sample Processing Workflow
Diagram Title: Sample Processing Workflow for ST Benchmarking
Platform-Specific Methodologies
Sequencing-based Platforms (Stereo-seq, Visium HD):
- Tissue Permeabilization: Optimization of permeabilization time to balance transcript capture efficiency and spatial resolution.
- cDNA Synthesis: On-slide reverse transcription with spatial barcodes.
- Library Preparation: Platform-specific library construction with unique dual indices.
- Sequencing: High-throughput sequencing on Illumina platforms with recommended read depths of 50-100K reads per spot.
Imaging-based Platforms (Xenium, CosMx, MERSCOPE):
- Probe Hybridization: Incubation with gene-specific probe panels (500-6,000 genes).
- Signal Amplification: Platform-specific amplification (rolling circle amplification for Xenium, branch chain hybridization for CosMx, probe tiling for MERSCOPE).
- Cyclic Imaging: Multiple rounds of fluorescent staining, imaging, and destaining.
- Image Processing: Computational reconstruction of transcript locations with subcellular resolution.
Platform Selection Guide
Diagram Title: Platform Selection Decision Tree
The Scientist's Toolkit
Table 3: Essential Research Reagents and Computational Tools
| Resource | Type | Function | Application in ST |
|---|---|---|---|
| SCNT R Package | Computational Tool | Data analysis and visualization of single-cell and spatial data | Streamlines quality control, dimensionality reduction, and visualization for ST data [70] |
| SPATCH Web Server | Data Resource | User-friendly web server for data visualization and download | Enables exploration of benchmarking datasets without computational expertise [49] |
| CODEX Multiplexed Imaging | Experimental Reagent | High-plex spatial protein profiling | Provides ground truth protein data for ST validation [49] |
| 10X Visium HD Gene Expression | Commercial Kit | Whole transcriptome spatial analysis | Standardized workflow for sequencing-based spatial transcriptomics [49] |
| Xenium Gene Panels | Commercial Reagent | Targeted gene panels for in situ analysis | Optimized probe sets for specific tissue types and research questions [68] |
| SurvBoard | Computational Framework | Standardized benchmarking for multi-omics survival models | Enables evaluation of ST clinical prediction performance [71] |
Systematic benchmarking of spatial transcriptomics platforms reveals a maturing technological landscape with multiple robust options for clinical cancer samples. Each platform presents distinct strengths: sequencing-based approaches (Stereo-seq, Visium HD) offer unbiased whole-transcriptome coverage ideal for discovery research, while imaging-based platforms (Xenium, CosMx) provide superior single-cell resolution and sensitivity for targeted panels. The consistent high performance of Xenium 5K across multiple metrics, coupled with the expanding gene panels of CosMx 6K and Stereo-seq v1.3, provides researchers with powerful options for diverse research applications.
Future developments in spatial transcriptomics will likely focus on further increasing multiplexing capacity, improving accessibility through streamlined workflows, and enhancing computational integration with histopathology and clinical outcomes. As these technologies become increasingly integral to cancer research, continued systematic benchmarking using standardized frameworks will be essential to guide platform selection and methodological advancement in spatial tumor profiling.
The choice between fresh-frozen (FF) and formalin-fixed paraffin-embedded (FFPE) tissue preservation represents one of the most fundamental methodological decisions in spatial transcriptomics research on tumor architecture. This decision profoundly impacts every subsequent analytical step, from data quality to biological interpretation. In the context of investigating tumor organization architecture, where preserving both spatial context and molecular integrity is paramount, understanding these impacts is not merely technical but foundational to research validity.
FFPE preservation has served as the gold standard in pathology for over a century, with billions of specimens archived worldwide [72]. These archives represent an invaluable resource for retrospective studies linking long-term clinical outcomes with spatial molecular patterns. Conversely, FF preservation is often considered the benchmark for molecular integrity, particularly for sensitive techniques like spatial transcriptomics that aim to capture the intricate cellular relationships within the tumor microenvironment. This technical guide examines the comparative advantages, limitations, and appropriate applications of each method within modern spatial oncology research.
Molecular Integrity: A Comparative Analysis
The fixation and preservation methods employed directly influence the quantity, quality, and analytical potential of nucleic acids and proteins recovered from tissue specimens. These differences stem from the fundamental mechanisms of each process.
Nucleic Acid Quality and Analytical Performance
Table 1: Comparative Nucleic Acid Quality and Sequencing Performance
| Parameter | Fresh-Frozen (FF) Tissue | FFPE Tissue | Research Implications |
|---|---|---|---|
| DNA Integrity | High molecular weight DNA [73] | Fragmented DNA; cross-linked [72] [74] | FFPE requires specialized extraction protocols |
| RNA Integrity | Preserved RNA integrity (RIN >8) [75] | Degraded RNA; reduced RIN (mean 2.2) [76] | FF preferred for RNA-Seq applications |
| RNA Yield | Higher yields [76] | 2-fold less RNA yield [76] | FFPE may require input normalization |
| Major Artefacts | Minimal sequence artefacts [72] | C>T/G>A transitions from deamination; oxidation artefacts [72] | FFPE artefacts problematic for low-frequency variants |
| Gene Detection | Higher gene detection in RNA-Seq [77] | ~90% overlap with FF in optimized protocols [77] | FF provides more comprehensive transcriptome |
| Methylation Analysis | Accurate β-values [73] | Overestimated β-values in 21.4% of CpG sites [73] | Caution required for FFPE epigenomic studies |
Proteomic and Epigenomic Comparisons
Proteomic studies reveal substantial methodological biases. FFPE samples typically yield approximately 40% fewer protein identifications compared to OCT-embedded frozen samples (approximately 700 vs. 1200 proteins) [78]. Mitochondrial proteins involved in TCA cycle and electron transport are particularly underrepresented in FFPE proteomes, indicating specific vulnerability to formalin fixation [78]. However, when protocols are optimized, shotgun proteomics can identify thousands of proteins with 92% overlap between FFPE and frozen specimens [79].
For chromatin accessibility profiling, recent advances in spatial FFPE-ATAC-seq enable mapping of open chromatin regions in archived tissues, though with notable technical distinctions. While this method maintains expected enrichment at transcription start sites, it produces smaller fragment sizes without clear nucleosome periodicity compared to fresh-frozen spatial ATAC-seq [80].
Spatial Transcriptomics Workflows: Technical Protocols
The integration of FF and FFPE samples into spatial transcriptomics requires distinct preparatory workflows, each with critical steps that influence experimental outcomes.
Fresh-Frozen Tissue Protocol for Spatial Transcriptomics
The optimal FF protocol for skull base tumors emphasizes rapid processing (<15 minutes from resection to freezing) and omission of isopentane snap-freezing to significantly improve RNA quality (p=0.004) and histomorphological integrity (p=0.02) [75]. Fresh tissue washed with cold PBS before OCT embedding and snap-freezing currently represents the best method for preparing spatial sections, with RNA Integrity Number (RIN) ≥6 serving as a sufficient quality threshold for spatial transcriptomics [75].
FFPE Tissue Protocol for Spatial Transcriptomics
For spatial FFPE-ATAC-seq, target retrieval optimization is critical. The highest transcription start site (TSS) enrichment scores are achieved using Tris-EDTA buffer (pH 9.0) at 65°C combined with proteinase K digestion (10 ng/μl for 45 minutes) [80]. This specialized processing helps overcome formalin-induced crosslinking that would otherwise obstruct Tn5 transposase access to genomic DNA [80].
The Scientist's Toolkit: Essential Research Reagents
Table 2: Key Reagents for Tissue Processing and Spatial Analysis
| Reagent/Category | Function | Application Notes |
|---|---|---|
| OCT Compound | Tissue embedding medium for cryosectioning | Optimal for FF spatial transcriptomics [78] [75] |
| RNA/DNA Defender | Nucleic acid stabilizer | For fresh reference tissue stabilization [77] |
| Tris-EDTA Buffer (pH 9.0) | Target retrieval solution | Optimal for FFPE chromatin accessibility (spatial FFPE-ATAC-seq) [80] |
| Proteinase K | Enzyme for breaking protein-nucleic acid crosslinks | Critical for FFPE epitope retrieval (10 ng/μl for 45 min) [80] |
| Magnetic Bead-Based Kits | Nucleic acid purification | Gentle deparaffinization and crosslink reversal for FFPE [74] |
| WT-Ovation FFPE System | Whole transcriptome amplification | Optimized for degraded FFPE RNA [76] |
| CORALL FFPE Kit | Library preparation | Specialized for FFPE whole transcriptome sequencing [77] |
| Chromium Single Cell Gene Expression Flex | Single-cell RNA sequencing | Enables scRNA-seq on fixed tissues including FFPE [74] |
Impact on Spatial Data Quality and Analytical Outcomes
The preservation method directly influences spatial data quality through multiple technical dimensions. In mass spectrometry-based proteomics, the preservation method introduces greater variation than biological differences between tumor stages, complicating direct comparisons [78]. Multivariate analyses demonstrate that samples cluster primarily by preservation method rather than biological characteristics, necessitating careful normalization when integrating datasets from different sources [78].
For nucleic acid-based spatial analyses, FFPE specimens consistently show reduced library complexity, higher duplication rates, and less uniform coverage [74]. Despite these challenges, gene expression profiles from FFPE tissues can achieve high correlation with matched FF samples (r > 0.89-0.95) when optimized protocols are employed [74]. Single-cell RNA sequencing of FFPE tissues now enables robust preservation of clinically relevant cell type information, with high correlations in signaling pathways between matched fresh and FFPE specimens [74].
The choice between FF and FFPE tissue preservation for spatial transcriptomics of tumor organization involves balancing molecular integrity against architectural preservation, clinical relevance, and resource availability. FF tissues provide superior biomolecule quality and are preferred for discovery-phase research where comprehensive molecular capture is prioritized. FFPE specimens offer unparalleled access to clinically annotated archives and excellent tissue morphology, enabling retrospective longitudinal studies linking spatial organization to clinical outcomes.
Future methodological developments will continue to bridge the gap between these platforms. Techniques like spatial FFPE-ATAC-seq [80] and single-cell sequencing of FFPE tissues [74] are rapidly advancing, unlocking the potential of vast archival collections for spatial tumor research. By understanding the specific impacts of each preservation method and implementing appropriate protocols, researchers can maximize the scientific return from both fresh and archived specimens in spatial studies of tumor architecture.
Spatial transcriptomics has emerged as a pivotal technology for investigating tumor organization architecture, enabling the precise mapping of gene expression within intact tissue sections. This capability is particularly crucial for deciphering tumor heterogeneity, immune microenvironment composition, and cellular communication networks that drive cancer progression and therapeutic resistance [52]. Unlike traditional bulk or single-cell RNA sequencing that requires tissue dissociation and loses spatial context, spatial transcriptomics preserves the architectural relationships between malignant, stromal, and immune cells within the tumor ecosystem [39] [52]. However, the immense value of spatially resolved data comes with significant computational challenges that researchers must overcome to extract biologically meaningful insights.
The computational pipeline for spatial transcriptomics begins with raw data generation from either sequencing-based platforms (e.g., 10X Visium, Stereo-seq) or imaging-based platforms (e.g., Xenium, MERSCOPE, CosMx), each producing distinct data types and analytical challenges [35]. The subsequent steps include cell segmentation to assign transcripts to individual cells, spatial gene expression analysis to identify patterns and gradients, cell-type deconvolution for multi-cell resolutions, and cellular communication inference to map interaction networks [81]. Each stage demands specialized computational methods and robust data management strategies, particularly as datasets grow in size and complexity. For tumor biology research, accurately resolving these computational challenges is essential for identifying novel therapeutic targets, understanding mechanisms of resistance, and developing predictive biomarkers for personalized cancer treatment [52].
Core Computational Challenges and Solutions
Cell Segmentation: From Pixels to Cells
Cell segmentation represents the foundational computational step in imaging-based spatial transcriptomics, where individual RNA molecules must be accurately assigned to their cell of origin. Inaccurate segmentation leads to misassignment of mRNAs, introducing errors in downstream analyses such as cellular phenotyping, differential expression, and cell-cell communication inference [82]. This challenge is particularly acute in tumor tissues characterized by high cellular density, complex morphology, and heterogeneous cell types.
Table 1: Comparison of Cell Segmentation Methods for Spatial Transcriptomics
| Method | Algorithm Type | Required Inputs | Key Advantages | Limitations |
|---|---|---|---|---|
| Proseg [83] | Probabilistic model | Nuclei staining, RNA locations | Reduces suspicious gene co-expression; improves T-cell detection in tumors | Platform-specific adaptation needed |
| BOMS [82] | Mean shift algorithm | RNA spatial locations and gene labels | No auxiliary image needed; fast execution; simple implementation | May struggle with highly transcriptionally similar adjacent cells |
| Baysor [82] | Bayesian mixture modeling | RNA locations (optional: auxiliary image) | Elegant mathematical foundation; flexible confidence in auxiliary data | Long runtimes on large datasets; difficult parameter tuning |
| BIDCell [82] | Deep learning | RNA data, scRNA-seq reference, marker genes | Incorporates biological prior knowledge | Requires single-cell reference and marker gene knowledge |
| Cellpose [82] | Deep learning | Nuclei or membrane staining | Excellent nuclei segmentation performance | Does not capture full cell body; unassigned mRNAs |
The segmentation challenge has spurred development of innovative computational approaches. Proseg, a recently developed tool, utilizes a probabilistic model that defines cell boundaries based on RNA transcript distribution patterns. It leverages the principle that RNA transcripts are typically randomly distributed throughout the cell, simulating cells that best explain the observed transcript distribution using a Cellular Potts Model approach. Validation studies demonstrated that Proseg significantly reduces the frequency of biologically implausible gene co-expression pairs compared to existing methods and has revealed previously undetected T-cell populations in renal cell carcinoma samples due to improved segmentation accuracy [83].
Alternative approaches like BOMS (Based On Mean Shift) offer segmentation without requiring auxiliary images by leveraging the spatial locations and gene labels of mRNA spots. The algorithm operates on the principle that molecules belonging to the same cell form local neighborhoods that are transcriptionally similar. It computes Neighborhood Gene Expression (NGE) vectors for each molecule based on its k nearest neighbors, then uses a mean shift procedure to identify modes in the joint spatial-NGE domain, effectively grouping molecules that converge to the same mode into individual cells [82]. This method demonstrates particularly value for complex tissues where high-quality staining is difficult to obtain.
Analytical Frameworks for Spatial Data
Beyond segmentation, spatial transcriptomics data demands specialized analytical approaches that leverage spatial information to derive biological insights. Key computational challenges include identifying spatially variable genes, delineating tumor microenvironment domains, inferring cell-cell communication, and integrating multi-omic data.
Spatially variable gene (SVG) detection methods identify genes whose expression exhibits significant spatial patterns, which may correspond to functional niches within the tumor microenvironment. Methods employing Gaussian processes, generalized linear models, and spatial autocorrelation analysis can classify different patterns of spatial variation such as linear gradients or periodic expression, potentially revealing mechanisms of tumor-immune interaction and microenvironment-driven gene regulation [81].
For sequencing-based technologies with multi-cellular resolution, computational deconvolution approaches are essential to infer cell-type proportions within each spatial spot. These methods typically integrate cell-type-specific transcriptomic profiles from single-cell RNA sequencing references, enabling resolution of cellular heterogeneity within the constraints of the spatial technology's resolution [81]. More advanced methods now incorporate spatial information directly into the deconvolution process, improving accuracy by leveraging the similarity between neighboring spots.
Table 2: Computational Methods for Spatial Transcriptomics Data Analysis
| Analytical Task | Computational Approach | Key Applications in Tumor Research |
|---|---|---|
| Spatially Variable Gene Identification | Gaussian processes, spatial autocorrelation analysis [81] | Identifying tumor niche-specific expression patterns, microenvironment gradients |
| Cell-Cell Communication Inference | Graph convolutional networks, optimal transport, spatial cross-correlation [81] | Mapping tumor-immune interactions, paracrine signaling networks |
| Spatial Domain Detection | Hidden Markov random fields, graph-based clustering | Delineating tumor regions, immune niches, stromal compartments |
| Multi-omics Integration | Multi-view learning, manifold alignment [3] | Linking spatial gene expression with protein activity, genetic alterations |
| Trajectory Inference | RNA velocity in situ, spatial pseudotime | Modeling tumor evolution, cell state transitions across spatial contexts |
The integration of spatial transcriptomics with histology images represents another promising analytical frontier. Deep learning approaches like MISO (Multiscale Integration of Spatial Omics) can predict spatial gene expression directly from H&E-stained histological slides, potentially enabling spatial transcriptomic analysis from vast archives of existing clinical specimens [5]. Such methods significantly expand the potential for retrospective studies linking long-term clinical outcomes with spatial tumor organization.
Managing Large-Scale Spatial Data
The data management challenges in spatial transcriptomics are substantial, with imaging-based technologies generating terabytes of raw image data per experiment [81]. Effective data handling requires specialized computational infrastructure and optimized processing pipelines.
Cloud computing platforms have emerged as essential resources for managing spatial transcriptomics data, providing scalable storage and computational resources that can accommodate the massive datasets [84]. The democratization of data access through cloud platforms enables researchers worldwide to analyze large spatial datasets without requiring extensive local computational infrastructure. Containerization technologies like Docker and Singularity further enhance reproducibility by encapsulating complete analytical environments.
Data compression strategies are particularly important for spatial transcriptomics, given the size of raw imaging files. Efficient file formats optimized for sparse spatial data can significantly reduce storage requirements while maintaining fast access for analysis. Establishing centralized data repositories with standardized organization principles will be critical for sharing spatial transcriptomics data across the research community [81].
Experimental Protocols for Tumor-Focused Spatial Transcriptomics
Integrated Workflow for Tumor Microenvironment Analysis
A comprehensive spatial analysis of tumor architecture requires careful experimental design and computational execution. The following protocol outlines an integrated approach for characterizing cellular organization and interactions in the tumor microenvironment.
Figure 1: Integrated computational workflow for spatial analysis of tumor architecture
Sample Preparation and Technology Selection
- Tissue Processing: Optimal spatial transcriptomics requires careful tissue preservation. For frozen tissues, optimal cutting temperature (OCT) compound embedding with rapid freezing preserves RNA integrity. For FFPE tissues, standard clinical pathology protocols are compatible with newer spatial technologies like 10X Visium HD and Xenium [35] [52].
- Platform Selection: Choose spatial technology based on resolution requirements and sample type. For discovery-phase studies requiring whole transcriptome coverage, sequencing-based approaches like Visium HD provide genome-wide profiling. For high-resolution validation studies, imaging-based platforms like Xenium or CosMx offer subcellular resolution [35].
Computational Processing Pipeline
- Data Preprocessing: For sequencing-based data, process raw FASTQ files using space-aware alignment tools (e.g., SpaceRanger) that assign reads to spatial barcodes. For imaging-based data, perform image segmentation and spot calling using platform-specific pipelines [81].
- Cell Segmentation: Apply segmentation algorithms appropriate for your data type and quality. For tissues with clear nuclear staining, Proseg or Cellpose provide excellent performance. For tissues without high-quality staining, staining-free methods like BOMS offer a viable alternative [83] [82].
- Quality Control: Implement rigorous QC metrics including genes per cell, counts per cell, mitochondrial percentage, and segmentation confidence scores. Identify and exclude poor-quality cells or regions [81].
Spatial Analysis and Interpretation
- Cell Type Annotation: Integrate single-cell RNA sequencing references to annotate cell types using transfer learning approaches. Incorporate prior knowledge of cell-type-specific marker genes for validation.
- Spatial Pattern Analysis: Identify spatially variable genes using methods like spatial autocorrelation analysis. Detect spatial domains with similar cellular composition or gene expression patterns [81].
- Cell-Cell Communication: Infer ligand-receptor interactions between spatially proximal cells using tools that incorporate spatial proximity rather than just transcriptional similarity [81].
Deep Learning-Based Prediction from Histology Images
The integration of spatial transcriptomics with digital pathology represents a powerful approach for leveraging extensive histology archives. The MISO framework demonstrates how deep learning can predict spatial gene expression patterns directly from H&E-stained images [5].
Figure 2: Deep learning workflow for predicting spatial gene expression from H&E images
Implementation Protocol
- Training Data Preparation: Curate paired H&E images and spatial transcriptomics data from the same tissue section. The MISO model was trained on 72 10X Genomics Visium samples and validated on 348 samples from five cancer indications [5].
- Multiscale Feature Extraction: Process H&E images at multiple resolutions to capture both cellular and tissue-level features. Convolutional neural networks extract morphological features correlated with gene expression patterns.
- Model Training and Validation: Train deep learning models to predict spatial gene expression from image features. Validate predictions using held-out spatial transcriptomics measurements and through biological validation such as comparison to known spatial patterns of key oncogenes and tumor suppressor genes.
Table 3: Research Reagent Solutions for Computational Spatial Transcriptomics
| Resource Category | Specific Tools | Function and Application |
|---|---|---|
| Cell Segmentation Tools | Proseg [83], BOMS [82], Baysor [82], Cellpose [82] | Assigning RNA molecules to individual cells based on spatial distributions and transcriptional profiles |
| Spatial Analysis Platforms | MISO [5], SPIRAL [5], CytoSPACE [5] | Predicting gene expression from histology, data integration across technologies, spatial alignment |
| Cloud Computing Resources | AWS, Google Cloud, Azure [84] | Providing scalable computational infrastructure for large dataset storage and analysis |
| Data Visualization Tools | Giotto, Squidpy, Vitessce | Visualizing spatial gene expression patterns, cellular neighborhoods, and tissue domains |
| Reference Datasets | HEST-1k [5], TCGA [5], MOSAIC Consortium [5] | Providing benchmark data for method development and validation across diverse tumor types |
The computational challenges in spatial transcriptomics represent significant but surmountable hurdles in the quest to comprehensively characterize tumor architecture. Advances in cell segmentation algorithms like Proseg and BOMS are improving the accuracy of cellular profiling, while innovative analytical frameworks are unlocking the potential of spatial data to reveal new biology. As these computational methods mature and become more accessible, they promise to transform our understanding of tumor organization, progression, and therapeutic response. The integration of artificial intelligence with spatially resolved data particularly powerful for extracting maximum information from precious clinical samples, potentially accelerating the development of novel cancer diagnostics and therapeutics. For the research and drug development community, embracing these computational approaches will be essential for fully leveraging the power of spatial biology in oncology.
Leveraging AI and Machine Learning for Automated Feature Extraction and Spatial Pattern Recognition
In oncology, tumors are not merely aggregates of malignant cells but complex, organized tissues with intricate spatial architectures. The spatial relationships between cancer cells, immune cells, stromal components, and vasculature create specialized microenvironments that critically influence disease progression, therapeutic response, and resistance mechanisms [52]. Spatial transcriptomics (ST) has emerged as a revolutionary technology that enables the precise quantification and visualization of gene expression within the intact spatial context of tissues, unlike conventional transcriptomics which loses this crucial architectural information [52]. This capability is particularly vital for genitourinary cancers (e.g., prostate, bladder, kidney), which demonstrate significant spatial heterogeneity affecting treatment resistance and immune evasion [52]. The integration of Artificial Intelligence (AI) and Machine Learning (ML) with ST data is now pushing the boundaries of our understanding, allowing for the automated extraction of biologically meaningful features and the recognition of complex spatial patterns that were previously inaccessible. These advanced computational methods are transforming raw, high-dimensional spatial omics data into actionable biological insights, thereby accelerating discovery in tumor biology and drug development.
AI and Machine Learning Foundations for Spatial Data
Core Concepts in AI Feature Extraction
AI feature extraction is a fundamental process in machine learning that converts raw data into a set of meaningful, non-redundant features that effectively represent the underlying information for algorithmic processing [85]. In the context of spatial biology, this involves identifying and isolating characteristic spatial patterns or structures within data, such as tissue images or spatial gene expression matrices [86]. The primary goals are to reduce data dimensionality, eliminate redundancy, enhance model performance, and improve interpretability [85]. This process is crucial for managing the enormous scale and complexity of spatial transcriptomics datasets, where manual analysis is infeasible.
Various feature types require distinct processing approaches. Numerical features (e.g., gene expression counts) enable precise mathematical computations, while categorical features (e.g., cell type classifications) provide essential distinctions between biological classes [85]. The features most relevant to spatial transcriptomics include spatial point patterns (cell locations), textural features (tissue morphology), and interaction features (cell-cell communication metrics) that collectively describe the tumor ecosystem.
Machine Learning Techniques for Spatial Pattern Recognition
Multiple machine learning techniques have been adapted and developed specifically for spatial pattern recognition in biological contexts:
Convolutional Neural Networks (CNNs) automatically extract hierarchical features from images, identifying patterns from simple edges to complex shapes through layered filters [85] [86]. In spatial transcriptomics, CNNs analyze histology images from H&E-stained slides to predict spatial gene expression patterns [5].
Graph Neural Networks (GNNs) process data structured as graphs, making them ideal for modeling cellular neighborhoods and interaction networks where cells represent nodes and spatial proximities represent edges [5].
Transformer architectures with attention mechanisms capture long-range dependencies within tissue sections, effectively modeling interactions between distant but biologically connected tissue regions [5].
Autoencoders serve as powerful tools for dimensionality reduction, learning compressed representations of high-dimensional spatial data while preserving biologically relevant information [85]. These are particularly valuable for identifying latent patterns in spatial omics datasets.
Hybrid approaches that combine multiple architectures, such as transformers with graph neural networks, have demonstrated superior performance in predicting spatial gene expressions from histology images by jointly modeling local and global tissue contexts [5].
AI-Driven Methodologies in Spatial Transcriptomics
Deep Learning for Multiscale Data Integration
A significant challenge in spatial biology is integrating information across multiple scales, from subcellular features to tissue-level organization. The MISO (Multiscale Integration of Spatial Omics) framework represents a cutting-edge deep learning approach that addresses this challenge by predicting spatial transcriptomics data from routinely available H&E-stained histology slides [5]. This methodology demonstrates how AI can leverage existing pathological resources to generate spatially resolved molecular information.
The MISO framework employs a sophisticated pipeline that processes whole slide images (WSIs) through a deep learning network trained on matched H&E and spatial transcriptomics data from 72 10X Genomics Visium samples [5]. The model learns the complex relationships between tissue morphology and gene expression patterns, enabling it to predict spatial gene expression from H&E morphology alone. When validated on 348 samples across five cancer indications from the MOSAIC consortium, MISO significantly outperformed competing methods in extensive benchmarks [5]. This approach demonstrates particular strength in predicting spatially variable genes and capturing biological processes with clear morphological correlates, such as immune infiltration and stromal reactions.
Table 1: Commercial Spatial Transcriptomics Platforms Enabled by AI Analysis
| Platform | Company | Methodology | Resolution | Maximum Targets | Best for AI Applications |
|---|---|---|---|---|---|
| Xenium | 10x Genomics | Padlock probe with rolling circle amplification | Subcellular | 5000 RNAs | High-plex subcellular mapping |
| Visium | 10x Genomics | Spatially barcoded spots for mRNA capture | 55 μm (single-cell with HD) | All 3' mRNA | Whole transcriptome analysis |
| CosMx | NanoString | Branched DNA probes with multiple readout sequences | Subcellular | 18,000+ RNAs | Ultra-high-plex single-cell analysis |
| MERSCOPE | Vizgen | Multiple probes per RNA with unique readout sequences | Subcellular | 1000 RNAs | Single-molecule imaging |
| GeoMx | NanoString | UV-cleavable oligo tags on probes | Region of Interest | 18,000+ RNAs | High-throughput discovery |
AI-Powered Feature Extraction Techniques
AI enables several sophisticated feature extraction paradigms specifically designed for spatial transcriptomics data:
Spatial Gene Expression Prediction: Deep learning models like MISO [5] and SEPAL [5] can predict spatial gene expression patterns directly from histological images. These models typically use a CNN backbone (e.g., ResNet) to extract visual features from tissue tiles, which are then processed through transformer or graph neural network layers to model spatial dependencies and predict gene expression values for each spatial location.
Cellular Neighborhood Identification: Unsupervised and self-supervised learning methods cluster cells or tissue regions based on their spatial transcriptomic profiles to identify recurrent cellular neighborhoods – spatially coherent units with distinct biological functions. AI methods enhance this by simultaneously considering gene expression, spatial proximity, and morphological context.
Cell-Cell Interaction Inference: Graph neural networks model tissue sections as spatial graphs where cells represent nodes and physical proximities define edges. These models can then infer communication patterns based on ligand-receptor co-expression in spatially proximal cells, revealing tumor-immune interactions and stromal signaling networks.
Domain Adaptation from Histology: As demonstrated by MISO [5], domain adaptation techniques enable knowledge transfer from widely available H&E-stained histological slides to spatial transcriptomics domains. This is particularly valuable given that H&E slides are routinely generated for most cancer patients, while spatial transcriptomics remains a specialized, costly technology.
Experimental Protocols for AI-Enhanced Spatial Analysis
Protocol 1: Predicting Spatial Transcriptomics from H&E Morphology
This protocol is based on the MISO methodology [5] and enables researchers to infer spatial gene expression from standard histology slides.
Sample Preparation: Collect paired H&E-stained whole slide images (WSIs) and spatial transcriptomics data from the same tissue section. For validation studies, 10X Genomics Visium provided ground truth data [5].
Data Preprocessing:
- Tile H&E images into smaller patches (e.g., 256×256 pixels) at multiple magnification levels (e.g., 5X, 10X, 20X).
- Align spatial transcriptomics spots with corresponding H&E image regions.
- Normalize gene expression counts using standard methods (e.g., logCPM, SCTransform).
Model Architecture:
- Implement a multi-scale CNN (e.g., ResNet50) to extract features from H&E tiles at different resolutions.
- Incorporate transformer layers with attention mechanisms to model spatial relationships between tissue regions.
- Include graph neural network components to capture neighborhood interactions.
Training Procedure:
- Train the model using paired H&E and spatial transcriptomics data.
- Employ a mean squared error loss between predicted and actual gene expression.
- Use cross-validation across tissue sections to assess generalizability.
Validation:
- Benchmark against competing methods using metrics like root mean square error (RMSE) and correlation coefficients.
- Perform biological validation by confirming that predictions recapitulate known spatially variable genes.
Protocol 2: Spatially Resolved Cell-Type Deconvolution
This protocol enables the identification of cell types within spatial transcriptomics spots that typically contain multiple cells.
Reference Generation:
- Generate a single-cell RNA sequencing reference atlas from similar tissue types.
- Annotate cell types using established marker genes.
Integration Framework:
- Implement a conditional variational autoencoder (cVAE) to integrate single-cell and spatial transcriptomics data.
- Use spatial coordinates as conditional variables to maintain spatial context.
Deconvolution:
- Model each spatial spot as a mixture of cell types from the reference atlas.
- Estimate cell-type proportions using non-negative matrix factorization or Bayesian approaches.
Spatial Pattern Analysis:
- Apply spatial autocorrelation statistics (e.g., Moran's I) to identify non-random distributions of cell types.
- Construct spatial graphs to identify recurrent cellular neighborhoods.
Table 2: AI Model Architectures for Spatial Transcriptomics Analysis
| Model Type | Primary Application | Key Advantages | Implementation Considerations |
|---|---|---|---|
| Convolutional Neural Networks (CNNs) | Image-based feature extraction from histology | Hierarchical feature learning, translation invariance | Requires large datasets, GPU acceleration |
| Graph Neural Networks (GNNs) | Modeling cell-cell interactions | Naturally models spatial relationships, flexible topology | Graph construction critical for performance |
| Transformers | Long-range spatial dependencies | Attention mechanisms, excellent scalability | Computationally intensive for large tissues |
| Autoencoders | Dimensionality reduction, denoising | Learns compressed representations, removes noise | Risk of losing biologically relevant information |
| Hybrid Models (CNN+GNN) | Multimodal data integration | Combines visual and spatial information | Complex training, potential overfitting |
The Scientist's Toolkit: Essential Research Reagents and Platforms
Successful implementation of AI-driven spatial transcriptomics requires both wet-lab reagents and computational tools. The following table details essential components of the spatial biology workflow.
Table 3: Research Reagent Solutions for Spatial Transcriptomics
| Item | Function | Example Products/Platforms |
|---|---|---|
| Spatial Barcoding Beads | Capture location-tagged mRNA from tissue sections | 10x Genomics Visium Gene Expression Slide |
| Morphology Preservation Buffers | Maintain tissue architecture during processing | Visium Tissue Preservation Solution |
| Permeabilization Reagents | Enable mRNA release from fixed tissues | Visium Permeabilization Enzyme |
| Probe Sets | Target-specific oligonucleotides for transcript detection | CosMx Human Whole Transcriptome Panel |
| Fluorescent Reporters | Visualize spatial gene expression patterns | Readout Fluorescent Tags (MERSCOPE) |
| Multiomic Integration Panels | Simultaneous detection of RNA and protein | GeoMx Discovery Proteome Atlas (1,100+ plex protein assay) |
| Nucleic Acid Amplification Kits | Signal amplification for low-abundance transcripts | Hybridization Chain Reaction (HCR) Amplification |
| Library Preparation Kits | Prepare sequencing libraries from barcoded cDNA | Visium Spatial Gene Expression Library Kit |
| Image Analysis Software | Process and visualize spatial omics data | MISO Pipeline, Giotto, Seurat, SpaceRanger |
| AI Modeling Frameworks | Implement machine learning for pattern recognition | PyTorch, TensorFlow, Scanpy, Squidpy |
Visualization and Computational Workflows
Effective visualization is crucial for interpreting the complex spatial relationships uncovered by AI methodologies. The following workflow represents an integrated pipeline for AI-powered spatial transcriptomics analysis.
Future Frontiers and Implementation Challenges
The integration of AI with spatial transcriptomics presents several implementation challenges that researchers must address. Computational resource requirements are substantial, as processing whole slide images and spatial transcriptomics datasets demands significant GPU memory and storage capacity [5]. Data integration complexity arises when combining multimodal data sources (histology, transcriptomics, proteomics) with different resolutions and noise profiles [5] [52]. Interpretability and explainability remain crucial for biological validation, as complex deep learning models can function as "black boxes" without clear mechanistic insights [85]. Additionally, technical variability between platforms, batches, and experimental conditions requires careful normalization and domain adaptation approaches [52].
Future developments are likely to focus on several key frontiers. Multimodal foundation models pre-trained on large-scale histology and omics data will enable transfer learning for specific cancer types with limited data [5]. Spatial dynamical modeling will extend beyond static snapshots to model temporal changes in tumor architecture during treatment and progression. Clinical translation will see increased development of AI-driven spatial biomarkers for diagnosis, prognosis, and treatment selection, particularly in immuno-oncology [3] [52]. Finally, real-time analysis platforms will emerge, integrating spatial omics with AI for intraoperative decision support and rapid diagnostic pathology.
As these technologies mature, the combination of AI and spatial transcriptomics will fundamentally enhance our understanding of tumor organization, enabling more precise targeting of cancer's spatial vulnerabilities and advancing the development of next-generation therapeutics that account for the complex architectural principles of human tumors.
From Data to Discovery: Validating Spatial Findings and Cross-Platform Comparisons
The intricate spatial organization of solid tumors is a critical regulator of cancer progression, therapeutic response, and patient prognosis. While spatial transcriptomics (ST) has revolutionized our ability to map gene expression within intact tissue architecture, transcriptomic data alone provides an incomplete picture of the tumor microenvironment (TME). Establishing reliable ground truth datasets through the integration of ST with protein-level data from technologies like CODEX (Co-Detection by indEXing) and histological validation is paramount for advancing spatially resolved cancer research. This multi-omic approach bridges the gap between molecular expression, protein function, and tissue morphology, enabling researchers to decipher the complex cellular communication networks and functional niches that define tumor biology. The correlation of these complementary data types ensures that transcriptional signatures are contextualized within their protein and morphological frameworks, significantly enhancing the biological relevance and translational potential of discoveries in precision oncology.
Core Methodologies for Multi-Omic Spatial Profiling
Spatial Transcriptomics Platforms and Principles
Spatial transcriptomics technologies can be broadly categorized into two classes: sequencing-based (sST) and imaging-based (iST) platforms [27]. Sequencing-based methods, such as Visium HD (10x Genomics) and Stereo-seq (BGI), capture polyadenylated RNA using spatially barcoded poly-dT oligonucleotides arrayed on a surface, enabling unbiased whole-transcriptome analysis [49]. In contrast, imaging-based platforms, including CODEX, CosMx (NanoString), and Xenium (10x Genomics), utilize iterative hybridization of fluorescently labeled probes with sequential imaging to profile hundreds to thousands of genes at single-molecule resolution within intact tissue sections [27] [33]. A key advantage of iST platforms is their inherent compatibility with protein co-detection, either through antibody-based methods or integrated multimodal assays.
CODEX Multiplexed Protein Profiling
CODEX (Co-Detection by indEXing) is a highly multiplexed protein imaging technology that enables simultaneous detection of dozens of protein markers in formalin-fixed paraffin-embedded (FFPE) or frozen tissue sections while preserving spatial context [49]. The methodology utilizes a library of DNA-barcoded antibodies that are hybridized simultaneously and detected through successive rounds of fluorescent imaging with complementary fluorescently labeled oligonucleotides. This iterative staining and imaging process allows for the precise spatial localization of numerous protein epitopes within complex tissues. The resulting high-dimensional protein data serves as an ideal ground truth for validating protein-level expression patterns inferred from ST data, particularly for cell-type identification, cellular state characterization, and cell-cell interaction analysis.
Integrated Experimental Workflow for Ground Truth Establishment
Sample Preparation and Tissue Sectioning
Robust multi-omic integration begins with meticulous sample preparation. For comprehensive studies, tumor samples should be divided and processed into both FFPE blocks and fresh-frozen optimal cutting temperature (OCT) compound-embedded blocks to accommodate the specific requirements of different ST platforms and CODEX [49]. Serial tissue sections (typically 4-10 μm thick) are then cut from adjacent regions of the same tissue block and allocated to different technologies—one section for ST, the immediately adjacent section for CODEX, and subsequent sections for H&E staining and other histological analyses. This serial sectioning approach is critical for ensuring that similar cellular regions are profiled across modalities, enabling direct cross-platform comparison.
Technical Optimization for Multi-Omic Assays
Successful integration requires careful optimization of experimental conditions to balance mRNA preservation with protein epitope integrity. Key considerations include:
- Fixation Conditions: While standard ST protocols often use methanol fixation for optimal mRNA preservation, this is suboptimal for antibody-based protein detection. Paraformaldehyde (PFA) fixation better preserves protein epitopes but can reduce mRNA accessibility. Optimization of PFA concentration and fixation time is essential [87].
- Permeabilization Enhancement: Standard tissue permeabilization enzymes may be insufficient for PFA-fixed tissues. Combining the permeabilization enzyme with 1% sodium dodecyl sulfate (SDS) can significantly increase yields for both mRNA and antibody-derived tags (ADTs) while maintaining tissue architecture [87].
- Antibody Validation: For protein detection assays, antibodies must be rigorously validated for specificity in the tissue type of interest. Control experiments without primary antibodies and isotype-matched controls are essential to establish signal specificity.
The following workflow diagram illustrates the integrated experimental design for correlating ST with CODEX and histology:
Data Generation and Alignment Pipeline
Following sample processing, the next critical phase involves generating and aligning multi-omic data to establish spatial ground truth. The sequential steps in this pipeline ensure precise registration of transcriptional, protein, and histological information from adjacent tissue sections.
Benchmarking Spatial Transcriptomics Platforms Against CODEX-Derived Ground Truth
Systematic benchmarking studies have evaluated the performance of various high-throughput ST platforms against CODEX-derived protein ground truth. The following table summarizes key performance metrics across four advanced platforms, based on a comprehensive analysis of colon adenocarcinoma, hepatocellular carcinoma, and ovarian cancer samples [49]:
Table 1: Performance Benchmarking of ST Platforms Against CODEX Protein Ground Truth
| Platform | Technology Type | Resolution | Gene Panel Size | Sensitivity for Marker Genes | Correlation with scRNA-seq | Concordance with CODEX |
|---|---|---|---|---|---|---|
| Visium HD FFPE | Sequencing-based (sST) | 2 μm | 18,085 genes | Moderate to High | High | High |
| Stereo-seq v1.3 | Sequencing-based (sST) | 0.5 μm | Whole transcriptome | Moderate | High | High |
| Xenium 5K | Imaging-based (iST) | Single molecule | 5,001 genes | High | High | High |
| CosMx 6K | Imaging-based (iST) | Single molecule | 6,175 genes | Moderate | Moderate | Moderate |
The evaluation of molecular capture efficiency reveals important distinctions between platforms. When assessing shared regions across FFPE serial sections, Xenium 5K consistently demonstrated superior sensitivity for multiple marker genes compared to other platforms [49]. Gene-wise correlation analysis with matched single-cell RNA sequencing (scRNA-seq) data showed that Stereo-seq v1.3, Visium HD FFPE, and Xenium 5K maintained high correlations with scRNA-seq profiles, while CosMx 6K showed substantial deviation despite detecting a higher total number of transcripts [49].
Successful integration of ST and CODEX data requires carefully selected reagents, platforms, and computational tools. The following table details essential components of the multi-omic spatial profiling toolkit:
Table 2: Research Reagent Solutions for Multi-Omic Spatial Profiling
| Category | Specific Product/Platform | Function/Application | Key Considerations |
|---|---|---|---|
| Spatial Transcriptomics Platforms | 10x Genomics Visium HD | Whole transcriptome mapping at 2μm resolution | Compatible with FFPE and fresh frozen tissues |
| NanoString CosMx 6K | Targeted transcriptomics with single-cell resolution | 6,175-plex RNA panel with protein co-detection capability | |
| 10x Genomics Xenium 5K | In-situ analysis of 5,001 genes | Optimized for FFPE tissues with integrated morphology analysis | |
| Multiplex Protein Imaging | CODEX/IBEX systems | Highly multiplexed protein detection (50+ markers) | Enables immune cell phenotyping and spatial neighborhood analysis |
| Akoya Phenocycler | Whole-slide multiplexed protein imaging | Suitable for discovery and validation phases | |
| Antibody Resources | DNA-barcoded antibodies (CODEX) | Multiplexed protein detection via DNA barcoding | Require validation for specific tissue types and fixation conditions |
| CITE-seq/SPOTS antibodies | Simultaneous protein and transcript detection | Polyadenylated antibody-derived tags for sequencing-based detection | |
| Computational Tools | SpaLinker | Links spatial TME features to clinical phenotypes | Identifies tertiary lymphoid structures and tumor-normal interfaces |
| Giotto Suite | Comprehensive ST data analysis | Spatial domain detection, cell-cell communication analysis | |
| SPATA | Spatial transcriptomics analysis framework | Integrates with single-cell references for cell type decomposition |
Analytical Framework for Cross-Modal Data Integration
Spatial Registration and Coordinate Alignment
The first critical step in multi-omic integration is the precise spatial alignment of datasets generated from adjacent tissue sections. This process involves:
- Landmark Identification: Using histological features such as blood vessels, tissue boundaries, or prominent morphological structures as reference points across serial sections.
- Non-linear Transformation: Applying advanced image registration algorithms (e.g., elastic, B-spline) to align the coordinate systems of ST, CODEX, and histological images, accounting for tissue distortion during sectioning.
- Cellular-Level Alignment: For high-resolution data, implementing cell segmentation based on DAPI or H&E staining to enable single-cell cross-modal correlation when combined with nuclear staining references.
Multi-Modal Cell Type Annotation and Validation
CODEX protein data provides an essential ground truth for validating and refining cell type annotations derived from ST data. The integrated analytical approach includes:
- Protein-Guided Clustering: Using protein expression patterns from CODEX to inform clustering parameters for ST data, particularly for immune cell subsets that may have distinct protein signatures but overlapping transcriptional profiles.
- Cross-Modal Marker Validation: Identifying concordant and discordant patterns between mRNA and protein expression for key cell type markers (e.g., CD3ε, CD4, CD8 for T cells; CD19, CD20 for B cells; EpCAM for epithelial cells) [87].
- Spatial Distribution Analysis: Comparing the spatial distributions of specific cell populations identified through protein markers (CODEX) with transcriptional signatures (ST) to identify regions of agreement and biological divergence.
Signaling Pathway and Cellular Interaction Analysis
The integration of transcriptional and protein data enables more robust analysis of active signaling pathways and cell-cell communication:
- Ligand-Receptor Interaction Mapping: Combining expression of ligand and receptor pairs at both mRNA and protein levels to identify functionally active communication axes within the TME.
- Pathway Activity Inference: Using protein expression and phosphorylation status (when available) to validate inferred pathway activity from transcriptional signatures.
- Spatial Neighborhood Analysis: Defining cellular neighborhoods based on both transcriptional and protein signatures, then examining how these neighborhoods correlate with histological features and clinical outcomes.
Applications in Cancer Research and Clinical Translation
Identification of Therapeutically Relevant Spatial Features
The correlation of ST with CODEX has enabled the discovery and validation of spatial features with clinical significance:
- Tertiary Lymphoid Structures (TLS): Integrated analysis has revealed TLS as organized immune aggregates containing B cells, T cells, and dendritic cells in specific spatial arrangements, which correlate with improved response to immunotherapy across multiple cancer types [11]. Tools like SpaLinker leverage both gene expression and spatial information to accurately identify TLS regions and link them to patient outcomes [11].
- Tumor-Normal Interface (TNI) Regions: The spatial interface between tumor and normal tissue harbors unique cellular communities and molecular gradients that influence invasion and metastasis. SPOTS analysis has revealed specialized macrophage subsets (CD169+) and fibroblast populations (CD29+) occupying distinct spatial niches at these interfaces [87].
- Immunosuppressive Niches: Combined protein and transcript profiling has identified spatial compartments enriched for immunosuppressive cell types (Tregs, M2 macrophages) and checkpoint expression (PD-1, PD-L1, CTLA-4) that may represent resistance mechanisms to immunotherapy [33].
Biomarker Discovery and Validation
The multi-omic ground truth approach enhances biomarker discovery by:
- Differentiating Functional States: Identifying markers that distinguish cell states (e.g., exhausted vs. activated T cells) through correlated protein and RNA expression patterns.
- Spatial Contextualization: Determining whether biomarker expression is diffuse or restricted to specific spatial contexts with functional implications.
- Prognostic Stratification: Developing spatial signatures that integrate both transcriptional and protein information to improve patient stratification beyond conventional histopathological grading.
The establishment of ground truth through correlation of spatial transcriptomics with CODEX protein profiling and histology represents a paradigm shift in cancer research. This multi-omic framework moves beyond singular molecular perspectives to provide a comprehensive, spatially resolved understanding of tumor ecosystems. As these technologies continue to evolve, several exciting directions emerge: the development of fully integrated assays that simultaneously capture RNA and protein from the same tissue section, the implementation of artificial intelligence for automated pattern recognition across modalities, and the creation of standardized reference maps for normal and diseased tissues. Ultimately, the rigorous correlation of transcriptional, proteomic, and morphological information will accelerate the translation of spatial oncology discoveries into clinically actionable insights, paving the way for more precise diagnostic and therapeutic strategies in cancer care.
Spatial transcriptomics (ST) has emerged as a revolutionary technological paradigm, integrating spatial data with transcriptomic information to generate high-resolution maps of gene expression within the intact architectural context of tissues [88]. This capability is fundamentally transforming cancer research by preserving the spatial relationships that are lost in single-cell RNA sequencing (scRNA-seq), thereby enabling unprecedented insights into cellular heterogeneity, intercellular interactions, and the functional organization of the tumor microenvironment (TME) [17] [23]. The TME comprises a complex ecosystem of malignant cells, immune cells, stromal cells, blood vessels, and extracellular matrix, all interacting in spatially coordinated ways that influence tumor progression, invasion, metastasis, and therapy response [13] [17]. Understanding this spatial architecture is critical, as the distribution of immune cells within the TME has demonstrated significant prognostic value and potential for predicting immunotherapy outcomes [13] [89].
The rapid development of ST platforms, however, presents both opportunities and challenges. These technologies can be broadly classified into imaging-based (iST) and sequencing-based (sST) approaches, each with distinct strengths and limitations concerning spatial resolution, transcriptome coverage, and sample compatibility [90] [49] [23]. Imaging-based methods, such as Xenium, Merscope, and Molecular Cartography, utilize multiplexed single-molecule RNA fluorescence in situ hybridization (smRNA-FISH) for targeted analysis with single-cell or subcellular resolution [90]. In contrast, sequencing-based methods like Visium capture transcripts using spatially barcoded arrays for unbiased whole-transcriptome analysis, though often at a coarser resolution that encompasses multiple cells per spot [90] [17]. This technological diversity makes selecting the appropriate platform for specific research objectives a complex decision, requiring careful consideration of parameters such as sensitivity, specificity, gene coverage, and the accuracy of transcript assignment to individual cells [90].
As ST technologies advance, a parallel boom has occurred in the development of statistical and computational frameworks designed to extract biologically meaningful patterns from the complex, high-dimensional data they generate [89] [88]. These frameworks are essential for moving beyond descriptive accounts of spatial organization to quantitative, validated models of tumor architecture and function. This guide focuses on introducing and detailing key validation frameworks, with a particular emphasis on SpaTopic and other complementary tools, providing researchers with the methodologies needed to advance spatial transcriptomics in tumor organization research.
The computational analysis of spatial transcriptomics data presents unique challenges, including managing multimodality (integrating gene expression with spatial coordinates and histology), high dimensionality, and spatial noise [23]. Several sophisticated frameworks have been developed to address these challenges. The table below summarizes the core tools discussed in this guide.
Table 1: Key Statistical and Computational Frameworks for Spatial Transcriptomics
| Framework Name | Core Methodology | Primary Application | Key Advantages |
|---|---|---|---|
| SpaTopic [91] [92] | Bayesian topic modeling (Latent Dirichlet Allocation) | Identifying recurrent spatial patterns ("topics") in cell types across tissue images. | High interpretability, scalability to millions of cells, identifies biologically meaningful spatial domains. |
| Spatiopath [13] | Null-hypothesis framework extending Ripley's K function | Distinguishing statistically significant spatial associations from random cell distributions. | Robustly quantifies cell-cell and cell-tumor epithelium interactions; distinguishes real associations from fortuitous accumulations. |
| Cell2Spatial [93] | Information-theoretic gene selection & spatial likelihood modeling | Mapping single cells to spatial transcriptomics spots to reconstruct tissue architecture at single-cell resolution. | Effectively handles unmatched single-cell and ST datasets; improves signal fidelity and spatial coherence. |
| SpatialTopic [91] | Bayesian topic model with spatial priors | Decoding spatial tissue architecture from multiplexed images by integrating cell type and spatial information. | High computational efficiency (minutes for 100,000 cells); identifies recurrent spatial patterns like Tertiary Lymphoid Structures (TLS). |
These frameworks represent a paradigm shift from simple descriptive analyses to robust, statistically grounded inference of spatial patterns. SpaTopic and SpatialTopic leverage topic modeling to reduce complexity and identify latent structures, while Spatiopath provides a rigorous statistical foundation for testing hypotheses about cellular interactions. Cell2Spatial addresses the critical need for enhanced resolution in sST data, enabling detailed reconstructions of tissue architecture [93]. Together, they form a powerful toolkit for validating and interpreting the spatial architecture of tumors.
Detailed Framework Analysis: SpaTopic Methodology and Workflow
SpaTopic is a statistical learning framework designed specifically to identify and annotate pathology-relevant spatial domains by harmonizing spot clustering and cell-type deconvolution [92]. Its power lies in integrating single-cell transcriptomics (scRNA-seq) with spatially resolved transcriptomics (SRT) data through a topic modeling approach, treating spatial domains as documents composed of different cell types (words) [92]. This allows it to stratify the TME into spatial domains with coherent cellular organization, moving beyond gene expression-based clustering alone.
The SpaTopic workflow consists of four methodical steps:
Input and Deconvolution: The process begins with SRT data and matched scRNA-seq data with pre-existing cell-type annotations. SpaTopic first uses a deconvolution method (e.g., CARD) to infer the cell-type composition of each spot in the SRT data. Simultaneously, an unsupervised clustering method (e.g., STAGATE) is applied to aggregate spots into initial clusters based on their spatial gene expression profiles [92].
Cell Type-Specific Scoring: Next, SpaTopic applies the Kolmogorov-Smirnov (KS) test to determine a cell type–specific enrichment score for each initial cluster. This generates a matrix (S matrix) that quantifies how specific each cell type is to each spatial cluster, leveraging the results from the deconvolution and clustering steps [92].
Topic Modeling via LDA: The core of SpaTopic involves applying the Latent Dirichlet Allocation (LDA) model to decompose the S matrix into two probability distributions:
- Topic-Cell Type Distribution (C1): This matrix defines the "cell-type topics," representing the probability of each cell type within a given topic. It reveals the predominant cell-type compositions that characterize functional units in the TME.
- Cluster-Topic Distribution (C2): This matrix defines the probability that a spatial cluster belongs to a specific topic [92].
Spatial Domain Annotation: Finally, the cluster-topic matrix is binarized, assigning each initial cluster to one or more specific topics, now termed CellTopics. This step refines the initial spot clusters into final spatial domains based on the learned cell-type topics, enabling the characterization and quantitative comparison of these domains across different SRT datasets [92].
Table 2: Experimental Protocol for Applying SpaTopic to Tumor Data
| Step | Protocol Detail | Purpose & Rationale |
|---|---|---|
| 1. Sample Preparation | Generate serial sections from tumor samples (FFPE or fresh-frozen). | To ensure compatibility with SRT platforms and matched scRNA-seq. |
| 2. Data Generation | - Perform SRT (e.g., using 10x Visium, Xenium).- Perform scRNA-seq on the same or matched sample. | To acquire spatial gene expression data and a reference for cell type annotation. |
| 3. Preprocessing | - Annotate cell types from scRNA-seq using standard clustering/markers.- Quality control of SRT data (filtering spots/genes). | To create a clean, annotated reference for deconvolution and topic modeling. |
| 4. SpaTopic Execution | - Run deconvolution (CARD) and spatial clustering (STAGATE).- Execute the SpaTopic workflow to infer CellTopics. | To identify spatial domains based on coherent cell-type composition. |
| 5. Validation | - Compare SpaTopic domains with manual histopathological annotations.- Validate using Adjusted Rand Index (ARI). | To quantitatively assess the accuracy and biological relevance of the identified domains. |
SpaTopic has been rigorously validated, outperforming methods like STAGATE, SpaGCN, and BayesSpace in accurately capturing the underlying spatial organization of tissues, as measured by the Adjusted Rand Index (ARI) against manual annotations [92]. For example, in a human pancreatic ductal adenocarcinoma (PDAC) dataset, SpaTopic identified distinct CellTopics corresponding to cancer, stromal, ductal, and normal pancreatic regions. The cancer region (CellTopic3) was characterized by enrichment of neoplastic cells and fibroblasts, and its highly expressed genes showed significant enrichment in stromal and immune-related processes, providing insights into tumorigenesis and potential chemoresistance [92].
Experimental Protocols for Key Analyses
Implementing the computational frameworks described requires robust experimental design and data generation protocols. The following section details the methodologies for benchmarking ST technologies and for conducting spatial pattern analysis, which are foundational to any subsequent computational validation.
Protocol for Benchmarking Spatial Transcriptomics Platforms
Systematic benchmarking is crucial for selecting the appropriate ST technology and interpreting results accurately. A robust benchmarking protocol involves:
- Sample Preparation: Collect treatment-naïve tumor samples (e.g., colon adenocarcinoma, hepatocellular carcinoma). Divide each sample and process it into matched FFPE and fresh-frozen (OCT-embedded) blocks. Generate serial tissue sections (4-10 μm thickness) from these blocks for parallel profiling across multiple ST platforms and complementary assays [49].
- Multi-Omics Profiling:
- ST Platforms: Process adjacent serial sections on the high-throughput platforms to be benchmarked (e.g., Stereo-seq v1.3, Visium HD FFPE, CosMx 6K, Xenium 5K). This controls for biological variability.
- Ground Truth Data:
- scRNA-seq: Perform single-cell RNA sequencing on dissociated cell suspensions from the same tumor sample to provide a cell-type annotated reference transcriptome [49].
- Protein Profiling: Use multiplexed protein imaging (e.g., CODEX) on tissue sections adjacent to those used for ST to validate spatial patterns at the protein level [49].
- Histology: Perform H&E staining and high-resolution imaging of consecutive sections. Manually annotate nuclear boundaries and tissue regions for segmentation validation [49].
- Performance Metrics: Systematically evaluate each platform across several critical metrics:
- Sensitivity & Specificity: Assess the detection sensitivity for marker genes (e.g., EPCAM) and calculate the false discovery rate (FDR) using negative control probes [90] [49].
- Transcript Diffusion: Quantify the degree of transcript diffusion away from the nucleus, which affects localization accuracy [49].
- Cell Segmentation Accuracy: Compare automated segmentation results (using tools like Cellpose, Baysor, or Mesmer) against manually segmented nuclei from DAPI/H&E images [90] [49].
- Concordance with scRNA-seq and CODEX: Evaluate the correlation of gene expression profiles with scRNA-seq and the spatial alignment of marker expression with CODEX protein data [49].
Protocol for Spatial Pattern Analysis with Spatiopath
Spatiopath provides a statistical framework for distinguishing significant spatial associations from random distributions. The experimental and analytical protocol is as follows:
- Data Input Preparation:
- Cell Type Identification: From ST data (either from iST or deconvoluted sST data), identify and label all immune cells and tumor cells using known marker genes.
- Tumor Region Segmentation: Manually or computationally segment the tumor epithelium boundary from the tissue image [13].
- Define Spatial Objects:
- Let set A represent the spatial objects of interest (e.g., the closed 2D contour of the tumor epithelium boundary, or the coordinates of a specific immune cell type).
- Let set B represent the coordinates of the immune cell population whose spatial association with A is being tested [13].
- Generalized Accumulation Function:
- Spatiopath generalizes Ripley's K function to handle interactions between points (cells) and arbitrarily shaped objects (tumor boundaries). The generalized accumulation function counts the accumulation of points in B to the shapes in A, corrected for boundary effects [13].
- Null Hypothesis Testing:
- The core of Spatiopath is a null hypothesis model where immune cells are randomly distributed. The framework computes whether the observed accumulation of B cells near A is statistically significant compared to this random null distribution, thereby distinguishing fortuitous accumulation from true spatial association [13].
- Distance Quantification:
- The analysis outputs the physical distance at which significant spatial apposition occurs, for example, revealing that mast cells accumulate significantly within a specific micrometer range from the tumor epithelium, while T cells may be positioned farther away [13].
Signaling Pathways and Tumor-Microenvironment Interactions
A primary application of these frameworks is the dissection of signaling pathways and cellular communication within the TME. SpaTopic, for instance, not only identifies spatial domains but also enables the inference of communication patterns between them [92]. In a PDAC analysis, CellTopic1 (stromal region) showed blocked integrin signaling pathways and minimal interaction with other regions, consistent with the known role of PDAC stroma as a physical barrier [92]. Similarly, the identification of a conserved tumor-microenvironment interface enriched in cilia genes, as revealed by ST in zebrafish melanoma models and validated in human samples, suggests a specialized zone of tumor-stroma crosstalk potentially regulated by ETS-family transcription factors [17].
The integration of ST data with cell-cell communication tools (e.g., CellChat, NicheNet) allows for the mapping of ligand-receptor interactions across spatially defined domains. Spatiopath enhances this by quantitatively determining if interacting cell pairs are significantly co-localized or spatially segregated, adding a layer of statistical robustness to inferred communication networks [13] [92].
The Scientist's Toolkit: Essential Research Reagents and Materials
Successfully executing a spatial transcriptomics study with the described validation frameworks requires careful selection of reagents and platforms. The following table catalogs essential components for building a robust experimental pipeline.
Table 3: Research Reagent Solutions for Spatial Transcriptomics
| Category | Item / Platform | Specification / Function | Considerations for Selection |
|---|---|---|---|
| Spatial Platforms | 10x Visium / Visium HD | Sequencing-based; whole transcriptome; 55μm (HD: 2μm) resolution. | Ideal for unbiased discovery; resolution limits single-cell analysis in standard Visium [90] [23]. |
| Xenium, Merscope, CosMx | Imaging-based (smRNA-FISH); targeted panels; single-cell/subcellular resolution. | Best for high-resolution targeted studies; gene number limited by panel [90] [49] [23]. | |
| Sample Types | Fresh-Frozen (FF) Tissue | Snap-frozen tissue sections. | Often superior RNA integrity; compatible with most platforms [90]. |
| Formalin-Fixed Paraffin-Embedded (FFPE) | Archival clinical tissue samples. | Essential for translational studies; compatibility varies by platform (e.g., Xenium, CosMx support FFPE) [49] [23]. | |
| Probes & Panels | Targeted Gene Panels | Pre-defined sets of genes for iST. | Crucial for iST; must be carefully designed to cover cell types and pathways of interest [90] [23]. |
| Whole Transcriptome Probes | Poly(dT) capture oligos for sST. | Used in Visium, Stereo-seq for unbiased profiling [49]. | |
| Stains & Reagents | DAPI / H&E Stains | Nuclear counterstain and histological reference. | Enables cell segmentation and correlation with tissue pathology [90] [49]. |
| Fluorescent Antibodies (CODEX) | For multiplexed protein profiling. | Provides ground truth validation for protein expression and cell typing [49]. | |
| Computational Tools | SpaTopic / SpatialTopic R Packages | Software for spatial domain identification via topic modeling. | Requires input of cell types and locations [91] [92]. |
| Spatiopath Algorithm | Software for statistical spatial pattern analysis. | Used to quantify significant cell-cell and cell-region interactions [13]. | |
| Cell2Spatial R Package | Software for mapping single cells to spatial spots. | Useful for enhancing the resolution of sequencing-based ST data [93]. | |
| Reference Data | scRNA-seq Dataset | Annotated single-cell transcriptomes from the same sample. | Mandatory for deconvolution and for SpaTopic analysis [92] [93]. |
This toolkit, combining wet-lab reagents with dry-lab computational packages, provides the foundation for a rigorous and reproducible spatial transcriptomics research program aimed at decoding tumor architecture.
Spatial transcriptomics (ST) has revolutionized the study of tumor organization by enabling the precise quantification of gene expression within the native tissue architecture. Unlike bulk or single-cell RNA sequencing that requires tissue dissociation and loses spatial context, ST technologies preserve the spatial relationships between cells, offering unprecedented insights into the tumor microenvironment (TME), cellular neighborhoods, and spatially variable gene patterns [94]. This capability is particularly valuable for understanding cancer biology, tumor heterogeneity, and the mechanisms underlying therapy resistance.
However, the rapid proliferation of commercial ST platforms has raised critical questions about the reproducibility and concordance of findings across different technologies. As researchers increasingly employ these methods to answer fundamental biological questions and develop clinical diagnostics, understanding cross-platform reproducibility becomes essential for interpreting results and validating discoveries [95]. This technical guide examines the reproducibility of spatial findings across leading ST platforms, with a specific focus on applications in tumor architecture research, providing researchers with methodologies for assessing concordance and frameworks for experimental design.
Imaging-based spatial transcriptomics (iST) platforms represent the cutting edge for single-cell resolution spatial analysis, particularly for Formalin-Fixed Paraffin-Embedded (FFPE) tissues—the standard in clinical pathology. Three leading commercial platforms have emerged: 10X Genomics Xenium, Vizgen MERSCOPE, and NanoString CosMx. While they share the common goal of mapping gene expression in situ, they employ distinct chemical approaches and signal amplification strategies that significantly impact their performance characteristics [68].
Xenium uses a small number of padlock probes with rolling circle amplification (RCA). CosMx employs a low number of probes amplified via branch chain hybridization. MERSCOPE utilizes direct probe hybridization but amplifies signal by tiling transcripts with many probes [68]. These fundamental differences in chemistry create platform-specific strengths and limitations that researchers must consider when designing experiments, especially those involving precious biobanked FFPE samples.
Beyond these iST platforms, other technologies play important roles in the spatial biology ecosystem. Digital Spatial Profiling (DSP) platforms like NanoString's GeoMx allow researchers to select regions of interest (ROIs) based on histology for expression analysis, bridging traditional pathology with high-plex molecular analysis [95]. The emerging CellScape platform enables high-plex spatial proteomics through iterative staining and imaging cycles [3], while the PaintScape platform visualizes 3D genome architecture in situ [3].
Experimental Workflow for Cross-Platform Assessment
The general workflow for conducting a rigorous cross-platform assessment of ST technologies involves careful experimental design, sample preparation, data generation, and computational analysis. The following diagram illustrates the key stages in this process:
Figure 1: Cross-platform assessment workflow for spatial transcriptomics technologies. The process begins with FFPE tissue blocks, proceeds through tissue microarray construction and serial sectioning, then processes sections across multiple platforms for comparative analysis. RCA: Rolling Circle Amplification.
Benchmarking Performance Across Platforms
Systematic Benchmarking in FFPE Tissues
A comprehensive 2025 benchmarking study systematically evaluated three commercial iST platforms—10X Xenium, Vizgen MERSCOPE, and Nanostring CosMx—using serial sections from tissue microarrays (TMAs) containing 17 tumor and 16 normal tissue types [68]. This study provides the most direct head-to-head comparison available to date, with critical implications for tumor organization research.
The experimental design involved creating three TMAs: two tumor TMAs (tTMA1 with 170 cores from 7 cancer types; tTMA2 with 48 cores from 19 cancer types) and one normal tissue TMA (nTMA with 45 cores from 16 normal tissue types) [68]. To emulate real-world conditions using standard biobanked FFPE tissues, samples were not pre-screened based on RNA integrity, though they were screened by H&E during TMA assembly—reflecting typical workflows for clinical pathology specimens.
For platform matching, the researchers utilized the CosMx 1K panel, Xenium human breast, lung, and multi-tissue panels, and designed custom MERSCOPE panels to match the Xenium breast and lung panels, ensuring adequate gene overlap (>65 genes) across platforms [68]. Data collection occurred in multiple rounds (2023 and 2024), with intentional standardization of tissue preparation conditions in the 2024 round to enable fair head-to-head comparisons.
Quantitative Performance Metrics
The benchmarking study generated massive datasets encompassing over 394 million transcripts and 5 million cells, enabling robust statistical comparisons across platforms [68]. The table below summarizes key performance metrics with implications for tumor architecture studies:
Table 1: Performance metrics of imaging-based spatial transcriptomics platforms from systematic benchmarking in FFPE tissues
| Performance Metric | Xenium | CosMx | MERSCOPE |
|---|---|---|---|
| Transcript Counts per Gene | Highest | High | Lower |
| Concordance with scRNA-seq | High | High | Not Reported |
| Cell Sub-clustering Capability | High | High | Moderate |
| False Discovery Rates | Variable | Variable | Variable |
| Cell Segmentation Error Frequency | Variable | Variable | Variable |
| Total Transcripts Recovered (2024 data) | High | Highest | Lower |
The study found that Xenium consistently generated higher transcript counts per gene without sacrificing specificity, while both Xenium and CosMx demonstrated strong concordance with orthogonal single-cell transcriptomics data [68]. All three platforms successfully performed spatially resolved cell typing, though with varying sub-clustering capabilities—Xenium and CosMx identified slightly more clusters than MERSCOPE, albeit with different false discovery rates and cell segmentation error frequencies [68].
Platform-Specific Technical Considerations
Each platform demonstrated distinct technical characteristics that influence their application in tumor research:
Sensitivity and Specificity: On matched genes, Xenium showed superior sensitivity with higher transcript counts per gene, while maintaining specificity. CosMx also demonstrated high sensitivity, particularly with its whole transcriptome approach [68] [3].
Single-Cell Resolution: All three iST platforms provide single-cell resolution, but with different segmentation approaches. Xenium improved its segmentation capabilities between 2023 and 2024 by adding additional membrane staining, highlighting how rapidly these platforms are evolving [68].
Multimodal Integration: CosMx's Whole Transcriptome (WTX) assay has demonstrated strong performance in detecting rare cells and representing tissue composition more accurately than scRNA-seq alone, while preserving spatial context—particularly valuable for identifying rare tumor subpopulations or immune cells [3].
Assessing Concordance and Reproducibility
Analytical Frameworks for Cross-Platform Validation
Establishing concordance across platforms requires multiple analytical approaches that assess different aspects of data quality and biological validity. The benchmarking study employed several rigorous methods:
Orthogonal Validation with scRNA-seq: The comparison of iST data with matched single-cell transcriptomics data from 10x Chromium Single Cell Gene Expression FLEX provides a critical ground truth for assessing the accuracy of gene expression measurements independent of spatial information [68].
Spatial Clustering Consistency: Evaluating the consistency of spatially resolved cell typing across platforms tests whether each platform identifies similar cellular neighborhoods and tissue domains—essential for tumor microenvironment studies where cellular organization impacts function [68].
Cell Segmentation Accuracy: Assessing co-expression patterns of known disjoint markers helps validate cell segmentation and boundary detection, which is fundamental for accurate single-cell analysis within tissues [68].
Reproducibility in Clinical Samples
A separate study focusing on rigor and reproducibility examined spatial transcriptomics performance in clinically sourced human kidney tissues, including both nephrectomy specimens and biopsies [95]. This research provides critical insights for tumor architecture studies, particularly regarding:
Technical Reproducibility: The study demonstrated high technical reproducibility for digital spatial profiling when applied to FFPE tissues, with consistent results across replicate sections and regions of interest [95].
Normalization Impact: The research highlighted how normalization approaches can significantly impact biological interpretation of spatial transcriptomics data, emphasizing the need for careful computational processing in cross-platform studies [95].
Sensitivity Tradeoffs: The comparison between multicellular (GeoMx DSP) and single-cell resolution (CosMx SMI) platforms revealed tradeoffs in cost, execution time, and detection sensitivity that must be balanced based on research objectives [95].
Table 2: Key research reagents and solutions for spatial transcriptomics studies
| Reagent/Solution | Function | Platform Examples |
|---|---|---|
| Custom Gene Panels | Targeted gene expression profiling | Xenium, MERSCOPE |
| Whole Transcriptome Panels | Comprehensive transcriptome coverage | CosMx WTX |
| Membrane Stains | Cell segmentation and boundary identification | Xenium |
| Immunostaining Panels | Protein expression alongside transcriptomics | CellScape |
| CRISPR Screening Panels | Spatial mapping of gene edits | CosMx CRISPR |
| Multi-omics Integration | Combined RNA and protein profiling | GeoMx DPA |
Methodologies for Cross-Platform Concordance Experiments
Experimental Design Considerations
Implementing robust cross-platform concordance studies requires meticulous experimental design:
Tissue Selection and Preparation: The benchmarking study used tissue microarrays containing multiple tumor and normal types, enabling assessment of platform performance across diverse tissue architectures [68]. For tumor-specific studies, including various cancer subtypes and grading patterns is essential.
Sectioning Protocol: Consecutive serial sectioning (typically 5-10μm thickness) ensures that nearly identical cellular regions are profiled across platforms. The 2024 benchmarking data specifically controlled for baking times after slicing to standardize tissue condition across platforms [68].
RNA Quality Assessment: While the benchmarking study intentionally used typical biobanked tissues without RNA quality pre-screening to reflect real-world conditions, the MERSCOPE platform recommends DV200 > 60% for optimal performance [68]. Researchers should consider RNA quality metrics when interpreting results, especially for archival samples.
Data Processing and Analysis Framework
The computational workflow for cross-platform concordance involves several critical steps:
Spatial Data Alignment: Multiple computational tools exist for aligning and integrating spatial transcriptomics slices, with at least 24 methodologies recently reviewed [55]. These can be categorized as:
- Statistical mapping approaches (e.g., Splotch, GPSA, PASTE)
- Image processing and registration tools (e.g., STIM, STalign)
- Graph-based methods (e.g., SpatiAlign, STAligner) [55]
Cell Segmentation Standardization: The benchmarking study used each manufacturer's standard base-calling and segmentation pipeline, reflecting typical user experience [68]. For more controlled comparisons, consistent segmentation algorithms could be applied across platforms.
Cross-Platform Integration: Emerging tools like SPIRAL enable integration and alignment of spatially resolved transcriptomics data across different experiments, conditions, and technologies [55], facilitating direct comparative analyses.
The following diagram illustrates the computational workflow for assessing cross-platform concordance:
Figure 2: Computational workflow for assessing cross-platform concordance in spatial transcriptomics data. The process begins with raw data from multiple platforms, proceeds through spatial alignment and feature extraction, and culminates in multiple concordance metrics calculation.
Implications for Tumor Architecture Research
Applications in Tumor Biology
The reproducibility of spatial findings across platforms has profound implications for advancing our understanding of tumor architecture:
Tumor Microenvironment Deconstruction: Consistent identification of cellular neighborhoods across platforms validates the biological reality of these structures rather than being technical artifacts. The benchmarking study demonstrated that all three iST platforms could perform spatially resolved cell typing with varying degrees of sub-clustering capabilities [68].
Therapeutic Target Discovery: Cross-platform concordance increases confidence in potentially targetable spatial patterns, such as immune exclusion zones or stromal barrier formations. CosMx WTX has been used to project over 2,000 measured pathways directly onto tumor tissues, enabling visualization of epithelial-mesenchymal transition, immune barriers, and tissue-specific pathway activation [3].
Clinical Translation: Reproducibility across platforms is fundamental for developing spatial biomarkers for diagnostic use. The high rigor and reproducibility demonstrated for DSP in clinically sourced tissues supports the potential for clinical translation [95].
Emerging Applications and Multimodal Integration
Spatial transcriptomics is increasingly being integrated with other data modalities to provide deeper insights into tumor biology:
Spatial Multi-omics: Platforms like the GeoMx Discovery Proteome Atlas (1,100+ plex protein assay) paired with the GeoMx Whole Transcriptome Atlas (18,000+ plex) enable same-section spatial profiling of RNA and protein targets [3]. This multiomic approach demonstrates high sensitivity, reproducibility, and improved biological resolution for cancer research.
3D Genome Architecture: The PaintScape platform enables in situ, single-cell visualization of 3D genome architecture in cancer, revealing structural genome differences across localized, metastatic, and triple-negative breast cancer models [3].
AI-Enhanced Spatial Analysis: Deep learning approaches like MISO (Multiscale Integration of Spatial Omics with tumor morphology) can predict spatial transcriptomics from H&E stained histological slides, potentially increasing the accessibility of spatial biology to larger patient cohorts [5].
The assessment of cross-platform concordance in spatial transcriptomics reveals both substantial agreement and important technical differences across leading technologies. The systematic benchmarking of Xenium, CosMx, and MERSCOPE demonstrates that all three platforms can generate biologically meaningful spatial data from FFPE tissues, with varying strengths in sensitivity, resolution, and analytical capabilities.
For researchers studying tumor organization architecture, this concordance framework provides methodological guidance for platform selection, experimental design, and analytical validation. As spatial technologies continue to evolve toward higher plex, improved resolution, and multimodal integration, establishing reproducibility across platforms remains fundamental to advancing our understanding of cancer biology and translating spatial discoveries into clinical applications.
The integration of spatial transcriptomics with other data modalities—including proteomics, chromatin organization, and histopathological imaging—promises to unlock deeper insights into tumor architecture and function. Through rigorous cross-platform validation and standardized analytical approaches, the spatial biology community can ensure that findings reflect biological reality rather than technical artifacts, ultimately accelerating discoveries in tumor biology and therapeutic development.
The tumor microenvironment (TME) represents a highly complex and organized ecosystem where the spatial coordination of malignant, immune, and stromal cells fundamentally influences disease progression and therapeutic response [33]. Traditional bulk and single-cell RNA sequencing technologies, while powerful for cataloging cellular heterogeneity, inherently destroy the critical spatial context that governs cell-cell communication and functional tissue organization [22]. Spatial transcriptomics has emerged as a transformative technology that bridges this gap by quantifying gene expression patterns within the intact architectural framework of tissues [22]. This technical guide examines the clinical validation of spatially resolved gene signatures and their established utility in predicting patient prognosis across multiple cancer types, providing researchers and drug development professionals with methodologies, analytical frameworks, and clinical evidence supporting their implementation.
Clinical Evidence: Prognostic Spatial Signatures Across Cancers
Robust clinical studies have successfully linked specific spatial gene expression patterns to patient outcomes, demonstrating superior prognostic capability compared to non-spatial approaches. The following table synthesizes key validated spatial signatures from recent literature:
Table 1: Clinically Validated Spatial Gene Signatures for Cancer Prognosis
| Cancer Type | Spatial Signature | Prognostic Value | Clinical Validation | Reference |
|---|---|---|---|---|
| Non-Small Cell Lung Cancer (NSCLC) | Resistance Signature: Proliferating tumor cells, granulocytes, vessels | HR = 3.8 for shorter PFS | Validated in 3 independent cohorts (n=234) | [96] |
| Response Signature: M1/M2 macrophages, CD4+ T cells (stroma) | HR = 0.4 for longer PFS | Validated in external cohorts | [96] | |
| Melanoma | S100B+ Tumor Compartment (8-gene signature) | Predicts response to immune checkpoint inhibitors | Validated in independent cohort (n=45); outperformed bulk signatures | [97] |
| Gastric Cancer (GC) | Intratumoral TLS (iTLS) Signature: CXCL13+ T cells, CXCR5+ B cells, LAMP3+CD80+ DCs | Improved OS and PFS | Associated with better immunotherapy response | [98] |
Methodological Framework: Generating Spatially-Resolved Signatures
Core Spatial Transcriptomics Technologies
The development of prognostic spatial signatures relies on multiple technological platforms, each with distinct advantages and resolutions:
Digital Spatial Profiling (DSP): This platform, exemplified by the GeoMx system, enables compartment-specific transcriptomic profiling within user-defined tissue regions of interest (ROIs) [3] [97]. Using UV-photocleavable oligonucleotide tags, it allows for high-plex spatial whole transcriptome analysis (18,000+ genes) while preserving tissue architecture [3] [97]. Its key advantage for clinical validation is compatibility with formalin-fixed, paraffin-embedded (FFPE) tissues, the standard in pathology [97].
In Situ Sequencing and Imaging-Based Platforms: Technologies like CosMx and CellScape provide single-cell or subcellular resolution by imaging barcoded probes hybridized to RNA targets directly in tissue sections [3]. The CosMx Human Whole Transcriptome (WTX) assay, for instance, can simultaneously profile transcriptomic and proteomic data from FFPE tissues, enabling AI-powered analysis of spatially organized gene modules [3].
High-Plex Spatial Multiomics: Integrated approaches now enable same-section spatial profiling of RNA and protein. For example, the GeoMx Discovery Proteome Atlas (1,100-plex protein assay) pairs with its Whole Transcriptome Atlas for comprehensive multiomic analysis [3].
Experimental Workflow for Signature Development
The standard pipeline for developing and validating prognostic spatial signatures involves multiple critical stages, visualized in the following workflow:
Computational Analysis and Signature Training
The analytical framework for transforming spatial data into prognostic signatures employs sophisticated statistical and machine learning approaches:
Spatial Data Preprocessing: Raw spatial transcriptomics data undergoes normalization, batch effect correction, and quality control. For barcode-based technologies like 10X Visium, spots are typically clustered based on gene expression similarity [99].
Cell Type Deconvolution: Computational methods like non-negative matrix factorization or reference-based mapping with single-cell RNA-seq data are used to infer cell-type proportions within each spatial spot [99] [100] [33]. This enables the creation of spatial maps of immune, stromal, and malignant cell distributions.
Spatial Analytics and Neighborhood Analysis: Advanced algorithms identify spatially variable genes and characterize cellular neighborhoods—recurrent multicellular communities within the TME [96]. In NSCLC, for example, Voronoi diagrams and cellular neighborhood analysis have revealed distinct spatial architectures enriched with either response-associated (M2 macrophages) or resistance-associated cell types (vessels, PD-L1+ tumor cells) [96].
Signature Training Using Machine Learning: Prognostic signatures are typically trained using regularized Cox proportional hazards models. The LASSO (Least Absolute Shrinkage and Selection Operator) penalty is particularly valuable for selecting the most predictive features from high-dimensional spatial data while preventing overfitting [96] [101]. For NSCLC, this approach identified a resistance signature comprising proliferating tumor cells, granulocytes, and vessels, and a response signature comprising M1/M2 macrophages and CD4+ T cells [96]. Models are typically trained on a discovery cohort with internal cross-validation before external validation.
Key Biological Pathways and Cellular Ecosystems
Spatial transcriptomics has revealed that prognosis is intimately linked with specific cellular ecosystems organized within the TME. The following diagram illustrates two key prognostic pathways and ecosystems:
Tertiary Lymphoid Structures as Prognostic Hubs
As illustrated above, tertiary lymphoid structures (TLS) represent organized immune aggregates that form within the TME. In gastric cancer, integrated single-cell and spatial transcriptomics has revealed that intratumoral TLS (iTLS) are enriched with specific cellular populations including CXCL13+ T lymphocytes, CXCR5+ germinal center B lymphocytes, and activated dendritic cells [98]. The development of these structures depends on a coordinated molecular cascade initiated by high endothelial venule (HEV) cells expressing VCAM1 and ICAM1, which recruit and activate CXCL13+ T cells through the CXCL13-ACKR1 pathway [98]. This subsequently promotes B lymphocyte recruitment via CXCL13-CXCR5 crosstalk, culminating in TLS formation. From a clinical perspective, the presence of iTLS is associated with significantly improved overall survival and progression-free survival in gastric cancer patients, highlighting its role as a favorable prognostic ecosystem [98].
Immunosuppressive Spatial Niches
Conversely, spatial transcriptomics has identified distinct immunosuppressive cellular neighborhoods associated with poor prognosis. In NSCLC, resistance to immunotherapy is characterized by spatial co-localization of proliferating tumor cells, granulocytes, and vascular structures [96]. These resistance niches likely create a physical and biochemical barrier to effective immune cell infiltration and function. The prognostic significance of these niches is demonstrated by the resistance signature (proliferating tumor cells, granulocytes, vessels) that predicted significantly worse outcomes with a hazard ratio of 3.8 for progression-free survival [96].
The Scientist's Toolkit: Essential Research Reagents and Platforms
Table 2: Essential Research Tools for Spatial Prognostic Signature Development
| Tool Category | Specific Technologies/Platforms | Key Function | Application in Prognosis |
|---|---|---|---|
| Spatial Profiling Platforms | GeoMx Digital Spatial Profiler, CosMx SMI, 10X Visium, CellScape | High-plex RNA/protein mapping in FFPE tissues | Compartment-specific signature discovery [3] [97] |
| In Situ Imaging Panels | CODEX, MERFISH, seqFISH, RNAscope | Single-cell resolution spatial imaging | Validation of signature localization [96] [22] |
| Analysis Suites | Visium CytAssist, Xenium Analyzer, DSP DA | Spatial data processing and visualization | Cellular neighborhood identification [3] |
| Validation Assays | nCounter Analysis System, VistaPlex Assay Kits | Targeted spatial signature quantification | Clinical assay translation [3] |
The clinical validation of spatial gene signatures represents a paradigm shift in cancer prognosis, moving beyond mere compositional analysis to incorporate the critical dimension of spatial organization within the TME. The methodologies and evidence presented in this technical guide demonstrate that spatial context provides biologically meaningful and clinically actionable insights that outperform traditional bulk tissue biomarkers. As spatial technologies continue to evolve toward higher plex and resolution, and as computational methods for spatial data integration become more sophisticated, the translation of spatial signatures into clinical practice will accelerate. Future developments will likely focus on standardizing analytical pipelines, validating signatures in prospective clinical trials, and integrating artificial intelligence for automated spatial pattern recognition. For researchers and drug development professionals, mastering these spatial technologies and analytical approaches is now essential for advancing precision oncology and developing the next generation of prognostic tools.
Spatial transcriptomics has revolutionized our understanding of solid tumor organization by preserving the architectural context of gene expression. This technical review synthesizes current research demonstrating that despite the histological and molecular diversity across cancer types, a fundamental organizational principle exists: the leading edge (LE) of tumors exhibits conserved transcriptional programs linked to invasion and poor prognosis, while the tumor core (TC) displays more tissue-specific signatures associated with varied clinical outcomes. This pan-cancer architectural framework, elucidated through advanced computational integration of spatial datasets, reveals conserved mechanisms of progression and unveils novel therapeutic targets for drug development.
The tumor microenvironment (TME) is not a chaotic collection of cells but a highly organized ecosystem with distinct spatial domains that play specialized roles in cancer progression. The emergence of high-resolution spatial transcriptomics technologies has enabled the systematic mapping of these domains across cancer types, revealing consistent architectural patterns that transcend tissue of origin. This technical guide examines the evidence for conserved versus tissue-specific spatial architectures in solid tumors, focusing on the robust dichotomy between the invasive leading edge and the tumor core.
Understanding these pan-cancer principles provides a framework for developing novel therapeutic strategies that target conserved invasive mechanisms while accounting for tissue-specific contextual factors. For drug development professionals, these insights offer opportunities to design treatments that disrupt critical spatial communication networks and metabolic dependencies within the TME.
Core Findings: Conserved Leading Edge and Tissue-Specific Tumor Core
Transcriptional and Functional Dichotomy
Integrative single-cell and spatial transcriptomic analysis of HPV-negative oral squamous cell carcinoma (OSCC) has established that the TC and LE represent functionally distinct compartments with unique transcriptional profiles, cellular compositions, and ligand-receptor interactions [21].
Table 1: Core Transcriptional and Functional Features of Tumor Spatial Domains
| Feature | Tumor Core (TC) | Leading Edge (LE) |
|---|---|---|
| Key Marker Genes | CLDN4, SPRR1B, SPRR2 family, DEFB4A, LCN2 [21] | LAMC2, ITGA5, COL1A1, FN1, TIMP1 [21] |
| Hallmark Pathways | Keratinization, cell differentiation, antimicrobial immunity [21] | Epithelial-mesenchymal transition (EMT), cell cycle, angiogenesis [21] |
| Activated Signaling | MSP-RON (macrophages), IL-33, p38 MAPK [21] | GP6, EIF2, HOTAIR regulatory pathways [21] |
| Cellular Processes | Immune modulation, differentiation [21] | ECM remodeling, invasion, proliferation [21] |
| Pan-Cancer Conservation | Tissue-specific [21] | Conserved across cancer types [21] |
| Clinical Prognosis | Associated with improved outcomes [21] | Predicts worse survival across multiple cancers [21] |
The LE gene signature is characterized by extracellular matrix (ECM) remodeling genes (COL1A1, FN1, COL1A2, TIMP1, COL6A2) and demonstrates elevated activity in cell cycle, EMT, and angiogenesis pathways [21]. In contrast, the TC expresses genes involved in keratinization (SPRR2D, SPRR2E, SPRR2A) and inhibition of EMT (DEFB4A, LCN2) [21]. This fundamental dichotomy is conserved across patients, with high correlation within TC and LE compartments across different individuals, but low correlation between TC and LE within the same patient [21].
Pan-Cancer Validation in Primary and Metastatic Liver Tumors
The conserved nature of invasive programs is further evidenced in liver tumors. A direct high-resolution spatial comparison of primary hepatocellular carcinoma (HCC) and liver metastases revealed fundamentally different spatial architectures, yet shared metabolic vulnerabilities [102].
HCC displays an ordered lineage architecture with transformed hepatocyte-like tumor cells broadly dispersed across the tissue, while liver metastases show sharply compartmentalized domains: an invasion zone containing proliferative stem-like tumor cells adjacent to TAM-rich boundaries, and a plasticity zone forming a heterogeneous niche of cancer-testis antigen-positive germline-like cells [102]. Despite these organizational differences, both tumor types converged on a shared program of "porphyrin overdrive" metabolism, characterized by reduced cytochrome P450 expression, enhanced oxidative phosphorylation, and upregulation of FLVCR1 and ALOX5, reflecting coordinated rewiring of heme and lipid metabolism [102].
Methodological Framework: Spatial Transcriptomics and Computational Integration
Experimental Workflow for Spatial Domain Mapping
The identification of conserved spatial architectures requires standardized experimental and computational workflows. The following diagram illustrates the integrated process for spatial transcriptomics analysis and domain identification:
Multi-Slice Integration with Community-Enhanced Graph Contrastive Learning
The integration of multiple spatial transcriptomics datasets across different platforms and biological conditions presents significant computational challenges due to batch effects and different spatial resolutions. Tacos (mulTiple spAtial transcriptomiCs data integratiOn using community-enhanced graph contraStive learning) represents a state-of-the-art approach that addresses these limitations [103].
Tacos constructs spatial graphs for each slice based on spatial coordinates, then employs a graph contrastive learning-based encoder to extract spatially aware embeddings. The method incorporates two key innovations for handling heterogeneous spatial structures:
- Communal attribute voting: Detects node features more likely to be masked
- Communal edge dropping: Computes edge mask probabilities based on community structure [103]
The model detects mutual nearest neighbor (MNN) pairs between spots from different slices and uses triplet loss to pull positive pairs close while pushing negative pairs apart, effectively aligning slices while preserving biological structures [103]. This approach has demonstrated superior performance in integrating slices from different platforms (e.g., 10x Visium, Slide-seqV2, Stereo-seq) while maintaining specific structural features unique to each dataset [103].
Table 2: Computational Methods for Spatial Transcriptomics Integration
| Method | Core Algorithm | Strengths | Limitations |
|---|---|---|---|
| Tacos [103] | Community-enhanced graph contrastive learning | Handles different resolutions; preserves specific structures | Computational complexity with large datasets |
| STAligner [103] | Graph neural networks | Effective for similar resolutions | Limited with heterogeneous structures |
| SPIRAL [103] | Graph neural network + optimal transport | Good alignment performance | Less effective at preserving annotated layers |
| SpaOTsc [104] | Structured optimal transport | Infers spatial relationships from scRNA-seq | Requires spatial measurements of some genes |
| Harmony [103] | Linear integration | Fast batch correction | Loses spatial relationships |
Spatial Cell-Cell Communication Inference
Understanding signaling relationships between spatial domains is crucial for decoding TME organization. SpaOTsc (Spatial Optimal Transport for single cells) infers spatial and signaling relationships between cells from single-cell transcriptomic data by utilizing spatial measurements of a relatively small number of genes [104].
The method establishes a spatial metric for individual cells in scRNA-seq data based on a map connecting it with spatial measurements, then obtains cell-cell communications by "optimally transporting" signal senders to target signal receivers in space [104]. This approach has been validated for reconstructing spatial cellular dynamics in tissues and predicting spatial gene expression patterns [104].
The Scientist's Toolkit: Essential Research Reagents and Platforms
Table 3: Essential Research Reagents and Platforms for Spatial Architecture Studies
| Category | Specific Tools/Reagents | Function | Considerations |
|---|---|---|---|
| Spatial Technologies | 10x Visium (55μm) [103], Slide-seqV2 (10μm) [103], Stereo-seq (subcellular) [103], seqFISH [9] | Spatial gene expression profiling | Resolution, gene coverage, tissue compatibility |
| Computational Tools | Tacos [103], Spaco [9], SpaOTsc [104], STAligner [103], SPIRAL [103] | Data integration, visualization, analysis | Scalability, resolution handling, batch correction |
| Analysis Frameworks | Seurat [9], Giotto [9], Scanpy [103], Squidpy [9] | General data analysis and visualization | Integration with spatial methods, customization |
| Visualization Tools | Spaco [9] with DOI metric | Spatially-aware colorization | Color contrast, CVD support, perceptual clarity |
| Reference Datasets | Human DLPFC [103], Mouse Olfactory Bulb [103], HCC & Metastases [102] | Benchmarking, validation | Annotation quality, technical variability |
Advanced Visualization with Spaco
Effective visualization of spatial transcriptomics data requires specialized tools that account for spatial relationships between cell types. Spaco (Spatial colorization) introduces the Degree of Interlacement (DOI) metric to construct a weighted graph evaluating spatial relationships among different cell types, refining color assignments to enhance visual clarity [9].
The DOI is computed via a modified spatial k-nearest neighbor network incorporating a dual-outlier-free strategy that excludes both spatially sparse cells and cell types to enhance stability [9]. This approach generates a cluster interlacement graph (CI-graph) that ensures cluster pairs with larger DOIs (more spatial interlacement) are visualized with more distinct colors, significantly improving interpretation of complex tissue architectures, particularly in brain and tumor microenvironments [9].
Therapeutic Implications and Drug Discovery Applications
Targeting Conserved Invasive Programs
The conserved nature of LE transcriptional programs across cancer types suggests they represent fundamental mechanisms of tumor invasion and metastasis that could be targeted therapeutically. In silico modeling of OSCC has identified spatially-regulated patterns of cell development that are predictably associated with drug response [21]. This approach can prioritize compounds that disrupt information flow from TC to LE regions, potentially inhibiting metastatic progression.
The workflow for translating spatial architectural insights into therapeutic discovery is illustrated below:
Metabolic Vulnerabilities Across Spatial Architectures
The discovery of "porphyrin overdrive" as a conserved metabolic program in both HCC and liver metastases highlights how spatial transcriptomics can reveal convergent vulnerabilities despite divergent cellular origins and organizational structures [102]. This shared program of reduced cytochrome P450 expression, enhanced oxidative phosphorylation gene expression, and upregulation of FLVCR1 and ALOX5 reflects coordinated rewiring of heme and lipid metabolism that may be therapeutically exploitable [102].
Targeting this metabolic convergence could yield broad efficacy across different liver tumor types, illustrating how pan-cancer spatial analysis can identify unexpected therapeutic opportunities that transcend classical histopathological classifications.
Spatial transcriptomics has established that solid tumors across different tissues of origin share fundamental organizational principles, particularly the conservation of invasive programs at the leading edge alongside more tissue-specific signatures in the tumor core. This architectural framework provides a new dimension for understanding cancer biology and developing therapeutic strategies.
Future research directions should focus on:
- Multi-omic spatial integration combining transcriptomic, proteomic, and epigenomic data within architectural contexts
- Dynamic spatial modeling to track architectural evolution during progression and treatment
- High-throughput drug screening integrated with spatial readouts to identify compounds that disrupt conserved invasive programs
- Clinical translation of spatial signatures as biomarkers for prognosis and treatment selection
For drug development professionals, these pan-cancer spatial insights offer a roadmap for targeting conserved mechanisms of invasion and metastasis while accounting for tissue-specific contextual factors that may modulate therapeutic response.
Conclusion
Spatial transcriptomics has fundamentally shifted our approach to studying cancer, moving beyond single-cell suspensions to a holistic view of the tumor ecosystem. The key takeaway is that tumor architecture is not random; it is organized into functional spatial domains—such as the conserved leading edge and the tissue-specific tumor core—that dictate disease progression and therapy response. The integration of high-resolution ST platforms with advanced computational methods, particularly AI, is essential to decode this complexity. Future efforts must focus on standardizing analytical pipelines, increasing accessibility, and translating these rich spatial maps into novel therapeutic strategies and biomarkers. The ultimate goal is to usher in an era of spatial pathology, where a deep understanding of cellular neighborhoods directly informs precision oncology and improves patient outcomes.
References
- 1. An introduction to spatial transcriptomics for biomedical research [https://genomemedicine.biomedcentral.com/articles/10.1186/s13073-022-01075-1]
- 2. Exploring tissue architecture using spatial transcriptomics - PMC [https://pmc.ncbi.nlm.nih.gov/articles/PMC8475179/]
- 3. Spatial Biology Takes Center Stage at AACR 2025 [https://brukerspatialbiology.com/spatial-biology-takes-center-stage-at-aacr-2025/]
- 4. Systematic comparison of sequencing-based spatial ... [https://www.nature.com/articles/s41592-024-02325-3]
- 5. A deep learning-based multiscale integration of spatial ... [https://www.nature.com/articles/s41467-025-66691-y]
- 6. STAIG: Spatial transcriptomics analysis via image-aided ... [https://www.nature.com/articles/s41467-025-56276-0]
- 7. spCLUE: a contrastive learning approach to unified spatial ... [https://genomebiology.biomedcentral.com/articles/10.1186/s13059-025-03636-0]
- 8. A comprehensive comparison on cell-type composition ... [https://pmc.ncbi.nlm.nih.gov/articles/PMC9294426/]
- 9. Spaco: A comprehensive tool for coloring spatial data at single ... [https://pmc.ncbi.nlm.nih.gov/articles/PMC10935509/]
- 10. Quantifying and interpreting biologically meaningful spatial ... [https://pmc.ncbi.nlm.nih.gov/articles/PMC11897387/]
- 11. SpaLinker identifies phenotype-associated spatial tumor ... [https://pmc.ncbi.nlm.nih.gov/articles/PMC12278630/]
- 12. Single‐Cell and Spatial Transcriptomics Delineate the Microstructure... [https://pmc.ncbi.nlm.nih.gov/articles/PMC11831447/]
- 13. Statistical analysis of spatial patterns in tumor ... [https://www.nature.com/articles/s41467-025-57943-y]
- 14. Spatially resolved transcriptomics reveals the architecture ... [https://pmc.ncbi.nlm.nih.gov/articles/PMC8560802/]
- 15. Mapping cells in time and space: New tool reveals a detailed history of... [https://news.mit.edu/2025/new-tool-reveals-detailed-history-of-tumor-growth-0730]
- 16. Tumour evolution and microenvironment interactions in 2D ... [https://www.nature.com/articles/s41586-024-08087-4]
- 17. Spatially resolved transcriptomics reveals the architecture ... [https://www.nature.com/articles/s41467-021-26614-z]
- 18. Spatially resolved transcriptomics reveals the architecture of ... [https://pubmed.ncbi.nlm.nih.gov/34725363/]
- 19. From Spatial Patterns to Prognosis: Decoding Single-Cell ... [https://pubmed.ncbi.nlm.nih.gov/40959106/]
- 20. Multiparametric cellular and spatial organization in cancer ... [https://www.nature.com/articles/s41551-025-01475-9]
- 21. Spatial transcriptomics reveals distinct and conserved ... [https://www.nature.com/articles/s41467-023-40271-4]
- 22. Advances in spatial and its applications in cancer... transcriptomics [https://molecular-cancer.biomedcentral.com/articles/10.1186/s12943-024-02040-9]
- 23. Artificial Intelligence–driven spatial transcriptomics in OSCC [https://pmc.ncbi.nlm.nih.gov/articles/PMC12639440/]
- 24. reveals distinct and conserved Spatial core... transcriptomics tumor [https://pubmed.ncbi.nlm.nih.gov/37596273/]
- 25. Spatial profiling technologies for research and clinical ... [https://www.sciencedirect.com/science/article/pii/S2590262825000528]
- 26. Artificial intelligence-enabled spatially resolved transcriptomics ... [https://accscience.com/journal/TD/articles/online_first/1282]
- 27. Spatial transcriptomics in solid tumor studies [https://www.sciencedirect.com/science/article/abs/pii/S0093775425000818]
- 28. Extracellular matrix dynamics in tumor immunoregulation [https://jhoonline.biomedcentral.com/articles/10.1186/s13045-025-01717-y]
- 29. Spatial Correlation of the Extracellular Matrix to Immune ... [https://www.sciencedirect.com/science/article/pii/S0023683725000406]
- 30. Spatial transcriptomics uncovers immune-cell plasticity and ... [https://pmc.ncbi.nlm.nih.gov/articles/PMC12408323/]
- 31. Regional and cell specific bioactivity of injectable ... [https://www.nature.com/articles/s41467-025-65351-5]
- 32. integrative single-cell and spatial RNA sequencing analysis [https://pmc.ncbi.nlm.nih.gov/articles/PMC12589693/]
- 33. Single-cell and spatial transcriptomics integration [https://www.frontiersin.org/journals/immunology/articles/10.3389/fimmu.2025.1649468/full]
- 34. Comparison of imaging based single-cell resolution spatial ... [https://www.nature.com/articles/s41467-025-63414-1]
- 35. A practical guide for choosing an optimal spatial ... [https://bmcgenomics.biomedcentral.com/articles/10.1186/s12864-025-11235-3]
- 36. Sequencing vs. Imaging in Spatial Transcriptomics [https://www.scdiscoveries.com/blog/sequencing-vs-imaging-in-spatial-transcriptomics/]
- 37. Analysis and Visualization of Spatial Transcriptomic Data - PMC [https://pmc.ncbi.nlm.nih.gov/articles/PMC8829434/]
- 38. Visualizing Spatial Transcriptomics: A Guide to Effective Plotting [https://nanostring-biostats.github.io/CosMx-Analysis-Scratch-Space/posts/spatial-plotting/]
- 39. Opportunities and challenges in the application of ... [https://pmc.ncbi.nlm.nih.gov/articles/PMC12568615/]
- 40. Visium Spatial Assays | 10x Genomics [https://www.10xgenomics.com/platforms/visium/product-family]
- 41. STOmics Stereo-seq | Advanced Spatial Multi-omics Technology [https://en.stomics.tech/]
- 42. GeoMx DSP Spatial Genomics Overview [https://nanostring.com/products/geomx-digital-spatial-profiler/geomx-dsp-overview/]
- 43. October 2025 Newsletter [https://brukerspatialbiology.com/october-2025-newsletter/]
- 44. Systematic benchmarking of imaging spatial ... [https://pmc.ncbi.nlm.nih.gov/articles/PMC10723440/]
- 45. Mapping spatial organization and genetic cell-state ... [https://www.nature.com/articles/s41590-024-01943-5]
- 46. Optimizing Xenium In Situ data utility by quality assessment ... [https://www.nature.com/articles/s41592-025-02617-2]
- 47. MERFISH Spatial Transcriptomics [https://vizgen.com/technology/]
- 48. Xenium In Situ Platform [https://www.10xgenomics.com/platforms/xenium]
- 49. Systematic benchmarking of high-throughput subcellular ... [https://www.nature.com/articles/s41467-025-64292-3]
- 50. Single-cell spatial transcriptomics unravels cell states and ... [https://pmc.ncbi.nlm.nih.gov/articles/PMC11907085/]
- 51. Concordance of MERFISH spatial transcriptomics with bulk ... [https://www.life-science-alliance.org/content/6/1/e202201701]
- 52. Current Role and Future Frontiers of Spatial ... [https://pmc.ncbi.nlm.nih.gov/articles/PMC12427188/]
- 53. Spatial Data Analysis of Patient Tumor Samples [https://blog.crownbio.com/spatial-data-analysis-patient-tumor-samples]
- 54. CellSP enables module discovery and visualization for ... [https://www.nature.com/articles/s42003-025-08891-2]
- 55. A comprehensive review of spatial transcriptomics data ... [https://pmc.ncbi.nlm.nih.gov/articles/PMC12199153/]
- 56. From pixels to cell types: a comprehensive review of ... [https://genomicsinform.biomedcentral.com/articles/10.1186/s44342-025-00055-2]
- 57. Immune profiling in oncology: bridging the gap between ... [https://pmc.ncbi.nlm.nih.gov/articles/PMC12380968/]
- 58. Driving innovations in cancer research through spatial ... [https://www.frontiersin.org/journals/immunology/articles/10.3389/fimmu.2025.1589943/full]
- 59. Spatial Metabolomics in Cancer Research: Unlocking the ... [https://www.metwarebio.com/spatial-metabolomics-cancer-research-precision-oncology/]
- 60. Deconvolution of cell types and states in spatial multiomics ... [https://www.nature.com/articles/s41467-025-58874-4]
- 61. Transfer learning of multicellular organization via single - cell and... [https://journals.plos.org/ploscompbiol/article?id=10.1371/journal.pcbi.1012991]
- 62. Scaling up spatial transcriptomics for large-sized tissues [https://www.nature.com/articles/s41592-025-02770-8]
- 63. and Integrating - spatial reveals single ... cell transcriptomics tumor [https://www.nature.com/articles/s41419-024-06598-6?error=cookies_not_supported&code=2c4550b6-1239-45e5-abc4-e5309d158146]
- 64. St. Jude researchers create tool incorporating ... [https://www.stjude.org/media-resources/news-releases/2025-medicine-science-news/st-jude-researchers-create-tool-incorporating-transcriptome-size-to-improve-rna-seq-analysis.html]
- 65. Spatial Transcriptomics Reveals Distinct Architectures but ... [https://pubmed.ncbi.nlm.nih.gov/41097737/]
- 66. Systematic benchmarking of high-throughput subcellular ... [https://pmc.ncbi.nlm.nih.gov/articles/PMC12534522/]
- 67. Protocol for single-cell spatial transcriptomic profiling of ... [https://pmc.ncbi.nlm.nih.gov/articles/PMC12491524/]
- 68. Systematic benchmarking of imaging spatial ... [https://www.nature.com/articles/s41467-025-64990-y]
- 69. Benchmarking of spatial transcriptomics platforms across ... [https://sciforum.net/paper/view/26187]
- 70. SCNT: an R package for data analysis and visualization of ... [https://bmcbioinformatics.biomedcentral.com/articles/10.1186/s12859-025-06209-x]
- 71. standardized benchmarking for multi-omics cancer survival ... [https://pubmed.ncbi.nlm.nih.gov/41031875/]
- 72. A critical spotlight on the paradigms of FFPE-DNA ... [https://pmc.ncbi.nlm.nih.gov/articles/PMC10415133/]
- 73. Fresh and frozen cardiac tissue are comparable in DNA ... [https://www.nature.com/articles/s41598-023-43788-2]
- 74. With Great FFPE Challenges, Comes Novel Research ... [https://www.admerahealth.com/blog/optimizations-for-ffpe-samples]
- 75. Improvements and challenges of tissue preparation for ... [https://www.sciencedirect.com/science/article/pii/S2405844023013403]
- 76. Quantitative Expression Profiling in Formalin-Fixed Paraffin ... [https://pmc.ncbi.nlm.nih.gov/articles/PMC2893624/]
- 77. Fresh frozen vs FFPE samples for next-generation ... [https://www.lexogen.com/blog/fresh-frozen-vs-ffpe-samples-for-next-generation-sequencing-studies/]
- 78. Proteomic comparison between different tissue ... [https://www.nature.com/articles/s41598-021-87003-6]
- 79. Equivalence of protein inventories obtained from ... - PubMed [https://pubmed.ncbi.nlm.nih.gov/19467989/]
- 80. Spatial profiling of chromatin accessibility in formalin-fixed ... [https://www.nature.com/articles/s41467-025-60882-3]
- 81. Computational challenges and opportunities in spatially ... [https://www.nature.com/articles/s41467-021-25557-9]
- 82. Cell segmentation in spatial transcriptomics with BOMS [https://journals.plos.org/plosone/article?id=10.1371/journal.pone.0311458]
- 83. New cell segmentation methods for better spatial ... [https://www.fredhutch.org/en/news/spotlight/2025/10/vidd-jones-natmethods.html]
- 84. Bioinformatics in 2025: Key Innovations and Trends ... [https://bioinformy.com/blog/bioinformatics-in-2025-key-innovations-and-trends]
- 85. AI Feature Extraction: Techniques, Benefits, and Applications [https://flypix.ai/ai-feature-extraction/]
- 86. How is a spatial features extraction done? [https://milvus.io/ai-quick-reference/how-is-a-spatial-features-extraction-done]
- 87. Integrated protein and transcriptome spatial profiling - PMC [https://pmc.ncbi.nlm.nih.gov/articles/PMC10272089/]
- 88. Spatial transcriptomics: a bibliometric analysis with large ... [https://pmc.ncbi.nlm.nih.gov/articles/PMC12554094/]
- 89. How to get the most out of your cancer spatial ... [https://www.sciencedirect.com/science/article/abs/pii/S1084952125000679]
- 90. Comparison of spatial transcriptomics technologies using ... [https://genomebiology.biomedcentral.com/articles/10.1186/s13059-025-03624-4]
- 91. Scalable topic modelling decodes spatial tissue ... [https://www.nature.com/articles/s41467-025-61821-y]
- 92. SpaTopic: A statistical learning framework for exploring tumor ... [https://pmc.ncbi.nlm.nih.gov/articles/PMC11430467/]
- 93. Cell2Spatial is a computational framework that maps single ... [https://journals.plos.org/plosbiology/article?id=10.1371/journal.pbio.3003477]
- 94. A guidebook of spatial transcriptomic technologies, data ... [https://www.sciencedirect.com/science/article/pii/S2001037023000156]
- 95. Rigor and Reproducibility of Spatial Transcriptomics ... [https://www.sciencedirect.com/science/article/abs/pii/S002368372500100X]
- 96. Spatial signatures for predicting immunotherapy outcomes ... [https://www.nature.com/articles/s41588-025-02351-7]
- 97. Spatially informed gene signatures for response to ... [https://pmc.ncbi.nlm.nih.gov/articles/PMC11326985/]
- 98. Single-cell and spatial transcriptomics implicate a ... [https://www.nature.com/articles/s41467-025-65421-8]
- 99. Spatial single cell analysis of tumor microenvironment ... [https://pmc.ncbi.nlm.nih.gov/articles/PMC10317840/]
- 100. Single-cell and spatial transcriptomics analysis of non- ... [https://www.nature.com/articles/s41467-024-48700-8]
- 101. Molecular dynamics simulation and single-cell and spatial ... [https://pubmed.ncbi.nlm.nih.gov/41234880/]
- 102. Spatial Transcriptomics Reveals Distinct Architectures but ... [https://pmc.ncbi.nlm.nih.gov/articles/PMC12523610/]
- 103. Integrating multiple spatial transcriptomics data using ... [https://pmc.ncbi.nlm.nih.gov/articles/PMC11990772/]
- 104. Inferring spatial and signaling relationships between cells ... [https://www.nature.com/articles/s41467-020-15968-5]