dPCR vs qPCR for ctDNA Quantification: A Strategic Guide for Precision Oncology Research
This article provides a comprehensive comparison of digital PCR (dPCR) and quantitative PCR (qPCR) for the analysis of circulating tumor DNA (ctDNA), a critical biomarker in liquid biopsy.
dPCR vs qPCR for ctDNA Quantification: A Strategic Guide for Precision Oncology Research
Abstract
This article provides a comprehensive comparison of digital PCR (dPCR) and quantitative PCR (qPCR) for the analysis of circulating tumor DNA (ctDNA), a critical biomarker in liquid biopsy. Tailored for researchers and drug development professionals, we explore the foundational principles of both technologies, detail their methodological applications in oncology, address key troubleshooting and optimization strategies and weigh their analytical validation and performance. With a focus on clinical utility in areas like minimal residual disease (MRD) monitoring and therapy response assessment, this guide synthesizes current evidence to empower informed, context-driven selection between dPCR and qPCR for advancing precision medicine.
Understanding the Core Technologies: From qPCR Fundamentals to dPCR Partitioning
Quantitative real-time PCR (qPCR) is a cornerstone molecular technique that allows for the detection and quantification of specific nucleic acid sequences as amplification occurs. In clinical and research settings, particularly in circulating tumor DNA (ctDNA) analysis for cancer monitoring, accurately determining the amount of a target gene is paramount [1]. qPCR achieves this through its ability to monitor the amplification process in real-time, unlike conventional PCR which only provides end-point detection. The technology's versatility supports various applications including gene expression analysis, pathogen detection, and genetically modified organism quantification [2] [3]. When compared to digital PCR (dPCR), qPCR remains the more established, cost-effective, and higher-throughput method, though each technology has distinct advantages depending on the application requirements [4] [3]. Understanding the fundamental principles of qPCR quantification—specifically Cycle Threshold (Ct) values and standard curves—is essential for researchers utilizing this technology in precision oncology and molecular diagnostics.
The Fundamental Principle: Ct Values in qPCR
Definition and Relationship to Template Quantity
In qPCR, the Cycle Threshold (Ct) value is a critical quantitative parameter defined as the number of amplification cycles required for the fluorescent signal to cross a predefined threshold [5] [6]. This threshold is set within the exponential phase of amplification, where the reaction components are in excess and amplification efficiency is optimal [6]. The Ct value exhibits an inverse logarithmic relationship with the starting quantity of the target nucleic acid: a lower Ct value indicates a higher initial concentration of the target template, while a higher Ct value signifies a lower initial concentration [7] [5]. This relationship forms the mathematical foundation for qPCR quantification, as each unit decrease in Ct value corresponds to a doubling of the initial target amount in a perfectly efficient reaction.
The Amplification Curve and Fluorescence Threshold
The qPCR process generates an amplification curve that plots fluorescence against cycle number, typically showing three distinct phases: baseline (initial cycles), exponential (logarithmic increase), and plateau (reaction saturation) [5] [6]. The fluorescence threshold is strategically set within the exponential phase where the signal significantly distinguishes itself from background noise [6]. This phase provides the most reliable data because minor errors have not yet been amplified substantially, ensuring excellent Ct value reproducibility for the same template across different runs or reaction tubes [5]. Proper threshold placement is crucial for accurate quantification, as setting it too low increases variability due to poor signal-to-noise ratio, while setting it too high risks entering the non-exponential phase where precision deteriorates [6].
Optimal Ct Value Range and Factors Affecting Ct
The reasonable range for Ct values in qPCR experiments typically falls between 15 and 35 cycles [5]. Values below 15 often indicate very high template concentrations that may not have reached the fluorescence threshold during the baseline phase, while values exceeding 35 suggest very low initial template quantities where the copy number may be less than one, making results statistically insignificant [5]. Several factors can influence Ct values, including template concentration, amplification efficiency, presence of PCR inhibitors, primer design quality, reaction conditions, and reagent performance [5]. Abnormal Ct values (too high or too low) often indicate issues with template quality, reaction inhibitors, or suboptimal amplification efficiency that require troubleshooting through template re-preparation, primer redesign, or reaction optimization [5].
The Quantification Framework: Standard Curves in qPCR
Construction and Interpretation
The standard curve is an essential component of qPCR quantification that enables the conversion of Ct values into meaningful quantitative data. To construct a standard curve, a sample with a known concentration of the target nucleic acid is serially diluted (typically 10-fold or 3-fold dilutions) and run alongside the test samples [7]. The Ct values obtained from these dilutions are plotted against the logarithm of their known concentrations, creating a linear relationship within the assay's quantifiable range [7]. The resulting standard curve follows the equation y = mx + b, where y represents the Ct value, m is the slope of the curve, x is the log of the concentration, and b is the y-intercept [7]. This calibration model allows researchers to determine unknown sample concentrations by applying their Ct values to the standard curve equation.
Assessing Assay Performance: Efficiency and Linearity
The standard curve provides critical information about qPCR assay performance through two key parameters: amplification efficiency and linearity. Amplification efficiency (E) calculated using the formula E = [(10^(-1/m)) - 1] × 100, where m is the slope of the standard curve, indicates the rate at which the target is amplified during each cycle [7]. Ideal qPCR assays have efficiencies between 90-110%, corresponding to slopes between -3.6 and -3.3 [7]. Linearity, measured by the coefficient of determination (R²), reflects how well the data points fit the regression line, with R² > 0.99 considered ideal [7]. These parameters are crucial for validating assay robustness, as deviations may indicate issues with reaction inhibitors, suboptimal primer design, or problems with sample quality that could compromise quantification accuracy.
Comparative Performance Data: qPCR vs. dPCR
Analytical Performance Metrics
The selection between qPCR and dPCR requires careful consideration of their analytical capabilities. The following table summarizes key performance characteristics based on comparative studies:
Table 1: Performance comparison between qPCR and dPCR
| Parameter | qPCR | dPCR | Experimental Support |
|---|---|---|---|
| Quantification Method | Relative (requires standard curve) | Absolute (direct counting) | [4] [3] |
| Sensitivity | High but limited for rare targets; false negatives at <3 log10Geq/mL | Superior for low bacterial loads; detects low-abundance targets | [8] |
| Precision | Higher intra-assay variability (median CV% >4.5%) | Lower intra-assay variability (median CV%: 4.5%) | [8] |
| Dynamic Range | Wide (6-7 orders of magnitude) | Narrower dynamic range | [3] |
| Impact of Inhibitors | Sensitive to PCR inhibitors | More resistant due to partitioning | [3] |
| Throughput | High (96- or 384-well plates) | Lower throughput | [3] |
| Cost per Reaction | $1-3 | $5-10 | [3] |
Experimental Evidence in Clinical Applications
Recent studies directly comparing qPCR and dPCR performance demonstrate meaningful differences in clinical scenarios. A 2025 study comparing multiplex dPCR and qPCR for detecting periodontal pathobionts found dPCR showed superior sensitivity, particularly for low bacterial loads of Porphyromonas gingivalis and Aggregatibacter actinomycetemcomitans [8]. The Bland-Altman plots from this study highlighted good agreement at medium/high loads but significant discrepancies at low concentrations (<3 log10Geq/mL), resulting in qPCR false negatives and a 5-fold underestimation of A. actinomycetemcomitans prevalence in periodontitis patients [8]. This enhanced sensitivity makes dPCR particularly valuable for ctDNA analysis in early-stage cancers where ctDNA can represent less than 0.1% of total cell-free DNA [1].
In ctDNA monitoring for cancer, dPCR platforms have demonstrated exceptional precision for detecting rare mutations. A 2025 study comparing QX200 droplet digital PCR and QIAcuity One nanoplate digital PCR found coefficient of variation (CV) values below 5% for both systems when optimized, significantly lower than typical qPCR performance for low-abundance targets [9]. This precision is critical for monitoring treatment response through ctDNA dynamics, where small changes in variant allele frequency can indicate emerging resistance or treatment efficacy [1].
Experimental Protocols for qPCR-dPCR Comparison Studies
Sample Processing and Nucleic Acid Extraction
For comparative studies of qPCR and dPCR performance, consistent sample processing is essential. In protocol designs from recent literature, subgingival plaque samples are collected using absorbent paper points inserted into periodontal pockets for 10 seconds and pooled into sample tubes containing 1 mL of reduced transport fluid (RTF) with 10% glycerol, followed by immediate storage at -20°C [8]. DNA extraction typically employs commercial kits such as the QIAamp DNA Mini kit (Qiagen) following manufacturer's instructions [8]. For ctDNA analysis from blood samples, collection in cell-stabilizing tubes followed by plasma separation within hours and cfDNA extraction using specialized kits is recommended to prevent background DNA release from blood cells [1]. The quality and quantity of extracted DNA should be verified using spectrophotometric or fluorometric methods before PCR analysis.
qPCR Assay Protocol and Conditions
Standard qPCR protocols utilize reaction mixtures containing DNA polymerase, dNTPs, MgCl2, forward and reverse primers, and fluorescent probes (such as TaqMan probes) in optimized buffer conditions [8] [2]. A typical thermal cycling protocol includes: initial DNA denaturation and enzyme activation at 95°C for 2 minutes; followed by 45 amplification cycles of 15 seconds at 95°C and 1 minute at 58°C [8]. Fluorescence measurements are taken at the end of each annealing/extension phase. Each run should include negative controls (no template) and positive controls (known standards for standard curve generation). For quantitative analysis, standard curves are prepared using serial dilutions of reference material with known concentrations, ideally spanning 6 orders of magnitude to validate the dynamic range [7].
dPCR Assay Protocol and Partitioning
Digital PCR protocols differ primarily in the partitioning step. For nanoplate-based dPCR systems like QIAcuity, reaction mixtures are similar to qPCR but include a restriction enzyme (e.g., Anza 52 PvuII at 0.025 U/μL) and are partitioned into approximately 26,000 partitions using automated microfluidic systems [8]. The thermal cycling conditions may mirror those used in qPCR (e.g., 2 min at 95°C, followed by 45 cycles of 15 s at 95°C and 1 min at 58°C) [8]. Following amplification, endpoint fluorescence imaging is performed using channel-specific settings (e.g., green channel for one target, yellow for another, crimson for a third in multiplex assays) [8]. Data analysis using Poisson statistics is automatically performed by instrument software to calculate absolute target concentrations without standard curves. For samples with high target concentrations, pre-dilution may be necessary to avoid saturation [8].
The Scientist's Toolkit: Essential Research Reagents and Materials
Table 2: Essential reagents and materials for qPCR/dPCR comparative studies
| Item | Function | Example Products/Details |
|---|---|---|
| Nucleic Acid Extraction Kit | Isolation of high-quality DNA from samples | QIAamp DNA Mini Kit (Qiagen) [8] |
| qPCR Master Mix | Provides essential components for amplification | Contains DNA polymerase, dNTPs, MgCl2, buffer [2] |
| dPCR Master Mix | Optimized for partitioning and endpoint detection | QIAcuity Probe PCR Kit (Qiagen) [8] |
| Hydrolysis Probes | Sequence-specific detection with fluorescent reporters | TaqMan probes with FAM, HEX, etc. [8] [6] |
| Primer Pairs | Target-specific amplification | Custom designed, ~20 bp, optimized concentrations [8] |
| Restriction Enzymes | Enhance target accessibility in dPCR | Anza 52 PvuII, HaeIII, EcoRI [8] [9] |
| Standard Reference Material | For standard curve generation in qPCR | Synthetic oligonucleotides, purified DNA [8] [9] |
| dPCR Plates/Chips | Microfluidic devices for partitioning | QIAcuity Nanoplate 26k [8], QX200 droplet generator [9] |
| Quality Control Assays | Verify DNA quality and quantity | Fluorometric quantification (Qubit), spectrophotometry (NanoDrop) |
The principles of real-time quantification in qPCR through Ct values and standard curves represent a foundational methodology in molecular diagnostics and research. While qPCR provides robust, cost-effective quantification suitable for a wide range of applications, dPCR offers advantages in absolute quantification, sensitivity for rare targets, and precision at low concentrations—attributes particularly valuable in ctDNA research for oncology [1]. The choice between these technologies should be guided by specific application requirements, with qPCR remaining ideal for high-throughput workflows where relative quantification suffices, and dPCR excelling when absolute quantification, detection of rare mutations, or superior precision at low target concentrations is necessary [4] [3]. As precision medicine advances, particularly in liquid biopsy applications, understanding these complementary technologies enables researchers to select the optimal approach for their specific experimental and clinical questions.
Digital PCR (dPCR) represents a fundamental shift in nucleic acid quantification, moving from the relative measurements of quantitative PCR (qPCR) to a system of absolute quantification through physical partitioning and statistical analysis. This third-generation PCR technology partitions a sample into thousands to millions of individual reactions, effectively creating a digital assay where each partition acts as a separate PCR microreactor. Following end-point amplification, the fraction of positive partitions is counted, and Poisson statistics are applied to calculate the absolute concentration of the target molecule without requiring standard curves [10]. This core paradigm offers transformative advantages for circulating tumor DNA (ctDNA) quantification in oncology research, where detecting rare mutations against a high background of wild-type DNA demands exceptional sensitivity and precision.
The clinical relevance of this approach is particularly evident in cancer research, where dPCR enables absolute quantification of low-abundance targets and provides superior sensitivity for rare allele detection. As ctDNA analysis becomes increasingly crucial for non-invasive tumor monitoring and treatment response assessment, dPCR's ability to provide precise molecular measurements positions it as an indispensable tool in precision oncology [11] [12]. The technology's partitioning-based methodology naturally dilutes background DNA, enhancing the detection of rare mutant alleles in complex biological samples like blood—a critical advantage for liquid biopsy applications that aim to capture the molecular heterogeneity of tumors through a simple blood draw.
Performance Comparison: dPCR vs. qPCR and NGS
Analytical Performance Metrics
Direct comparisons between dPCR, qPCR, and next-generation sequencing (NGS) reveal distinct performance profiles that inform their optimal applications in ctDNA research. The partitioning principle of dPCR fundamentally enhances its sensitivity and precision for low-abundance targets compared to bulk reaction methods.
Table 1: Comparative Performance of dPCR, qPCR, and NGS in ctDNA Analysis
| Parameter | dPCR | qPCR | NGS |
|---|---|---|---|
| Quantification Method | Absolute (without standard curves) | Relative (requires standard curves) | Semi-quantitative (Variant Allelic Fraction) |
| Sensitivity | High (detects rare mutations down to <0.2% VAF) [12] | Moderate (limited by background and inhibitors) [8] | Variable (depends on sequencing depth) |
| Precision | High (low intra-assay variability) [8] [9] | Moderate to low (higher CV%) [8] | Moderate |
| Dynamic Range | Limited by partition number | Wide | Very wide |
| Multiplexing Capacity | Moderate (3-5 targets simultaneously) [13] | Limited (2-3 targets) | High (hundreds to thousands of targets) |
| Throughput | Moderate | High | High to very high |
| Cost per Sample | Moderate | Low | High |
| Best Applications | Rare mutation detection, absolute quantification, low-abundance targets [4] [14] | Gene expression, pathogen detection, high-throughput screening [4] [14] | Comprehensive profiling, novel mutation discovery, multi-gene analysis [11] |
In a direct performance comparison for periodontal pathogen detection, dPCR demonstrated significantly lower intra-assay variability (median CV%: 4.5%) compared to qPCR, alongside superior sensitivity for detecting low bacterial loads [8]. This enhanced precision makes dPCR particularly valuable for longitudinal monitoring of tumor dynamics, where small changes in ctDNA concentration can signify treatment response or emerging resistance.
Clinical Study Data in ctDNA Analysis
Recent clinical studies specifically highlight dPCR's performance in real-world ctDNA applications. In a 2025 study comparing dPCR and NGS for ctDNA detection in non-metastatic rectal cancer, dPCR demonstrated significantly higher detection rates (58.5%) compared to NGS panels (36.6%) in baseline plasma samples from the same patient cohort (p = 0.00075) [15]. This enhanced detection capability directly translates to improved clinical utility, as positive ctDNA results correlated with established prognostic indicators including higher clinical tumor stage and lymph node positivity identified by MRI.
For respiratory virus quantification, a 2025 study demonstrated dPCR's superior accuracy and consistency compared to real-time RT-PCR, particularly for samples with medium to high viral loads [13]. This performance advantage extends to ctDNA analysis, where dPCR's precision enables reliable detection of minimal residual disease and early molecular recurrence—often months before radiographic evidence of relapse [12].
Table 2: Platform-Specific Performance Characteristics in dPCR Systems
| Platform | Partitioning Method | Partition Number | Reaction Volume | Key Advantages | Reported Applications |
|---|---|---|---|---|---|
| QX200 ddPCR (Bio-Rad) | Droplet-based | ~20,000 | 20μL | Established protocol, high sensitivity | HIV reservoir quantification [16] |
| QIAcuity (Qiagen) | Nanoplate-based | ~26,000 | 40μL | Automated workflow, reduced hands-on time | Respiratory virus detection [13], periodontal pathogens [8] |
| Absolute Q (Thermo Fisher) | Microfluidic chamber array | ~24,000 | 25μL | Fully integrated system | HIV DNA quantification [16] |
| Naica (Stilla Technologies) | Droplet-based | ~30,000 | 25μL | Crystal digital PCR technology | Quantification standards validation [11] |
A 2025 cross-platform comparison study found that both nanoplate-based and droplet-based dPCR systems demonstrated similar detection and quantification limits with high precision across most analyses, though precision was influenced by experimental factors such as restriction enzyme selection [9].
Experimental Protocols and Methodologies
Core dPCR Workflow for ctDNA Analysis
The fundamental dPCR methodology follows a standardized workflow that applies across various platforms and applications. The process begins with sample preparation, where cell-free DNA is extracted from plasma samples using specialized kits designed to recover short cfDNA fragments. For ctDNA analysis, blood collection tubes with preservatives are recommended to prevent genomic DNA contamination and maintain nucleic acid integrity [11]. Following extraction, the DNA sample is mixed with PCR reagents including primers, probes, master mix, and restriction enzymes when required.
The critical partitioning step occurs next, where the reaction mixture is divided into thousands of individual reactions using either droplet generation or microfluidic chamber arrays. For the QIAcuity nanoplate system, this process creates approximately 26,000 partitions [8] [13], while droplet-based systems like the QX200 generate around 20,000 droplets [9]. The partitioned samples then undergo end-point PCR amplification with optimized thermal cycling conditions to ensure efficient target amplification within individual partitions.
Following amplification, fluorescence detection identifies positive and negative partitions. For multiplex assays, different fluorescent probes (FAM, HEX, VIC) distinguish multiple targets within the same reaction [13] [16]. Finally, Poisson statistical analysis converts the ratio of positive to negative partitions into an absolute concentration of target molecules, typically expressed as copies per microliter of input sample [10].
Representative Experimental Protocols
ctDNA Detection in Rectal Cancer
A 2025 study provides a representative protocol for dPCR-based ctDNA analysis in localized rectal cancer [15]. The researchers collected pre-therapy plasma and tumor samples from 41 patients in a development group and 26 in a validation cohort. Tumor mutations were first identified using NGS panel sequencing, then patient-specific ddPCR assays were designed to target these mutations in plasma cfDNA. The ddPCR reactions utilized EBF1 as a reference gene for normalization, with ctDNA levels expressed as mutant fragment concentration per milliliter of plasma. This approach successfully detected ctDNA in 58.5% of baseline plasma samples, outperforming NGS-based detection (36.6%), and demonstrated association with higher clinical tumor stage and lymph node positivity.
Quantitative NGS with dPCR Validation
A novel quantitative NGS (qNGS) method developed for absolute quantification of nucleotide variants in ctDNA incorporates dPCR for assay validation [11]. The protocol involves spiking synthetic quantification standards (QSs) with known concentrations into plasma samples before cfDNA extraction. These QSs are short synthetic DNA sequences (190 bp) designed to mimic native cfDNA fragments but containing characteristic mutations for unique identification. The absolute quantification of each QS is performed using dPCR assays on a Naica dPCR system with universal primers and probes. This dPCR-validated qNGS approach demonstrated strong linearity and high correlation with dPCR in clinical samples from non-small cell lung cancer patients, enabling simultaneous quantification of multiple variants from a single plasma sample.
HIV Reservoir Quantification
While not directly related to ctDNA, a 2025 HIV reservoir quantification study exemplifies dPCR protocol optimization for rare target detection [16]. The researchers developed a duplex pdPCR assay targeting the HIV LTR region and human RPP30 gene as a reference on the Absolute Q dPCR system. Through systematic optimization of denaturation time, annealing temperature, and primer concentrations, they established a protocol with high linearity (R² = 0.977) and sensitivity (LLOD 95%: 79.7 HIV DNA copies/10⁶ cells). The assay successfully quantified total HIV DNA in clinical samples from ART-treated persons with HIV, demonstrating dPCR's capability for precise rare target quantification in complex biological samples.
Essential Research Reagent Solutions
Successful implementation of dPCR for ctDNA quantification requires carefully selected reagents and materials optimized for the partitioning-based workflow. The following table details key research reagent solutions and their specific functions in the experimental pipeline.
Table 3: Essential Research Reagent Solutions for dPCR-based ctDNA Analysis
| Reagent/Material | Function | Application Notes |
|---|---|---|
| cfDNA Extraction Kits (e.g., QIAamp DNA Mini kit [8]) | Isolation and purification of cell-free DNA from plasma | Optimized for short fragment recovery; critical for ctDNA yield |
| dPCR Master Mixes (e.g., QIAcuity Probe PCR Kit [8]) | Provides enzymes, dNTPs, and buffer for amplification | Formulated for partition stability and efficient amplification |
| Restriction Enzymes (e.g., Anza 52 PvuII [8], HaeIII, EcoRI [9]) | Digest longer DNA fragments to prevent partitioning bias | Enhances precision; enzyme selection affects assay performance [9] |
| Hydrolysis Probes (FAM, HEX, VIC-labeled) [13] [16] | Sequence-specific detection with different fluorophores | Enable multiplex detection; require optimization of concentration |
| Quantification Standards (QSs) [11] | Synthetic DNA fragments for absolute quantification | Spiked before extraction to correct for procedural losses |
| Reference Gene Assays (e.g., EBF1 [15], RPP30 [16]) | Normalization controls for sample input variation | Essential for normalizing technical variability between samples |
The selection of appropriate restriction enzymes deserves particular attention, as demonstrated in a 2025 study that found HaeIII significantly improved precision compared to EcoRI, especially for the QX200 droplet-based system [9]. This effect highlights how reagent optimization directly impacts data quality in dPCR applications.
Technological Implementation and Workflow Integration
dPCR Platform Selection Considerations
The expanding landscape of commercial dPCR platforms offers researchers multiple options with distinct technological approaches and implementation requirements. The historical development of these systems has progressed from early microtiter plate-based methods to sophisticated integrated instruments featuring automated partitioning and analysis [10]. Current commercial platforms primarily utilize either droplet-based partitioning (ddPCR) or microchamber-based arrays (pdPCR), each with characteristic advantages.
Droplet-based systems generate thousands of nanoliter-sized water-in-oil droplets using microfluidic circuits, requiring careful surfactant optimization to prevent coalescence during thermal cycling [10]. In contrast, microchamber-based systems employ fixed nanowells patterned onto chips, providing more consistent partition numbers and simplified workflow integration [13] [16]. When selecting a platform for ctDNA research, key considerations include partition density, multiplexing capacity, throughput requirements, and integration with existing laboratory workflows.
Recent technological advances have addressed initial limitations in dPCR multiplexing capacity through approaches such as melt-curve analysis and multi-channel fluorescence detection. A 2025 study demonstrated that combining dPCR with melting-curve analysis improved ctDNA detection efficiency, lowering the limit of detection to below 0.2% variant allele frequency for KRAS mutations in pancreatic cancer [12]. These developments expand dPCR's utility in complex clinical scenarios where simultaneous monitoring of multiple mutations provides a more comprehensive assessment of tumor dynamics and therapeutic resistance.
Integrated Analysis Strategy for ctDNA Research
For comprehensive ctDNA analysis in cancer research, dPCR functions most effectively as part of an integrated analytical strategy that leverages complementary technologies. The following diagram illustrates this integrated approach, highlighting how dPCR complements other molecular analysis methods in a complete ctDNA research workflow.
This integrated approach begins with NGS-based discovery to identify tumor-specific mutations, transitions to dPCR for validated targets requiring sensitive quantification and longitudinal monitoring, and incorporates emerging quantitative NGS methods for multiplexed absolute quantification [15] [11]. Each technology contributes unique capabilities to a comprehensive ctDNA research pipeline, with dPCR serving as the gold standard for sensitive tracking of known variants over time.
The implementation of appropriate data normalization strategies remains critical for reliable ctDNA quantification. Both reference genes and synthetic quantification standards provide effective normalization approaches, with QSs offering the advantage of correcting for extraction efficiency and procedural losses [11]. As dPCR technology continues to evolve toward higher multiplexing capacities and streamlined workflows, its integration into complementary analytical frameworks will further enhance its utility in cancer research and drug development.
Circulating tumor DNA (ctDNA) refers to small fragments of DNA shed from tumor cells into the bloodstream, representing a fraction of the total cell-free DNA (cfDNA). These fragments carry tumor-specific genetic alterations and have a short half-life of approximately 2 hours, enabling real-time monitoring of tumor dynamics [17]. The analysis of ctDNA, known as liquid biopsy, has emerged as a revolutionary non-invasive approach in oncology, complementing and in some cases replacing traditional tissue biopsies [18]. Liquid biopsy overcomes the limitations of tissue biopsies, including invasiveness, sampling bias, and inability to repeatedly assess tumor heterogeneity and evolution over time [19].
The clinical utility of ctDNA spans the entire cancer care continuum, from early detection and diagnosis to monitoring treatment response and detecting minimal residual disease (MRD) – trace amounts of cancer cells that remain after treatment and can lead to recurrence [17] [18]. The global ctDNA market size, calculated at USD 7.96 billion in 2025 and predicted to reach approximately USD 27.67 billion by 2034, reflects the growing importance of this biomarker in precision oncology [18].
ctDNA Analysis Technologies: dPCR vs. qPCR
Technology Principles and Workflows
Quantitative PCR (qPCR), also known as real-time PCR, amplifies DNA and monitors amplification in real-time using fluorescent dyes or probes. The accumulation of fluorescence is directly proportional to the amount of amplified product, with quantification based on the cycle threshold (Ct) at which fluorescence crosses a predefined level. qPCR relies on standard curves from samples of known concentration for relative quantification [20] [3].
Digital PCR (dPCR), represents the third generation of PCR technology. It partitions a sample into thousands of individual reactions, each containing zero, one, or a few target DNA molecules. After PCR amplification, the presence or absence of fluorescence in each partition is counted to provide absolute quantification without needing standard curves [3] [10]. The partitioning process can be achieved through water-in-oil droplet emulsification (droplet digital PCR or ddPCR) or microchambers embedded in a solid chip [10].
Table 1: Fundamental Differences Between qPCR and dPCR Technologies
| Feature | Real-Time PCR (qPCR) | Digital PCR (dPCR) |
|---|---|---|
| Quantification Method | Relative (requires standard curve) | Absolute (direct molecule counting) |
| Sensitivity | High, but limited for rare targets | Excellent for rare targets (as low as 0.001%) |
| Precision & Reproducibility | Good, affected by PCR efficiency variations | Excellent, due to absolute quantification |
| Dynamic Range | 7-10 logs | 5 logs |
| Throughput | High (96- or 384-well plates) | Moderate (limited by partitioning capacity) |
| Cost | Lower instrument and reagent costs | Higher instrument and reagent costs |
| Robustness to Inhibitors | Sensitive to inhibitors | Resistant to inhibitors due to partitioning |
| Data Analysis Complexity | Requires normalization and standard curves | More straightforward absolute quantification |
Experimental Protocols for ctDNA Analysis
qPCR Protocol for ctDNA Detection:
- DNA Extraction: Isolate cfDNA from 3-10 mL plasma using specialized kits (e.g., QIAamp DNA Mini kit)
- Assay Design: Design hydrolysis probes (TaqMan) targeting specific mutations
- Reaction Setup: Prepare 20-50 μL reactions containing master mix, primers, probes, and template DNA
- Amplification: Run on qPCR instrument with thermal cycling: initial denaturation (95°C for 2 min), followed by 45 cycles of denaturation (95°C for 15 sec) and annealing/extension (60°C for 1 min)
- Analysis: Calculate concentration based on Ct values compared to standard curve [8] [20]
dPCR Protocol for ctDNA Detection:
- DNA Extraction: Isolate cfDNA from plasma samples
- Partitioning: Divide PCR mixture into approximately 26,000 partitions using nanoplate-based systems or droplet generators
- Amplification: Thermal cycling with conditions similar to qPCR (e.g., 45 cycles of 95°C for 15 sec and 58°C for 1 min)
- Imaging: Analyze each partition using multi-channel fluorescence detection
- Quantification: Calculate absolute concentration based on Poisson statistics using positive and negative partition counts [8] [10]
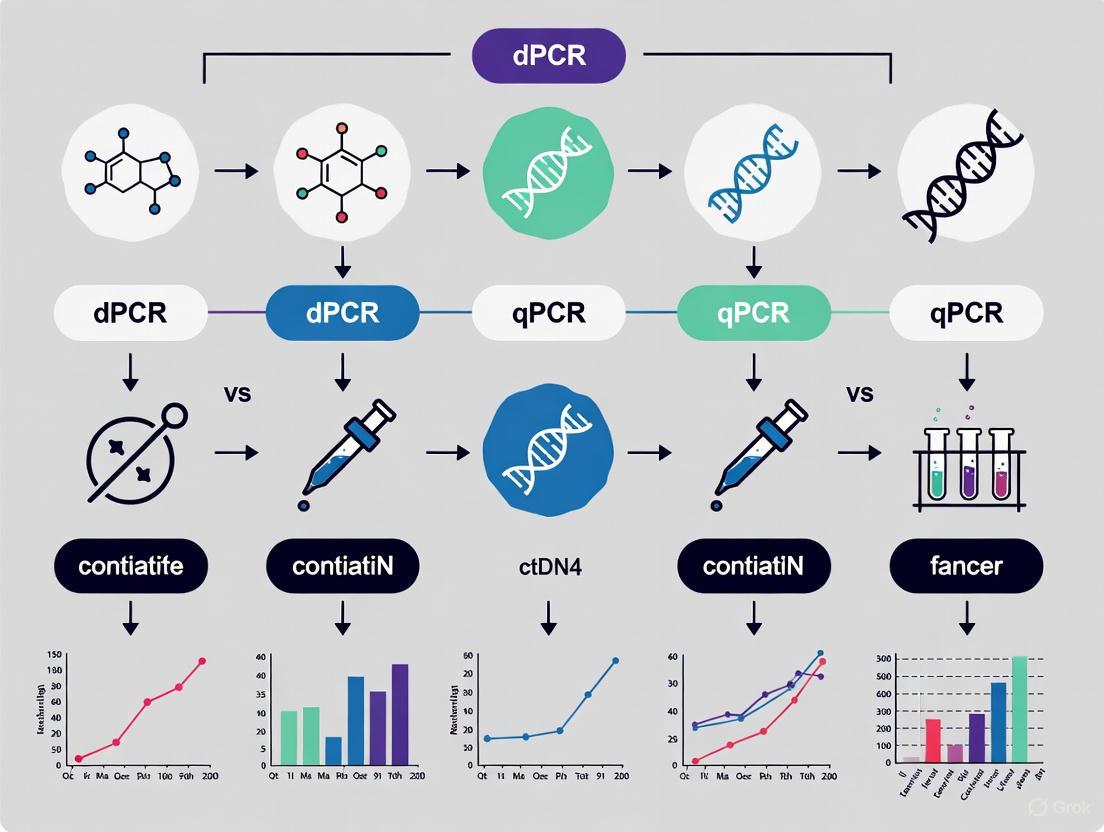
Figure 1: ctDNA Analysis Workflow: From Blood Draw to Clinical Application
Performance Comparison: Experimental Data
Sensitivity and Detection Limits
Multiple studies have directly compared the sensitivity of dPCR and qPCR for ctDNA detection. In a 2025 study comparing ddPCR and next-generation sequencing (NGS) for ctDNA detection in localized rectal cancer, ddPCR demonstrated significantly higher detection rates. In the development group (n=41), ddPCR detected ctDNA in 24/41 (58.5%) patients compared to only 15/41 (36.6%) with NGS (p = 0.00075) [21] [15].
A 2025 study on periodontal pathobionts detection, while not on ctDNA, provides relevant performance data on dPCR versus qPCR. The dPCR assay showed high linearity (R² > 0.99) and significantly lower intra-assay variability (median CV%: 4.5%) than qPCR, with superior sensitivity for detecting low bacterial loads [8]. This enhanced sensitivity at low concentrations is directly relevant to ctDNA detection, where targets are often scarce.
Table 2: Performance Comparison of dPCR vs. qPCR in Clinical Studies
| Performance Metric | dPCR Performance | qPCR Performance | Clinical Context |
|---|---|---|---|
| Detection Rate | 58.5% (24/41 patients) | 36.6% (15/41 patients) | Rectal cancer baseline plasma [21] |
| Detection Sensitivity | Can detect rare mutations with frequencies as low as 0.001% [20] | Limited for rare targets (<1%) [3] | Rare mutation detection |
| Precision (Variability) | Median CV%: 4.5% [8] | Higher variability than dPCR [8] | Analytical precision |
| Impact on Prevalence | 5-fold higher detection of A. actinomycetemcomitans [8] | Significant false negatives at low concentrations [8] | Periodontal pathobionts (concept applicable to ctDNA) |
| Agreement at Low Concentration | Good agreement at medium/high loads, superior at low concentrations (<3 log₁₀Geq/mL) [8] | Discrepancies at low concentrations, resulting in false negatives [8] | Quantitative accuracy |
Quantitative Accuracy and Precision
The Bland-Altman plots from the periodontal study highlighted good agreement between dPCR and qPCR at medium/high bacterial loads but significant discrepancies at low concentrations (<3 log₁₀Geq/mL), resulting in qPCR false negatives [8]. This finding is particularly relevant to ctDNA analysis, where target molecules are often at low concentrations, especially in early-stage cancers or MRD detection.
dPCR's absolute quantification capability eliminates variability introduced by standard curve preparation in qPCR, delivering higher precision particularly in applications requiring detection of rare mutations and low viral loads [3]. The partitioning approach also reduces the impact of PCR inhibitors commonly found in clinical samples, making dPCR more robust for complex samples [3].
Clinical Applications and Utility
Prognostic and Predictive Value
ctDNA analysis has demonstrated significant prognostic value across multiple cancer types. A 2025 systematic review and meta-analysis involving 64 studies and 5,652 patients with non-resectable pancreatic ductal adenocarcinoma (PDAC) found that high baseline ctDNA levels predicted shorter overall survival (HR=2.3, 95% CI 1.9-2.8) and progression-free survival (HR=2.1, 95% CI 1.8-2.4) [22].
In diffuse large B-cell lymphoma (DLBCL), a 2025 systematic review of 53 studies showed that high baseline ctDNA concentration was associated with increased progression risk (HR: 2.50, 95% CI 2.15-2.9). The prognostic power intensified during treatment, with end-of-treatment positivity showing the strongest association with progression (HR: 13.69, 8.37-22.39) [19].
Minimal Residual Disease (MRD) Detection
MRD detection represents one of the most promising applications of ctDNA analysis. The VICTORI study presented at the 2025 American Association for Cancer Research Annual Meeting demonstrated that liquid biopsy using ctDNA could detect colorectal cancer recurrence up to 416 days earlier than conventional imaging [18].
In the context of MRD detection, dPCR's enhanced sensitivity for low-abundance targets makes it particularly valuable. The ability to detect ctDNA signals at variant allele frequencies as low as 0.001% enables identification of molecular relapse long before clinical or radiographic recurrence [20] [3].
Figure 2: Clinical Applications of ctDNA Analysis and Technology Recommendations
The Scientist's Toolkit: Research Reagent Solutions
Table 3: Essential Research Reagents for ctDNA Analysis
| Reagent/Kit | Function | Application Notes |
|---|---|---|
| cfDNA Extraction Kits (QIAamp DNA Mini kit) | Isolation of cell-free DNA from plasma | Critical for obtaining high-quality, uncontaminated cfDNA [8] |
| dPCR Master Mixes (QIAcuity Probe PCR Kit) | Provides enzymes, dNTPs, buffers for amplification | Optimized for partitioning-based PCR [8] |
| Hydrolysis Probes (TaqMan) | Sequence-specific detection | Double-quenched probes improve signal-to-noise ratio [8] |
| Restriction Enzymes (Anza 52 PvuII) | DNA digestion to improve amplification | Enhances target accessibility in complex samples [8] |
| Partitioning Oil/Stabilizers | Creation and stabilization of droplets/chambers | Essential for maintaining partition integrity during thermal cycling [10] |
| Reference Standards | Quantification controls and standards | Certified reference materials for assay validation |
The critical role of ctDNA in modern oncology continues to expand, with applications spanning from early cancer detection to MRD monitoring. The choice between dPCR and qPCR technologies depends on specific research and clinical needs. qPCR remains the workhorse for high-throughput, cost-effective applications where relative quantification suffices, while dPCR provides superior sensitivity, absolute quantification, and robustness for detecting low-abundance targets in complex samples like ctDNA.
As ctDNA analysis becomes increasingly integrated into clinical practice, dPCR's ability to provide precise, reproducible quantification of rare mutations positions it as an essential technology for advancing liquid biopsy applications, particularly in minimal residual disease detection and personalized cancer monitoring. Future developments in standardization and validation of ctDNA assays will further solidify its role in precision oncology.
The quantification of nucleic acids has been a cornerstone of molecular biology and precision medicine. For years, quantitative PCR (qPCR) served as the gold standard for nucleic acid detection. However, the emerging needs of precision oncology, particularly the requirement to detect minute amounts of circulating tumor DNA (ctDNA), have revealed its limitations. This drove the evolution toward digital PCR (dPCR) technologies, which provide the absolute quantification and sensitivity required for modern liquid biopsy applications. This guide traces the historical context of this technological shift, objectively comparing the performance of these platforms within ctDNA research.
Understanding the Technological Evolution: From qPCR to dPCR
Quantitative PCR (qPCR): The Established Workhorse
qPCR, also known as real-time PCR, operates on the principle of monitoring the amplification of DNA in real-time using fluorescent reporters [20]. The key metric is the cycle threshold (Ct), which represents the amplification cycle at which the fluorescence crosses a predefined threshold. The Ct value is inversely proportional to the initial amount of the target nucleic acid [20]. Quantification relies on comparing the Ct values of unknown samples to a standard curve generated from samples with known concentrations [20]. While qPCR is a powerful, high-throughput tool for relative quantification, its dependence on a standard curve and its susceptibility to amplification efficiency variations can limit its precision and accuracy, especially for low-abundance targets [20].
Digital PCR (dPCR): A Paradigm Shift in Quantification
dPCR represents a fundamental departure from qPCR's methodology. It involves partitioning a single PCR reaction into thousands to millions of individual reactions [20] [8]. These partitions are then amplified to endpoint and read individually as positive (containing the target) or negative (not containing the target) [20]. The absolute concentration of the target molecule is then calculated directly using Poisson statistics, without the need for a standard curve [20] [23]. This partitioning step is the key to dPCR's enhanced performance, as it effectively dilutes the sample background, reduces competition between targets, and allows for the precise counting of individual DNA molecules [8].
Table 1: Core Principles of qPCR vs. dPCR
| Feature | Quantitative PCR (qPCR) | Digital PCR (dPCR) |
|---|---|---|
| Quantification Principle | Relative to a standard curve | Absolute, based on Poisson statistics |
| Detection Method | Real-time fluorescence monitoring | Endpoint fluorescence detection in partitions |
| Key Output | Cycle threshold (Ct) value | Copies per microliter |
| Standard Curve | Required | Not required |
| Data Analysis | More complex, requires normalization | More straightforward, direct counting |
| Sensitivity | High, but limited by background noise | Ultra-high, ideal for low-abundance targets [20] |
The Workflow Evolution
The following diagram illustrates the core procedural differences between qPCR and dPCR workflows, highlighting the crucial partitioning step that defines dPCR.
Direct Performance Comparison: Key Metrics for ctDNA Research
The transition to dPCR is driven by its demonstrably superior performance in key analytical metrics critical for detecting low-frequency mutations in ctDNA, where the tumor-derived DNA can represent less than 0.1% of the total cell-free DNA in early-stage cancers [24] [25].
Precision and Reproducibility
A critical requirement for tracking molecular response in cancer patients is high precision. dPCR consistently demonstrates lower measurement variability compared to qPCR. A controlled technical study comparing Crystal Digital PCR (cdPCR) to qPCR using 23 technical replicates from a single master mix found that the coefficient of variation (%CV) for cdPCR was 2.3%, more than two-fold lower than the 5.0% CV observed for qPCR [23]. When cdPCR replicates were pooled, the variability dropped even further to a CV of 1.5%, almost three-fold lower than the average of qPCR duplicates [23]. This enhanced precision is attributable to dPCR's partitioning and absolute quantification, which minimizes the impact of amplification efficiency variations that affect qPCR [20].
Sensitivity and Detection of Low-Abundance Targets
The ability to detect very rare mutant alleles in a high background of wild-type DNA is paramount in liquid biopsy. dPCR excels in this area, as evidenced by a 2025 clinical study comparing multiplex dPCR to qPCR for detecting periodontal pathogens. The study found that dPCR demonstrated superior sensitivity, detecting lower bacterial loads than qPCR, particularly for P. gingivalis and A. actinomycetemcomitans [8]. Bland-Altman plots from this study highlighted good agreement between the technologies at medium/high target loads, but significant discrepancies at low concentrations (< 3 log10Geq/mL), where qPCR resulted in false negatives [8]. This superior sensitivity directly translates to ctDNA research, enabling more reliable detection of minimal residual disease (MRD).
Accuracy in Complex Samples
dPCR is also more robust to the presence of PCR inhibitors that are common in complex clinical samples [8] [23]. Because dPCR is an endpoint measurement that only requires a clear threshold between positive and negative partitions, it is less affected by inhibitors that can delay amplification and distort the Ct values critical to qPCR's quantification [20] [23].
Table 2: Performance Comparison for ctDNA Research Applications
| Performance Metric | qPCR | dPCR | Experimental Support |
|---|---|---|---|
| Precision (Coefficient of Variation) | ~5.0% CV | ~2.3% CV (2-fold lower) | 23 technical replicates from single master mix [23] |
| Sensitivity (Low Abundance) | Limited, prone to false negatives at <0.1% VAF | Ultra-high, detects frequencies as low as 0.001% [20] | dPCR detected low-load pathogens missed by qPCR [8] |
| Accuracy with Inhibitors | More susceptible to variation | More robust and tolerant | dPCR relies on endpoint fluorescence, less affected by delayed amplification [20] [23] |
| Quantification Dynamic Range | 7–10 logs [20] | 5 logs [20] | dPCR's dynamic range is sufficient for most ctDNA applications. |
| Concordance in ctDNA Detection | - | >90% concordance between ddPCR and plate-based dPCR [24] | Study of 46 early-stage breast cancer samples [24] |
Experimental Protocols: A Glimpse into Validation Studies
Protocol: Comparative Analysis of dPCR and qPCR
This protocol is based on the methodology used in the 2025 study comparing dPCR and qPCR for pathogen detection [8].
- Sample Preparation: Subgingival plaque samples were collected and DNA was extracted using the QIAamp DNA Mini kit (Qiagen) [8].
- dPCR Assay: The nanoplate-based dPCR was performed using the QIAcuity Four system (Qiagen). The 40 µL reaction mixture contained sample DNA, 4× Probe PCR Master Mix, specific primers and probes, a restriction enzyme, and nuclease-free water [8].
- Thermocycling and Imaging: The workflow included partitioning into ~26,000 partitions, followed by thermocycling (45 cycles of 95°C for 15s and 58°C for 1min). Imaging was then performed on multiple channels to identify positive partitions for each target [8].
- qPCR Assay: The same DNA samples were analyzed in parallel using a canonical qPCR method designed to target the same bacterial sequences.
- Data Analysis: For dPCR, concentrations were calculated automatically by the instrument's software based on Poisson distribution. For qPCR, standard curves were constructed for quantification. Analytical parameters like linearity, precision, accuracy, and sensitivity were statistically compared between the two methods using Mann-Whitney U tests, Wilcoxon tests, and Bland-Altman plots [8].
Protocol: ctDNA Analysis in Early-Stage Breast Cancer
This protocol outlines the comparative approach used to validate dPCR systems for ctDNA detection [24].
- Patient Cohort and Sample Collection: 46 baseline plasma samples (5 mL each) were collected from patients with early-stage breast cancer prior to any treatment [24].
- Parallel dPCR Analysis: Each sample was analyzed using two different dPCR systems:
- The QX200 droplet digital PCR (ddPCR) system from Bio-Rad (considered the gold-standard).
- The Absolute Q plate-based digital PCR (pdPCR) system from Thermo Fisher Scientific.
- Mutation Analysis: The systems were used to analyze ctDNA, specifically looking for mutations relevant to breast cancer.
- Concordance and Workflow Assessment: The mutant allele frequency (MAF) results from both systems were compared for concordance. The technical workflows, including variability and hands-on time, were also evaluated [24].
The Scientist's Toolkit: Essential Reagents and Materials
The following reagents are critical for executing the dPCR experiments described in this guide.
Table 3: Key Research Reagent Solutions for dPCR-based ctDNA Analysis
| Reagent/Material | Function | Example Product |
|---|---|---|
| cfDNA Extraction Kit | To isolate cell-free DNA from plasma samples while preserving fragment integrity and minimizing contamination. | QIAamp Circulating Nucleic Acid Kit (Qiagen) [26] |
| dPCR Master Mix | A optimized ready-to-use mix containing DNA polymerase, dNTPs, and buffers specific for digital PCR partitioning and amplification. | QIAcuity Probe PCR Kit (Qiagen) [8] |
| Assay-specific Primers & Probes | Hydrolysis probes (e.g., TaqMan) and primers designed to specifically target the mutant allele of interest (e.g., PIK3CA, ESR1). | Custom double-quenched hydrolysis probes [8] |
| Partitioning Oil/Matrix | For droplet-based systems, this oil is used to generate stable, uniform water-in-oil emulsion droplets for individual reactions. | Droplet Generation Oil for Probes [27] |
| Reference DNA | A known concentration of wild-type DNA is used as a negative control and for assay validation. | Human Genomic DNA (e.g., for ALB target) [23] |
The evolution from qPCR to dPCR technology marks a significant advancement in molecular diagnostics, particularly for challenging applications like ctDNA analysis. While qPCR remains a robust and high-throughput tool for many applications, dPCR provides unequivocal advantages in precision, sensitivity, and absolute quantification required for detecting low-frequency mutations, monitoring minimal residual disease, and guiding targeted therapy in oncology. The experimental data confirms that dPCR's partitioning-based methodology offers researchers a more powerful tool for pushing the boundaries of precision medicine. As dPCR technology continues to evolve with improved throughput and automation, its role in clinical research and diagnostics is poised to expand further.
Strategic Applications in ctDNA Analysis: Guiding Therapy and Monitoring Disease
The detection of minimal residual disease (MRD) and rare somatic mutations is critical for cancer prognosis and treatment guidance. This comparison guide objectively analyzes the performance of digital PCR (dPCR) against quantitative PCR (qPCR) for circulating tumor DNA (ctDNA) quantification. Recent evidence demonstrates that dPCR consistently outperforms qPCR in sensitivity, precision, and absolute quantification for low-abundance targets, achieving detection limits of 0.01% variant allele frequency—essential for reliable MRD monitoring. While qPCR remains valuable for high-throughput applications, dPCR provides superior technical capabilities for detecting rare cancer-associated mutations in liquid biopsies, offering researchers a powerful tool for precision oncology applications.
Polymersse chain reaction (PCR) technologies form the cornerstone of modern molecular diagnostics, with both quantitative PCR (qPCR) and digital PCR (dPCR) serving pivotal roles in nucleic acid detection [2]. While qPCR, also known as real-time PCR, measures DNA amplification during the exponential phase of the reaction using fluorescent probes or dyes and relies on standard curves for quantification, dPCR takes a fundamentally different approach by partitioning samples into thousands of individual reactions for absolute target quantification without external references [4]. This technological distinction becomes particularly significant when detecting rare alleles in complex biological samples where target molecules may represent ≤ 0.1% of the total nucleic acid population, as is common with ctDNA in early-stage cancers [24].
The emergence of dPCR addresses several limitations inherent to qPCR methodology, especially concerning rare target detection [2]. Where qPCR struggles with precise quantification of targets present at low concentrations amidst abundant background DNA, dPCR's partitioning approach enhances sensitivity by effectively concentrating rare targets and minimizing PCR inhibition effects [2]. This technical advancement has positioned dPCR as the preferred technology for challenging applications including MRD monitoring, liquid biopsy analysis, and detection of low-abundance pathogens [4].
Performance Comparison: dPCR vs. qPCR for Rare Mutation Detection
Analytical Performance Metrics
Table 1: Comparative analytical performance of dPCR versus qPCR
| Performance Parameter | dPCR | qPCR | Experimental Evidence |
|---|---|---|---|
| Limit of Detection (LOD) | 0.01% VAF (Variant Allele Frequency) [21] | >1% VAF (standard applications) [2] | MRD detection in hematological malignancies [28] |
| Quantification Method | Absolute quantification without standard curves [4] | Relative quantification requiring standard curves [4] | Periodontal pathogen detection [8] |
| Precision | Lower intra-assay variability (median CV%: 4.5%) [8] | Higher variability (qPCR CV% significantly higher) [8] | Bacterial load quantification in subgingival plaque [8] |
| Sensitivity at Low Concentrations | Superior detection of low bacterial loads [8] | 5-fold underestimation of A. actinomycetemcomitans prevalence [8] | Periodontitis microbiome analysis [8] |
| Tolerance to Inhibitors | High tolerance due to partitioning [2] | Moderate to low tolerance [2] | Complex clinical sample analysis [2] |
| Multiplexing Capability | Limited by fluorescence channels [2] | Established multiplexing protocols [2] | Fusion transcript detection in leukemia [29] |
Application-Specific Performance
Table 2: Performance comparison across clinical applications
| Application Domain | dPCR Performance | qPCR Performance | Clinical Context |
|---|---|---|---|
| ctDNA Detection in Early-Stage Breast Cancer | 90% concordance with gold standard; more stable compartments [24] | N/A (as reference method) | Baseline plasma prior to treatment [24] |
| MRD in Acute Lymphoblastic Leukemia | Sensitivity up to 1E-4; detected micro-residual disease missed by PCR-MRD [28] | Failed to detect early recurrence in some cases [28] | Bone marrow monitoring during chemotherapy [28] |
| Rectal Cancer ctDNA Detection | 58.5% detection rate in baseline plasma (24/41 patients) [15] | 36.6% detection rate in baseline plasma (15/41 patients) [15] | Pre-therapy plasma samples in non-metastatic cancer [15] |
| Rare Fusion Transcript Detection | Successfully monitored atypical BCR::ABL1 variants [29] | Limited by need for standardized assays [29] | Hematological malignancy MRD monitoring [29] |
Experimental Protocols and Methodologies
dPCR Workflow for MRD Detection
Detailed dPCR Protocol for ctDNA Analysis
Sample Preparation and DNA Extraction:
- Collect blood in specialized blood collection tubes (e.g., Streck Cell-Free DNA BCT) to preserve ctDNA integrity [30]
- Process plasma within 2-4 hours for standard EDTA tubes or within 5 days for cell-stabilizer tubes [30]
- Employ two-step centrifugation: initial low-speed (800-1,900 × g for 10 min) to pellet cells, followed by high-speed (14,000-16,000 × g for 10 min) to remove debris [30]
- Extract DNA using magnetic bead-based systems (optimal for small fragment recovery) or spin columns [30]
- Aliquot and store plasma at -80°C if not processed immediately; avoid multiple freeze-thaw cycles [30]
dPCR Reaction Setup:
- Assemble 20-40 μL reactions containing 10-150 ng of template DNA [28] [24]
- Use restriction enzymes (e.g., HindIII, EcoRI-HF) to fragment genomic DNA and improve partitioning efficiency [28] [29]
- Apply optimized thermal cycling conditions: initial denaturation at 95°C for 2 min, followed by 40-45 cycles of denaturation at 95°C for 15 sec and annealing/extension at 58-64°C for 1 min [29]
- Implement temperature gradient optimization (58-68°C) for specific assays to enhance cluster separation [29]
Data Analysis and Interpretation:
- Calculate target concentration using Poisson statistics to account for partition occupancy [2]
- Determine variant allele frequency (VAF) by comparing mutant to wild-type allele counts [28]
- Establish positivity thresholds (typically ≥3 positive partitions for rare alleles) [8]
- Normalize results using reference genes (e.g., ABL1 for hematological applications) [29]
The Scientist's Toolkit: Essential Reagents and Materials
Table 3: Essential research reagents and materials for dPCR-based rare mutation detection
| Reagent/Material | Specification | Function | Example Products/References |
|---|---|---|---|
| Blood Collection Tubes | Cell-stabilizing tubes | Preserve ctDNA integrity during transport/storage | Streck BCT, Roche, PAXgene [30] |
| DNA Extraction Kits | Magnetic bead-based or spin columns | Optimal recovery of small DNA fragments | QIAamp DNA Mini Kit [28] |
| dPCR Master Mix | Probe-based chemistry | Specific target amplification with fluorescence detection | ddPCR Supermix for Probes (No dUTP) [28] |
| Restriction Enzymes | High-fidelity enzymes | Fragment genomic DNA to improve partitioning | Hind III, EcoRI-HF [28] [29] |
| Primers/Probes | Mutation-specific designs | Selective amplification of target alleles | Custom-designed per target [29] |
| Reference Assays | Endogenous controls | Normalization for sample quality/quantity | ABL1, GUSB [29] |
| Partitioning Devices | Droplet or chip-based | Physical separation of reactions | QX200 Droplet Generator, QIAcuity Nanoplate [24] [8] |
Application Case Studies
MRD Monitoring in Hematological Malignancies
In T-cell acute lymphoblastic leukemia (T-ALL), researchers devised a ddPCR-based MRD (ddPCR-MRD) approach targeting somatic single nucleotide variants (SNVs) identified through whole-exome sequencing [28]. The method demonstrated sensitivity up to 1E-4 and successfully detected micro-residual disease that was missed by conventional PCR-MRD in one patient, highlighting its clinical value for early relapse detection [28]. The study assessed ddPCR-MRD at 26 time points from eight T-ALL patients, showing strong concordance with standard methods while offering advantages in universality regardless of tumor-specific immunoglobulin or T-cell receptor patterns [28].
Another investigation focused on rare fusion transcripts in hematological malignancies, including atypical BCR::ABL1 variants and CBFB::MYH11 fusions [29]. The dPCR assays enabled "digitalized" serial MRD monitoring with sensitivity sufficient to guide treatment decisions, particularly valuable for targets lacking commercial qPCR assays [29]. The protocols required careful optimization of thermal cycling conditions and probe designs to achieve optimal cluster separation and PCR efficiency [29].
Solid Tumor Applications
In early-stage breast cancer, a 2024 comparative study evaluated the QX200 droplet digital PCR system against the newer Absolute Q plate-based digital PCR system for ctDNA detection [24]. Both systems displayed comparable sensitivity with >90% concordance in ctDNA positivity, though the plate-based system demonstrated a more stable number of compartments and required less hands-on time [24]. The study further revealed significant associations between ctDNA levels and aggressive clinicopathological features, including Ki67 score >20% and triple-negative subtypes [24].
For rectal cancer, research published in 2025 demonstrated ddPCR's superior detection rate (58.5%) compared to NGS panel sequencing (36.6%) in baseline plasma samples [15]. The detection of ctDNA correlated with higher clinical tumor stage and lymph node positivity, suggesting utility in assessing disease severity [15]. The cost-effectiveness of ddPCR (5-8.5-fold lower than NGS) makes it particularly suitable for repeated monitoring applications [21].
Technical Considerations and Limitations
Practical Implementation Challenges
Despite its superior sensitivity, dPCR presents several practical limitations. The technology typically has lower throughput compared to qPCR, processing fewer samples per run [2]. Additionally, dPCR consumables remain more expensive than standard qPCR reagents, impacting cost-effectiveness for routine high-throughput applications [2]. The requirement for specialized instrumentation and technical expertise may also present barriers to implementation in some laboratory settings [4].
Assay optimization represents another critical consideration. dPCR assays require careful validation of thermal cycling conditions, with studies demonstrating that suboptimal annealing temperatures can result in "raindrop" patterns (indicating poor PCR efficiency) and reduced total copy numbers [29]. For fusion transcript detection, some targets require separate reaction wells for different probes to avoid interference, increasing sample requirements [29].
Appropriate Technology Selection
The choice between dPCR and qPCR ultimately depends on specific research requirements. qPCR remains preferable for high-throughput applications where extreme sensitivity is not critical, when analyzing moderate-to-high abundance targets, and for relative quantification studies where established reference genes exist [2] [4].
Conversely, dPCR is indicated when absolute quantification is required without standard curves, for detection of rare targets (<1% VAF), when maximum sensitivity and precision are critical, and for applications requiring high tolerance to PCR inhibitors [2] [4]. Research indicates that dPCR particularly excels in detecting low-level bacterial loads, with one study showing it identified 5-fold more A. actinomycetemcomitans infections in periodontitis patients compared to qPCR [8].
Digital PCR represents a significant advancement in nucleic acid quantification technology, particularly valuable for ultra-sensitive detection applications such as MRD monitoring and rare mutation discovery. The technology's partitioning approach enables absolute quantification without standard curves, superior sensitivity for low-abundance targets, and enhanced resistance to PCR inhibitors—all critical factors for reliable ctDNA analysis. While qPCR maintains advantages in throughput and cost-effectiveness for routine applications, dPCR has established itself as the premier technology for challenging detection scenarios where sensitivity and precision at low target concentrations determine experimental success. As liquid biopsy applications continue to expand in oncology, dPCR is positioned to play an increasingly vital role in translational cancer research and clinical diagnostics.
Quantitative real-time PCR (qPCR) has long served as a cornerstone technology for high-throughput genotyping in clinical research and diagnostic settings. This method enables researchers to screen for common actionable mutations—such as BRAF V600E, KRAS G12D, and various EGFR mutations—with efficiency and scalability. However, the evolving field of circulating tumor DNA (ctDNA) analysis and liquid biopsy applications has revealed specific limitations in qPCR performance, particularly when detecting rare mutations present at very low variant allele frequencies (VAF). This guide objectively compares qPCR against its technological successor, digital PCR (dPCR), providing experimental data and methodologies to inform platform selection for mutation screening programs.
dPCR represents the third generation of PCR technology, following conventional PCR and qPCR. Its fundamental innovation lies in partitioning a PCR reaction into thousands of nanoliter-sized reactions, enabling absolute quantification of nucleic acids without requiring a standard curve and dramatically improving sensitivity for rare allele detection [10].
Technology Comparison: qPCR versus dPCR
Fundamental Principles and Workflows
The core technological differences between qPCR and dPCR stem from their quantification methods and reaction architectures.
Table 1: Fundamental Principles of qPCR and dPCR
| Feature | Quantitative PCR (qPCR) | Digital PCR (dPCR) |
|---|---|---|
| Quantification Method | Relative quantification against a standard curve | Absolute quantification via Poisson statistics |
| Signal Detection | Real-time fluorescence during amplification | End-point fluorescence after amplification |
| Reaction Architecture | Bulk reaction in a single tube | Partitioned into thousands of nano-reactions |
| Standard Curve Requirement | Yes | No |
| Tolerance to PCR Inhibitors | Lower | Higher due to partitioning [8] |
| Theoretical Dynamic Range | 5-6 logs | 5 logs (effectively broader for rare variants) |
| Primary Output | Cycle threshold (Ct) | Copies per partition (positive/negative count) |
The workflow differences are substantial. In qPCR, samples are amplified in a bulk reaction, and fluorescence is measured during each cycle to determine the cycle threshold (Ct), which is compared to a standard curve for quantification. In contrast, dPCR workflows involve partitioning the sample, performing end-point amplification, and counting positive versus negative partitions to calculate absolute nucleic acid concentration using Poisson statistics [10].
Performance Comparison for Mutation Detection
Direct comparative studies reveal significant performance differences between these platforms, particularly for detecting low-frequency mutations.
Table 2: Performance Comparison for Mutation Detection
| Performance Metric | qPCR | dPCR | Experimental Context |
|---|---|---|---|
| Variant Allele Frequency (VAF) Detection Limit | 0.5% - 5% [31] | 0.1% - 0.001% [32] [33] | BRAF V600E detection in gDNA standards |
| Sensitivity in Clinical ctDNA Detection | 36.6% (15/41) [21] | 58.5% (24/41) [21] | Baseline plasma in rectal cancer patients |
| Precision (Intra-assay Variability) | Higher CV% [8] | Median CV%: 4.5% [8] | Multiplex detection of periodontal pathogens |
| Accuracy at Low Bacterial Loads | False negatives at <3 log10 Geq/mL [8] | Superior detection of low bacterial loads [8] | Periodontal pathobiont quantification |
| SARS-CoV-2 Detection Sensitivity | Variable depending on primer/probe sets [34] | Effectively quantifies low viral RNA copies [34] | Clinical samples and cultured viral RNA |
The superior sensitivity of dPCR becomes particularly evident in challenging clinical scenarios. For BRAF V600E mutation detection, dPCR consistently achieves a 0.1% VAF detection limit, while qPCR's sensitivity deteriorates to 5% as target concentration decreases [31]. In rectal cancer ctDNA analysis, dPCR detected significantly more positive cases in baseline plasma (58.5%) compared to NGS panels (36.6%), demonstrating its enhanced capability for molecular disease monitoring [21] [15].
Experimental Protocols and Methodologies
High-Throughput qPCR Genotyping Without DNA Purification
Protocols have been developed to expedite high-throughput qPCR genotyping by eliminating the DNA purification step, significantly reducing processing time.
Methodology:
- Sample Preparation: Use 2 μL of whole blood per sample with a primer pool consisting of 60-64 40X assays diluted 1:200 [35].
- Preamplification: Incorporate a multiplex preamplification step of targeted loci using systems like the TaqMan Sample-to-SNP Kit [35].
- qPCR Setup: Mix 2.5 μL of preamplified product with 2.5 μL of TaqMan GTXpress Master Mix in a 384-well plate [35].
- Amplification and Analysis: Perform qPCR using high-throughput systems (e.g., QuantStudio 12K Flex) and analyze results with genotyping software [35].
Performance Data: This direct blood methodology achieved a 98.38% call rate and 99.77% diagnostic accuracy when genotyping 5,760 loci (96 samples × 60 mutations) [35]. Interestingly, genotyping directly from blood demonstrated significantly less variation in wild-type cluster standard deviations compared to purified DNA, potentially improving assay reliability [35].
Droplet Digital PCR for Rare Mutation Detection
The dPCR protocol for rare mutation detection leverages partitioning to achieve exceptional sensitivity.
Methodology:
- Partitioning: Divide the PCR reaction mixture containing sample DNA into approximately 20,000 nanoliter-sized droplets [21] [33].
- Amplification: Perform endpoint PCR amplification with mutation-specific TaqMan probes [21].
- Analysis: Count PCR-positive and PCR-negative droplets using a droplet reader and apply Poisson statistics to determine absolute mutation concentration and VAF [33].
Performance Data: This approach enables detection of rare mutations with variant allele frequencies as low as 0.1% [32] [33]. The technology is particularly effective for liquid biopsy applications, where it can detect BRAF V600E mutations at 0.1% VAF even in low-concentration samples [31].
Comparison with Emerging Technologies: CRISPR-Cas13a
Recent technological innovations include CRISPR-Cas13a-based detection (SHERLOCK technology), which promises femtomolar sensitivity and single-base mismatch specificity [31]. However, in comparative studies:
- CRISPR-Cas13a detected inputs as low as 10 pM but showed non-specific fluorescent signals with wild-type targets [31].
- While detecting VAFs of 1-10%, it failed to discriminate 0.1% mutations over 99.9% wild-type sequences [31].
- dPCR remained superior for detecting 0.1% VAF in low-concentration samples, establishing it as the most suitable technique for clinical diagnosis purposes [31].
The Scientist's Toolkit: Essential Research Reagents
Table 3: Essential Reagents for High-Throughput Genotyping
| Reagent / Kit | Function | Application Notes |
|---|---|---|
| TaqMan Sample-to-SNP Kit | Enables direct genotyping from blood without DNA purification | Reduces processing time; uses 2μL blood/sample [35] |
| QIAamp DNA Mini Kit | Traditional DNA extraction from tissues or cells | Standard purification method; requires normalization [8] |
| TaqMan OpenArray Genotyping Master Mix | qPCR reaction mix for purified DNA | For use with normalized, purified DNA samples [35] |
| TaqMan GTXpress Master Mix | qPCR reaction mix for unpurified samples | Optimized for direct blood analysis [35] |
| QIAcuity Nanoplate 26k | Microfluidic chip for dPCR partitioning | Creates ~26,000 partitions for nanoliter reactions [8] |
| Ion AmpliSeq Cancer Hotspot Panel v2 | NGS panel for mutation screening | Covers >2800 COSMIC variants; 98% detection rate at 5% VAF [21] |
The choice between qPCR and dPCR for high-throughput genotyping depends on specific research requirements. qPCR remains a robust, cost-effective solution for screening common mutations present at moderate allele frequencies, particularly when using streamlined protocols that eliminate DNA purification. However, for liquid biopsy applications, minimal residual disease monitoring, and detection of rare mutations or low-level pathogens, dPCR demonstrates unequivocal advantages in sensitivity, precision, and absolute quantification.
Researchers must consider their specific detection limits, throughput requirements, and budget constraints when selecting between these platforms. While dPCR outperforms in sensitivity, qPCR maintains advantages in established workflows, extensive validation history, and lower per-reaction costs for high-throughput applications where ultra-high sensitivity is not critical.
In the era of precision oncology, the ability to track tumor dynamics in real-time is paramount for making informed treatment decisions. Traditional methods for monitoring treatment response, such as imaging and protein biomarkers, have significant limitations: imaging cannot detect microscopic disease, and protein biomarkers often lack specificity [1]. Circulating tumor DNA (ctDNA) has emerged as a powerful, non-invasive biomarker that reflects tumor burden and heterogeneity. Digital PCR (dPCR) represents a technological advancement that enables highly sensitive quantification of ctDNA, making it particularly suited for longitudinal monitoring of therapy response. This guide provides a comprehensive comparison of dPCR performance against alternative technologies in the context of dynamic therapy monitoring, supported by experimental data and detailed methodologies.
Technology Comparison: dPCR vs. Alternatives for ctDNA Analysis
Performance Characteristics Across Platforms
Digital PCR technologies demonstrate distinct advantages for ctDNA monitoring applications, particularly when tracking known mutations over time. The following table summarizes key performance metrics compared to other common technologies.
Table 1: Performance Comparison of Molecular Analysis Technologies for Therapy Monitoring
| Technology | Sensitivity (VAF) | Multiplexing Capability | Turnaround Time | Cost Considerations | Best Suited Applications |
|---|---|---|---|---|---|
| Digital PCR (dPCR) | 0.01%-0.1% [36] [37] | Limited | 3-4 hours [36] | Low to moderate [21] | Longitudinal monitoring of known mutations, MRD detection |
| Quantitative PCR (qPCR) | 1-10% [8] | Moderate | 2-3 hours | Low | High abundance mutation detection |
| Next-Generation Sequencing (NGS) | 0.1%-5% [21] [38] | High | Days to weeks [36] | High [21] | Mutation discovery, heterogeneous tumors |
| BEAMing PCR | 0.01% [39] | Limited | 6-8 hours | Moderate | Ultra-sensitive mutation detection |
Direct Comparative Studies
Recent head-to-head comparisons provide empirical evidence of dPCR performance:
dPCR vs. qPCR: A 2025 study comparing multiplex dPCR with qPCR for detecting periodontal pathobionts demonstrated dPCR's superior sensitivity, with better detection of low bacterial loads and lower intra-assay variability (median CV%: 4.5% for dPCR vs. higher for qPCR, p = 0.020) [8]. Bland-Altman plots revealed particularly superior performance at low concentrations (< 3 log10Geq/mL), where qPCR produced false negatives [8].
dPCR vs. NGS: In localized rectal cancer, ddPCR detected ctDNA in 58.5% (24/41) of baseline plasma samples compared to 36.6% (15/41) for NGS (p = 0.00075) [21]. However, NGS provided additional mutation information, including dynamic changes in TP53 that correlated with disease progression [38].
dPCR Platform Comparisons: A 2023 study comparing droplet digital PCR (ddPCR) and solid dPCR (QIAcuity) for lung and colorectal cancer liquid biopsy samples found solid dPCR had higher detection rates for EGFR mutations (100% vs. 58.8% for ddPCR) with moderate agreement between platforms (κ = 0.54) [40].
Experimental Protocols for Therapy Monitoring Applications
Core dPCR Workflow for Longitudinal ctDNA Monitoring
The following diagram illustrates the comprehensive workflow for therapy monitoring using dPCR:
Workflow for Longitudinal ctDNA Monitoring with dPCR
Detailed Methodological Protocols
Plasma Processing and cfDNA Extraction
Based on multiple studies [21] [36] [39], the standard protocol involves:
Blood Collection: Draw 10-20 mL peripheral blood into Streck Cell-Free DNA BCT or EDTA tubes. Process within 1-2 hours of collection.
Plasma Separation: Centrifuge at 2000 × g for 10 minutes at room temperature. Transfer supernatant to a fresh tube and perform a second centrifugation at 16,000 × g for 10 minutes to remove residual cells [36] [39].
cfDNA Extraction: Use commercial kits (Qiagen QIAamp DNA Mini/Micro Kit or Promega Maxwell 16 circulating DNA Plasma Kit) following manufacturer's instructions. Elute in 20-50 μL nuclease-free water [8] [36] [39].
DNA Quantification: Measure cfDNA concentration using fluorometric methods (Qubit dsDNA HS Assay) [36].
dPCR Assay Setup and Optimization
The following reagent table outlines essential components for dPCR experiments:
Table 2: Essential Research Reagent Solutions for dPCR ctDNA Analysis
| Reagent Category | Specific Products | Function | Optimization Notes |
|---|---|---|---|
| dPCR Master Mix | QIAcuity Probe PCR Kit [8], ddPCR Supermix | Provides optimized buffer, enzymes, dNTPs | Restriction enzymes may be added to reduce background [8] |
| Primers/Probes | Target-specific primers and double-quenched hydrolysis probes [8] | Specific target amplification and detection | Optimal concentration: 0.4 μM primers, 0.2 μM probes [8] |
| Partitioning Oil | ddPCR Droplet Generation Oil | Creates stable water-in-oil emulsion | Critical for partition integrity during thermocycling |
| Reference Assays | RPP30 gene assay [36] | Quality control for cfDNA input | Verifies extraction efficiency and sample quality |
| Restriction Enzymes | Anza 52 PvuII (Thermo Scientific) [8] | Reduces background from wild-type DNA | Enhances sensitivity for rare mutation detection |
A representative dPCR protocol from a 2025 study [8] includes:
Reaction Setup: Prepare 40 μL reactions containing:
- 10 μL template DNA
- 10 μL 4× Probe PCR Master Mix
- 0.4 μM of each specific primer
- 0.2 μM of each specific probe
- 0.025 U/μL restriction enzyme (Anza 52 PvuII)
- Nuclease-free water to volume
Partitioning: Load reactions into appropriate partitioning devices:
Thermocycling:
- Initial activation: 95°C for 2 minutes
- 45 cycles of: 95°C for 15 seconds, 58-60°C for 1 minute
- Signal stabilization: 4°C hold [8]
Data Analysis:
Data Interpretation in Clinical Context
Correlation with Clinical Outcomes
Multiple studies demonstrate dPCR's utility for therapy monitoring:
In metastatic cancer patients, personalized dPCR assays detected ctDNA mutations with 0.1% sensitivity (3 mutant molecules among 3000 wild-type) and correlated strongly with serum biomarkers (CEA, CA19-9, CA15-3) and imaging findings [36].
For rectal cancer, pre-therapy ctDNA detection by ddPCR correlated with higher clinical tumor stage and lymph node positivity on MRI [21].
Dynamic monitoring revealed ctDNA increases preceding radiographic progression by several weeks, allowing earlier treatment modification [36] [1].
Practical Implementation Considerations
Sampling Strategy for Longitudinal Monitoring
Effective monitoring requires strategic timing of sample collection:
- Baseline: Pre-treatment sample essential for identifying trackable mutations
- Early Treatment: 2-4 weeks after initiation to assess initial response
- Mid-Treatment: Before each cycle or at 2-3 month intervals
- Suspected Progression: At time of clinical suspicion, before imaging confirmation
- Post-Treatment: For minimal residual disease assessment [36] [1]
Analytical Considerations
Pre-analytical Variables: Blood collection tube choice, processing delays, and extraction methods significantly impact ctDNA recovery and stability [37].
Threshold Determination: Establish patient-specific baselines and clinically relevant thresholds for molecular response (e.g., ctDNA clearance, 50% reduction) [1].
Quality Metrics: Include internal controls for extraction efficiency, inhibition testing, and replicate analysis for low-frequency variants [36].
Digital PCR provides a robust, sensitive, and clinically actionable platform for longitudinal therapy monitoring through ctDNA analysis. Its superior sensitivity over qPCR, faster turnaround time compared to NGS, and absolute quantification capabilities make it particularly suited for tracking dynamic changes in tumor burden during treatment. While NGS offers broader mutation screening for heterogeneous tumors, dPCR excels in monitoring known mutations with high precision and reproducibility. As evidence for clinical utility grows, dPCR is poised to become an integral component of precision oncology practice, enabling real-time assessment of treatment response and earlier detection of resistance mechanisms.
The shift towards precision oncology necessitates technologies capable of detecting minute quantities of cancer-derived biomarkers with high accuracy and reliability. In this landscape, digital PCR (dPCR) has emerged as a powerful technique for circulating tumor DNA (ctDNA) analysis, enabling non-invasive liquid biopsy applications across diverse cancer types. Unlike quantitative PCR (qPCR), which relies on standard curves for relative quantification, dPCR employs a partitioning-based principle that allows for absolute quantification of target nucleic acids without the need for calibration curves [8] [10]. This partitioning of samples into thousands of individual reactions enhances sensitivity and precision, making dPCR particularly effective for detecting low-abundance targets within complex clinical samples like plasma [8] [1]. This article objectively compares the performance of dPCR against qPCR and next-generation sequencing (NGS) for ctDNA quantification, focusing on applications in colorectal, lung, and breast cancers through analysis of recent clinical study data and methodologies.
Performance Comparison: dPCR vs. qPCR and NGS
Clinical studies across multiple cancer types consistently demonstrate performance differences between dPCR, qPCR, and NGS for ctDNA detection and quantification. The following tables summarize key comparative data.
Table 1: Comparative Detection Rates of dPCR vs. Other Platforms Across Cancers
| Cancer Type | dPCR Detection Rate | Comparison Method & Detection Rate | Key Performance Finding | Source |
|---|---|---|---|---|
| Rectal Cancer | 58.5% (ddPCR, baseline plasma) | NGS Panel: 36.6% (p=0.00075) | ddPCR detected significantly more ctDNA pre-therapy | [21] |
| Lung Cancer | 83.0% (metastatic, with specific cut-off) | NGS (reference) | Higher sensitivity in metastatic vs. non-metastatic (38.7%) disease | [41] |
| Early-Stage Breast Cancer | >90% concordance between ddPCR & pdPCR | pdPCR (Absolute Q system) | High agreement between different dPCR platforms | [24] |
| Colorectal Cancer (mCRC) | 89.2% sensitivity (metastatic) | Specificity: 96.7% | High sensitivity and specificity for metastatic disease | [42] |
| Advanced NSCLC | 54% of mutations identified by tDNA-NGS | tDNA-NGS (Gold Standard, 98 mutations) | Identified 71% of targetable driver mutations | [43] |
Table 2: Analytical Performance: dPCR vs. qPCR
| Performance Parameter | dPCR Performance | qPCR Performance | Clinical Implication | Source |
|---|---|---|---|---|
| Sensitivity | Superior detection of low bacterial loads (periodontal study analog) | False negatives at low concentrations (<3 log10Geq/mL) | Essential for low-abundance ctDNA in early-stage cancer/MRD | [8] |
| Precision (Variability) | Lower intra-assay variability (median CV%: 4.5%) | Higher variability (p=0.020) | Greater reproducibility for longitudinal monitoring | [8] |
| Quantification | Absolute quantification, no standard curve needed | Requires standard curve for relative quantification | Robustness to PCR inhibitors; simplified workflow | [8] [10] |
| Operational Cost | 5–8.5-fold lower than NGS [21] | Lower cost than NGS, but less sensitive than dPCR | Cost-effective for monitoring predefined mutations | [21] |
Experimental Protocols & Clinical Workflows
Typical dPCR Workflow for ctDNA Analysis
The following diagram illustrates the core dPCR workflow for ctDNA analysis, which is generally consistent across the cancer types discussed.
Figure 1: Core dPCR workflow for ctDNA analysis, from blood draw to absolute quantification.
Colorectal Cancer: Methylation-Specific ddPCR Multiplex
Objective: To detect ctDNA in colorectal cancer (CRC) patients using a methylation-specific droplet digital PCR (MS-ddPCR) multiplex assay for monitoring disease progression and relapse [42].
Methods:
- Assay Design: Developed a multiplex MS-ddPCR assay combining tumor-specific and tissue-conserved methylation markers.
- Sample Collection: Analyzed plasma samples from patients with localized and metastatic CRC (mCRC).
- dPCR Protocol: Performed bisulfite conversion of extracted cell-free DNA, followed by multiplex ddPCR analysis targeting specific methylated regions.
- Data Analysis: Calculated sensitivity, specificity, and assessed ctDNA dynamics in relation to progression-free survival (PFS) and overall survival (OS) [42].
Key Data: The assay demonstrated 96.7% specificity, with sensitivity of 64.4% in localized tumors and 89.2% in mCRC. Patients classified as "good responders" based on ctDNA dynamics showed significantly longer median PFS (11.4 months) and OS (35.3 months) compared to poor responders (PFS: 7.6 months, OS: 18.4 months) [42].
Lung Cancer: Multiplexed Methylation Marker Detection
Objective: To develop and validate a methylation-specific ddPCR multiplex assay with five tumor-specific methylation markers for lung cancer detection across various clinical settings [41].
Methods:
- Marker Identification: Identified four differentially methylated regions (DMRs) through bioinformatics analysis of public Illumina 450K methylation array data (TCGA), plus one marker (HOXA9) from previous research.
- Sample Cohorts: Used formalin-fixed paraffin-embedded (FFPE) tissue for assay validation and plasma from cohorts of healthy controls, non-metastatic, and metastatic lung cancer patients.
- dPCR Analysis: Extracted and bisulfite-converted cell-free DNA from plasma, then analyzed using the five-marker ddPCR multiplex.
- Cut-off Analysis: Examined two different methods for determining ctDNA-positive status and their effect on sensitivity and specificity [41].
Key Data: In non-metastatic disease, the ddPCR multiplex showed ctDNA-positive rates of 38.7% and 46.8% (depending on the cut-off method). In metastatic cases, these rates increased to 70.2% and 83.0%, respectively. Higher sensitivities were observed for small cell lung cancer and squamous cell carcinoma [41].
Breast Cancer: dPCR Platform Comparison for Mutation Detection
Objective: To compare the performance of two dPCR systems—droplet digital PCR (ddPCR) and plate-based digital PCR (pdPCR)—for detecting ctDNA in early-stage breast cancer patients [24].
Methods:
- Patient Cohort: Analyzed 46 baseline plasma samples from patients with early-stage breast cancer collected prior to any treatment.
- Platform Comparison: Compared the QX200 ddPCR system (Bio-Rad) with the Absolute Q pdPCR system (Thermo Fisher Scientific).
- Analysis: Analyzed 5 mL of plasma per patient, with both systems targeting the same mutations for direct comparison of mutant allele frequency (MAF) detection and concordance.
- Clinicopathological Correlation: Explored associations between ctDNA levels and specific clinicopathological features like Ki67 score and receptor status [24].
Key Data: Both systems displayed comparable sensitivity with >90% concordance in ctDNA positivity calls. Significantly higher ctDNA levels were detected in patients with Ki67 score >20% or with estrogen receptor-negative/triple-negative breast cancer subtypes [24].
The Scientist's Toolkit: Essential Research Reagents
Table 3: Key Reagents and Materials for dPCR-based ctDNA Analysis
| Reagent/Material | Function in Workflow | Specific Examples |
|---|---|---|
| Blood Collection Tubes | Stabilizes nucleated blood cells and cfDNA post-phlebotomy. | Streck Cell-Free DNA BCT tubes [21] |
| cfDNA Extraction Kits | Isolves cell-free DNA from plasma samples. | QIAamp DNA Mini Kit [8], DSP Circulating DNA Kit on QIAsymphony SP [41] |
| Bisulfite Conversion Kits | (For methylation assays) Converts unmethylated cytosines to uracils, allowing methylated sites to be distinguished. | EZ DNA Methylation-Lightning Kit [41] |
| dPCR Master Mix | Provides optimized buffer, nucleotides, and enzyme for the PCR reaction. | QIAcuity Probe PCR Kit [8] |
| Assay-Specific Primers/Probes | Fluorescently-labeled hydrolysis probes and primers designed to detect specific mutations or methylated DNA regions. | Custom TaqMan assays [8] [42] [41] |
| Partitioning Consumables | Creates thousands of individual reactions for digital quantification. | QIAcuity Nanoplate 26k [8], droplet generator cartridges |
The consolidated evidence from recent clinical studies in colorectal, lung, and breast cancers firmly establishes the role of dPCR as a robust, sensitive, and clinically actionable tool for ctDNA analysis. Its superior sensitivity over qPCR and cost-effectiveness compared to NGS, combined with its absolute quantification capabilities, make it particularly suited for applications requiring high precision in detecting low-abundance targets, such as minimal residual disease (MRD) monitoring and treatment response assessment [8] [21] [1]. As the field of liquid biopsy continues to evolve, dPCR stands as a critical enabling technology for advancing personalized cancer management, providing researchers and clinicians with a reliable method to non-invasively track tumor dynamics in real-time.
Navigating Practical Challenges: From Pre-Analytical Variables to Data Analysis
The analysis of circulating tumor DNA (ctDNA) has revolutionized precision oncology by enabling non-invasive, real-time molecular profiling of tumors. However, the low abundance of ctDNA in blood, often constituting less than 0.025–2.5% of total cell-free DNA (cfDNA), combined with its rapid in-vivo decay, poses significant analytical challenges [26]. The reliability of subsequent detection technologies, whether digital PCR (dPCR) or quantitative PCR (qPCR), is fundamentally constrained by pre-analytical variables. This guide objectively compares key pre-analytical components—blood collection tubes, centrifugation protocols, and storage conditions—by synthesizing current experimental data, providing a foundation for optimizing ctDNA yield and integrity for sensitive molecular applications.
Critical Pre-Analytical Factors in ctDNA Analysis
Blood Collection Tubes: A Comparative Analysis
The choice of blood collection tube is paramount for stabilizing ctDNA and preventing contamination by genomic DNA from leukocytes. The table below summarizes experimental findings from a large-scale study that evaluated four different tube types using automated cfDNA extraction and qPCR quantification on samples from healthy individuals [44].
Table 1: Comparison of Blood Collection Tubes for cfDNA Yield and Stability
| Tube Type | Mechanism of Action | cfDNA Yield at 0h (ng/mL plasma) | cfDNA Yield after 168h (ng/mL plasma) | Recommended Max Time to Plasma Isolation |
|---|---|---|---|---|
| K2EDTA (Standard) | Inhibits coagulation and plasma DNases [30] | 2.41 | 68.19 (Significant increase) | < 2-6 hours at 4°C [26] |
| Streck | Chemical crosslinking of blood cells [44] | 2.74 (Highest at 0h) | 2.38 (13.1% decrease, most stable) | Up to 7 days at room temperature [44] [26] |
| PAXgene (Qiagen) | Prevention of apoptosis [44] | 1.66 | 2.48 (49.4% increase) | Up to 7 days at room temperature [26] |
| Norgen | Osmotic cell stabilizers [44] | 0.76 | Remained stable | Data suggests stability over time [44] |
Key Findings: While K2EDTA tubes provide good initial yield, the cfDNA concentration can increase dramatically over time due to leukocyte lysis, leading to contamination [44]. For workflows requiring delayed processing (e.g., sample transportation), Streck tubes provide superior initial yield and remarkable stability for up to a week, making them a preferred choice for preserving ctDNA integrity [44]. Another independent study confirmed that tubes from Roche and Qiagen are also highly suitable for ctDNA stabilization, enabling reliable detection of mutant DNA even at low concentrations after 7 days [45].
Centrifugation Protocols
Efficient removal of cells and debris is critical to ensure the purity of isolated cfDNA. A two-step centrifugation protocol is widely recommended to minimize cellular DNA contamination [30] [26].
Table 2: Standardized Two-Step Centrifugation Protocol
| Step | Centrifugal Force | Duration | Temperature | Purpose |
|---|---|---|---|---|
| First Spin | 800–2,000 g | 10 minutes | 4°C (or room temperature) | To pellet blood cells and obtain plasma [30] [26]. |
| Second Spin | 12,000–20,000 g | 10 minutes | 4°C | To remove remaining cellular debris and platelets [30] [26]. |
Research indicates that for blood samples collected in stabilizer tubes, the adapted CEN protocol (1,900 g for 10 min; 16,000 g for 10 min, at room temperature) is particularly effective at minimizing contamination with long DNA fragments [30]. A comparative study found that for K2EDTA, Norgen, and PAXgene tubes, a single centrifugation step could yield higher cfDNA concentrations, whereas for Streck tubes, no significant difference was observed between single and double centrifugation [44].
Sample Storage Conditions
Proper storage of plasma and extracted cfDNA is essential to prevent degradation and ensure the stability of molecular biomarkers.
- Whole Blood Storage: Blood in K2EDTA tubes should be processed within 2-6 hours if kept at 4°C. In contrast, specialized cell-stabilizing tubes (e.g., Streck, PAXgene) allow storage at 10–30°C for up to 3–7 days [30] [26].
- Plasma Storage: Isolated plasma should be stored at -80°C. For mutation detection, plasma can be stored for up to 10 years, but for quantitative analysis, a storage duration of within 3 to 9 months is recommended [46] [26].
- Freeze-Thaw Cycles: While a single freeze-thaw cycle has minimal impact, more than three cycles can degrade nucleic acids and reduce detection efficiency. Storing plasma in small, single-use aliquots is strongly advised to avoid repeated thawing [30] [26].
A 2025 study on long-term plasma storage found that while cfDNA yield remained stable for up to 14 years at -80°C, extended storage was independently associated with increased genomic DNA contamination, which compromised the quality of subsequent epigenetic analyses like 5-hydroxymethylcytosine (5hmC) sequencing [46].
The Impact of Pre-Analytics on dPCR vs. qPCR Performance
The choice between dPCR and qPCR for ctDNA quantification is influenced by the pre-analytical phase. dPCR, with its superior sensitivity and precision for detecting low-abundance targets, is more susceptible to artifacts introduced by poor sample quality [8] [2].
- Detection of Low-Abundance Mutations: dPCR's partitioning technology allows for the absolute quantification of rare mutant alleles in a background of wild-type DNA. However, this high sensitivity means that any contaminating genomic DNA from improper blood tube handling or centrifugation can lead to false-negative or underestimated mutant allele frequencies [26] [2].
- Tolerance to Inhibitors: dPCR is generally more tolerant to PCR inhibitors present in blood samples than qPCR. Nevertheless, the purity of cfDNA obtained through optimized extraction protocols benefits both technologies [2].
- Quantification Reliability: qPCR relies on standard curves for relative quantification, which can be affected by sample purity and the presence of inhibitors. The absolute quantification nature of dPCR makes it less dependent on external standards, but the accuracy of this quantification hinges on the integrity of the input cfDNA, which is a direct result of pre-analytical handling [8] [2].
In essence, rigorous pre-analytical control is a prerequisite for leveraging the full potential of dPCR, especially for minimal residual disease (MRD) detection where ctDNA levels are vanishingly low.
The Scientist's Toolkit: Essential Research Reagent Solutions
Table 3: Key Materials and Reagents for ctDNA Pre-Analytical Workflow
| Item | Function | Example Products/Brands |
|---|---|---|
| Cell-Free DNA BCTs | Stabilize nucleated blood cells to prevent gDNA release during transport/storage. | Streck Cell-Free DNA BCTs, PAXgene Blood ccfDNA Tubes (Qiagen), cfDNA/cfRNA Preservative Tubes (Norgen) [44] [47] [26]. |
| Automated Extraction Systems | High-throughput, consistent magnetic bead-based cfDNA isolation. | QIAsymphony SP system (Qiagen), MagBench Automated DNA Extraction Instrument (Yourgene Health) [44] [47]. |
| Manual cfDNA Kits | Silica membrane or magnetic bead-based extraction for flexible, bench-top use. | QIAamp Circulating Nucleic Acid Kit (Qiagen), NucleoSpin cfDNA XS Kit (Macherey-Nagel) [46] [26] [48]. |
| Quantification & QC Instruments | Precisely quantify and assess the fragment size distribution of extracted cfDNA. | Qubit Fluorometer (Thermo Fisher), Agilent 2100 Bioanalyzer, Parallel Capillary Electrophoresis [44] [46] [48]. |
| dPCR Systems | Absolute quantification of rare mutant alleles with high sensitivity and precision. | QIAcuity (Qiagen), Bio-Rad QX200 ddPCR System [8] [48]. |
Experimental Workflow for Pre-Analytical Comparison
To generate comparative data like that summarized in Table 1, the following experimental methodology can be employed.
Objective: To evaluate the impact of different blood collection tubes and processing delays on cfDNA yield, quality, and suitability for downstream dPCR/qPCR analysis.
Protocol:
- Sample Collection: Collect venous blood from each participant (e.g., healthy donors or cancer patients) into multiple tube types (e.g., K2EDTA, Streck, PAXgene, Norgen) simultaneously [44] [45].
- Storage Conditions: Store the filled tubes under defined conditions (e.g., room temperature for preservative tubes, 4°C for K2EDTA) for different time intervals (e.g., 0h, 48h, 168h) before processing [44].
- Plasma Isolation: Centrifuge all tubes using a standardized two-step protocol (e.g., 1,900 g for 10 min, followed by 16,000 g for 10 min at 4°C) to isolate plasma [30] [26].
- cfDNA Extraction: Extract cfDNA from a fixed volume of plasma (e.g., 1-4 mL) using an automated or manual kit (e.g., QIAamp Circulating Nucleic Acid Kit on a QIAvac system) [44] [46].
- Quality and Quantity Assessment:
- Concentration: Quantify cfDNA using a fluorometric method (e.g., Qubit) and qPCR assays targeting short fragments (e.g., 60-74 bp) [44].
- Purity/Contamination: Assess potential genomic DNA contamination using:
- Downstream Analysis: Analyze samples with known mutations using dPCR (e.g., for EGFR T790M) to compare mutant allele detection sensitivity and quantification across pre-analytical conditions [45].
This workflow directly tests how each variable (tube type, time) affects the critical parameters of yield and quality, providing robust data for protocol selection.
Workflow Visualization
The following diagram synthesizes the core experimental protocol and the logical decision points for optimizing the pre-analytical phase of ctDNA analysis.
The path to reliable ctDNA analysis is paved long before PCR amplification begins. Data consistently shows that blood collection in specialized stabilizing tubes like those from Streck, followed by a standardized two-step centrifugation protocol and prompt plasma storage at -80°C, provides the highest quality input material. While dPCR offers technical advantages for detecting ultra-low abundance mutations, its performance is entirely dependent on the integrity of the pre-analytical workflow. Therefore, mastering pre-analytics is not merely a preliminary step but a fundamental component of robust ctDNA research and clinical application.
In molecular diagnostics and research, the accurate detection and quantification of nucleic acids are paramount. However, the presence of polymerase chain reaction (PCR) inhibitors in complex sample matrices presents a significant challenge, potentially leading to false-negative results and underestimation of target concentrations [49]. This challenge is particularly acute in fields such as cancer research (where circulating tumor DNA (ctDNA) can be a minute fraction of total cell-free DNA), wastewater-based epidemiology, and clinical microbiology where samples contain a diverse array of interfering substances [50] [49]. These inhibitors—including complex polysaccharides, lipids, proteins, metal ions, and humic acids—can interfere with PCR amplification through various mechanisms, such as inhibiting DNA polymerase activity, degrading or sequestering target nucleic acids, or chelating essential metal ions [49].
The fundamental difference in how quantitative PCR (qPCR) and digital PCR (dPCR) handle these inhibitors underpins the superior performance of dPCR in challenging matrices. While qPCR relies on the efficiency of amplification throughout thermal cycling to quantify targets relative to a standard curve, dPCR utilizes a partitioning-based approach that divides the reaction into thousands of individual endpoints, thereby conferring inherent tolerance to many inhibitors that affect amplification efficiency [8] [49]. This comparative analysis examines the experimental evidence demonstrating dPCR's enhanced resilience to PCR inhibitors and its implications for research and diagnostic applications.
Fundamental Principles: How dPCR Mitigates Inhibition
Divergent Quantification Methods and Inhibitor Impact
The core difference between qPCR and dPCR lies in their fundamental approaches to quantification. qPCR relies on monitoring amplification fluorescence in real-time, with quantification based on the cycle threshold (Cq) at which the signal crosses a predetermined threshold. This Cq value is then compared to a standard curve of known concentrations [2] [4]. The presence of inhibitors directly reduces amplification efficiency, leading to delayed Cq values and consequently underestimated target concentrations [49].
In contrast, dPCR partitions a sample into thousands to millions of individual reactions, with each partition containing either 0, 1, or a few target molecules. After endpoint amplification, the fraction of positive partitions is counted, and the absolute target concentration is calculated using Poisson statistics without requiring a standard curve [2] [10] [8]. This partitioning approach makes dPCR inherently more tolerant to inhibitors because it doesn't rely on amplification efficiency for quantification—only the binary outcome (positive/negative) of each partition matters [8] [49]. Even if inhibitors reduce amplification efficiency in some partitions, sufficient amplification typically occurs to correctly classify partitions as positive, preserving quantification accuracy [8].
The Researcher's Toolkit: Essential Reagent Solutions for Inhibition Challenges
Various reagent-based approaches have been developed to combat PCR inhibition, particularly for qPCR applications where sensitivity to inhibitors is greater. The table below summarizes key solutions used in research settings to enhance PCR performance in complex matrices.
Table 1: Research Reagent Solutions for Mitigating PCR Inhibition
| Solution | Function/Mechanism | Common Applications |
|---|---|---|
| T4 Gene 32 Protein (gp32) | Binds to humic acids and other inhibitory compounds, preventing their interaction with DNA polymerase [49]. | Wastewater analysis, environmental samples [49]. |
| Bovine Serum Albumin (BSA) | Competes with DNA polymerase for binding of inhibitors; stabilizes enzymatic activity [49]. | Fecal samples, plant extracts, forensic samples [49]. |
| Inhibitor Removal Kits | Column-based purification specifically designed to remove polyphenolic compounds, humic acids, and tannins [49]. | Wastewater, soil, food samples [49]. |
| Sample Dilution | Reduces inhibitor concentration below critical threshold; simplest but sensitivity-reducing approach [49]. | Universal approach for various sample types [49]. |
| Dimethyl Sulfoxide (DMSO) | Lowers DNA melting temperature, destabilizes secondary structures, and may disrupt inhibitor-enzyme interactions [49]. | GC-rich templates, clinical samples [49]. |
| Alternative DNA Polymerases | Engineered polymerases with enhanced resistance to specific inhibitor classes [49]. | Blood, soil, and plant samples [49]. |
Direct Comparative Evidence: dPCR vs. qPCR in Inhibitor-Rich Matrices
Wastewater Analysis: A Model Complex Matrix
Wastewater represents one of the most challenging matrices for molecular analysis due to its complex composition of inhibitory substances, including organic matter, metals, and chemicals from industrial and domestic sources [49]. A comprehensive 2024 study directly compared reverse transcription droplet digital PCR (RT-ddPCR) with RT-qPCR for SARS-CoV-2 detection in wastewater samples, evaluating eight different inhibition-mitigation strategies [49].
The research found that while inhibitory effects caused false negatives in RT-qPCR, the detection frequency of RT-ddPCR reached 100% in the same samples without specialized enhancement protocols [49]. When comparing viral concentrations measured by both methods, the optimized RT-qPCR assay showed good correlation with RT-ddPCR (Intraclass Correlation Coefficient: 0.713), but consistently produced lower quantitative measurements [49]. This systematic underestimation by qPCR demonstrates how even optimized protocols cannot fully compensate for inhibition effects in complex matrices.
Clinical Microbiology: Detecting Low-Abundance Targets
In clinical microbiology, dPCR has demonstrated superior performance for detecting and quantifying bacterial pathogens at low concentrations. A 2025 study comparing dPCR and qPCR for detecting periodontal pathobionts in subgingival plaque samples found that dPCR showed significantly lower intra-assay variability (median CV%: 4.5%) compared to qPCR [8].
Most notably, dPCR demonstrated superior sensitivity for detecting low bacterial loads, particularly for Porphyromonas gingivalis and Aggregatibacter actinomycetemcomitans [8]. Bland-Altman analysis revealed good agreement between the methods at medium to high bacterial loads, but significant discrepancies at low concentrations (< 3 log₁₀ Geq/mL), where qPCR produced false negatives and substantially underestimated pathogen prevalence [8]. This enhanced sensitivity for rare targets makes dPCR particularly valuable for early detection applications and monitoring minimal residual disease.
Probiotic Detection in Complex Fecal Matrices
A 2025 human clinical trial investigating multi-strain probiotic detection in fecal samples provided additional evidence of dPCR's advantages in complex biological matrices. The study compared qRT-PCR and ddPCR for detecting probiotic strains against a background of commensal gut bacteria [51].
The research found that while both methods performed comparably for higher abundance targets, ddPCR demonstrated a 10-100 fold lower limit of detection compared to qRT-PCR [51]. This enhanced sensitivity is particularly crucial for detecting low-abundance targets within complex microbial communities where background DNA and potential inhibitors may be present. The partitioning nature of ddPCR effectively reduced the impact of these interfering factors, enabling more reliable detection of specific bacterial strains at low concentrations.
Table 2: Comparative Performance of dPCR vs. qPCR in Inhibitor-Rich Matrices
| Study/Application | Key Findings | Implications |
|---|---|---|
| Wastewater Surveillance [49] | 100% detection frequency with ddPCR vs. false negatives with qPCR; consistent underestimation by qPCR. | ddPCR provides more reliable monitoring of community disease prevalence without extensive sample cleanup. |
| Periodontal Pathogen Detection [8] | dPCR showed lower variability (4.5% CV) and superior sensitivity for low bacterial loads; qPCR false negatives at <3 log₁₀ Geq/mL. | Enhanced detection of low-abundance pathogens enables earlier intervention and more accurate disease monitoring. |
| Probiotic Detection in Feces [51] | ddPCR demonstrated 10-100 fold lower limit of detection compared to qRT-PCR in complex fecal matrix. | Improved ability to track probiotic colonization and persistence in gastrointestinal studies. |
| ctDNA Analysis [50] [1] | dPCR enables detection of rare mutations in background of wild-type DNA; essential for liquid biopsy applications. | More reliable cancer monitoring and treatment response assessment through liquid biopsy. |
Experimental Approaches for Evaluating PCR Inhibition
Standardized Inhibition Assessment Protocols
Researchers have developed systematic approaches to evaluate and compare the inhibition tolerance of different PCR platforms. A standard method involves spiking known quantities of target nucleic acids into both clean (control) and inhibitor-containing samples, then comparing the measured concentrations [49]. Significant reductions in recovery efficiency indicate inhibition effects.
In wastewater studies, this typically involves processing samples through nucleic acid extraction protocols specifically designed for complex matrices, such as the Enviro Wastewater TNA Kit, followed by parallel analysis using both dPCR and qPCR platforms [52] [49]. The inclusion of exogenous controls helps monitor extraction efficiency and potential inhibition throughout the workflow [52].
Optimization Strategies for qPCR in Complex Matrices
For laboratories constrained to qPCR platforms, several inhibition-mitigation strategies have been systematically evaluated:
- Sample Dilution: A 10-fold dilution is commonly used to reduce inhibitor concentrations, though this also decreases sensitivity and may not eliminate inhibition entirely [49].
- Additive Enhancement: T4 gene 32 protein (at 0.2 μg/μl) and BSA have demonstrated significant effectiveness in restoring amplification in inhibited samples [49].
- Inhibitor Removal Kits: Commercial kits specifically designed to remove polyphenolic compounds, humic acids, and tannins can improve performance but add cost and processing time [49].
- Polymerase Selection: Inhibitor-resistant DNA polymerase formulations can provide varying degrees of protection against specific inhibitor classes [49].
Despite these optimization approaches, qPCR typically cannot match the inherent inhibition tolerance of dPCR, particularly for absolute quantification applications [49].
Application to ctDNA Research in Oncology
The superior inhibition tolerance of dPCR is particularly valuable in circulating tumor DNA (ctDNA) analysis for oncology research and clinical applications. ctDNA often represents only a small fraction (sometimes <0.1%) of total cell-free DNA in plasma, creating a demanding detection scenario where even minor inhibition effects can prevent detection [50] [1].
dPCR's ability to precisely quantify these rare mutation targets against an abundant wild-type background makes it ideally suited for liquid biopsy applications, including treatment response monitoring, minimal residual disease detection, and identifying emerging resistance mutations [10] [1]. While next-generation sequencing (NGS) offers broader genomic coverage, dPCR provides superior sensitivity for monitoring specific known mutations, especially in the critical low variant allele frequency range where inhibition effects are most problematic [50] [1].
The implementation of dPCR in regulated environments such as cell and gene therapy manufacturing further underscores its reliability, with platforms offering streamlined workflows, enhanced multiplexing capabilities, and compliance features suitable for quality control applications [53].
The evidence from multiple research domains consistently demonstrates the superior tolerance of dPCR to PCR inhibitors in complex matrices compared to traditional qPCR. This advantage stems from dPCR's fundamental partitioning approach, which transforms the quantification paradigm from efficiency-dependent measurements to binary endpoint detection and statistical analysis.
For researchers working with challenging sample types—whether wastewater, clinical specimens, forensic samples, or environmental matrices—dPCR offers more reliable quantification with reduced susceptibility to false negatives and quantitative underestimation. While optimization approaches can partially mitigate inhibition in qPCR, they cannot fully replicate the inherent resilience of the dPCR platform. As molecular diagnostics continues to expand into increasingly complex sample matrices, the inhibition-tolerant properties of dPCR will make it an increasingly indispensable tool for precise nucleic acid quantification.
The transition from quantitative PCR (qPCR) to digital PCR (dPCR) represents a fundamental shift in how researchers approach nucleic acid detection and quantification, particularly for challenging applications like circulating tumor DNA (ctDNA) analysis. While both technologies rely on similar core primer-probe chemistry, their operational principles dictate significant differences in optimization strategies, multiplexing capabilities, and performance outcomes. qPCR, a well-established workhorse in molecular biology, enables real-time monitoring of amplification through fluorescence accumulation, providing relative quantification against a standard curve [3]. In contrast, dPCR employs a partitioning approach that distributes the reaction across thousands of nanoscale reactions, allowing absolute quantification through endpoint detection and Poisson statistics [10] [3]. This methodological divergence creates distinct considerations for assay designers, especially when developing multiplex panels for complex applications in oncology, infectious disease monitoring, and biomarker validation where precision, sensitivity, and multiplexing efficiency directly impact research outcomes and clinical decision-making.
Core Technology Comparison: qPCR vs. dPCR
Table 1: Fundamental characteristics of qPCR and dPCR technologies
| Characteristic | Quantitative PCR (qPCR) | Digital PCR (dPCR) |
|---|---|---|
| Quantification Method | Relative (requires standard curve) | Absolute (direct molecule counting) |
| Detection Principle | Real-time fluorescence monitoring | Endpoint detection after partitioning |
| Dynamic Range | Wide (6-7 orders of magnitude) [3] | Narrower, excels at low concentrations [3] |
| Multiplexing Development | Requires extensive validation and efficiency matching [54] | Simplified due to endpoint detection [54] |
| Impact of Inhibitors | Sensitive to PCR inhibitors | Resistant due to partitioning [3] |
| Optimal Application Scope | High-throughput screening, gene expression with abundant targets | Rare variant detection, liquid biopsy, subtle fold changes |
The partitioning principle of dPCR fundamentally changes the approach to assay design. By dividing a single reaction into thousands of individual partitions, dPCR effectively creates a "digital" measurement system where targets are either present or absent in each compartment [10]. This physical separation minimizes competition between targets during amplification, a significant advantage in multiplex applications where primer-probe interactions typically complicate qPCR assay development [8] [54]. Additionally, because dPCR uses endpoint detection rather than real-time monitoring, it is less dependent on amplification efficiency matching between targets, thereby simplifying multiplex panel design and reducing optimization time [54].
Performance Comparison: Experimental Data
Sensitivity and Precision in Practical Applications
Recent studies directly comparing both technologies reveal distinct performance advantages depending on the application. In periodontal pathogen detection, a 2025 study demonstrated that multiplex dPCR showed high linearity (R² > 0.99) and significantly lower intra-assay variability (median CV%: 4.5%) compared to qPCR, with particular superiority in detecting lower bacterial loads [8]. The Bland-Altman plots from this study highlighted good agreement between technologies at medium/high target concentrations but notable discrepancies at low concentrations (< 3 log₁₀Geq/mL), where qPCR produced false negatives [8]. This enhanced sensitivity for low-abundance targets makes dPCR particularly valuable for ctDNA applications where tumor-derived DNA fragments represent a minute fraction of total cell-free DNA.
In virology research, a comparative study on infectious bronchitis virus detection found that while qPCR offered a wider quantification range, dPCR provided superior sensitivity and precision, with higher repeatability and reproducibility across technical replicates [55]. This precision advantage is particularly valuable for longitudinal monitoring of treatment response, where subtle changes in biomarker concentration have clinical significance.
Multiplexing Efficiency and Optimization
Multiplexing capabilities represent a critical differentiator between the two platforms. While both support multiplex detection, the underlying technologies impose different constraints and optimization requirements. dPCR's partitioning approach and endpoint detection make it inherently more suitable for multiplex applications, as it minimizes competitive inhibition between targets and eliminates the need for perfect amplification efficiency matching [54]. Research comparing singleplex and multiplex formats in both systems found that while qPCR successfully detected targets in multiplex format, it failed to identify statistically significant fold changes for low-abundance targets like BCL2, whereas dPCR maintained this capability with tighter error bars [54].
Table 2: Performance comparison for low-abundance target detection
| Performance Metric | qPCR Results | dPCR Results |
|---|---|---|
| BCL2 Fold Change Detection | Not statistically significant (ns) | 2.07-fold (significant) [54] |
| GADD45A Fold Change | 2.36-fold | 2.3-fold [54] |
| Precision for Low Targets | Reduced reproducibility for Cq >30 [54] | Higher precision; smaller error bars [54] |
| Multiplex BCL2 Detection | Not statistically significant (ns) | 2.03-fold (significant) [54] |
| Multiplex GADD45A Detection | 2.66-fold | 2.6-fold [54] |
A meta-analysis of circulating tumor HPV DNA detection across 36 studies further reinforced these findings, demonstrating progressively increasing sensitivity from qPCR to dPCR to next-generation sequencing platforms. The pooled sensitivity for ddPCR was significantly higher than qPCR (0.81 vs. 0.51, P < 0.001) across 1,056 patients, highlighting its utility for low-concentration target detection in complex matrices [56].
Experimental Protocols for Assay Validation
dPCR Multiplex Assay Development for ctDNA Detection
The development of a methylation-specific droplet digital PCR multiplex for lung cancer detection provides an exemplary protocol for robust dPCR assay design [41]. This approach utilized bioinformatic analysis of Illumina 450K methylation arrays to identify differentially methylated CpG sites with mean beta-value differences >0.5 between tumor and normal samples [41]. The experimental workflow followed a structured path:
For quality control, researchers implemented four validation parameters: (1) extraction efficiency evaluated with a spike-in DNA control (CPP1), (2) lymphocyte DNA contamination assessment using an immunoglobulin gene-specific assay, (3) total cfDNA concentration measurement with EMC7 65bp assay, and (4) high-molecular-weight DNA contamination evaluation with EMC7 250bp assay [41]. This comprehensive quality framework ensured the reliability of the resulting methylation data, particularly important for low-abundance ctDNA targets.
Comparative Performance Study Protocol
The 2025 study comparing dPCR and qPCR for periodontal pathogen detection established a rigorous methodological approach for technology comparisons [8]. Researchers analyzed subgingival plaque samples from 20 periodontitis patients and 20 healthy controls using both platforms with identical primer-probe sets targeting Porphyromonas gingivalis, Aggregatibacter actinomycetemcomitans, and Fusobacterium nucleatum [8]. The dPCR assays were performed using nanoplate-based microfluidic multiplex dPCR with the QIAcuity system, partitioning reactions into approximately 26,000 partitions [8]. Critical steps included:
- Thermal cycling: Initial denaturation at 95°C for 2 minutes, followed by 45 cycles of 15 seconds at 95°C and 1 minute at 58°C [8]
- Endpoint fluorescence imaging with channel-specific thresholds (30 RFU for A. actinomycetemcomitans, 40 RFU for P. gingivalis, 40 RFU for F. nucleatum) [8]
- Volume Precision Factor application to improve concentration calculation accuracy [8]
- For high-concentration samples (>10⁵ copies/reaction), two consecutive 10-fold dilutions prevented signal saturation [8]
Statistical analysis incorporated Mann-Whitney U tests, Wilcoxon tests, McNemar's tests, and Bland-Altman plots to comprehensively evaluate precision, accuracy, prevalence, sensitivity, specificity, and concordance between platforms [8].
Research Reagent Solutions for dPCR/qPCR Assays
Table 3: Essential reagents and their functions in PCR assay development
| Reagent/Category | Function/Purpose | Application Notes |
|---|---|---|
| Hydrolysis Probes (TaqMan) | Sequence-specific detection with fluorophore-quencher system | Compatible with both qPCR/dPCR; require efficiency validation for qPCR multiplexing [3] |
| Restriction Enzymes (e.g., PvuII) | Reduce background from complex samples | Used in dPCR to improve signal clarity [8] |
| Bisulfite Conversion Kits | Detect methylation patterns in ctDNA | Essential for epigenetic marker detection; requires optimized DNA input [41] |
| DNA Polymerase/Master Mix | Enzymatic amplification with optimized buffer systems | dPCR more tolerant of inhibitor variations [3] |
| Partitioning Oil/Surfactant | Create stable emulsion for ddPCR | Critical for droplet integrity during thermal cycling [10] |
| Reference Assays (e.g., EMC7) | Quality control for sample integrity | Assess total cfDNA and high-molecular-weight contamination [41] |
| Spike-in Controls (e.g., CPP1) | Monitor extraction efficiency | Essential for normalizing recovery in cfDNA studies [41] |
Implementation Workflow and Strategic Selection
The decision between qPCR and dPCR technologies hinges on specific application requirements, sample characteristics, and resource constraints. The following workflow diagram outlines a systematic approach for technology selection based on key experimental parameters:
For laboratories with access to both technologies, a hybrid approach leverages the strengths of each system: using qPCR for initial screening of large sample sets followed by dPCR for confirmation and precise quantification of significant findings [3]. This strategy optimizes both throughput and precision while managing operational costs. The compatibility of primer-probe chemistry between platforms, particularly when using pre-optimized assays, facilitates this integrated workflow without requiring extensive re-optimization [54].
The strategic selection between qPCR and dPCR technologies fundamentally shapes assay design parameters, particularly for primer-probe chemistry optimization and multiplexing capabilities. While qPCR remains the optimal choice for high-throughput applications with abundant targets and established reference standards, dPCR offers distinct advantages for complex multiplex panels, rare target detection, and absolute quantification requirements. The partitioning principle of dPCR reduces competitive inhibition between targets in multiplex reactions and diminishes the impact of amplification efficiency variations, thereby streamlining assay development workflows. For ctDNA research and other applications requiring maximal sensitivity and precision in complex matrices, dPCR's demonstrated performance advantages in detecting low-abundance targets make it an increasingly indispensable tool in the molecular researcher's arsenal. As both technologies continue to evolve, their complementary strengths will likely foster integrated approaches that maximize experimental flexibility and data quality across diverse research applications.
Circulating tumor DNA (ctDNA) consists of short, tumor-derived DNA fragments released into the bloodstream through apoptosis, necrosis, and active secretion from tumor cells [57] [1]. As a cornerstone of liquid biopsy, ctDNA carries tumor-specific genetic and epigenetic alterations, providing a minimally invasive source for genomic tumor characterization [58] [1]. The half-life of ctDNA is remarkably short, estimated between 16 minutes and several hours, enabling real-time monitoring of tumor dynamics and treatment response [1]. However, a significant challenge in ctDNA analysis is its low abundance in early-stage cancers or low-shedding tumors, where it can constitute less than 0.1% of total cell-free DNA (cfDNA) [1] [57]. This biological reality necessitates detection methods with exceptionally high sensitivity and precision, making the rigorous establishment of Limits of Detection (LOD) and Limits of Quantification (LOQ) critical analytical parameters for any clinically relevant ctDNA assay.
dPCR vs. qPCR: Fundamental Technological Differences
Digital PCR (dPCR) and quantitative real-time PCR (qPCR) are both essential tools in molecular diagnostics, but they operate on fundamentally different principles, which directly impacts their performance in detecting and quantifying rare targets like ctDNA.
qPCR is a relative quantification method that monitors the amplification of DNA in real-time using fluorescent dyes or probes. The cycle threshold (Ct) at which the fluorescence crosses a predetermined threshold is proportional to the initial amount of target DNA. This Ct value is compared to a standard curve of known concentrations to determine the quantity of the target in the sample [3]. While qPCR offers a wide dynamic range and high throughput, its reliance on a standard curve and its sensitivity to PCR inhibitors can affect accuracy and precision, particularly at very low target concentrations [3].
dPCR, considered the third generation of PCR technology, eliminates the need for a standard curve by employing absolute quantification [10]. The sample is partitioned into thousands to millions of individual reactions, so that each partition contains zero, one, or a few target molecules. Following end-point PCR amplification, the fraction of positive partitions is counted, and the original target concentration is calculated directly using Poisson statistics [10] [3]. This partitioning step minimizes the impact of PCR inhibitors and background DNA, making dPCR particularly powerful for detecting rare mutations and quantifying low-abundance targets within a complex background [3] [8].
Direct Performance Comparison for ctDNA Analysis
The distinct methodologies of dPCR and qPCR lead to significant differences in their analytical performance, especially in the context of ctDNA detection where sensitivity and precision at low concentrations are paramount.
Table 1: Fundamental Methodological Differences Between qPCR and dPCR
| Parameter | Quantitative PCR (qPCR) | Digital PCR (dPCR) |
|---|---|---|
| Quantification Principle | Relative (requires standard curve) | Absolute (direct molecule counting) |
| Data Output | Cycle threshold (Ct) | Target copies per volume (e.g., copies/µL) |
| Partitioning | No partitioning; bulk reaction | Sample divided into 1,000s of partitions |
| Sensitivity to Inhibitors | High | Lower (dilution effect in partitions) |
| Ideal Application | High-throughput screening, gene expression | Rare allele detection, absolute quantification |
Experimental data consistently demonstrates the superior performance of dPCR for low-abundance targets. A 2025 study comparing dPCR to qPCR for detecting periodontal pathogens—a relevant model for low-load detection—found that dPCR exhibited lower intra-assay variability (median CV%: 4.5%) than qPCR and superior sensitivity, enabling detection of lower bacterial loads that resulted in qPCR false negatives [8]. The Bland-Altman analysis in this study highlighted good agreement between the technologies at medium/high concentrations but significant discrepancies at low concentrations (< 3 log10Geq/mL), where qPCR consistently underestimated the prevalence [8].
Table 2: Analytical Performance Comparison for Low-Abundance Target Detection
| Performance Metric | qPCR | dPCR | Experimental Context |
|---|---|---|---|
| Sensitivity (LOD) | Limited for rare targets; can miss low-frequency variants [8] | Excellent; can detect single molecules [3] | Detection of A. actinomycetemcomitans; dPCR revealed 5-fold higher prevalence [8] |
| Precision | Higher intra-assay variability (significantly higher than dPCR, p=0.020) [8] | High precision; low intra-assay variability (median CV%: 4.5%) [8] | Analysis of subgingival plaque samples; dPCR showed superior reproducibility [8] |
| Quantification at Low Concentration | Inaccurate at very low levels; prone to false negatives [8] [3] | Accurate absolute quantification without a standard curve [3] | dPCR enabled precise quantification at concentrations where qPCR failed [8] |
| Tolerance to Inhibitors | Sensitive; impurities affect amplification efficiency [3] | Resistant; partitioning reduces inhibitor impact [3] | dPCR is preferred for challenging samples (e.g., fragmented DNA, crude extracts) [3] |
This performance advantage translates directly to ctDNA analysis. dPCR's partitioning principle improves precision, suitability for multiplex analyses, and the detection of low-abundant targets within a high background of other sequences in complex clinical samples [8]. This makes it particularly effective for detecting extremely low ctDNA concentrations, providing insights into early disease dynamics and minimal residual disease (MRD) [8] [1].
Establishing LOD and LOQ: Experimental Frameworks and Protocols
The establishment of LOD and LOQ is a systematic process requiring carefully designed experiments. The LOD is the lowest concentration at which an analyte can be detected with a stated probability, while the LOQ is the lowest concentration that can be quantified with acceptable precision and accuracy [8].
Experimental Protocol for LOD/LOQ Determination
A standard approach for establishing LOD and LOQ for ctDNA assays involves using serially diluted reference material in a wild-type background:
- Preparation of Standard Material: Synthesize or extract DNA fragments containing the target mutation (e.g., a specific KRAS variant). A wild-type genomic DNA background is used to mimic the patient sample matrix [41].
- Serial Dilution: Create a dilution series of the mutant DNA in the wild-type background to cover a range of allele frequencies (e.g., from 1% down to 0.01% or lower). The total DNA concentration should be kept constant across dilutions.
- Replicate Measurements: Analyze each dilution level with a high number of technical replicates (e.g., n ≥ 20) to ensure statistical robustness. This is crucial for characterizing variability at the limit of detection.
- Data Analysis:
- LOD Determination: The LOD is frequently defined as the lowest allele frequency at which ≥95% of replicates return a positive call. A positive call is typically based on a pre-defined threshold, such as the presence of at least three positive partitions in dPCR [8] or a Ct value below a certain limit in qPCR.
- LOQ Determination: The LOQ is the lowest concentration at which quantification meets predefined accuracy (e.g., ±25% of expected value) and precision (e.g., coefficient of variation ≤ 20-25%) criteria. The CV% is calculated from the quantified results of the replicate measurements at each dilution level.
Sample Quality Control and Pre-Analytical Considerations
For ctDNA analysis, the quality of the input cfDNA is paramount. Key quality control parameters assessed in dPCR workflows include [41]:
- Extraction Efficiency: Evaluated with a ddPCR assay targeting an exogenous spike-in DNA fragment (e.g., CPP1) added to the plasma before extraction.
- Contamination with Genomic DNA: Assessed using an immunoglobulin gene-specific ddPCR assay and by evaluating the ratio of long to short DNA fragments (e.g., using ddPCR assays amplifying 65 bp and 250 bp regions of a reference gene like EMC7).
- Total cfDNA Concentration: Determined using a reference gene assay (e.g., EMC7 65 bp).
Advanced ctDNA Applications: Pushing the Boundaries of Detection
The superior sensitivity of dPCR has enabled its application in some of the most challenging areas of oncology, where detecting minute amounts of ctDNA is critical.
In minimal residual disease (MRD) monitoring and early cancer detection, ctDNA levels can be exceedingly low. Here, dPCR-based assays, especially when targeting multiple markers, have shown significant promise. For instance, a 2025 study developed a methylation-specific droplet digital PCR (ddPCR) multiplex assay for lung cancer detection. The assay demonstrated ctDNA-positive rates of 38.7% and 46.8% (depending on the cut-off method) in non-metastatic disease, rising to 70.2% and 83.0% in metastatic cases [41]. This highlights dPCR's capability to detect tumor-derived DNA across a spectrum of tumor burden.
Furthermore, the use of multimodal approaches, which combine mutation analysis with epigenetic or fragmentomic signatures, is emerging as a powerful strategy to increase sensitivity. For example, integrating epigenomic signatures with genomic alterations has been shown to increase sensitivity for recurrence detection by 25–36% compared to genomic alterations alone [59]. dPCR is an ideal platform for validating such combined biomarkers in a targeted and cost-effective manner.
Table 3: Key Research Reagent Solutions for ctDNA Assay Development
| Reagent / Material | Function | Example in Context |
|---|---|---|
| cfDNA Extraction Kit | Isolation of high-quality, adapter-free cfDNA from plasma or other biofluids. | Using the DSP Circulating DNA Kit on automated systems like QIAsymphony SP ensures consistent yield and purity, critical for reliable LOD determination [41]. |
| Reference DNA Standards | Synthetic DNA fragments with known mutations and wild-type sequences for creating standard curves and spike-in controls. | Essential for preparing the serial dilutions used to empirically determine the LOD and LOQ of an assay [41]. |
| dPCR Master Mix | Optimized buffer containing DNA polymerase, dNTPs, and salts, formulated for efficient amplification in partitioned reactions. | The QIAcuity Probe PCR Kit is designed for use with nanoplate-based dPCR systems, ensuring robust amplification [8]. |
| Restriction Enzyme | Enzyme that digests long genomic DNA to reduce background and may improve partition efficiency. | The use of Anza 52 PvuII in dPCR reaction mixes helps to fragment potential contaminating long genomic DNA [8]. |
| Bisulfite Conversion Kit | Chemical treatment of DNA that converts unmethylated cytosines to uracils, allowing for the detection of methylation markers. | The EZ DNA Methylation-Lightning Kit is used in methylation-specific ddPCR assays to convert ctDNA before amplification [41]. |
The choice between dPCR and qPCR for ctDNA analysis is dictated by the required analytical performance, particularly the needed sensitivity and precision. For applications like MRD monitoring, early detection, and tracking low-frequency resistance mutations, where detecting ctDNA at allele frequencies below 0.1% is necessary, dPCR is the unequivocal leader due to its absolute quantification, superior sensitivity, and resilience to inhibitors. The establishment of rigorous LOD and LOQ parameters, following systematic experimental protocols, is non-negotiable for validating any ctDNA assay destined for clinical research or diagnostic use. While qPCR remains a powerful, cost-effective tool for higher-abundance targets, dPCR has firmly established itself as the gold-standard technology for pushing the limits of ctDNA detection and advancing the field of precision oncology.
Head-to-Head Performance: Analyzing Sensitivity, Precision, and Clinical Utility
The evolution of polymerase chain reaction (PCR) technology has fundamentally transformed molecular diagnostics, with digital PCR (dPCR) emerging as a powerful alternative to the long-established quantitative real-time PCR (qPCR). While qPCR has been the gold standard for nucleic acid detection due to its high throughput and cost-effectiveness, its reliance on standard curves for relative quantification and susceptibility to PCR inhibitors present significant limitations [2]. dPCR, through partitioning samples into thousands of individual reactions, enables absolute quantification of target molecules without external calibration, potentially offering enhanced analytical sensitivity and precision, particularly at low target concentrations [10]. This comparative analysis evaluates the performance of dPCR versus qPCR across viral and bacterial detection studies, focusing on analytical sensitivity in challenging low-abundance scenarios. The findings provide critical insights for researchers, scientists, and drug development professionals seeking optimal molecular tools for precise quantification in clinical diagnostics, environmental monitoring, and liquid biopsy applications.
Performance Comparison in Viral Detection
SARS-CoV-2 Detection in Clinical and Environmental Samples
The comparative sensitivity of dPCR and qPCR becomes particularly evident in the detection of SARS-CoV-2 in samples with low viral load. A 2025 study developing a droplet digital RT-PCR (RT-ddPCR) assay for SARS-CoV-2 variants demonstrated its superior capability in detecting the virus in wastewater samples, where viral concentrations are typically low. While both RT-ddPCR and RT-qPCR showed 86.49% positive rates for 148 clinical pharyngeal swab specimens with a high concordance rate (98.65%), their performance diverged significantly in environmentally challenging matrices [60].
In 50 wastewater samples with low viral load, the RT-ddPCR assay detected 50 positives for both N and S gene targets. In stark contrast, RT-qPCR only identified 21 samples with concurrent positivity for both targets, while 25 showed detection of only the S gene and 4 were negative for both targets [60]. This demonstrates dPCR's enhanced robustness against inhibitors and superior sensitivity for absolute quantification of SARS-CoV-2 variants in complex samples, making it particularly valuable for wastewater-based epidemiology and public health surveillance.
Table 1: Comparison of SARS-CoV-2 Detection in Wastewater Samples
| Method | Dual Gene Positive | Single Gene Positive | Dual Gene Negative | Detection Efficiency |
|---|---|---|---|---|
| RT-ddPCR | 50/50 (100%) | 0/50 (0%) | 0/50 (0%) | High |
| RT-qPCR | 21/50 (42%) | 25/50 (50%) | 4/50 (8%) | Moderate |
Respiratory Virus Detection During the 2023-2024 Tripledemic
A comprehensive comparison of dPCR and Real-Time RT-PCR during the 2023-2024 respiratory virus "tripledemic" evaluated their performance in detecting and quantifying influenza A, influenza B, RSV, and SARS-CoV-2 across different viral load categories stratified by cycle threshold (Ct) values [13]. The study analyzed 123 respiratory samples and found that dPCR demonstrated superior accuracy across multiple parameters, particularly for high viral loads of influenza A, influenza B, and SARS-CoV-2, and for medium loads of RSV [13].
The technical advantage of dPCR was most pronounced in quantifying intermediate viral levels, where it showed greater consistency and precision compared to Real-Time RT-PCR. This enhanced performance is attributed to dPCR's partitioning-based approach, which reduces the impact of inhibitors commonly found in respiratory matrices containing mucus and cellular debris that can differentially affect amplification efficiency in qPCR, resulting in inconsistent Ct values and reduced quantification reliability [13].
Table 2: Respiratory Virus Detection Performance Across Viral Load Categories
| Virus Type | High Viral Load (Ct ≤25) | Medium Viral Load (Ct 25.1-30) | Low Viral Load (Ct >30) |
|---|---|---|---|
| Influenza A | dPCR superior | Comparable | Comparable |
| Influenza B | dPCR superior | Comparable | Comparable |
| RSV | Comparable | dPCR superior | Comparable |
| SARS-CoV-2 | dPCR superior | Comparable | Comparable |
Performance Comparison in Bacterial Detection
Periodontal Pathobiont Quantification
A 2025 study comparatively evaluating a multiplex dPCR assay versus qPCR for simultaneous detection and quantification of periodontal pathobionts demonstrated dPCR's superior analytical performance in complex clinical samples [8]. The study analyzed subgingival plaque samples from 20 periodontitis patients and 20 healthy controls for three key periodontal bacteria: Porphyromonas gingivalis, Aggregatibacter actinomycetemcomitans, and Fusobacterium nucleatum.
dPCR showed significantly lower intra-assay variability (median CV%: 4.5%) than qPCR (p = 0.020), with comparable accuracy and agreement between the methods. Most notably, dPCR demonstrated superior sensitivity in detecting lower bacterial loads, particularly for P. gingivalis and A. actinomycetemcomitans [8]. Bland-Altman plots revealed good agreement between the methods at medium and high bacterial loads but significant discrepancies at low concentrations (< 3 log10Geq/mL), resulting in qPCR false negatives and a 5-fold underestimation of A. actinomycetemcomitans prevalence in periodontitis patients [8].
Probiotic Detection in Human Clinical Trials
Research comparing qRT-PCR and ddPCR for multi-strain probiotic detection after a randomized human clinical trial further validated dPCR's enhanced sensitivity advantages [51]. The study aimed to detect components of a multi-strain probiotic product from human fecal samples, comparing both methods through the lens of sensitivity and specificity for properly discerning true positives and true negatives.
While the two methods were found to be quite congruent, ddPCR demonstrated a 10-100 fold lower limit of detection compared to qRT-PCR [51]. This enhanced sensitivity is particularly valuable for detecting low-abundance targets within complex biological matrices like fecal samples, where background flora and PCR inhibitors can compromise assay performance. The study noted that despite all three assays in their detection panel performing well during optimization and validation, most of the sensitivity and specificity came from a single assay alone (Bifidobacterium animalis subsp. lactis Bl-04), highlighting the importance of rigorous validation when developing novel detection assays for complex samples [51].
Experimental Protocols and Methodologies
Digital PCR Workflow for Respiratory Virus Detection
The 2023-2024 tripledemic study employed a standardized dPCR protocol for respiratory virus detection [13]. RNA extraction was conducted using the KingFisher Flex system with the MagMax Viral/Pathogen kit. dPCR assays were performed on the QIAcuity platform using a five-target multiplex format with primer-probe mixes specific for Influenza A, Influenza B, RSV, SARS-CoV-2, and an internal control optimized to minimize cross-reactivity [13].
Samples were loaded into nanowell plates, partitioned into approximately 26,000 wells, and subjected to endpoint PCR. Fluorescent signals were detected and analyzed using QIAcuity Suite software, which calculated the absolute copy number of each target based on Poisson statistics. This partitioning approach enhances sensitivity by effectively concentrating low-abundance targets and reducing background noise [13].
Bacterial Detection Protocol in Periodontal Research
The periodontal pathobiont study employed nanoplate-based microfluidic multiplex dPCR assays using the QIAcuity Probe PCR Kit in 40 μL reaction mixtures [8]. Each reaction contained 10 µL of sample DNA, 10 µL of 4× Probe PCR Master Mix, 0.4 µM of each specific primer, 0.2 µM of each specific probe, 0.025 U/µL of the restriction enzyme Anza 52 PvuII, and nuclease-free water [8].
Reaction mixtures were prepared in pre-plates, transferred to the QIAcuity Nanoplate 26k 24-well plate, sealed, and loaded into the automated dPCR instrument QIAcuity Four. The thermocycling conditions consisted of initial DNA denaturation and enzyme activation for 2 min at 95°C, followed by 45 amplification cycles of 15 s at 95°C and 1 min at 58°C [8]. Data were analyzed using the QIAcuity Software Suite with DNA concentrations automatically calculated according to Poisson distribution principles, applying the Volume Precision Factor to improve concentration calculation accuracy.
Visualizing the dPCR Workflow and Sensitivity Advantage
The following diagram illustrates the fundamental workflow of digital PCR and its key advantage in low-abundance target detection:
The comparative sensitivity of dPCR versus qPCR across different application domains can be visualized as follows:
Essential Research Reagent Solutions
The following table details key reagents and instruments essential for implementing dPCR and qPCR assays in sensitivity comparison studies:
Table 3: Essential Research Reagent Solutions for PCR-Based Detection
| Product Category | Specific Examples | Application Function |
|---|---|---|
| Nucleic Acid Extraction Kits | QIAamp DNA Mini Kit, MagMax Viral/Pathogen Kit, RNeasy Mini Kit | Isolation of high-quality DNA/RNA from complex samples (clinical, environmental, bacterial) [60] [8] |
| dPCR Master Mixes | QIAcuity Probe PCR Kit, One-Step RT-ddPCR Advanced Kit for Probes, ddPCR Supermixes | Provide optimized reagents for partition-based amplification with fluorescence detection [60] [8] |
| qPCR Master Mixes | TaqMan Fast Advanced Master Mix, SYBR Fast mastermixes | Enable real-time fluorescence monitoring during amplification cycles [51] |
| dPCR Platforms | QIAcuity System, Bio-Rad QX200 | Automated partitioning, amplification, and imaging for absolute quantification [13] [51] |
| qPCR Instruments | CFX96 thermocycler, 7500FAST Real-Time PCR Systems | Thermal cycling with real-time fluorescence detection for relative quantification [13] [51] |
| Primer/Probe Sets | Target-specific designs (commercial panels or custom) | Specific recognition and amplification of target sequences (viral, bacterial, human) [13] [8] |
The direct comparison of analytical sensitivity between dPCR and qPCR consistently demonstrates dPCR's superior performance in detecting low viral loads and bacterial targets across diverse sample types. dPCR exhibits enhanced sensitivity (10-100 fold lower limit of detection), improved precision (significantly lower coefficients of variation), and greater robustness against PCR inhibitors present in complex matrices like wastewater, respiratory samples, and subgingival plaque [60] [8] [51].
These technical advantages make dPCR particularly valuable for applications requiring absolute quantification of low-abundance targets, including wastewater-based epidemiology, early pathogen detection, minimal residual disease monitoring via ctDNA analysis, and microbiome research. However, qPCR remains a viable option for high-throughput applications where extreme sensitivity is not critical, and cost-effectiveness is a primary consideration [2]. The selection between these technologies should be guided by specific research requirements, including target abundance, sample complexity, required precision, and operational constraints.
In the evolving landscape of molecular diagnostics, the precise quantification of nucleic acids has become paramount, especially in advanced applications like circulating tumor DNA (ctDNA) research. For years, quantitative real-time PCR (qPCR) has served as the cornerstone technique for nucleic acid quantification. However, the emergence of digital PCR (dPCR) represents a significant methodological shift, promising enhanced precision and reproducibility through its unique partitioning-based approach. This guide provides an objective, data-driven comparison of the intra-assay variability and performance characteristics of dPCR and qPCR technologies, drawing upon recent experimental evidence to inform researchers and drug development professionals in their platform selection for sensitive quantification tasks.
Fundamental Technological Principles
Quantitative PCR (qPCR)
qPCR, also known as real-time PCR, is a high-throughput technique that measures the amplification of DNA during the exponential phase of the reaction in a bulk solution [4]. It relies on fluorescent reporters (dyes or probes) to monitor amplification in real-time. Crucially, qPCR is a relative quantification method; determining the initial amount of target nucleic acid requires comparison to a standard curve generated from samples of known concentration [4] [14]. This dependency on a calibration curve introduces several potential sources of variability, as the accuracy of quantification is directly tied to the precision and consistency of the standard curve preparation [61].
Digital PCR (dPCR)
dPCR, the third generation of PCR technology, takes a fundamentally different approach [10]. The reaction mixture is partitioned into thousands to millions of individual nano-volume reactions before amplification. Following end-point thermocycling, each partition is analyzed as either positive (containing the target) or negative (not containing the target) [10] [9]. The absolute concentration of the target nucleic acid is then calculated directly using Poisson statistics, eliminating the need for a standard curve and providing inherent advantages in precision and absolute quantification [4] [10] [14].
Head-to-Head Performance Comparison
Intra-Assay Variability and Precision
Recent comparative studies provide compelling quantitative evidence of dPCR's superior precision, particularly evident in its lower intra-assay variability. A 2025 study directly comparing multiplex dPCR and qPCR for detecting periodontal pathobionts found that dPCR demonstrated significantly lower intra-assay variability, with a median coefficient of variation (CV%) of 4.5% compared to qPCR (p = 0.020) [8]. This enhanced precision is attributed to dPCR's partitioning principle, which minimizes competition between targets and reduces the impact of reaction inhibitors [8] [9].
Further supporting evidence comes from a bladder cancer study utilizing droplet digital PCR (ddPCR) for FRS2 gene copy number quantification, which reported exceptional precision with intra-assay CVs of 2.58% and inter-assay CVs of 2.68% at 20 ng input DNA [62]. Similarly, a qPCR assay for Spirometra mansoni detection demonstrated good reproducibility with CV < 5% [63], while a Carpione rhabdovirus qPCR assay showed intra-assay CVs ranging from 0.23% to 0.95% [64]. It should be noted that while these qPCR assays demonstrate good performance, the dPCR platforms consistently achieve lower variability, especially critical when detecting low-abundance targets.
Table 1: Comparative Analysis of Intra-Assay and Inter-Assay Variability
| Application/Context | Technology | Intra-Assay CV% | Inter-Assay CV% | Key Performance Metrics |
|---|---|---|---|---|
| Periodontal Pathobiont Detection [8] | Multiplex dPCR | Median: 4.5% | Not specified | Significantly lower than qPCR (p=0.020) |
| Periodontal Pathobiont Detection [8] | qPCR | Higher than dPCR | Not specified | Statistically significant difference (p=0.020) |
| FRS2 CNV in Bladder Cancer [62] | ddPCR | 2.58% (20 ng DNA) | 2.68% (20 ng DNA) | Excellent precision across input levels |
| FRS2 CNV in Bladder Cancer [62] | ddPCR | 3.75% (2 ng DNA) | 3.79% (2 ng DNA) | Maintained precision at low inputs |
| Spirometra mansoni Detection [63] | qPCR | <5% | <5% | Good reproducibility for quantitative detection |
| CAPRV2023 Virus Detection [64] | Two-step qPCR | 0.23-0.95% | 0.28-1.95% | Excellent repeatability |
| Protist Gene Copy Analysis [9] | QIAcuity ndPCR | 7-11% (oligos) | Not specified | Precise above LOQ threshold |
| Protist Gene Copy Analysis [9] | QX200 ddPCR | 6-13% (oligos) | Not specified | Highest precision at ~270 copies/μL |
Sensitivity and Limit of Detection
dPCR demonstrates particularly notable advantages in sensitivity, especially for low-abundance targets. In the periodontal pathobiont study, dPCR showed superior sensitivity in detecting lower bacterial loads, particularly for P. gingivalis and A. actinomycetemcomitans [8]. The Bland-Altman analysis revealed significant discrepancies at low concentrations (< 3 log10Geq/mL), where qPCR produced false negatives and substantially underestimated the prevalence of A. actinomycetemcomitans by 5-fold in periodontitis patients [8].
This enhanced sensitivity for rare targets stems from dPCR's ability to detect single molecules through partitioning, which effectively dilutes background noise and improves the signal-to-noise ratio [14]. While qPCR remains capable of high sensitivity (e.g., 2 copies/μL for the CAPRV2023 assay [64]), dPCR consistently outperforms at the lowest concentration ranges, making it particularly valuable for ctDNA research where tumor-derived DNA fragments may be extremely rare amidst wild-type DNA.
Accuracy and Dynamic Range
The fundamental difference in quantification approaches between the two technologies directly impacts their accuracy profiles. dPCR provides absolute quantification without requiring standard curves, making it less susceptible to variations in amplification efficiency and inhibitor effects [4] [10]. A 2025 comparison of dPCR platforms reported good accuracy with measured gene copy numbers consistently slightly lower than expected for both nanoplate-based and droplet-based systems (R²adj = 0.98-0.99) [9].
Conversely, qPCR's relative quantification approach is heavily dependent on the quality and consistency of standard curves. A comprehensive 2025 evaluation of RT-qPCR standard curve variability found significant inter-assay variability across different viral targets, despite acceptable efficiency rates (>90%) [61]. For instance, the N2 gene of SARS-CoV-2 showed particularly high variability (CV 4.38-4.99%) with the lowest efficiency (90.97%) among tested targets [61]. This variability necessitates including standard curves in every experiment to maintain reliable quantification [61].
Regarding dynamic range, qPCR generally maintains an advantage for high-throughput applications with wide concentration ranges, while dPCR excels in precision at low to medium concentrations but can experience saturation effects at high target concentrations [8] [9].
Table 2: Comprehensive Performance Characteristics Comparison
| Performance Parameter | Digital PCR (dPCR) | Quantitative PCR (qPCR) |
|---|---|---|
| Quantification Method | Absolute (Poisson statistics) | Relative (standard curve dependent) |
| Precision at Low Targets | Superior (CV% ~2.5-4.5%) [8] [62] | Moderate to good (CV% <5% achievable) [63] [64] |
| Sensitivity/LOD | Superior for low-abundance targets [8] [14] | Good (2-15 copies/μL demonstrated) [64] |
| Impact of Inhibitors | Reduced susceptibility [8] [9] | More susceptible [61] |
| Multiplexing Capability | Improving, with recent advances [8] [14] | Well-established, high capability [14] |
| Throughput | Moderate, improving with newer systems [10] | High, well-suited for large sample numbers [4] [14] |
| Cost Considerations | Higher per sample, specialized equipment [10] | Lower per sample, widely available equipment [14] |
| Standard Curve Requirement | Not required [4] [10] | Required for quantification [61] [4] |
| Best Application Fit | Rare variant detection, absolute quantification, low target abundance [8] [62] [14] | High-throughput screening, gene expression, relative quantification [4] [14] |
Experimental Protocols & Methodologies
Representative dPCR Protocol for Gene Quantification
The following detailed methodology is adapted from the FRS2 copy number variation study in bladder cancer research, illustrating standard procedures for precise dPCR assays [62]:
Sample Preparation and DNA Extraction:
- Source: Formalin-fixed paraffin-embedded (FFPE) bladder cancer tissues or urine sediments from healthy controls.
- Extraction Kits: TIANamp Genomic DNA Kit (DP304) for cell lines/urine sediments; FFPE DNA Kit (DP330) for tissue samples.
- Quality Assessment: NanoDrop OneC spectrophotometer for concentration and purity measurement.
- Storage: -80°C until analysis.
dPCR Reaction Setup:
- System: DropXpert S6 droplet digital PCR system.
- Reaction Volume: 20-40 μL standard reaction mixtures.
- Reaction Components: 1× ddPCR Supermix, target and reference primers (900 nM final concentration each), target and reference probes (250 nM final concentration), and DNA template.
- Partitioning: Pipette reaction mixture into C4 chips, seal with pressure-permeable caps.
Thermocycling Conditions:
- Reverse transcription (if needed): 50°C for 10 minutes.
- Initial denaturation: 95°C for 10 minutes.
- Amplification: 40 cycles of:
- Denaturation: 95°C for 10 seconds
- Annealing/Extension: 58°C for 45 seconds
- Signal stabilization: 4°C hold.
- End-point detection: Automated droplet reading and analysis.
Data Analysis:
- Calculation: FRS2 amplification ratio = FRS2 copy number / RPP30 reference gene copy number.
- Threshold Determination: Based on negative controls and fluorescence amplitude plots.
- Quality Control: Minimum reliable input DNA determined to be 2 ng (CV% <5%) [62].
Representative qPCR Protocol with Validation
This protocol exemplifies a high-performance qPCR assay developed for CAPRV2023 virus detection, demonstrating optimal validation procedures [64]:
Primer and Probe Design:
- Target: Conserved G protein-coding sequences of CAPRV2023.
- Validation: BLAST analysis against NCBI database to ensure specificity.
- Probe Labeling: 5' end with 6-carboxyfluorescein (FAM), 3' end with Black Hole Quencher 1 (BHQ1).
Standard Curve Preparation:
- Plasmid Construction: 740-bp target fragment cloned into pCE3 Blunt Vector.
- Quantification: NanoDrop One/OneC microspectrophotometer (136 ng/μL = ~4.98 × 10¹⁰ copies/μL).
- Dilution Series: Ten-fold serial dilutions from 10⁹ to 2 copies/μL.
- Verification: Sanger sequencing of inserted fragment.
qPCR Optimization and Validation:
- Instrument: LightCycler 96 qPCR Detection System.
- Reaction Conditions:
- Initial denaturation: 95°C for 60 seconds
- 40 cycles: 95°C for 10 seconds, 55°C for 30 seconds (optimized temperature)
- Concentration Optimization:
- Primers: 0.2-1.0 μM tested (optimal: 0.4 μM)
- Probe: 62.5-250 nM tested (optimal: 125 nM)
- Specificity Testing: Against related viral pathogens (VHSV, SCRV, SVCV, IHNV).
- Sensitivity Determination: Limit of detection established at 2 copies/μL.
- Precision Assessment: Intra-assay (0.23-0.95%) and inter-assay (0.28-1.95%) CV% [64].
The Scientist's Toolkit: Essential Research Reagents
Table 3: Key Research Reagent Solutions for dPCR and qPCR Applications
| Reagent/Instrument | Function/Purpose | Example Applications |
|---|---|---|
| QIAcuity Nanoplate 26k | Partitioning of dPCR reactions into ~26,000 nanoscale chambers [8] | Multiplex detection of periodontal pathobionts [8] |
| DropXpert S6 System | Droplet generation and analysis for ddPCR [62] | FRS2 copy number quantification in bladder cancer [62] |
| TaqMan Fast Virus 1-Step Master Mix | Integrated reverse transcription and qPCR in single tube [61] | Viral detection in wastewater epidemiology [61] |
| QIAamp DNA Mini Kit | DNA extraction from clinical samples [8] | Bacterial DNA isolation from subgingival plaque [8] |
| TIANamp Genomic DNA Kit | Genomic DNA extraction from various sources [62] | DNA preparation from urine sediments and cell lines [62] |
| Anza Restriction Enzymes | DNA digestion to improve target accessibility [8] [9] | Enhanced precision in gene copy number analysis [9] |
| NanoDrop Spectrophotometers | Nucleic acid concentration and purity assessment [62] [64] | Quality control of DNA/RNA extracts [62] [64] |
| LightCycler 96 System | High-performance qPCR instrumentation [64] | CAPRV2023 detection and quantification [64] |
The comparative analysis of intra-assay variability between dPCR and qPCR reveals a clear technological distinction with significant implications for research and clinical applications. dPCR demonstrates superior precision, particularly for low-abundance targets, with consistently lower coefficients of variation (CV% ~2.5-4.5%) compared to qPCR [8] [62]. This enhanced reproducibility, coupled with absolute quantification without standard curves and reduced susceptibility to inhibitors, positions dPCR as the preferred technology for applications demanding the highest precision, such as ctDNA analysis, rare mutation detection, and liquid biopsy applications [8] [62] [14].
Conversely, qPCR maintains important advantages in throughput, cost-effectiveness, and established workflows, making it ideal for high-volume screening applications where extreme sensitivity is less critical [4] [14]. The choice between these technologies should be guided by specific application requirements, with dPCR offering clear advantages for precision-critical, low-abundance quantification tasks, while qPCR remains the workhorse for high-throughput relative quantification. As both technologies continue to evolve, researchers can leverage their complementary strengths to advance molecular diagnostics and personalized medicine.
The quantification of circulating tumor DNA (ctDNA) represents a critical challenge and opportunity in modern precision oncology. At the heart of this challenge lies the "standard curve dilemma"—the fundamental choice between absolute quantification methods that require no calibration and relative quantification approaches that depend on reference standards. This comparison guide objectively examines how digital PCR (dPCR) and quantitative real-time PCR (qPCR) address this dilemma, with significant implications for result accuracy in ctDNA research. We present experimental data demonstrating that dPCR's standard curve-free absolute quantification provides superior precision for low-abundance targets, while qPCR offers practical advantages for high-throughput applications. Within the broader thesis of dPCR versus qPCR for ctDNA quantification, this analysis provides researchers, scientists, and drug development professionals with evidence-based guidance for selecting appropriate quantification methodologies based on specific research requirements.
The polymerase chain reaction (PCR) has evolved through three generations: conventional PCR, quantitative real-time PCR (qPCR), and digital PCR (dPCR). Each generation has brought distinct approaches to nucleic acid quantification, with the standard curve emerging as a central point of differentiation [10]. In qPCR, quantification relies on constructing a standard curve from samples of known concentration, then comparing the cycle threshold (Ct) values of unknown samples against this curve to determine their concentration [65]. This relative quantification approach introduces potential variability through curve preparation and amplification efficiency differences [3].
The emergence of dPCR has fundamentally challenged this paradigm by introducing absolute quantification without standard curves [66]. By partitioning samples into thousands of individual reactions and applying Poisson statistics to count positive partitions, dPCR enables direct quantification of target molecules [10]. This methodological distinction carries profound implications for ctDNA research, where accurately quantifying rare mutations in a background of wild-type DNA is essential for cancer monitoring, treatment response assessment, and minimal residual disease detection [59] [1].
Fundamental Principles: Absolute vs. Relative Quantification
Relative Quantification with qPCR
Relative quantification in qPCR establishes a ratio between the amounts of a target gene and a reference gene (typically a housekeeping gene present in all samples) [65]. This method focuses on determining expression changes relative to the reference gene, which must remain stable across different experimental conditions. The process involves amplifying both target and reference genes from the same sample, either separately or together in duplex real-time PCR, to generate normalized values for cross-sample comparison [65].
Key characteristics of relative quantification:
- Requires stable reference genes for normalization
- Depends on standard curves for quantification
- Measures fold-changes rather than absolute copy numbers
- Vulnerable to variations in amplification efficiency between samples
Absolute Quantification with dPCR
Absolute quantification measures the exact amount of a target, expressed as copy number or concentration, without reference to standards or normalizing genes [65]. Digital PCR achieves this through sample partitioning, where a PCR mixture is distributed across thousands of individual compartments so that each contains zero, one, or a few target molecules [66]. After endpoint amplification, the fraction of positive partitions is counted, and Poisson statistics are applied to calculate the absolute target concentration [10].
Key characteristics of absolute quantification:
- Provides exact copy numbers without standard curves
- Uses Poisson statistics for concentration calculations
- Enabled by partitioning technology in dPCR
- Offers direct measurement rather than relative comparison
The following diagram illustrates the fundamental workflow differences between these two quantification approaches:
Comparative Performance Data
Quantitative Method Comparison
Table 1: Performance characteristics of qPCR versus dPCR for nucleic acid quantification
| Performance Metric | qPCR | dPCR |
|---|---|---|
| Quantification Type | Relative (requires standard curve) | Absolute (no standard curve) [3] |
| Sensitivity for Rare Targets | Limited for targets <0.1% | Excellent, detects targets as low as 0.001% [67] |
| Precision at Low Concentrations | Higher variability | Lower variation among replicates [68] |
| Dynamic Range | Wide (6-7 orders of magnitude) [3] | Narrower, excels at low concentrations [3] |
| Impact of PCR Inhibitors | Sensitive, affects amplification efficiency [3] | Resistant, partitioning reduces inhibitor effects [3] |
| Cost per Reaction | $1-3 [3] | $5-10 [3] |
| Throughput | High (96- or 384-well plates) [3] | Lower, limited by partitioning process [3] |
Experimental Evidence in ctDNA Research
Recent studies directly comparing qPCR and dPCR methodologies provide compelling evidence for their respective strengths and limitations. A 2025 study investigating mitochondrial DNA quantification in avian biological samples found that while qPCR, dPCR, and ddPCR all reliably quantified mitochondrial DNA in samples with moderate abundance, significant differences emerged when analyzing low-level targets [68]. In blood samples with typically low levels of mtDNA, ddPCR consistently showed lower variation among replicates, demonstrating superior precision for low-abundance targets [68].
The limits of detection (LOD) and quantification (LOQ) further highlight the sensitivity advantage of digital methods. When using synthetic DNA targets to calculate these parameters, both dPCR and ddPCR demonstrated lower LOD and LOQ values compared to qPCR [68]. This enhanced sensitivity is particularly valuable in ctDNA applications, where tumor-derived DNA often represents a small fraction of total cell-free DNA, especially in early-stage cancers or minimal residual disease monitoring [59].
In clinical oncology research, dPCR has demonstrated exceptional performance for liquid biopsy applications. Its ability to detect mutant allele frequencies as low as 0.001% enables researchers to monitor circulating tumor DNA with high sensitivity, supporting applications including therapeutic response assessment, residual tumor burden quantification, and resistance mechanism identification [67]. This sensitivity advantage stems from dPCR's partitioning approach, which effectively enriches rare targets by separating them from abundant wild-type sequences [67].
Methodologies: Experimental Protocols for ctDNA Quantification
qPCR Protocol for Relative Quantification
Sample Preparation and Standard Curve Generation:
- Extract ctDNA from plasma using silica membrane-based spin columns or magnetic bead-based methods optimized for fragment recovery [30].
- Prepare serial dilutions of standardized control material (plasmid DNA, PCR fragments, or genomic DNA) with known copy numbers [65].
- Amplify standards and unknown samples in separate wells using target-specific primers and probes [65].
- Generate standard curve by plotting CT values against the logarithm of standard concentrations [65].
Amplification and Analysis:
- Perform real-time PCR amplification with fluorescence detection at each cycle.
- Determine CT values for unknown samples when fluorescence crosses the threshold.
- Calculate concentrations by comparing sample CT values to the standard curve [65].
- Normalize results using reference genes to account for sample-to-sample variation [65].
dPCR Protocol for Absolute Quantification
Sample Partitioning and Amplification:
- Prepare PCR mixture containing sample, primers, probes, and master mix [10].
- Partition reaction into thousands of individual droplets or microchambers using microfluidic technology [66].
- Perform endpoint PCR amplification to amplify target molecules within partitions [10].
- Analyze fluorescence in each partition to identify positive (target-present) and negative (target-absent) reactions [66].
Quantification via Poisson Statistics:
- Count positive and negative partitions using fluorescence detection systems.
- Apply Poisson correction to account for multiple targets per partition using the formula: λ = -ln(1 - p), where λ is the average number of targets per partition and p is the proportion of positive partitions [66].
- Calculate absolute concentration based on partition volume and dilution factors [10].
- Report results as copies per microliter without reference to standard curves [3].
The following workflow diagram illustrates the specific application of these methods for ctDNA analysis in cancer research:
The Scientist's Toolkit: Essential Research Reagents and Materials
Table 2: Key research reagent solutions for ctDNA quantification studies
| Reagent/Material | Function | Considerations |
|---|---|---|
| EDTA Blood Collection Tubes | Prevents coagulation and preserves ctDNA [30] | Preferred over heparin tubes (interferes with PCR) |
| Cell-Stabilizing Blood Collection Tubes | Inhibits leukocyte lysis and gDNA release [30] | Enables sample stability for up to 48 hours |
| Silica-Membrane Extraction Kits | Isolates ctDNA from plasma [30] | Optimized for recovery of short DNA fragments |
| Magnetic Bead-Based Extraction Systems | Automated ctDNA purification [30] | Efficient for small fragment recovery |
| TaqMan Probes | Sequence-specific detection in qPCR/dPCR [3] | Hydrolysis chemistry provides high specificity |
| Digital PCR Chips/Cartridges | Enables sample partitioning [10] | Platform-specific (microchambers vs. droplets) |
| Unique Molecular Identifiers | Reduces sequencing artifacts in NGS [1] | Critical for error correction in low-frequency variants |
The standard curve dilemma presents researchers with a fundamental methodological choice that significantly impacts the accuracy and applicability of ctDNA quantification results. This comparison demonstrates that the selection between absolute quantification (dPCR) and relative quantification (qPCR) depends largely on the specific research context and requirements.
For applications demanding high sensitivity for rare targets, absolute quantification through dPCR offers distinct advantages, particularly for low-abundance ctDNA detection in early-stage cancers or minimal residual disease monitoring. The elimination of standard curves reduces variability and provides direct copy number quantification, enabling more precise tracking of tumor dynamics over time. However, this approach carries higher costs and lower throughput limitations.
Conversely, relative quantification via qPCR remains a versatile and cost-effective solution for higher concentration targets and high-throughput applications where extreme sensitivity is less critical. The established methodology, wide dynamic range, and lower operational costs make qPCR suitable for large-scale screening studies and expression analysis.
In the evolving landscape of ctDNA research, many laboratories are adopting a hybrid approach, leveraging the complementary strengths of both technologies. This integrated strategy typically employs qPCR for initial screening and dPCR for confirmatory analysis of low-frequency mutations, thereby optimizing both resource allocation and analytical precision. As ctDNA continues to transform precision oncology, understanding the implications of the standard curve dilemma remains essential for generating accurate, reliable data that advances both research and clinical applications.
In the era of precision medicine, the accurate quantification of nucleic acids has become a cornerstone for both basic research and clinical diagnostics. For years, quantitative real-time PCR (qPCR) has been the established workhorse for gene expression analysis, pathogen detection, and routine molecular screening. However, the emergence of digital PCR (dPCR) as a third-generation technology presents researchers with a powerful alternative for applications demanding absolute quantification and superior sensitivity, particularly in the challenging field of circulating tumor DNA (ctDNA) analysis [59] [1]. The strategic choice between these two platforms is not a matter of one being universally superior, but rather of aligning the technology's strengths with specific research objectives and analytical requirements [69].
This guide provides an objective, data-driven comparison of qPCR and dPCR performance. It is designed to equip researchers, scientists, and drug development professionals with the evidence needed to make an informed strategic selection for their nucleic acid quantification projects, with a specific focus on the demands of ctDNA research.
Fundamental Principles and Workflows
The core difference between qPCR and dPCR lies in their method of quantification. qPCR is a bulk reaction that relies on monitoring the amplification of target DNA in real-time against a standard curve to determine relative or absolute concentration. In contrast, dPCR is a partitioning-based method that dilutes the sample into thousands of individual reactions, applies end-point PCR, and uses Poisson statistics to provide absolute quantification without the need for a standard curve [70] [69].
The following diagram illustrates the key procedural and analytical differences between the two workflows:
Performance Comparison: Quantitative Data
The theoretical advantages of dPCR translate into measurable performance differences, as evidenced by recent comparative studies. The following tables summarize key quantitative metrics critical for experimental design.
Table 1: Comparative Analytical Performance of qPCR and dPCR
| Performance Parameter | qPCR | dPCR | Supporting Experimental Evidence |
|---|---|---|---|
| Sensitivity (Detection Limit) | Mutation rate >1% [69] | Mutation rate ≥0.1% [69] | Superior sensitivity for low-level bacterial loads in periodontal disease [8] |
| Precision / Variability | Higher intra-assay variability (p=0.020) [8] | Lower intra-assay variability (median CV%: 4.5%) [8] | dPCR showed significantly lower variability in pathogen quantification [8] |
| Accuracy & Agreement | Good agreement at medium/high concentrations [8] | Good agreement at medium/high concentrations; excels at low concentrations [8] | Bland-Altman plots showed discrepancies for qPCR at low concentrations [8] |
| Dynamic Range | Broad dynamic range [69] | Broad dynamic range, but may require sample dilution at high concentrations [8] [69] | Samples with >105 target copies require dilution in dPCR to avoid saturation [8] |
| Tolerance to Inhibitors | Lower tolerance; impacted by PCR efficiency [69] | Higher tolerance; less affected by PCR efficiency [69] | Partitioning minimizes inhibitor effects in complex clinical samples [8] [69] |
Table 2: Comparative Diagnostic Performance in Clinical Applications (Meta-Analysis Data)
| Disease & Sample Type | Technology | Sensitivity | Specificity | Area Under ROC Curve (AUC) | Source |
|---|---|---|---|---|---|
| Extrapulmonary Tuberculosis | qPCR | - | - | 0.94 | [70] |
| Extrapulmonary Tuberculosis | ddPCR | - | - | 0.97 (p=0.0020) | [70] |
| Pulmonary Tuberculosis | qPCR | 0.66 (0.60-0.71) | 0.98 (0.97-0.99) | ~0.94* | [70] |
| Pulmonary Tuberculosis | ddPCR | 0.56 (0.53-0.58) | 0.97 (0.96-0.98) | ~0.94* | [70] |
| Localized Rectal Cancer (Baseline ctDNA) | NGS (HS1 panel) | 36.6% detection rate | - | - | [21] |
| Localized Rectal Cancer (Baseline ctDNA) | Tumor-informed ddPCR | 58.5% detection rate (p=0.00075) | - | - | [21] |
Note: AUC values for pulmonary tuberculosis were similar between technologies, though the meta-analysis reported a higher overall AUC for ddPCR [70].
Experimental Protocols from Featured Studies
To ensure the reliability of the data presented, the key methodological details from several pivotal comparative studies are outlined below.
- Objective: Simultaneously detect and quantify Porphyromonas gingivalis, Aggregatibacter actinomycetemcomitans, and Fusobacterium nucleatum in subgingival plaque.
- Sample: Subgingival plaque from 20 periodontitis patients and 20 healthy controls.
- dPCR Method: Nanoplate-based multiplex dPCR (QIAcuity Four, Qiagen) using a 24-well nanoplate (∼26,000 partitions/well).
- Reaction Mix: 40 µL containing 10 µL sample DNA, 10 µL 4× Probe PCR Master Mix, 0.4 µM of each primer, 0.2 µM of each probe (FAM, HEX, Cy5), 0.025 U/µL restriction enzyme, and nuclease-free water.
- Thermocycling: 2 min at 95°C; 45 cycles of 15 s at 95°C and 1 min at 58°C.
- Imaging & Analysis: End-point fluorescence imaging on three channels. Data analyzed with QIAcuity Software Suite v2.5.0.1, applying Poisson statistics and a Volume Precision Factor.
- Objective: Compare ddPCR (QX200, Bio-Rad) and plate-based dPCR (Absolute Q, Thermo Fisher) for ctDNA analysis.
- Sample: 5 mL of baseline plasma from 46 early-stage breast cancer patients.
- Workflow Comparison: The ddPCR system involved manual droplet generation and reading, while the Absolute Q system featured an integrated, automated plating and reading process.
- Analysis: Both systems were used to analyze the same samples for known mutations. Concentrations and mutant allele frequencies (MAF) were compared, showing >90% concordance in ctDNA positivity.
- Objective: Compare tumor-informed ddPCR and a tumor-uninformed NGS panel for detecting ctDNA in localized rectal cancer.
- Sample: Pre-therapy plasma and tumor samples from 41 patients (development group).
- Tumor Analysis: Primary tumor tissue sequenced using an Ion AmpliSeq Cancer Hotspot Panel v2 to identify patient-specific mutations.
- ctDNA Detection (ddPCR): 2-9 µL of extracted cfDNA partitioned into ∼20,000 droplets. Used 1-2 custom probes targeting the highest VAF mutations from tumor NGS.
- ctDNA Detection (NGS): The same HS1 panel was used on plasma cfDNA, with the variant calling threshold lowered to 0.01% VAF.
- Result: ddPCR demonstrated a significantly higher detection rate (58.5%) compared to the NGS panel (36.6%).
The Scientist's Toolkit: Essential Research Reagent Solutions
Successful implementation of either qPCR or dPCR relies on a foundation of high-quality reagents and consumables. The following table details key solutions used in the featured experiments.
Table 3: Key Research Reagent Solutions for qPCR and dPCR
| Item | Function / Description | Example Use Case |
|---|---|---|
| Streck Cell-Free DNA BCT Tubes | Blood collection tubes that stabilize nucleated blood cells and prevent background cfDNA release, preserving the integrity of the ctDNA profile. | Used for pre-operative blood collection in rectal cancer ctDNA studies [21]. |
| QIAamp DNA Mini Kit (Qiagen) | Silica-membrane based technology for efficient purification of genomic DNA from various sample types, including subgingival plaque. | DNA extraction from subgingival plaque samples for periodontal pathogen quantification [8]. |
| TaqMan Hydrolysis Probes (FAM/HEX/Cy5) | Sequence-specific, double-quenched oligonucleotide probes that increase assay specificity and enable multiplexing in both qPCR and dPCR. | Multiplex detection of three periodontal pathogens in a single dPCR well [8]. |
| QIAcuity Nanoplate 26k (Qiagen) | A microfluidic plate containing etched channels that automatically partition a PCR reaction into tens of thousands of nanoliter-sized volumes. | Enabled fully automated partitioning and analysis in the periodontal pathobiont study [8]. |
| Ion AmpliSeq Cancer Hotspot Panel v2 | A targeted NGS panel designed to amplify hotspot regions of 50 genes frequently mutated in human cancers, suitable for low-input DNA from tumor biopsies. | Used to identify patient-specific mutations in rectal tumor tissue to inform ddPCR assay design [21]. |
| Unique Molecular Identifiers (UMIs) | Short random nucleotide sequences added to each DNA molecule during NGS library prep to tag and track original molecules, correcting for PCR errors and duplicates. | Integrated into quantitative NGS (qNGS) methods for absolute ctDNA quantification, improving accuracy [71] [11]. |
Decision Matrix and Visual Selection Guide
The choice between qPCR and dPCR is ultimately dictated by the specific needs of the research project. The following decision matrix visualizes the optimal technology selection based on two primary factors: the required sensitivity and the need for absolute quantification.
This guide synthesizes current evidence to empower your strategic choice. By aligning your research objectives with the demonstrated strengths and limitations of each platform, you can ensure that your selection of qPCR or dPCR is both data-driven and project-appropriate.
Conclusion
The choice between dPCR and qPCR for ctDNA quantification is not a matter of one technology being universally superior, but rather of selecting the right tool for the specific research question. dPCR excels in scenarios demanding the utmost sensitivity and absolute quantification without a standard curve, making it indispensable for detecting minimal residual disease, rare mutations, and for precise copy number variation analysis. Conversely, qPCR remains a powerful, cost-effective workhorse for high-throughput screening of more abundant targets and routine genotyping. The future of ctDNA analysis in precision oncology will likely see a complementary use of both technologies, alongside next-generation sequencing. As standardization improves and costs decrease, dPCR is poised to become even more central in clinical trial design and routine monitoring, ultimately accelerating the development of personalized cancer therapies and improving patient outcomes.
References
- 1. Circulating tumor DNA to monitor treatment response in ... [https://www.nature.com/articles/s41698-025-00876-y]
- 2. Quantitative or digital PCR? A comparative analysis for ... [https://www.sciencedirect.com/science/article/abs/pii/S0165993624001584]
- 3. Digital PCR vs. Real-Time PCR: Understanding the Key ... [https://www.labmanager.com/digital-pcr-vs-real-time-pcr-understanding-the-key-differences-33665]
- 4. Digital PCR (dPCR) vs Real-Time PCR (qPCR) [https://firalismolecularprecision.com/2025/04/09/dpcr-qpcr-differences/]
- 5. The Reasonable Range of Ct Values in qPCR Experiments [https://www.yeasenbio.com/blogs/molecular-biology/the-reasonable-range-of-ct-values-in-qpcr-experiments]
- 6. Understanding Ct Values in Real-Time PCR [https://www.thermofisher.com/blog/behindthebench/understanding-ct-values/]
- 7. The mathematics of qRT-PCR in virology [https://virologyresearchservices.com/2025/01/13/the-mathematics-of-qrt-pcr-in-virology/]
- 8. Digital PCR outperforms quantitative real-time PCR for the ... [https://pmc.ncbi.nlm.nih.gov/articles/PMC12288185/]
- 9. Comparing the precision of two digital PCR applications for ... [https://www.nature.com/articles/s41598-025-13143-8]
- 10. Digital PCR: from early developments to its future application ... [https://pubs.rsc.org/en/content/articlehtml/2025/lc/d5lc00055f]
- 11. Absolute Quantification of Nucleotide Variants in Cell-Free ... [https://www.mdpi.com/2072-6694/17/5/783]
- 12. How Digital PCR Enables Early Molecular Relapse Detection [https://www.thermofisher.com/blog/behindthebench/early-molecular-relapse-detection-dpcr/]
- 13. Comparative Performance of Digital PCR and Real-Time RT ... [https://pmc.ncbi.nlm.nih.gov/articles/PMC12474457/]
- 14. The Difference Between qPCR and dPCR, And Their Best ... [https://www.linkedin.com/pulse/difference-between-qpcr-dpcr-best-applications-allsheng-i7h0c]
- 15. Performance Comparison of Droplet Digital PCR and Next- ... [https://pubmed.ncbi.nlm.nih.gov/40346007/]
- 16. Duplex digital PCR assay on microfluidic chamber arrays ... [https://www.nature.com/articles/s41598-025-17392-5]
- 17. Research trends and prospects of Circulating tumor DNA ... [https://pmc.ncbi.nlm.nih.gov/articles/PMC12360996/]
- 18. Circulating Tumor DNA (ctDNA) Market Size 2025 to 2034 [https://www.precedenceresearch.com/circulating-tumor-dna-market]
- 19. The prognostic and clinical utility of circulating tumor DNA ... [https://www.nature.com/articles/s41698-025-01174-3]
- 20. qPCR vs. dPCR: Which Technology is Right for Your Lab? [https://avam.com/avam-articles/qpcr-vs-dpcr-which-technology-is-right-for-your-lab/]
- 21. Performance Comparison of Droplet Digital PCR and Next ... [https://pmc.ncbi.nlm.nih.gov/articles/PMC12062871/]
- 22. Circulating tumour DNA (ctDNA) as a predictor of ... [https://www.sciencedirect.com/science/article/pii/S2950195425001572]
- 23. Precision performance of Crystal Digital PCR vs. quantitative PCR | Stilla Technologies [https://www.stillatechnologies.com/digital-pcr/naica-system-analysis/precision-performance-of-crystal-digital-pcr-vs-quantitative-pcr/]
- 24. Comparative study of droplet-digital PCR and absolute Q digital PCR for ctDNA detection in early-stage breast cancer patients - ScienceDirect [https://www.sciencedirect.com/science/article/pii/S0009898123004758]
- 25. Use of ctDNA in early breast cancer: analytical validity and ... [https://www.nature.com/articles/s41523-024-00653-3]
- 26. Improvement of the sensitivity of circulating tumor DNA-based ... [https://pmc.ncbi.nlm.nih.gov/articles/PMC12332530/]
- 27. The Clinical Utility of Droplet Digital PCR for Profiling ... [https://pmc.ncbi.nlm.nih.gov/articles/PMC9776872/]
- 28. Minimal residual disease detection by mutation-specific ... [https://pmc.ncbi.nlm.nih.gov/articles/PMC10225364/]
- 29. Application of droplet digital PCR in minimal residual ... [https://www.nature.com/articles/s41598-024-57016-y]
- 30. Circulating tumor DNA laboratory processes and clinical ... [https://www.frontiersin.org/journals/oncology/articles/10.3389/fonc.2025.1520733/full]
- 31. ddPCR Overcomes the CRISPR-Cas13a-Based Technique ... [https://pmc.ncbi.nlm.nih.gov/articles/PMC11507125/]
- 32. Digital PCR for Rare Mutation Detection [https://www.thermofisher.com/us/en/home/life-science/pcr/digital-pcr/mutation-detection.html]
- 33. Single-Color Digital PCR Provides High-Performance ... [https://pmc.ncbi.nlm.nih.gov/articles/PMC6593258/]
- 34. Comparison of Digital PCR and Quantitative PCR with ... [https://pmc.ncbi.nlm.nih.gov/articles/PMC9705847/]
- 35. - High real-time throughput -based PCR without DNA... genotyping [https://bmcresnotes.biomedcentral.com/articles/10.1186/1756-0500-5-573]
- 36. Therapeutic Monitoring of Circulating DNA Mutations in ... [https://pmc.ncbi.nlm.nih.gov/articles/PMC7031679/]
- 37. Monitoring and Assessment of Circulating Tumor DNA in ... [https://pmc.ncbi.nlm.nih.gov/articles/PMC12550271/]
- 38. Advantage of Next-Generation Sequencing in Dynamic ... [https://www.sciencedirect.com/science/article/pii/S1936523318305576]
- 39. Comparative analysis of EGFR mutations in circulating ... [https://www.nature.com/articles/s41598-025-85160-6]
- 40. Comparison of digital PCR systems for the analysis ... [https://www.sciencedirect.com/science/article/pii/S0009898123000414]
- 41. Development and validation of a methylation-specific ... [https://www.nature.com/articles/s41598-025-15228-w]
- 42. Detection of circulating tumor DNA in colorectal cancer ... [https://pubmed.ncbi.nlm.nih.gov/41239188/]
- 43. Up-front mutation detection in circulating tumor DNA by ... [https://www.sciencedirect.com/science/article/pii/S1936523322002480]
- 44. Evaluation of automatic cell free DNA extraction metrics ... [https://www.nature.com/articles/s41598-025-03508-4]
- 45. Comparison of Blood Collection Tubes from Three Different ... [https://www.sciencedirect.com/science/article/pii/S1525157817302040]
- 46. Impact of Long-Term Plasma Storage on Cell-Free DNA ... [https://pmc.ncbi.nlm.nih.gov/articles/PMC12292636/]
- 47. Cell-Free DNA (cfDNA) Blood Collection Tube Market ... [https://finance.yahoo.com/news/cell-free-dna-cfdna-blood-162700509.html]
- 48. Optimization of bile preparation for liquid biopsy in ... [https://www.nature.com/articles/s41598-025-96170-9]
- 49. Evaluation of PCR-enhancing approaches to reduce ... [https://www.sciencedirect.com/science/article/abs/pii/S0048969724069250]
- 50. Circulating Tumor DNA detection in cancer - PubMed Central [https://pmc.ncbi.nlm.nih.gov/articles/PMC12450317/]
- 51. Comparison of qRT-PCR and ddPCR for multi-strain ... [https://www.frontiersin.org/journals/microbiology/articles/10.3389/fmicb.2025.1579797/full]
- 52. One Assay, Nine Targets: Advancing Viral Surveillance ... [https://pmc.ncbi.nlm.nih.gov/articles/PMC12529474/]
- 53. dPCR vs. ddPCR: Why Precision Matters in Cell and Gene ... [https://www.roslinct.com/insights/dpcr-vs-ddpcr/]
- 54. qPCR vs. ddPCR: Which Is Best for You? [https://www.bioradiations.com/qpcr-vs-ddpcr-assays-select-the-best-gene-expression-analysis-method-for-your-application1125/]
- 55. Comparison of quantitative PCR and digital PCR assays ... [https://www.sciencedirect.com/science/article/pii/S0166093423001842]
- 56. Comparing the Diagnostic Performance of Quantitative ... [https://pmc.ncbi.nlm.nih.gov/articles/PMC10918646/]
- 57. Circulating Tumor DNA—A Novel Biomarker of Tumor ... [https://pmc.ncbi.nlm.nih.gov/articles/PMC9775401/]
- 58. Integrating Circulating Tumor DNA into Clinical ... [https://www.mdpi.com/2072-6694/17/15/2520]
- 59. A Review of Circulating Tumor DNA (ctDNA) and the Liquid ... [https://pmc.ncbi.nlm.nih.gov/articles/PMC12032849/]
- 60. Droplet digital RT-PCR method for SARS-CoV-2 variants ... [https://www.frontiersin.org/journals/microbiology/articles/10.3389/fmicb.2025.1635733/full]
- 61. The Impact of the Variability of RT-qPCR Standard Curves ... [https://pmc.ncbi.nlm.nih.gov/articles/PMC12029521/]
- 62. Droplet digital PCR assay for precise determination of FRS2 ... [https://bmccancer.biomedcentral.com/articles/10.1186/s12885-025-14611-0]
- 63. Development of PCR, qPCR and LAMP methods for the ... [https://www.sciencedirect.com/science/article/pii/S2405676625000381]
- 64. One-step and two-step qPCR assays for CAPRV2023 [https://www.frontiersin.org/journals/veterinary-science/articles/10.3389/fvets.2025.1620997/full]
- 65. | Absolute Quantification qPCR Relative Quantification qPCR [https://www.qiagen.com/us/knowledge-and-support/knowledge-hub/bench-guide/pcr/pcr-quantification/pcr-quantification]
- 66. : A Technology Review dPCR [https://pubmed.ncbi.nlm.nih.gov/29677144/]
- 67. Digital PCR Applications | Thermo Fisher Scientific - BI [https://www.thermofisher.com/bi/en/home/life-science/pcr/digital-pcr/applications.html]
- 68. Assessing reliability and accuracy of qPCR , dPCR and ddPCR for... [https://pmc.ncbi.nlm.nih.gov/articles/PMC11995889/]
- 69. dPCR vs qPCR [https://www.qiagen.com/us/applications/digital-pcr/beginners/dpcr-vs-qpcr]
- 70. Droplet digital PCR vs. quantitative real time ... [https://pmc.ncbi.nlm.nih.gov/articles/PMC10440704/]
- 71. Real-World Technical Hurdles of ctDNA NGS Analysis [https://pmc.ncbi.nlm.nih.gov/articles/PMC12564474/]