Liquid Biopsy in Oncology: A Comprehensive Review of Clinical Applications, Technical Advances, and Future Directions
This article provides a comprehensive analysis of liquid biopsy's transformative role in oncology, tailored for researchers and drug development professionals.
Liquid Biopsy in Oncology: A Comprehensive Review of Clinical Applications, Technical Advances, and Future Directions
Abstract
This article provides a comprehensive analysis of liquid biopsy's transformative role in oncology, tailored for researchers and drug development professionals. It covers the foundational principles and core biomarkers, including circulating tumor DNA (ctDNA), circulating tumor cells (CTCs), and extracellular vesicles. The scope extends to detailed methodologies, current clinical applications in therapy selection, treatment monitoring, and minimal residual disease (MRD) detection. It also addresses key technical challenges, optimization strategies, and a critical evaluation of analytical validation and comparative performance of emerging assays and platforms, synthesizing the latest research and clinical trial data to inform future development.
The Foundation of Liquid Biopsy: Core Biomarkers and Evolving Clinical Paradigms
Liquid biopsy represents a transformative approach in oncology, enabling the analysis of tumor-derived components from biological fluids rather than requiring solid tissue samples. This technique isolates and analyzes circulating tumor biomarkers, providing critical diagnostic, prognostic, and predictive information for cancer management [1]. As a minimally invasive procedure, liquid biopsy addresses fundamental limitations of traditional tissue biopsy, particularly concerning tumor heterogeneity and the dynamic monitoring of treatment response [2] [3]. The molecular profiling of tumors through liquid biopsy has demonstrated enhanced efficacy in selecting tailored cancer treatments, assessing patient responses, identifying drug resistance mechanisms, and monitoring tumor recurrence [2]. Within the broader context of oncology research, liquid biopsy provides unprecedented opportunities to track cancer evolution in real-time, enabling precision medicine approaches that adapt to the changing molecular landscape of malignancies.
Key Biomarkers in Liquid Biopsy
Liquid biopsy encompasses the analysis of multiple tumor-derived components, each offering unique insights into tumor biology and clinical applications.
Circulating Tumor Cells (CTCs)
CTCs are cells released from primary and metastatic tumors that enter the peripheral circulation [1]. First identified in 1869 by Thomas Ashworth, CTCs represent a rare cell population in blood, with approximately one CTC found per million leukocytes [1]. Despite their low abundance and short half-life (typically 1-2.5 hours in peripheral blood), CTCs provide vital information about cancer biology, particularly in the metastatic process [1]. The detection and enumeration of CTCs have demonstrated prognostic significance across multiple cancer types, with higher counts correlating with reduced progression-free and overall survival [1]. The CellSearch system remains the only FDA-cleared method for CTC enumeration in metastatic breast, colorectal, and prostate cancers [1].
Circulating Tumor DNA (ctDNA)
CtDNA comprises fragmented DNA molecules released into the bloodstream through tumor cell apoptosis or necrosis [1]. These fragments typically range from 20-50 base pairs and constitute approximately 0.1-1.0% of total cell-free DNA (cfDNA) in cancer patients [1]. The short half-life of ctDNA (approximately 2 hours) enables real-time monitoring of tumor dynamics [2]. CtDNA analysis can identify various genomic alterations, including point mutations, copy number alterations, and epigenetic modifications such as DNA methylation patterns that often precede tumor formation [2] [1]. In 2014, the European Medicines Agency authorized ctDNA testing for EGFR mutations in non-small cell lung cancer, marking a significant milestone in clinical adoption [1].
Extracellular Vesicles (EVs) and Other Biomarkers
Tumor-derived extracellular vesicles, including exosomes, represent membrane-bound particles containing proteins, nucleic acids, and lipids that facilitate intercellular communication [2]. These vesicles play significant roles in preparing pre-metastatic niches and modulating therapeutic responses [2]. Additional liquid biopsy biomarkers include tumor-educated platelets (TEPs), which are platelets that have been altered by interactions with cancer cells, displaying changes in their RNA and protein profiles [2], and various forms of circulating RNA (cfRNA) including microRNA [1].
Table 1: Comparison of Major Liquid Biopsy Biomarkers
| Biomarker | Origin | Average Abundance | Half-Life | Primary Applications |
|---|---|---|---|---|
| CTCs | Shed from primary/metastatic tumors | 1 CTC per 10^6 leukocytes [1] | 1-2.5 hours [1] | Prognostic assessment, metastasis research, drug resistance studies |
| ctDNA | Tumor cell apoptosis/necrosis | 0.1-1.0% of total cfDNA [1] | ~2 hours [1] | Mutation detection, treatment monitoring, MRD assessment |
| EVs/Exosomes | Active secretion from cells | Variable | Unknown | Intercellular communication, biomarker discovery, drug resistance mechanisms |
| Tumor-Educated Platelets | Platelets interacting with tumors | Variable | Normal platelet lifespan | Cancer diagnostics, tumor progression monitoring |
Technical Methodologies and Experimental Protocols
Sample Collection and Processing
Proper sample collection and processing represent critical pre-analytical steps that significantly impact liquid biopsy results. For blood-based liquid biopsies, 10-20 mL of peripheral blood is typically collected in specialized tubes containing stabilizers to prevent degradation of target analytes [4]. The PAXgene Blood ccfDNA Tube is commonly employed for this purpose [4]. Processing involves sequential centrifugation steps: initial centrifugation at 1900×g for 15 minutes at room temperature to separate plasma from blood cells, followed by a second centrifugation at 1900×g for 10 minutes to remove remaining cellular debris [4]. The resulting plasma is stored at -80°C until nucleic acid extraction. For cfDNA extraction, kits such as the QIAamp Circulating Nucleic Acid Kit are widely utilized, typically yielding 5-50 ng of cfDNA per mL of plasma depending on tumor burden [4].
Analytical Platforms for ctDNA Mutation Detection
Multiple highly sensitive technologies have been developed to detect rare mutations in ctDNA against a background of wild-type DNA.
Digital PCR (dPCR) provides absolute quantification of target molecules through sample partitioning into thousands of individual reactions [4]. For HER2 amplification detection, dPCR reaction mixtures typically contain 5.8 μL cfDNA sample (approximately 5 ng input), 7.25 μL dPCR Master Mix, and 1.45 μL HER2 amplification detection solution [4]. Thermal cycling conditions include initial denaturation at 96°C for 10 minutes, followed by 39 amplification cycles [4]. The quantification of HER2 and reference gene copy numbers enables calculation of amplification ratios, with a reported detection limit of 2.36 copies per diploid genome and coefficient of variance between 2-3% [4].
Next-Generation Sequencing (NGS) platforms offer comprehensive mutational profiling across multiple genes simultaneously. These methods include tagged-amplicon deep sequencing (Safe-SeqS), cancer personalized profiling by deep sequencing (CAPP-Seq), and targeted error correction sequencing (TEC-Seq) [3]. The minimal recommended sequencing depth for ctDNA analysis is 10,000x coverage to reliably detect variants at 0.1% allele frequency [3].
Real-Time PCR with Advanced Detection Systems, particularly the Amplification Refractory Mutation System (ARMS/SCORPION), enables highly sensitive detection of known mutations by co-amplifying an endogenous control gene alongside target mutations [3].
Table 2: Analytical Performance of Key ctDNA Detection Technologies
| Technology | Sensitivity | Multiplexing Capacity | Turnaround Time | Primary Clinical Utility |
|---|---|---|---|---|
| Digital PCR | ~0.01%-0.1% [4] | Low (1-5 plex) | 1-2 days | Known mutation tracking, amplification detection |
| Next-Generation Sequencing | ~0.01%-0.1% [3] | High (50-500+ genes) | 7-14 days | Comprehensive profiling, novel mutation discovery |
| ARMS/Scorpions RT-PCR | ~0.1%-1% [3] | Moderate (5-20 plex) | 1-2 days | Rapid detection of known actionable mutations |
| BEAMing | ~0.01% [1] | Moderate | 3-5 days | Ultra-sensitive mutation detection |
CTC Isolation and Characterization Techniques
CTC isolation methodologies leverage either physical properties (size, density, deformability) or biological characteristics (surface protein expression).
Immunomagnetic Separation utilizes antibody-coated magnetic beads targeting epithelial cell adhesion molecule (EpCAM) to capture CTCs from blood samples [1]. The CellSearch system employs this methodology as the FDA-cleared standard for CTC enumeration [1].
Microfluidic Platforms offer advanced CTC capture through laminar flow and specialized chip architectures that increase surface area and interaction efficiency between CTCs and capture antibodies [1]. These systems demonstrate improved recovery rates and purity compared to conventional methods.
Size-Based Filtration techniques exploit the larger size and reduced deformability of CTCs compared to hematopoietic cells, using membrane filters with precise pore sizes (typically 6-8 μm) to isolate CTCs [1].
Clinical Applications and Validation Data
Concordance with Tissue Biopsy
Multiple studies have evaluated the concordance between liquid biopsy and traditional tissue biopsy, with varying agreement rates depending on cancer type, stage, and analytical platform. In a study of 224 advanced breast cancer patients with paired tissue and plasma samples, the overall concordance between digital PCR HER2 amplification testing in plasma and IHC/FISH in tissue was 66.96% [4]. The sensitivity between dPCR in plasma and IHC/FISH in tissue samples was 43.75%, while specificity was 84.38% [4]. Importantly, concordance varied significantly by disease stage, with sensitivity improving in advanced disease: 37.93% for stage III, 41.67% for stage IV, and 51.61% for recurrent cancer [4]. This pattern reflects the correlation between tumor burden and ctDNA shedding.
Monitoring Treatment Response and Resistance
Liquid biopsy enables dynamic monitoring of treatment response through serial sampling. In 2008, Diehl et al. used BEAMing technology to track ctDNA in 18 colorectal cancer patients, demonstrating that mutation rates in ctDNA (including TP53, APC, KRAS, and PIK3CA) changed during treatment and correlated positively with both tumor burden and CEA concentration [1]. Similar applications have been established for EGFR mutation testing in NSCLC, where emerging mutations in ctDNA can identify resistance mechanisms such as T790M mutations up to several months before clinical progression [3].
Minimal Residual Disease (MRD) and Early Detection
The exceptional sensitivity of modern liquid biopsy platforms enables detection of minimal residual disease following curative-intent treatment. Large prospective studies such as CIRCULATE-Japan are evaluating ctDNA for early recurrence detection and adjuvant therapy guidance [3]. For early cancer detection, multi-cancer early detection (MCED) tests analyze methylation patterns in cfDNA to identify cancer signals from multiple cancer types simultaneously, with the PATHFINDER study demonstrating feasibility of this approach [3].
Table 3: Key Clinical Trials Advancing Liquid biopsy Applications
| Trial Name | Location | Primary Focus | Key Findings/Objectives |
|---|---|---|---|
| TRACERx | UK | Tracking cancer evolution in NSCLC | ctDNA can detect drug resistance and monitor tumor progression [3] |
| CIRCULATE-Japan | Japan | MRD detection in colorectal cancer | Using ctDNA to detect early recurrences and guide therapeutic decisions in adjuvant setting [3] |
| PATHFINDER | Multi-national | Multi-cancer early detection | Evaluating feasibility and implementation of MCED testing in clinical practice [3] |
| US Clinical Trials (Gov.) | USA | Immunotherapy and liquid biopsy | 20 recruiting and 5 not-yet-recruiting trials targeting immunotherapy response monitoring [2] |
The Scientist's Toolkit: Essential Research Reagents
Table 4: Essential Research Reagents for Liquid Biopsy Workflows
| Reagent/Kit | Manufacturer | Primary Function | Application Notes |
|---|---|---|---|
| PAXgene Blood ccfDNA Tubes | Qiagen | Blood collection and stabilization of cell-free DNA | Prevents degradation of cfDNA during storage and transport [4] |
| QIAamp Circulating Nucleic Acid Kit | Qiagen | Extraction of cell-free nucleic acids from plasma | High-sensitivity recovery of low-abundance ctDNA [4] |
| CellSearch CTC Kit | Menarini Silicon Biosystems | Enumeration of circulating tumor cells | FDA-cleared system for CTC counting in metastatic breast, colorectal, and prostate cancers [1] |
| HER2 Amplification Detection Kit | Questgenomics | Digital PCR detection of HER2 amplifications | Used with ProFlex 2X Flat PCR System; detection limit of 2.36 copies [4] |
| BEAMing Reagents | -- | Beads, Emulsion, Amplification, Magnetics | Ultra-sensitive mutation detection down to 0.01% variant allele frequency [1] |
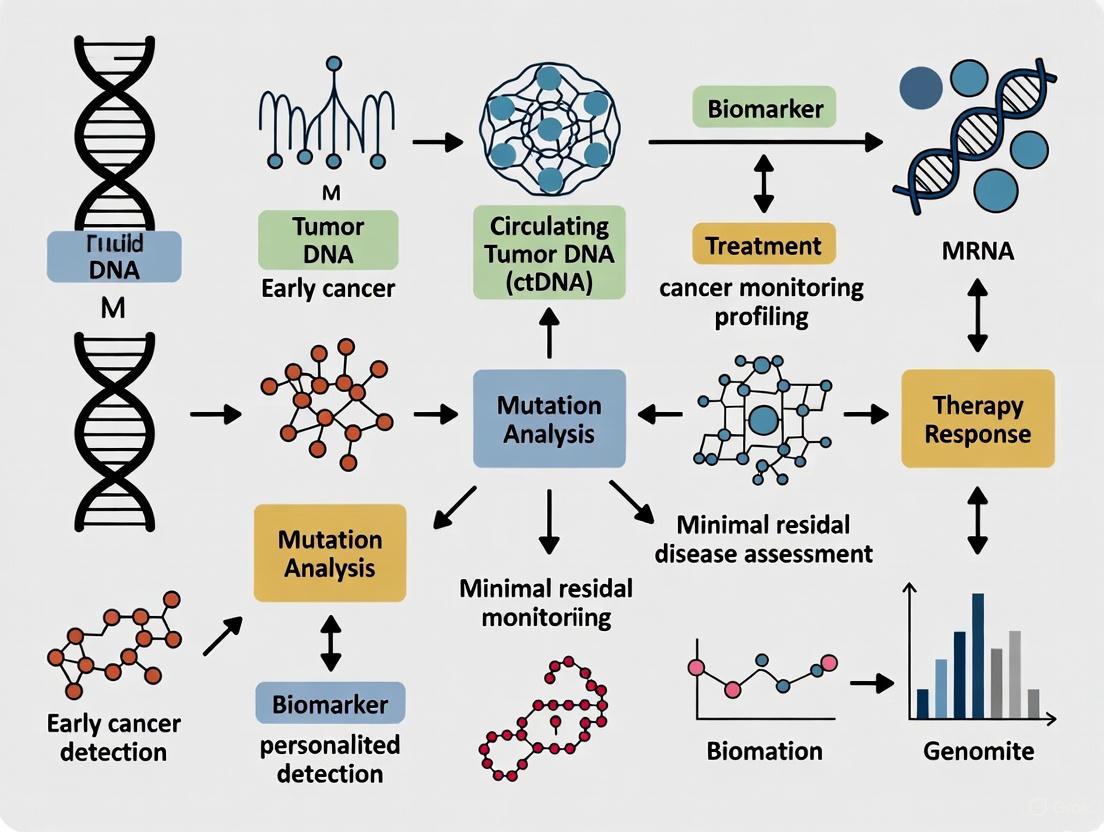
Visualizing Liquid Biopsy Workflows and Applications
Liquid Biopsy Analysis Workflow
Clinical Applications of Liquid Biopsy
Liquid biopsy has emerged as an indispensable tool in modern oncology research and clinical practice, providing a minimally invasive window into tumor biology. By enabling repeated sampling and real-time monitoring of tumor evolution, this approach addresses critical limitations of traditional tissue biopsy, particularly concerning spatial and temporal heterogeneity [2] [3]. The complementary analysis of multiple biomarkers—CTCs, ctDNA, EVs, and TEPs—offers researchers and clinicians a comprehensive molecular portrait of malignancies [2] [1]. While analytical standardization and validation remain ongoing challenges, the rapid integration of liquid biopsy into clinical trials and cancer management guidelines underscores its transformative potential [1] [3]. As technological innovations continue to enhance sensitivity and multiplexing capabilities, liquid biopsy is poised to accelerate the development of personalized cancer therapies and improve patient outcomes across the cancer care continuum.
Liquid biopsy has emerged as a transformative approach in oncology, enabling non-invasive detection and monitoring of cancer through the analysis of circulating biomarkers in bodily fluids. This whitepaper provides a comprehensive technical overview of four key analytes—circulating tumor DNA (ctDNA), circulating tumor cells (CTCs), extracellular vesicles (EVs), and tumor-educated platelets (TEPs)—that are reshaping cancer research and drug development. We examine the biological origins, isolation methodologies, detection technologies, and research applications for each analyte, highlighting their complementary roles in understanding tumor heterogeneity, monitoring treatment response, and identifying mechanisms of drug resistance. The integration of these biomarkers through multi-analyte approaches, augmented by artificial intelligence and advanced sequencing technologies, promises to unlock new frontiers in precision oncology and therapeutic development.
Cancer remains a leading cause of mortality worldwide, with tumor heterogeneity and metastasis representing significant challenges for effective treatment. Liquid biopsy has emerged as a powerful non-invasive alternative to traditional tissue biopsies, providing real-time insights into tumor dynamics and evolution [1]. By analyzing tumor-derived components in blood and other bodily fluids, researchers can obtain a comprehensive picture of the tumor's molecular landscape, overcoming the limitations of spatial and temporal sampling inherent in tissue biopsies [2] [5]. The four analytes covered in this whitepaper—ctDNA, CTCs, EVs, and TEPs—each offer unique perspectives on tumor biology and together form a complementary toolkit for oncology research and drug development. This technical guide examines the characteristics, methodologies, and research applications of these analytes within the broader context of advancing precision medicine in oncology.
Circulating Tumor DNA (ctDNA)
Origin and Characteristics
Circulating tumor DNA (ctDNA) refers to fragmented DNA molecules derived from tumor cells that circulate in the bloodstream. These fragments are released into circulation through various mechanisms, including apoptosis, necrosis, and active secretion from tumor cells [6]. ctDNA typically ranges from 160-200 base pairs in length, corresponding to nucleosome-associated DNA fragments, and comprises approximately 0.01% to 90% of the total cell-free DNA (cfDNA) in cancer patients [7]. The half-life of ctDNA is relatively short, ranging from 15 minutes to 2.5 hours, making it an excellent biomarker for real-time monitoring of tumor dynamics [7]. ctDNA carries tumor-specific genetic and epigenetic alterations, including point mutations, copy number variations, chromosomal rearrangements, and DNA methylation changes that reflect the molecular characteristics of the originating tumor [1].
Detection Methodologies and Platforms
The detection of ctDNA requires highly sensitive technologies capable of identifying rare tumor-derived fragments against a background of wild-type DNA. Current methodologies can be broadly categorized into PCR-based and next-generation sequencing (NGS)-based approaches.
PCR-based methods offer high sensitivity for detecting known mutations with fast turnaround times and lower costs. Digital PCR (dPCR) and droplet digital PCR (ddPCR) enable absolute quantification of mutant alleles by partitioning samples into thousands of individual reactions, achieving detection sensitivities as low as 0.001% variant allele frequency [6] [8]. These methods are particularly valuable for monitoring specific mutations during treatment and detecting minimal residual disease.
NGS-based approaches provide comprehensive genomic profiling capabilities, allowing for the detection of both known and novel mutations across multiple genomic regions. Targeted NGS panels, such as Guardant360 CDx and FoundationOne Liquid CDx, have received FDA approval for clinical use in various cancers [7] [8]. These platforms utilize hybrid capture or amplicon-based targeting to sequence specific genomic regions with high depth, achieving sensitivities of 0.1% variant allele frequency or lower. Emerging technologies including nanopore sequencing and microfluidic platforms show promise for further enhancing detection sensitivity and specificity while enabling direct detection of epigenetic modifications [6].
Table 1: Comparison of Major ctDNA Detection Platforms
| Platform | Technology | Detection Sensitivity | Genomic Coverage | Primary Applications |
|---|---|---|---|---|
| Guardant360 CDx | NGS (Hybrid Capture) | ~0.1% VAF | 70+ genes | Comprehensive genomic profiling, therapy selection |
| FoundationOne Liquid CDx | NGS (Hybrid Capture) | ~0.1% VAF | 300+ genes | Comprehensive genomic profiling, therapy selection |
| Signatera | NGS (Tumor-informed) | 0.01% VAF | 16-200 clonal variants | MRD monitoring, recurrence detection |
| ddPCR | PCR-based | 0.001%-0.01% VAF | Single mutations | Targeted mutation monitoring, treatment response |
Research Applications in Oncology
ctDNA analysis has diverse research applications across the cancer continuum. In early detection and diagnosis, ctDNA methylation signatures show particular promise, with specific methylation markers demonstrating sensitivities of 72.1% and specificities of 71.4% for lung cancer detection [6]. For therapy selection, ctDNA profiling identifies actionable mutations, such as EGFR in non-small cell lung cancer and PIK3CA in breast cancer, enabling targeted treatment strategies [7] [8]. In treatment monitoring, serial ctDNA assessment allows for real-time evaluation of therapeutic response and early detection of resistance mechanisms [9] [1]. Finally, minimal residual disease (MRD) monitoring using highly sensitive ctDNA assays can predict recurrence months before clinical or radiographic evidence, enabling early intervention strategies [5] [8].
Circulating Tumor Cells (CTCs)
Biological Significance and Heterogeneity
Circulating tumor cells (CTCs) are intact cancer cells that detach from primary or metastatic tumors and enter the circulation, serving as precursors of metastasis. First identified by Ashworth in 1869, CTCs are exceptionally rare, with approximately one CTC present per 10^6-10^7 peripheral blood mononuclear cells [9] [1]. CTCs exhibit considerable heterogeneity in size, morphology, molecular phenotype, and metastatic potential. They can circulate as single cells or form clusters with enhanced metastatic capacity, and may undergo epithelial-to-mesenchymal transition (EMT), altering their surface marker expression and increasing their invasive potential [5]. The molecular analysis of CTCs provides a comprehensive view of the tumor, encompassing DNA, RNA, protein, and functional characteristics that cannot be obtained through other liquid biopsy analytes [9].
Isolation and Detection Technologies
CTC isolation strategies leverage both biological and physical properties to enrich these rare cells from blood. The main enrichment approaches include:
Immunoaffinity-based methods utilize antibodies against cell surface markers, primarily epithelial cell adhesion molecule (EpCAM) and cytokeratins (CK), to capture CTCs. The CellSearch system, the first FDA-approved CTC detection platform, employs anti-EpCAM antibody-coated magnetic beads for enrichment followed by immunofluorescence staining (CK+/DAPI+/CD45-) for identification [9] [7]. This system has prognostic value in metastatic breast, prostate, and colorectal cancers. Limitations include potential missing of CTCs that have undergone EMT and reduced EpCAM expression.
Size-based separation methods exploit the typically larger size and lower deformability of CTCs compared to hematological cells. The Parsortix PC1 system uses a microfluidic cassette to capture CTCs based on size and compressibility, preserving cell viability for downstream molecular analysis [7]. Filtration systems like ScreenCell employ membranes with precise pore sizes to isolate CTCs [5]. These label-free approaches can capture EpCAM-negative CTCs but may miss smaller CTCs.
Microfluidic technologies have advanced CTC isolation through precise fluid control at microscopic scales. Devices like the CTC-iChip combine multiple separation principles, using inertial focusing to align cells followed by magnetophoretic separation of immunomagnetically labeled cells [9]. Emerging technologies are exploring novel capture agents, including graphene nanosheet-conditioned immunomagnetic beads that demonstrate leukocyte depletion rates of 99.996% [5].
Table 2: CTC Enrichment and Detection Methods
| Method | Principle | Advantages | Limitations |
|---|---|---|---|
| Immunomagnetic Separation (CellSearch) | Anti-EpCAM antibody-coated magnetic beads | FDA-approved, standardized, prognostic validation | Misses EpCAM-negative CTCs (e.g., after EMT) |
| Microfluidics (Parsortix) | Size and deformability | Label-free, maintains cell viability, broader CTC phenotypes | May miss smaller CTCs |
| Membrane Filtration | Cell size | Good cell integrity, not limited by surface markers | Low purity, may miss small CTCs |
| Density Gradient Centrifugation | Cell density | Can separate CK+ and CK- cells, low cost | Low separation efficiency |
Downstream Analysis and Research Applications
Following isolation, CTCs can undergo various molecular characterizations, including immunocytochemistry, fluorescence in situ hybridization (FISH), RNA sequencing, and whole genome amplification for DNA analysis [9]. Single-cell analysis of CTCs provides unprecedented insights into tumor heterogeneity and clonal evolution. Research applications include prognostic assessment, where CTC enumeration has demonstrated independent prognostic value in multiple cancers [1] [7]; therapy guidance, through molecular profiling of CTCs to identify targetable alterations; and metastasis research, where functional studies of CTCs and their clusters enhance understanding of the metastatic cascade [9]. Additionally, ex vivo culture of CTCs enables drug sensitivity testing and establishment of patient-derived models for preclinical research [9].
Extracellular Vesicles (EVs)
Biogenesis and Cargo
Extracellular vesicles (EVs) are lipid bilayer-enclosed particles released by cells, including tumor cells, into the extracellular environment. They are classified based on size and biogenesis mechanism: exosomes (50-150 nm) originate from multivesicular bodies, microvesicles (100-1000 nm) bud directly from the plasma membrane, and apoptotic bodies (1-5 μm) are released during programmed cell death [9]. Tumor-derived EVs carry diverse molecular cargo, including DNA, RNA (mRNA, miRNA, lncRNA), proteins, lipids, and metabolites that reflect the composition of the parent cell [9] [1]. EVs play crucial roles in intercellular communication, driving malignant behaviors such as tumor growth, immune suppression, angiogenesis, and metastasis [9]. Their stability in circulation and protection of cargo from degradation make them attractive biomarker sources.
Isolation and Characterization Techniques
EV isolation methods exploit physical and biochemical properties, with each technique offering different trade-offs between yield, purity, and functionality.
Ultracentrifugation remains the gold standard, involving sequential centrifugation steps to eliminate cells, debris, and larger particles followed by high-speed centrifugation (typically 100,000-200,000 × g) to pellet EVs [2]. Density gradient centrifugation can further improve purity by separating EVs from non-vesicular contaminants. Size-based techniques include size exclusion chromatography, which separates particles based on hydrodynamic radius, and membrane filtration with defined pore sizes. Precipitation methods use polymers to decrease EV solubility but may co-precipitate contaminants. Immunoaffinity capture utilizes antibodies against EV surface markers (e.g., CD9, CD63, CD81) for highly specific isolation but may select subpopulations [9].
Characterization of EVs typically employs multiple complementary techniques, including nanoparticle tracking analysis for size distribution and concentration, transmission electron microscopy for morphological assessment, and western blotting for specific protein markers [9]. The minimal information for studies of extracellular vesicles (MISEV) guidelines provide standardized reporting recommendations.
Research Applications
EVs offer unique research opportunities as multi-analyte biomarkers carrying proteins, nucleic acids, and lipids. Diagnostic applications leverage EV-associated miRNAs and proteins that show differential expression in cancer, with specific miRNA signatures associated with colorectal, hepatocellular, lung, oral, and ovarian cancers [9]. Therapy monitoring utilizes changes in EV cargo composition as indicators of treatment response, while mechanistic studies exploit EVs to understand tumor-stroma interactions, immune modulation, and pre-metastatic niche formation [9] [1]. The mRNA content within EVs can promote epithelial-mesenchymal transition and chemoresistance in colorectal cancer, revealing mechanisms of disease progression [9].
Tumor-Educated Platelets (TEPs)
Concept and Education Mechanisms
Tumor-educated platelets (TEPs) represent a novel liquid biopsy component wherein platelets undergo molecular reprogramming through interactions with the tumor microenvironment. Despite being anucleate, platelets contain a diverse and dynamic RNA repertoire that alters upon exposure to tumor-derived factors [10]. The "education" process involves multiple mechanisms: platelets directly uptake tumor-derived biomolecules (RNAs, proteins) via extracellular vesicles and other carriers; they are activated by tumor-secreted factors; and their splicing patterns are altered in response to tumor signals [10] [11]. These molecular changes transform platelets into active participants in tumor progression, contributing to metastasis, angiogenesis, and immune evasion.
RNA Profiling and Analysis
Platelets contain a surprisingly complex RNA repertoire, including mRNA, miRNA, lncRNA, and circRNA, which can be profiled using various technologies. RNA sequencing (RNA-Seq) provides the most comprehensive analysis, enabling quantification of transcript abundance and identification of splicing alterations [10]. Microarray hybridization offers an alternative for gene expression profiling, while qRT-PCR allows targeted quantification of specific RNA markers. The analysis of TEP RNA profiles typically incorporates machine learning algorithms to develop diagnostic and prognostic signatures. For instance, Best et al. demonstrated that TEP mRNA sequencing could identify cancer patients with 96% accuracy and distinguish different cancer types, including non-small cell lung cancer, with 71% accuracy [10].
Research Applications in Liquid Biopsy
TEPs have emerged as promising biomarkers with several research applications. In cancer detection, TEP RNA profiles demonstrate high diagnostic accuracy, with specific signatures capable of distinguishing cancer patients from healthy individuals and even identifying different cancer types [10]. For therapy monitoring, TEP RNA profiles change in response to treatment, offering potential for real-time response assessment. In molecular profiling, TEPs can detect key oncogenic mutations, including EGFR and KRAS in non-small cell lung cancer, potentially overcoming limitations of ctDNA in cases with low tumor shedding [10]. TEPs also contribute to understanding the metastatic process, particularly through their interactions with CTCs, providing insights into the platelet-CTC crosstalk that facilitates metastasis [11].
Comparative Analysis and Integration
Technical and Analytical Comparison
Each liquid biopsy analyte offers distinct advantages and limitations for cancer research. The following table provides a comparative overview of their key characteristics:
Table 3: Comparative Analysis of Liquid Biopsy Analytes
| Analyte | Abundance | Half-life | Analytical Content | Key Challenges |
|---|---|---|---|---|
| ctDNA | 0.01-90% of cfDNA | 15 min - 2.5 hr | Genetic mutations, methylation, fragmentation patterns | Low variant allele frequency, clonal hematopoiesis interference |
| CTCs | 1-10 cells/mL blood in metastatic disease | 1-2.5 hr | Whole genome, transcriptome, proteome, functional analysis | Extreme rarity, heterogeneity, viability maintenance |
| EVs | 10^9-10^11 particles/mL blood | Days | Proteins, RNA, DNA, lipids | Heterogeneity, standardization of isolation methods |
| TEPs | 150,000-400,000 platelets/μL blood | 7-10 days | RNA profiles, protein markers | Education mechanism complexity, specificity for cancer |
Multi-Analyte Integration Approaches
Integrating multiple liquid biopsy analytes provides a more comprehensive view of tumor biology than any single analyte alone. Multi-analyte approaches can overcome individual limitations through complementary information: ctDNA offers high-sensitivity detection of genetic alterations, CTCs provide functional and whole-cell information, EVs contribute diverse molecular cargo, and TEPs reflect systemic tumor responses [10] [5]. The combination of TEPs with ctDNA and EVs has demonstrated enhanced diagnostic power for early-stage lung cancer detection [10]. Similarly, simultaneous analysis of CTCs and ctDNA can provide insights into both cellular heterogeneity and genomic evolution. Advanced computational methods, including artificial intelligence and machine learning, are being employed to integrate multi-analyte data, developing more accurate diagnostic and prognostic models [5] [12].
Research Protocols and Methodologies
Sample Collection and Pre-analytical Processing
Proper sample collection and processing are critical for reliable liquid biopsy results. Blood collection in cell-stabilizing tubes (e.g., Streck, PAXgene) maintains analyte integrity by preventing degradation and cellular release of genomic DNA [8]. Plasma separation within 4-6 hours of collection (or according to tube manufacturer specifications) is essential to avoid contamination by hematopoietic cell DNA. For CTC analysis, processing within 24-72 hours is recommended depending on the preservation system. Platelet isolation for TEP analysis requires careful centrifugation to avoid activation and contamination by other blood components [10]. All samples should be aliquoted and stored at -80°C to preserve analyte quality. Standardized protocols across these steps are essential for reproducible results.
Essential Research Reagents and Tools
Table 4: Essential Research Reagents for Liquid Biopsy Analyses
| Reagent/Tool | Function | Application Examples |
|---|---|---|
| Cell-stabilizing Blood Collection Tubes | Preserve blood cell integrity and prevent nucleic acid degradation | Streck Cell-Free DNA BCT, PAXgene Blood cDNA tubes |
| Immunomagnetic Beads | Antibody-coated magnetic particles for target cell or EV isolation | Anti-EpCAM beads for CTC enrichment (CellSearch), CD63 beads for EV isolation |
| Microfluidic Devices | Miniaturized systems for efficient analyte separation and analysis | Parsortix for CTC isolation, CTC-iChip for integrated processing |
| Next-generation Sequencing Kits | Library preparation and sequencing for nucleic acid analysis | Guardant360, FoundationOne Liquid CDx for ctDNA; RNA-Seq kits for TEP analysis |
| Digital PCR Master Mixes | Enable absolute quantification of rare mutations | ddPCR supermixes for ctDNA variant detection and monitoring |
| EV Isolation Kits | Polymer-based precipitation or size-based EV enrichment | ExoQuick, Total Exosome Isolation kits |
| Platelet RNA Isolation Kits | Specialized reagents for efficient RNA extraction from platelets | miRNeasy, Norgen platelet RNA purification kits |
Visualized Workflows and Signaling Pathways
Liquid Biopsy Multi-Analyte Integrated Workflow
Platelet-CTC Crosstalk Signaling Pathway
The field of liquid biopsy is rapidly evolving, with ctDNA, CTCs, EVs, and TEPs each contributing unique biological insights to oncology research. As detection technologies continue to advance in sensitivity and specificity, these analytes are increasingly being integrated into comprehensive multi-analyte approaches that provide a more complete picture of tumor biology. Future directions include the standardization of pre-analytical and analytical protocols, validation of multi-analyte panels in large clinical trials, and the incorporation of artificial intelligence for complex data interpretation [5] [12]. The ongoing development of liquid biopsy applications—from early detection and minimal residual disease monitoring to therapy selection and resistance mechanism identification—promises to significantly impact cancer research and drug development. As these technologies mature, they are poised to transform precision oncology by enabling more dynamic, comprehensive, and non-invasive approaches to cancer characterization and monitoring.
Liquid biopsy represents a transformative approach in oncology, shifting the diagnostic paradigm from invasive tissue sampling to minimally invasive analysis of tumor-derived biomarkers in body fluids. Framed within the broader thesis of its applications in oncology research, this technology provides an unparalleled window into tumor biology and evolution. Unlike traditional biopsies that offer a single snapshot from a specific anatomical site, liquid biopsy captures the molecular heterogeneity of cancer in real-time, enabling dynamic monitoring of treatment response, resistance mechanisms, and disease evolution [1] [13]. The core principle hinges on analyzing various biomarkers released by tumors into circulation, including circulating tumor cells (CTCs), circulating tumor DNA (ctDNA), and extracellular vesicles (EVs) [14] [1]. For researchers and drug development professionals, this technology offers powerful tools for accelerating biomarker discovery, validating therapeutic targets, and designing more adaptive clinical trials. The journey from initial discovery to clinical adoption reflects a convergence of technological innovation, biological insight, and clinical validation, now positioning liquid biopsy as a cornerstone of precision oncology.
Historical Timeline of Key Discoveries and Milestones
The development of liquid biopsy has traversed distinct phases over more than a century, marked by seminal discoveries and technological breakthroughs. The table below chronicles the pivotal milestones that have defined its evolution.
Table 1: Historical Milestones in Liquid Biopsy Development
| Year | Milestone | Significance | Key Researchers/Entity |
|---|---|---|---|
| 1869 | First description of CTCs | Observation of cells resembling tumor cells in a patient's blood [1] [15]. | Thomas Ashworth [1] [15] |
| 1948 | Discovery of cell-free nucleic acids | Identification of unbound nucleic acid molecules in plasma [1]. | Mandel and Metais [1] |
| 1977 | Link between cfDNA and cancer | Found elevated cfDNA levels in cancer patients versus healthy individuals [1]. | Leon et al. [1] |
| 1994 | First oncogene mutation in cfDNA | Detection of KRAS mutations in pancreatic cancer patients' blood, matching tumor tissue [1]. | - |
| 1996 | Evidence of EV biological activity | Demonstrated that immune cell EVs can present antigens [1]. | Raposo et al. [1] |
| 2005 | CTCs as independent prognostic marker | CTC count linked to progression-free and overall survival in metastatic breast cancer [1]. | - |
| 2010 | The term "Liquid Biopsy" was coined | Defined the field by naming the analysis of CTCs [15]. | Alix-Panabières and Pantel [15] |
| 2014 | First regulatory approval for ctDNA | EMA approved ctDNA for detecting EGFR mutations in NSCLC [1]. | European Medicines Agency (EMA) |
| 2015 | Inclusion in Chinese Expert Consensus | Blood ctDNA accepted for EGFR testing when tissue is unavailable [1]. | - |
| 2016 | First FDA-approved liquid biopsy | Approval of the Cobas EGFR Mutation Test v2 for NSCLC [13]. | U.S. FDA & Roche |
| 2018 | CTCs incorporated into cancer staging | AJCC guidelines included CTC testing for prognostic assessment in breast cancer [1]. | American Joint Committee on Cancer (AJCC) |
| 2023 | CTCs in Chinese Technical Guidelines | Formal integration of CTC testing into the CACA guidelines [1]. | - |
| 2025 | NHS includes ctDNA testing | NHS England added ESR1 ctDNA testing for breast cancer to its National Genomic Test Directory [16]. | NHS England |
The historical trajectory reveals an initial long period of scientific exploration followed by an explosive phase of clinical and commercial translation since the 2010s, driven by advances in genomic technologies [17] [1].
The Evolving Technological Landscape and Methodologies
The clinical utility of liquid biopsy is underpinned by sophisticated technological platforms capable of isolating and analyzing rare and dilute biomarkers. The following diagram illustrates the core unified workflow for liquid biopsy analysis.
Pre-analytical Considerations and Biomarker Isolation
A critical first step involves meticulous sample collection and processing to preserve fragile biomarkers. Blood must be drawn into stabilizing tubes and processed promptly under controlled conditions to prevent biomarker degradation [14]. Pre-analytical variables such as collection tubes, centrifugation speeds, and storage conditions can significantly impact results, contributing to inter-laboratory variability [14]. The separation of plasma from whole blood is crucial, as plasma is the preferred source for ctDNA due to lower background noise from lysed white blood cells compared to serum [13].
CTC Enrichment and Detection Methodologies: The extreme rarity of CTCs (as few as 1 CTC per 1 million leukocytes) necessitates highly sensitive enrichment and detection platforms [1] [18]. The table below summarizes the key reagent solutions and technologies that form the researcher's toolkit for CTC analysis.
Table 2: Research Reagent Solutions for Circulating Tumor Cell (CTC) Analysis
| Tool Category | Specific Examples | Function and Application |
|---|---|---|
| Enrichment/Isolation Platforms | CellSearch System, Parsortix PC1 System, CTC-iChip, Microfluidic chips with nanoscale traps | Isolate and concentrate rare CTCs from whole blood using immunomagnetic (EpCAM-based) or label-free (size/deformability-based) methods [14] [1] [18]. |
| Immunomagnetic Reagents | Anti-EpCAM ferrofluid beads, Anti-CD45 antibodies | Positive selection of epithelial CTCs or negative depletion of hematopoietic cells to enrich for CTCs [14] [18]. |
| Detection & Staining Reagents | Fluorescent antibodies (Cytokeratin, CD45, Vimentin), DAPI | Immunofluorescence staining to identify CTCs (CK+, CD45-, DAPI+) and characterize their phenotype [18] [13]. |
| Single-Cell Analysis Tools | Single-cell sequencing platforms, FISH probes, PCR/WGS reagents | Genomic, transcriptomic, and epigenetic profiling of isolated CTCs to study heterogeneity and resistance [14] [18]. |
Advanced platforms are overcoming the limitations of early technologies like CellSearch by using microfluidic chips that integrate size-selective and antigen-specific traps, enabling high-sensitivity recovery [14]. Label-free systems such as di-electrophoresis or photoacoustic flow cytometry can capture CTCs without relying on epithelial markers, allowing for the isolation of CTCs that have undergone epithelial-mesenchymal transition (EMT) [14].
ctDNA and sEV Analysis Technologies: Analyzing ctDNA requires ultrasensitive methods to detect low-frequency mutations against a high background of wild-type DNA. Digital PCR (dPCR) and Droplet Digital PCR (ddPCR) provide absolute quantification of mutant alleles with high sensitivity [14] [19]. Next-Generation Sequencing (NGS)-based approaches, including error-suppression techniques and unique molecular identifiers, allow for broad profiling of mutations, copy number alterations, and epigenetic modifications like methylation [14] [1]. Emerging technologies like MUTE-Seq use engineered CRISPR-Cas systems (e.g., FnCas9) to selectively degrade wild-type DNA, dramatically enhancing the detection of rare mutant fragments for minimal residual disease (MRD) monitoring [19]. For small extracellular vesicles (sEVs) or exosomes, isolation is typically achieved through ultracentrifugation, size-exclusion chromatography, or immunocapture using antibodies against surface proteins (e.g., CD63, CD81) on microfluidic chips [14].
Clinical Adoption and Current Applications in Oncology
Liquid biopsy has matured from a research tool to a clinically validated asset, finding utility across the entire cancer care continuum. Its adoption is reflected in its growing market presence, estimated to be valued at USD 6.39 billion in 2025 and projected to reach USD 25.43 billion by 2035 [16].
Key Clinical Applications
The following diagram maps the primary clinical applications of liquid biopsy across the spectrum of cancer management, from early detection to guiding treatment in advanced disease.
Early Detection and Screening: Multi-cancer early detection (MCED) tests analyze cfDNA methylation patterns or fragmentomics to identify a cancer signal and predict its tissue of origin (Cancer Signal of Origin, CSO) [19]. For example, one study presented at AACR 2025 demonstrated an MCED test with 88.2% accuracy in predicting the origin of 12 different tumor types [19]. These tests show particular promise for detecting cancers without standard screening methods, such as pancreatic and esophageal cancers [19].
Therapy Selection and Companion Diagnostics: Liquid biopsy is firmly established for genotyping to match patients with targeted therapies. The first FDA-approved liquid biopsy, the Cobas EGFR Mutation Test v2, identifies EGFR mutations in non-small cell lung cancer (NSCLC) to guide EGFR inhibitor therapy [13]. Combining tissue and liquid biopsy can significantly increase the detection of actionable alterations, as demonstrated in the ROME trial, which led to improved patient survival [19].
Minimal Residual Disease (MRD) and Recurrence Monitoring: Detecting ctDNA after curative-intent therapy is a powerful predictor of relapse. In colorectal cancer, the VICTORI study showed that 87% of recurrences were preceded by ctDNA positivity, while no ctDNA-negative patient relapsed [19]. In bladder cancer, urine-based liquid biopsy (uRARE-seq) detected MRD with 94% sensitivity and was associated with shorter recurrence-free survival [19].
Real-Time Treatment Monitoring and Resistance Mechanism Analysis: Serial liquid biopsies enable dynamic tracking of tumor evolution under therapeutic pressure. Changes in ctDNA variant allele frequency or CTC counts can indicate response or resistance weeks to months before radiographic imaging [13]. In metastatic prostate cancer, morphological evaluation of chromosomal instability in CTCs (CTC-CIN) has been shown to predict taxane resistance [19].
Current Challenges, Limitations, and Future Directions
Despite rapid progress, several challenges must be addressed to realize the full potential of liquid biopsy in routine oncology practice.
A primary challenge is the high cost and variable sensitivity of tests, especially for early-stage cancers where tumor shedding of biomarkers is low [16]. Reimbursement frameworks remain uneven, particularly for MCED tests, which hinders widespread adoption [16]. Pre-analytical and analytical standardization is another significant hurdle; differences in sample collection, processing, and assay platforms foster inter-laboratory variability, complicating the comparison of results across studies and the establishment of universal cut-offs [14]. Furthermore, the clinical utility and health economic value of acting on liquid biopsy results, especially in the MRD setting, require validation through larger prospective clinical trials [14] [16].
Future development will focus on overcoming these barriers. Technological innovation will continue to enhance sensitivity and specificity through integrated multi-omics approaches, analyzing ctDNA, CTCs, and EVs in concert to provide a more comprehensive tumor portrait [14]. The integration of Artificial Intelligence (AI) and machine learning is poised to improve the analysis of complex fragmentomic, methylation, and proteomic data for better early detection and risk stratification [19] [16]. Furthermore, expanding liquid biopsy into non-blood sources—such as urine, cerebrospinal fluid (CSF), and saliva—offers less invasive options and targeted insights for specific cancers [15] [18]. Finally, global efforts to standardize protocols and demonstrate the cost-effectiveness of liquid biopsy in improving patient outcomes will be crucial for its full integration into national healthcare systems and clinical guidelines [14] [16].
Within the evolving paradigm of precision oncology, the limitations of traditional tissue biopsy have become increasingly apparent. These invasive procedures provide a single snapshot of a complex and dynamic disease, often failing to capture tumor heterogeneity and making longitudinal monitoring impractical [1]. Liquid biopsy has emerged as a transformative technological approach that addresses these fundamental constraints. By analyzing tumor-derived components such as circulating tumor DNA (ctDNA) and circulating tumor cells (CTCs) from peripheral blood and other biofluids, liquid biopsy provides researchers and clinicians with a powerful tool for serial assessment and comprehensive tumor profiling [2] [1]. This in-depth technical guide examines the core advantages of liquid biopsy over tissue biopsy, focusing on its application for serial monitoring, heterogeneity assessment, and improved accessibility in oncology research and drug development.
Core Technical Advantages of Liquid Biopsy
Enabling Serial Monitoring and Dynamic Response Assessment
The capacity for real-time, serial monitoring represents one of the most significant technical advantages of liquid biopsy. Unlike single-timepoint tissue biopsies, liquid biopsies can be performed repeatedly throughout treatment, enabling researchers to track tumor dynamics and clonal evolution under therapeutic pressure [2].
Short Half-Life Biomarkers: The utility of liquid biopsy for serial monitoring is fundamentally grounded in the kinetic properties of its analytes. CtDNA has a remarkably short half-life of approximately 114 minutes, allowing researchers to detect molecular changes within hours of treatment intervention rather than waiting months for radiographic evidence [20]. This rapid turnover enables near real-time assessment of therapeutic efficacy and early detection of emerging resistance mechanisms.
Technical Workflow for Serial Monitoring: A standardized protocol for longitudinal ctDNA monitoring involves periodic blood collection at predefined intervals (e.g., pre-treatment, every 2-4 treatment cycles, and at disease progression). Plasma-separated ctDNA is then analyzed using droplet digital PCR (ddPCR) or next-generation sequencing (NGS) panels to quantify mutation allele frequencies and track clonal dynamics over time [20]. This approach provides a dynamic molecular response metric that often precedes radiographic changes by weeks or months.
Table 1: Comparative Analysis of Serial Monitoring Capabilities
| Feature | Tissue Biopsy | Liquid Biopsy |
|---|---|---|
| Temporal Resolution | Single timepoint | Multiple longitudinal assessments |
| Turnaround Time | Days to weeks (processing intensive) | Hours to days (streamlined workflow) |
| Response Assessment | Histological changes after prolonged therapy | Molecular changes within days of treatment |
| Resistance Detection | Limited to re-biopsy at progression | Early detection of emerging resistance |
| Clinical Correlation | Anatomical snapshot | Dynamic correlation with treatment cycles |
Comprehensive Assessment of Tumor Heterogeneity
Tumors are spatially and temporally heterogeneous ecosystems containing subpopulations of cells with distinct molecular profiles. Traditional tissue biopsies sample only a single anatomical site and may miss critical subclonal populations that drive disease progression and therapeutic resistance [2] [1]. Liquid biopsy addresses this limitation by providing a composite molecular profile that captures contributions from multiple tumor sites simultaneously.
Spatial Heterogeneity Capture: As tumors metastasize, different metastatic sites often evolve distinct molecular characteristics. Liquid biopsy integrates ctDNA shed from multiple tumor deposits throughout the body, offering a more comprehensive view of the overall tumor genomic landscape than a single-site tissue biopsy [1] [21]. This is particularly valuable for understanding the complete repertoire of actionable mutations and resistance mechanisms present within a patient's cancer.
Technical Evidence from Clinical Studies: The ROME trial (NCT04591431) provided compelling evidence for the complementary nature of tissue and liquid biopsies in capturing tumor heterogeneity. In this phase 2 study involving 1,794 patients with advanced solid tumors, 16% of patients had actionable alterations detected exclusively by liquid biopsy that were missed by standard tissue profiling [21]. Conversely, 34.7% had alterations found only in tissue, highlighting the unique contributions of each modality and the value of combined approaches for comprehensive molecular characterization.
Figure 1: Liquid Biopsy Captures Spatial Heterogeneity. Liquid biopsy integrates tumor-derived components from multiple sites, providing a more comprehensive molecular profile than single-site tissue biopsy.
Enhanced Accessibility and Practical Research Applications
The minimally invasive nature of liquid biopsy substantially improves patient accessibility to molecular profiling and expands research feasibility for longitudinal studies. While tissue biopsies often require invasive procedures with associated risks and patient discomfort, liquid biopsies typically need only a standard blood draw or collection of other biofluids [20] [1].
Diverse Biofluid Sources: While peripheral blood remains the most common source for liquid biopsy analysis, researchers can also utilize urine, cerebrospinal fluid (CSF), pleural effusions, and uterine aspirates depending on the cancer type and research question [2] [20]. This flexibility enables sampling from anatomical sites that may be more accessible or relevant to specific malignancies.
Technical Workflow Advantages: The liquid biopsy workflow offers several practical advantages for research applications. Sample processing is more easily standardized and automated compared to the complex processing required for heterogeneous tissue specimens. Additionally, liquid biopsies enable prolonged study enrollment by eliminating the procedural risks that might exclude patients with comorbidities from tissue biopsy-intensive trials. This facilitates the recruitment of more representative patient populations for clinical research.
Table 2: Accessibility and Practical Research Considerations
| Parameter | Tissue Biopsy | Liquid Biopsy |
|---|---|---|
| Invasiveness | High (surgical procedure) | Low (blood draw/biofluid collection) |
| Sampling Frequency | Limited by patient risk | Frequent serial sampling feasible |
| Sample Processing | Complex tissue dissection | Standardized plasma isolation |
| Tumor Types Accessible | Limited by anatomical location | Universal application across malignancies |
| Integration with Clinical Trials | Logistically challenging | Facilitates dense molecular monitoring |
Experimental Protocols for Key Applications
Protocol for Longitudinal ctDNA Monitoring in Therapy Response
Objective: To quantitatively track tumor-specific mutations in plasma ctDNA during treatment to assess early molecular response and emerging resistance.
Materials:
- Cell-free DNA BCT Tubes: For blood collection and stabilization of nucleated cells
- Plasma Preparation Kit: Double-centrifugation protocol for platelet-free plasma
- Cell-free DNA Extraction Kit: Silica-membrane based extraction systems
- Droplet Digital PCR System: For absolute quantification of mutant allele frequency
- NGS Library Preparation Kit: For broader mutation profiling
Methodology:
- Baseline Sample Collection: Collect 10mL peripheral blood in cell-stabilizing tubes before treatment initiation
- Serial Sampling: Repeat blood collection at cycle 1 day 15, cycle 2 day 1, and every two treatment cycles thereafter
- Plasma Processing: Double-centrifugation protocol (1600 × g for 10min, then 16,000 × g for 10min) within 2 hours of collection
- cfDNA Extraction: Isolate using silica-membrane technology, quantify by fluorometry
- Mutation Analysis:
- For known mutations: Use ddPCR with mutation-specific assays for absolute quantification
- For unknown mutations: Employ NGS panels with unique molecular identifiers for error correction
- Data Analysis: Calculate variant allele frequency (VAF) and track dynamics over time
Interpretation: A rapid decline in VAF (>50% reduction within 15 days) correlates with radiographic response, while rising VAF indicates emerging resistance, often months before clinical progression [22].
Protocol for Heterogeneity Assessment Through Multi-analyte Approach
Objective: To comprehensively evaluate tumor heterogeneity by simultaneously analyzing multiple liquid biopsy components.
Materials:
- CTC Enrichment System: Size-based microfluidic devices or negative depletion platforms
- EV Isolation Kit: Ultracentrifugation or polymer-based precipitation methods
- DNA/RNA Co-extraction Kits: For parallel analysis of multiple nucleic acid types
- Single-cell RNA Sequencing Platform: For CTC transcriptomic profiling
Methodology:
- Sample Collection: 20mL blood collected in appropriate preservative tubes
- Component Separation:
- CTC Isolation: Process 7.5mL using label-free microfluidic size-based capture (e.g., Parsortix system)
- EV Isolation: Concentrate from 5mL plasma using ultracentrifugation at 100,000 × g for 70min
- ctDNA Extraction: Isolate from remaining plasma using magnetic bead-based methods
- Multi-analyte Analysis:
- CTCs: Perform single-cell whole genome sequencing or RNA sequencing
- EVs: Extract RNA for miRNA profiling or protein analysis by mass spectrometry
- ctDNA: Perform deep targeted sequencing (5000× coverage) for mutation detection
- Data Integration: Combine molecular profiles from all components to reconstruct comprehensive tumor heterogeneity map
Interpretation: Discordant mutations between CTCs, EVs, and ctDNA suggest distinct subclonal populations, providing insights into tumor evolution and potential resistance mechanisms [2] [20].
The Scientist's Toolkit: Essential Research Reagents and Platforms
Table 3: Key Research Reagent Solutions for Liquid Biopsy Applications
| Reagent/Platform | Function | Research Application |
|---|---|---|
| CellSearch System | Immunomagnetic CTC enrichment using EpCAM antibodies | CTC enumeration and molecular characterization |
| Parsortix PC1 System | Size-based microfluidic CTC capture | Harvesting intact CTCs for downstream culture and analysis |
| Droplet Digital PCR | Absolute quantification of rare mutations in ctDNA | Monitoring minimal residual disease and low-frequency variants |
| FoundationOne Liquid CDx | Comprehensive NGS-based genomic profiling | Detecting substitutions, insertions/deletions, CNAs, and fusions |
| BEAMing Technology | Beads, Emulsion, Amplification, and Magnetics | Ultra-sensitive detection of specific mutations down to 0.01% VAF |
| QIAGEN cfDNA Kits | Manual or automated extraction of cell-free DNA | High-quality cfDNA recovery for downstream molecular analysis |
| Guardant360 CDx | NGS-based liquid biopsy comprehensive genomic profiling | Detecting tumor mutations for therapy selection in advanced cancers |
Signaling Pathways and Molecular Dynamics
The molecular components analyzed in liquid biopsy provide critical insights into key oncogenic signaling pathways that drive tumor progression and treatment resistance. Understanding these pathway dynamics is essential for interpreting liquid biopsy data in research contexts.
Figure 2: Key Signaling Pathways Detected via Liquid Biopsy. Liquid biopsy identifies critical pathway alterations that drive treatment resistance and tumor progression, with some pathways showing high discordance between tissue and liquid biopsies.
Recent research has highlighted significant discordance rates in certain pathways between tissue and liquid biopsies. In the ROME trial, the highest rates of discordance were observed in the PI3K/PTEN/AKT/mTOR pathway (35%) and ERBB2 alterations, underscoring the complex biology of these signaling networks and the technical challenges in their comprehensive assessment [21]. This discordance information is crucial for researchers designing studies that target these specific pathways.
Liquid biopsy represents a fundamental advancement in cancer research methodologies, offering distinct advantages over traditional tissue biopsy for serial monitoring, heterogeneity assessment, and research accessibility. The technical capacity to repeatedly sample tumor molecular profiles throughout treatment enables unprecedented insights into dynamic therapeutic responses and resistance mechanisms. The comprehensive profiling of spatially separated tumor subclones addresses critical limitations of single-site tissue sampling. Furthermore, the minimally invasive nature of liquid biopsy expands patient eligibility for research studies and enables dense longitudinal sampling schemes that were previously impractical. As validation studies continue and technologies evolve, liquid biopsy is poised to become an indispensable tool in oncology research, accelerating the development of more effective, personalized cancer therapies.
Current Guidelines and Approved Clinical Uses
Liquid biopsy has emerged as a transformative tool in oncology, enabling minimally invasive profiling of tumor genetics through the analysis of circulating biomarkers in bodily fluids. By capturing spatial and temporal heterogeneity, it provides critical insights for drug development and clinical decision-making that often complement or surpass the capabilities of traditional tissue biopsies [23] [24]. The clinical applicability of liquid biopsy is anchored in the detection and analysis of various biomarkers, primarily circulating tumor DNA (ctDNA) and circulating tumor cells (CTCs), both of which have obtained U.S. Food and Drug Administration (FDA) approval for specific indications [24]. This guide synthesizes the current clinical guidelines, approved uses, and technical methodologies that are foundational for oncology research and therapeutic development.
Clinical Applications and Guidelines
Clinical guidelines for liquid biopsy are rapidly evolving, with professional societies and payers defining medically necessary use cases based on robust evidence. The core applications include identifying actionable mutations for therapy selection, detecting minimal residual disease (MRD), and monitoring treatment response.
Approved Uses for Therapy Selection
Current clinical guidelines support the use of liquid biopsy in specific scenarios where it provides a practical and effective means of guiding therapy. The following table summarizes the key approved indications based on clinical guidelines and key clinical trials.
Table 1: Clinically Approved Applications for Therapy Selection
| Cancer Type | Clinical Context | Biomarker Target | Guideline/Supporting Evidence |
|---|---|---|---|
| Metastatic NSCLC [25] | Insufficient tissue for NGS testing; No prior NGS profiling | EGFR, ALK, ROS1, BRAF, etc. | Carelon Clinical Appropriateness Guidelines [25] |
| Advanced Breast Cancer [26] [25] | Progression on endocrine therapy | ESR1 mutations | SERENA-6 trial; FDA approval of Guardant360 CDx for imlunestrant and elacestrant [26] [27] |
| Advanced Breast Cancer [25] | For targeted therapy (e.g., alpelisib, capivasertib) | PIK3CA, AKT1, PTEN | Carelon Clinical Appropriateness Guidelines [25] |
| Metastatic Prostate Cancer [25] | Candidate for PARP or PD-1 inhibitor; Insufficient tissue | BRCA1/2, other HRR genes | Carelon Clinical Appropriateness Guidelines [25] |
| Various Solid Tumors [8] | Companion diagnostic for specific targeted therapies | Variant-specific (e.g., EGFR) | FDA approvals for cobas EGFR Test v2, Guardant360 CDx, FoundationOne Liquid CDx [8] |
Emerging Applications: MRD and Early Intervention
Beyond therapy selection, liquid biopsy is proving critical in detecting Minimal Residual Disease (MRD) and intercepting relapse, as demonstrated in recent practice-changing studies.
Table 2: Key Clinical Trial Evidence for MRD and Early Intervention
| Trial/Study | Cancer Type | Clinical Context | Key Finding |
|---|---|---|---|
| AEGEAN [26] | Resectable NSCLC (Stage II-III) | Perioperative immunotherapy | Post-surgical ctDNA positivity was associated with shorter DFS; mutations in KEAP1 and KMT2C were enriched in MRD+ patients. |
| CheckMate 77T [26] | Resectable NSCLC (Stage II-III) | Perioperative immunotherapy | Patients with both ctDNA clearance and pCR had the greatest Event-Free Survival (EFS). |
| VICTORI Study [28] | Colorectal Cancer | Post-surgical monitoring | The ultrasensitive NeXT Personal assay detected ctDNA recurrence over 6 months before radiographic imaging in half of the relapsing patients. |
| MSKCC Phase II [28] | dMMR Solid Cancers | Post-screening for residual disease | ctDNA-guided administration of pembrolizumab led to a 86.4% (11/13) recurrence-free rate at 2 years in high-risk patients. |
| I-SPY2 [26] | Breast Cancer (Stage II-III) | Neoadjuvant therapy | Post-neoadjuvant ctDNA negativity predicted lower residual nodal disease burden, supporting surgical de-escalation in ctDNA- patients. |
Technical Methodologies and Experimental Protocols
The reliability of liquid biopsy data is contingent on robust pre-analytical and analytical protocols. Researchers must carefully standardize methods from sample collection to data analysis.
Pre-analytical Sample Processing
The instability of ctDNA and CTCs demands strict pre-analytical handling to avoid artifacts.
- Blood Collection and Plasma Separation: Collect blood in cell-stabilizing tubes (e.g., Streck Cell-Free DNA BCT) or K2EDTA tubes. Process samples within 1-2 hours of draw to prevent lysis of white blood cells, which dilutes the tumor DNA fraction. Centrifuge to separate plasma from whole blood, followed by a second, higher-speed centrifugation to remove residual cells [23] [8].
- cfDNA Extraction: Isolate cell-free DNA (cfDNA) from plasma using silica-membrane column-based or magnetic bead-based extraction kits. Quantify yield using fluorometry (e.g., Qubit) [8].
- CTC Enrichment and Isolation: CTCs are rare, requiring enrichment. The FDA-approved CellSearch system uses positive immunoaffinity selection targeting EpCAM (epithelial cell adhesion molecule). EpCAM-independent platforms, such as those from Epic Sciences, use negative depletion of CD45+ leukocytes or physical property-based isolation (e.g., size, deformability, density) to capture heterogeneous CTC populations, including those that have undergone epithelial-to-mesenchymal transition (EMT) [23] [24].
Analytical Techniques for ctDNA and CTCs
Choosing the right analytical technique depends on the clinical or research question, required sensitivity, and the number of genomic targets.
Table 3: Core Analytical Methodologies for Liquid Biopsy
| Methodology | Key Principle | Best For | Limitations | Approx. LoD |
|---|---|---|---|---|
| PCR-based (ddPCR, ARMS) [8] | Amplification and detection of specific, known mutations. | High-sensitivity detection of 1-3 hot-spot mutations (e.g., EGFR p.T790M, ESR1 p.D538G). | Limited multiplexing capability; cannot discover novel variants. | ~0.1% VAF |
| Targeted NGS [26] [8] | Hybrid capture or amplicon-based enrichment of target genes followed by high-depth sequencing. | Broad genomic profiling (e.g., 50-500 genes); detecting SNVs, indels, CNVs, fusions. | More expensive and complex than PCR; requires bioinformatics. | ~0.1% VAF (for SNVs) |
| Tumor-Informed NGS (MRD) [26] [28] | Creation of a patient-specific panel (e.g., up to 1,800 variants) based on WES of tumor tissue. Ultra-deep sequencing of plasma. | Ultra-sensitive MRD detection and recurrence monitoring (LoD down to 2 ppm). | Requires matched tumor tissue; longer turnaround time. | 0.0002% VAF (2 ppm) |
| Whole Genome Sequencing (WGS) [23] | Low-pass WGS of cfDNA to detect genome-wide copy number alterations. | Inferring genomic instability and large-scale transitions. | Lower resolution for point mutations; requires high cfDNA input. | N/A |
| CTC Molecular Analysis [23] | Genomic (WES, lpWGS) or transcriptomic (RNA-seq) analysis of isolated CTCs. | Single-cell resolution to study intratumor heterogeneity and resistance mechanisms. | Technically challenging; very low input material. | N/A |
Emerging Techniques: Fragmentomics and Methylation
Innovative approaches that move beyond simple mutation detection are gaining traction.
- Fragmentomics: This technique analyzes the size, distribution, and end-motifs of cfDNA fragments. Tumor-derived cfDNA fragments are often shorter and have distinct fragmentation patterns compared to non-tumor cfDNA. This method can predict outcomes and detect cancer from very low quantities of cfDNA (as low as 1 ng) without requiring prior knowledge of tumor mutations [28].
- Methylation Analysis: Detecting cancer-specific DNA methylation patterns in cfDNA is a highly sensitive and cancer-type-specific method. It is used in multi-cancer early detection tests and for determining the tissue of origin. The Guardant Reveal and Infinity assays leverage methylation patterns for MRD and cancer detection, respectively [26].
Visualizing Workflows and Signaling Pathways
Liquid Biopsy Clinical Workflow
The following diagram illustrates the end-to-end process from patient sample to clinical reporting, highlighting key decision points for researchers and clinicians.
CTC Enrichment and Analysis Pathways
This diagram details the primary technological pathways for isolating and analyzing circulating tumor cells, crucial for understanding tumor heterogeneity.
The Scientist's Toolkit: Essential Research Reagents
Successful implementation of liquid biopsy research requires a suite of carefully selected reagents and platforms.
Table 4: Essential Reagents and Tools for Liquid Biopsy Research
| Category | Item | Primary Function in Research |
|---|---|---|
| Sample Collection | Cell-Free DNA Blood Collection Tubes (e.g., Streck BCT) | Preserves blood sample integrity by stabilizing nucleated cells, preventing cfDNA dilution and degradation during transport and storage [8]. |
| Nucleic Acid Extraction | cfDNA Extraction Kits (e.g., Qiagen Circulating Nucleic Acid Kit) | Isolate high-purity, short-fragment cfDNA from plasma samples for downstream molecular analysis [8]. |
| Library Preparation | Hybrid Capture-based NGS Library Prep Kits (e.g., xGen) | Prepare sequencing libraries from low-input cfDNA, enabling highly multiplexed and sensitive detection of variants across targeted gene panels [26]. |
| CTC Isolation | Anti-EpCAM Coated Magnetic Beads | Immunoaffinity-based positive selection of epithelial CTCs from whole blood for enumeration and molecular characterization [23] [24]. |
| CTC Isolation | Microfluidic Devices (e.g., CTC-iChip, Parsortix) | EpCAM-independent isolation of CTCs based on size and deformability, capturing CTCs undergoing Epithelial-to-Mesenchymal Transition (EMT) [23] [24]. |
| Ultra-Sensitive Detection | Tumor-Informed MRD Assays (e.g., Signatera, NeXT Personal) | Custom-built, patient-specific NGS assays for tracking hundreds of somatic variants, enabling parts-per-million level detection of residual disease [26] [28]. |
| Data Analysis | Bioinformatic Tools for Clonal Hematopoiesis Filtering | Computational subtraction of somatic mutations originating from clonal hematopoiesis of indeterminate potential (CHIP) to reduce false-positive variant calls [8]. |
Methodologies and Expanding Clinical Applications in Cancer Care
Liquid biopsy has emerged as a transformative approach in oncology research, enabling non-invasive detection and monitoring of cancer through the analysis of circulating tumor biomarkers. Among these, circulating tumor DNA (ctDNA) has gained significant prominence for its ability to provide a real-time molecular profile of tumors [1] [29]. The detection and analysis of ctDNA rely primarily on two powerful technological platforms: polymerase chain reaction (PCR)-based methods and next-generation sequencing (NGS). This technical guide provides an in-depth comparison of these platforms, detailing their principles, performance characteristics, and applications within oncology research and drug development.
Core Technology Principles
PCR-Based Detection Platforms
PCR-based methods for liquid biopsy analysis have evolved significantly from basic amplification techniques to highly sensitive digital detection systems. These technologies operate on the principle of amplifying specific, known DNA sequences of interest:
- Quantitative PCR (qPCR): This traditional method utilizes fluorescent probes to monitor DNA amplification in real-time, allowing for quantification of target sequences. While fast and cost-effective for a small number of targets, its sensitivity is limited to detecting mutant allele fractions (MAF) greater than 10% [30].
- Digital PCR (dPCR): dPCR represents a significant advancement in detection sensitivity by partitioning a sample into thousands to millions of individual reactions, effectively diluting the DNA sample to the point where many partitions contain either zero or one molecule. This partitioning allows for absolute quantification of nucleic acids without the need for standard curves and enables detection of rare mutations with MAF as low as 0.02% [31] [30]. Specific dPCR variants include:
Next-Generation Sequencing Platforms
NGS technologies employ a fundamentally different approach, characterized by massive parallel sequencing of DNA fragments. This hypothesis-free methodology does not require prior knowledge of specific mutations, enabling comprehensive genomic profiling [29] [33]. The core process involves:
- Library Preparation: Fragmentation of DNA and attachment of adapter sequences [34].
- Cluster Amplification: Immobilization and clonal amplification of DNA fragments on a solid surface (e.g., Illumina flow cells) or in emulsion PCR (e.g., Ion Torrent) [34].
- Sequencing by Synthesis: Parallel detection of nucleotide incorporation across millions of clusters [34].
- Data Analysis: Alignment of sequences to reference genomes and identification of variants using sophisticated bioinformatics pipelines [29] [34].
NGS approaches for ctDNA analysis can be categorized as:
- Targeted NGS: Focuses on specific gene panels (dozens to hundreds of genes) using hybrid capture or multiplex PCR-based enrichment, enabling deep sequencing and high sensitivity (MAF <1%) [29] [30].
- Whole-Genome/Exome Sequencing: Provides comprehensive coverage of the genome or exome but at lower depth, making it more suitable for discovery research than low-frequency variant detection [29].
Comparative Technical Performance
The selection between PCR-based and NGS platforms depends heavily on the specific research requirements, as each technology offers distinct advantages and limitations.
Table 1: Key Performance Characteristics of PCR-based vs. NGS Platforms
| Parameter | PCR-Based Methods | Next-Generation Sequencing |
|---|---|---|
| Discovery Power | Limited to known variants [33] | Hypothesis-free; detects known and novel variants [33] |
| Sensitivity | 0.02% (dPCR) to 10% (qPCR) MAF [30] | <1% MAF with standard methods; <0.1% with unique molecular identifiers [29] [30] |
| Throughput | Low to moderate (limited by multiplexing capacity) [33] | High (thousands of targets across multiple samples simultaneously) [33] |
| Mutation Resolution | Best for single nucleotide variants and small indels [33] | Detects SNVs, indels, copy number variations, and structural variants [34] [33] |
| Multiplexing Capacity | Limited (typically <10 plex) | High (hundreds to thousands of targets) [33] |
| Turnaround Time | Fast (hours to 1 day) | Moderate to long (2 days to several weeks) |
| Cost per Sample | Low for few targets; increases with multiplexing | Higher initial cost; more cost-effective for multiple targets [34] |
Table 2: Application-Based Technology Selection Guide
| Research Application | Recommended Technology | Rationale |
|---|---|---|
| Monitoring Known Resistance Mutations | dPCR/ddPCR | High sensitivity for tracking specific mutations during treatment [35] |
| Comprehensive Tumor Profiling | Targeted NGS | Broad coverage of cancer-related genes; identifies co-mutations [34] |
| Novel Biomarker Discovery | Whole genome/exome NGS | Unbiased approach to identify new variants and structural alterations [29] |
| Minimal Residual Disease Detection | dPCR (for known mutations) or ultrasensitive NGS | Requires high sensitivity to detect low ctDNA levels post-treatment [30] |
| Large-Scale Screening Studies | Targeted NGS | Cost-effective profiling of multiple genes across many samples [33] |
Experimental Protocols
ddPCR Protocol for ctDNA Mutation Detection
Principle: Sample partitioning into nanodroplets, endpoint PCR amplification, and fluorescence counting of positive droplets [32].
Detailed Workflow:
- Blood Collection and Processing:
- Collect blood in cell-stabilization tubes (e.g., Streck Cell-Free DNA BCT).
- Process within 6 hours: centrifuge at 800-1600 × g for 10 minutes at room temperature to isolate plasma.
- Transfer plasma to microcentrifuge tubes and centrifuge at 16,000 × g for 10 minutes to remove residual cells.
cfDNA Extraction:
- Extract cfDNA from plasma using silica membrane-based kits (e.g., QIAamp Circulating Nucleic Acid Kit).
- Elute in 20-50 μL of low-EDTA TE buffer or nuclease-free water.
- Quantify using fluorometry (e.g., Qubit dsDNA HS Assay).
Droplet Digital PCR Setup:
- Prepare reaction mix containing:
- 10 μL ddPCR Supermix for Probes (no dUTP)
- 1 μL of mutation-specific FAM-labeled probe
- 1 μL of wildtype-specific HEX-labeled probe
- 5-22 μL of template cfDNA (up to 10 ng)
- Nuclease-free water to 22 μL total volume
- Generate droplets using Automated Droplet Generator.
- Transfer emulsified samples to 96-well PCR plates; seal with foil heat seal.
- Prepare reaction mix containing:
PCR Amplification:
- Perform thermal cycling with the following conditions:
- 95°C for 10 minutes (enzyme activation)
- 40 cycles of: 94°C for 30 seconds (denaturation) and 55-60°C for 60 seconds (annealing/extension)
- 98°C for 10 minutes (enzyme deactivation)
- Hold at 4°C
- Perform thermal cycling with the following conditions:
Droplet Reading and Analysis:
- Load plates into droplet reader.
- Analyze using vendor software (e.g., QuantaSoft) to determine mutant and wildtype droplet counts.
- Calculate mutant allele frequency: MAF = (Nmutant / (Nmutant + N_wildtype)) × 100%
Quality Control Considerations:
- Include no-template controls (water) and wildtype controls in each run.
- Ensure minimum of 10,000 accepted droplets per sample.
- Use Poisson statistics to calculate confidence intervals for low-frequency variants.
Targeted NGS Protocol for ctDNA Analysis
Principle: Hybrid capture-based enrichment of target genes followed by massively parallel sequencing [29] [34].
Detailed Workflow:
- Sample Preparation and Quality Control:
- Extract cfDNA from 4-10 mL plasma (yield typically 10-50 ng).
- Assess DNA quality using Bioanalyzer or TapeStation; expect fragment size distribution peaking at ~167 bp.
- Require minimum of 5 ng cfDNA for library preparation.
Library Preparation:
- Repair DNA ends and phosphorylate 5' ends using mix containing T4 DNA polymerase, Klenow fragment, and T4 polynucleotide kinase.
- Add deoxyadenosine (dA) to 3' ends using Klenow exo- fragment.
- Ligate sequencing adapters with unique dual indexes (UDIs) to prevent index hopping.
- Perform limited-cycle PCR (4-8 cycles) to amplify libraries.
Target Enrichment:
- Pool libraries in equimolar ratios (up to 96 samples per pool).
- Hybridize with biotinylated oligonucleotide probes targeting cancer-related genes (e.g., 50-500 gene panels).
- Capture probe-bound fragments using streptavidin-coated magnetic beads.
- Wash to remove non-specifically bound DNA.
- Perform post-capture PCR amplification (10-14 cycles) to enrich for target regions.
Sequencing:
- Quantify final libraries by qPCR.
- Normalize to appropriate concentration for sequencing (e.g., 1.8 pM for Illumina).
- Sequence on appropriate platform (e.g., MiSeq for small panels; NextSeq for larger panels) with minimum 100,000x raw coverage.
Bioinformatic Analysis:
- Demultiplex reads based on unique dual indexes.
- Align to reference genome (e.g., GRCh37/hg19) using optimized aligners (e.g., BWA-MEM).
- Perform base quality score recalibration and local realignment around indels.
- Call variants using specialized ctDNA algorithms (e.g., MuTect, VarScan2).
- Apply unique molecular identifier (UMI)-based error suppression to distinguish true mutations from PCR/sequencing errors.
- Filter variants against population databases (e.g., gnomAD) to remove common polymorphisms.
- Annotate variants using databases like COSMIC, ClinVar, and OncoKB.
Figure 1: Comparative Workflows for PCR-based and NGS-based ctDNA Analysis
Performance Comparison Data
Direct comparative studies provide valuable insights into the relative performance of PCR-based and NGS technologies in real-world research settings.
Table 3: Experimental Performance Comparison in Cancer Detection
| Study Context | Technology Comparison | Key Findings | Performance Metrics |
|---|---|---|---|
| Non-Metastatic Rectal Cancer [32] | ddPCR vs. NGS panel | ddPCR demonstrated higher detection rates in baseline plasma samples | ddPCR: 58.5% (24/41) detection vs. NGS: 36.6% (15/41); p=0.00075 |
| Metastatic Breast Cancer [35] | Targeted NGS vs. multiplex dPCR | High concordance between platforms for ERBB2, ESR1, and PIK3CA mutations | 95% overall concordance (90/95); R²=0.9786 correlation |
| ctDNA Analysis Sensitivity [30] | Various PCR vs. NGS methods | Comparison of detection limits across technological platforms | dPCR: 0.02-0.1% MAF; NGS: <1% MAF (standard), <0.1% MAF (with UMIs) |
Research Implementation Considerations
The Scientist's Toolkit: Essential Research Reagents and Platforms
Table 4: Key Research Reagent Solutions for ctDNA Analysis
| Reagent/Platform | Function | Application Notes |
|---|---|---|
| Cell-Free DNA Collection Tubes | Stabilizes blood cells to prevent genomic DNA contamination | Critical for reproducible results; enables sample transport |
| Silica-Membrane cfDNA Extraction Kits | Isolves cell-free DNA from plasma | Higher recovery of short fragments compared to traditional methods |
| Mutation-Specific dPCR Assays | Detects and quantifies known mutations | Requires prior knowledge of mutation; ideal for monitoring studies |
| Hybrid Capture Panels | Enriches cancer-related genes for targeted sequencing | Customizable content; balanced coverage important for performance |
| Unique Molecular Identifiers | Tags individual DNA molecules to reduce errors | Essential for ultrasensitive NGS applications; enables error correction |
| Bioinformatics Pipelines | Analyzes NGS data to identify true mutations | Specialized algorithms needed for low variant allele frequencies |
Technology Selection Framework
Choosing between PCR-based and NGS platforms requires careful consideration of multiple research parameters:
- Mutation Knowledge: For known mutations, dPCR provides superior sensitivity and quantification. For unknown mutations or comprehensive profiling, NGS is required [33].
- Multiplexing Requirements: Studies requiring analysis of multiple genomic regions benefit significantly from NGS scalability [33].
- Sample Throughput: Large-scale studies leverage the multiplexing capacity of NGS, while smaller studies may find dPCR more cost-effective.
- Budget Constraints: dPCR has lower per-sample costs for limited targets, while NGS becomes more economical when analyzing multiple genomic regions.
- Infrastructure and Expertise: dPCR requires less specialized bioinformatics support, while NGS demands robust computational infrastructure and analytical expertise [34].
PCR-based and NGS platforms offer complementary capabilities for ctDNA analysis in oncology research. The selection between these technologies should be guided by specific research objectives, with dPCR providing superior sensitivity for tracking known mutations and NGS offering unparalleled discovery power for comprehensive genomic profiling. As liquid biopsy continues to transform cancer research and drug development, understanding the technical nuances of these detection platforms becomes increasingly critical for generating robust, clinically actionable data.
Comprehensive Genomic Profiling (CGP) for Therapy Selection and Companion Diagnostics
Comprehensive Genomic Profiling (CGP) represents a foundational technology in precision oncology, enabling the simultaneous analysis of hundreds of cancer-related genes from a single tissue or liquid biopsy sample. Utilizing next-generation sequencing (NGS) platforms, CGP detects a wide variety of genomic alterations—including single nucleotide variants (SNVs), insertions and deletions (indels), copy number alterations (CNAs), gene fusions, and complex genomic signatures like tumor mutational burden (TMB) and microsatellite instability (MSI)—that inform therapeutic decision-making [36]. The application of CGP has transformed cancer management from a histology-based approach to a molecular-driven paradigm, particularly for advanced solid tumors.
The integration of CGP within liquid biopsy workflows represents a particularly significant advancement for oncology research and drug development. Liquid biopsy analyzes circulating tumor DNA (ctDNA) and other biomarkers from blood samples, providing a minimally invasive method for genomic profiling that captures tumor heterogeneity and enables dynamic monitoring of treatment response [19] [36]. For researchers and pharmaceutical developers, CGP serves not only as a companion diagnostic tool but also as a critical research platform for identifying novel biomarkers, understanding resistance mechanisms, and stratifying patient populations for clinical trials.
Technical Foundations of CGP
Genomic Alterations Detected by CGP
Comprehensive Genomic Profiling assays are designed to identify multiple classes of genomic alterations with clinical and research significance. The most technologically advanced CGP platforms simultaneously interrogate hundreds of genes through hybrid capture-based NGS methods, with some assays incorporating both DNA and RNA sequencing to enhance detection capabilities, particularly for fusion events and alternative transcripts [37].
Table 1: Genomic Alterations Detected by CGP Platforms
| Alteration Type | Detection Method | Research/Clinical Utility |
|---|---|---|
| Single Nucleotide Variants (SNVs) | DNA sequencing | Most frequent alteration type (85.3% of samples); includes targetable kinase domain mutations [37] |
| Insertions/Deletions (Indels) | DNA sequencing | Detects frame-preserving and frame-shift events; includes EGFR exon 19 deletions [38] |
| Gene Fusions | RNA sequencing, DNA sequencing | Identified in 7.5% of samples (42.0% in prostate cancer); critical for NTRK, RET, FGFR targeting [37] |
| Copy Number Alterations (CNAs) | DNA sequencing | Detects amplifications (e.g., ERBB2) and homozygous deletions [38] |
| Genomic Signatures (TMB, MSI) | Computational analysis from NGS data | Predictive biomarkers for immunotherapy response [38] |
| Transcript Alterations | RNA sequencing | Detects exon skipping events (e.g., METΔ14) and expression outliers [37] |
Comparison of Tissue vs. Liquid Biopsy CGP
The implementation of CGP utilizes both tissue and liquid biopsy samples, each with distinct technical considerations for research applications. Tissue biopsy remains the gold standard for primary diagnosis and histological correlation, while liquid biopsy offers advantages for serial monitoring and capturing tumor heterogeneity [36].
Table 2: Technical Comparison of Tissue vs. Liquid Biopsy CGP
| Parameter | Tissue-Based CGP | Liquid Biopsy CGP |
|---|---|---|
| Sample Type | Formalin-Fixed Paraffin-Embedded (FFPE) tissue sections | Plasma from blood draw (cell-free DNA) |
| Sample Requirements | Tumor content >20-30%; surface area ≥25mm² (optimal) [39] | Plasma volume 4-10mL; ctDNA fraction variable |
| Success Rate | 81.5% (higher in surgical specimens: 96.7%) [39] | Dependent on ctDNA shed and tumor burden |
| Turnaround Time | 10-21 days (including pathology review) | 7-14 days (faster processing) |
| Advantages | Gold standard; histopathological correlation; higher DNA yield | Minimally invasive; captures heterogeneity; serial monitoring |
| Limitations | Invasive procedure; tissue heterogeneity; sample age effects [39] | Lower DNA yield; clonal hematopoiesis interference |
CGP Methodologies and Experimental Protocols
Tissue-Based CGP Workflow
The analytical workflow for tissue-based CGP requires careful sample preparation and quality control to ensure reliable results. The process begins with FFPE tissue sections, which undergo macro-dissection or micro-dissection to enrich tumor content before nucleic acid extraction.
Critical Protocol Steps:
- Sample Qualification: Pathologists evaluate H&E-stained slides for tumor nuclei percentage (≥20% optimal) and surface area (≥25mm² optimal) [39].
- Nucleic Acid Extraction: DNA is extracted from FFPE sections, with quality assessed by degradation metrics.
- Library Preparation: Hybrid capture-based methods using bait sets targeting 300-500 genes are most common.
- Sequencing: High-depth NGS (≥500x coverage) enables detection of low-frequency variants.
- Bioinformatic Analysis: Specialized pipelines call variants and filter artifacts, with annotation against clinical databases.
Success rates for tissue CGP are significantly influenced by pre-analytical factors. A prospective study demonstrated 81.5% success rate, with highest performance in surgical specimens (96.7%) and samples stored for less than six months (89.4%) [39].
Liquid Biopsy CGP Workflow
Liquid biopsy CGP utilizes circulating cell-free DNA (cfDNA) from blood samples, requiring specialized techniques for low-abundance analyte detection.
Advanced Liquid Biopsy Methodologies:
- Fragmentomics Analysis: Examines cfDNA fragment size patterns and genomic distributions to infer nucleosome positioning and gene regulation, requiring as little as 1ng of input DNA [28].
- Personalized MRD Detection: Utilizes patient-specific variant panels (up to 1,800 mutations) from tumor tissue to achieve ultra-sensitive ctDNA detection at limits of detection approaching 0.0002% variant allele fraction [28].
- MUTE-Seq: Employs engineered FnCas9-AF2 variant to selectively eliminate wild-type DNA, significantly enhancing sensitivity for low-frequency mutation detection in minimal residual disease monitoring [19].
CGP for Companion Diagnostics and Therapy Selection
FDA-Approved Companion Diagnostic Indications
CGP tests have received FDA approval as companion diagnostics for numerous targeted therapies across solid tumors. The FoundationOne CDx assay, for example, is approved as a companion diagnostic for over 20 targeted therapies [38].
Table 3: Select FDA-Approved Companion Diagnostic Indications via CGP
| Biomarker | Cancer Type | FDA-Approved Therapy | Therapeutic Class |
|---|---|---|---|
| EGFR exon 19 del/L858R | NSCLC | Osimertinib, Erlotinib | EGFR TKI |
| ALK rearrangements | NSCLC | Alectinib, Brigatinib | ALK Inhibitor |
| BRAF V600E | Melanoma, NSCLC | Dabrafenib + Trametinib | BRAF/MEK Inhibitor |
| NTRK fusions | All Solid Tumors | Larotrectinib, Entrectinib | TRK Inhibitor |
| MSI-High | All Solid Tumors | Pembrolizumab | Immune Checkpoint Inhibitor |
| TMB-High (≥10 mut/Mb) | All Solid Tumors | Pembrolizumab | Immune Checkpoint Inhibitor |
| BRCA1/2 alterations | Ovarian, Prostate | Olaparib | PARP Inhibitor |
| FGFR2 fusions | Cholangiocarcinoma | Pemigatinib | FGFR Inhibitor |
Actionable Alterations Across Solid Tumors
Large-scale genomic studies demonstrate the prevalence of actionable alterations detected by CGP. Analysis of over 10,000 advanced solid tumors revealed that 92.0% of samples harbored therapeutically actionable alterations, with 29.2% containing biomarkers for FDA-approved on-label therapies and 28.0% containing biomarkers supporting off-label treatment approaches [37].
The distribution of actionable alterations varies significantly by tumor type. In prostate cancer, fusions involving TMPRSS2-ERG are detected in approximately 42.0% of cases, while MET exon 14 skipping mutations occur in 2.7% of NSCLC cases [37]. The research implications are substantial, as these prevalence data inform clinical trial design and drug development priorities.
Emerging Research Applications
Diagnostic Recharacterization Through CGP
CGP enables diagnostic refinement and reclassification in cases where initial pathological diagnosis is uncertain or inconsistent with molecular findings. A 2025 study of 28 cases demonstrated how CGP findings prompted secondary clinicopathological review, resulting in diagnostic reclassification in 7 cases and refinement in 21 cases [40].
Notable examples include:
- Initial diagnosis of neuroendocrine carcinoma reclassified as medullary thyroid carcinoma based on RET M918T mutation
- Initial diagnosis of sarcoma reclassified as melanoma driven by NRAS Q61H mutation
- Cancers of unknown primary refined to specific diagnoses (NSCLC, cholangiocarcinoma, melanoma) based on driver alterations
This reclassification has direct therapeutic implications, as updated diagnoses enabled more precise treatment recommendations aligned with the tumor's molecular drivers [40].
Minimal Residual Disease Monitoring
Liquid biopsy CGP applications have expanded significantly into minimal residual disease (MRD) detection following curative-intent treatment. The VICTORI study in colorectal cancer demonstrated that ctDNA detection using ultrasensitive assays identified all recurrences before radiographic evidence, with half of recurrences detected at least six months prior to imaging [28]. These findings have profound implications for adjuvant therapy decisions and clinical trial endpoints.
Technical advances in MRD detection include:
- Tumor-informed approaches: Personalized assays tracking 16-50 mutations per patient achieve sensitivity to ctDNA fractions as low as 0.001%
- Tumor-agnostic approaches: Multiomic analyses combining fragmentomics with methylation patterns show promise for MRD detection without prior tumor sequencing
- Concordance studies: The TOMBOLA trial demonstrated 82.9% concordance between ddPCR and whole-genome sequencing for ctDNA detection in bladder cancer [19]
The Scientist's Toolkit: Essential Research Reagents
Table 4: Essential Research Reagents for CGP Development
| Reagent/Resource | Function | Application Notes |
|---|---|---|
| Hybrid Capture Baits | Target enrichment of genomic regions | Pan-cancer designs typically cover 300-500 genes; must include clinically actionable targets |
| Unique Molecular Identifiers (UMIs) | Error correction and quantification | Critical for liquid biopsy applications to distinguish true variants from sequencing artifacts |
| Matched Normal DNA | Germline variant filtering | Essential for distinguishing somatic from germline alterations; reduces false positives |
| Cell-Free DNA Collection Tubes | Blood sample stabilization | Preserve ctDNA for up to 7 days at room temperature; crucial for multi-center trials |
| FFPE DNA Extraction Kits | Nucleic acid isolation from tissue | Optimized for cross-linked, fragmented DNA from archival specimens |
| Reference Standard Materials | Assay validation | Commercially available contrived samples with known variant allele frequencies |
| Bioinformatic Pipelines | Variant calling and annotation | Must be validated for each alteration type (SNVs, indels, CNAs, fusions) |
Comprehensive Genomic Profiling has evolved from a research tool to an essential component of precision oncology, with expanding applications in companion diagnostics, therapeutic selection, and cancer monitoring. The integration of CGP with liquid biopsy methodologies represents a particularly promising frontier, enabling non-invasive assessment of tumor genomics and dynamic tracking of treatment response. For researchers and drug developers, CGP provides critical insights into cancer biology, resistance mechanisms, and patient stratification strategies that accelerate therapeutic innovation. As CGP technologies continue to advance with improvements in sensitivity, multiplexing capability, and computational analysis, their role in both clinical practice and oncology research will continue to expand, ultimately enabling more precise and personalized cancer care.
Monitoring Treatment Response and Emerging Resistance Mechanisms
The emergence of resistance to anticancer therapies remains a significant obstacle in oncology, often leading to disease progression. Liquid biopsy has arisen as a transformative, minimally invasive approach for the dynamic monitoring of treatment response and the early detection of resistance mechanisms [41]. By analyzing circulating tumor-derived components such as circulating tumor DNA (ctDNA) and circulating tumor cells (CTCs), this methodology provides real-time insights into tumor evolution, enabling timely clinical intervention [1]. This whitepaper details the application of liquid biopsy within oncology research for deciphering heterogeneous resistance pathways to targeted therapies and immunotherapies, and provides a technical guide to the essential methodologies and reagents driving this field forward.
In contemporary oncology research, the paradigm for assessing treatment efficacy and tumor dynamics is shifting from traditional tissue biopsies to liquid biopsies. Tissue biopsies, while the historical gold standard, are invasive, susceptible to sampling bias due to tumor heterogeneity, and impractical for repeated serial monitoring [1]. Liquid biopsy circumvents these limitations by enabling the repeated sampling of blood or other bodily fluids to isolate and analyze a rich reservoir of tumor-derived components [41].
The primary analytes include ctDNA, which carries the genetic and epigenetic landscape of the tumor; CTCs, which offer a window into metastatic potential and phenotypic changes; and tumor-derived extracellular vesicles (EVs), which contain proteins, lipids, and nucleic acids reflective of the parent tumor cell [41] [1]. The analysis of these components provides critical, real-time data on the molecular alterations that underpin primary resistance (lack of initial response) and secondary resistance (disease progression after an initial response) to various cancer treatments [41]. The following sections will explore the specific resistance mechanisms to major therapy classes and the liquid biopsy strategies used to uncover them.
Resistance Mechanisms and Liquid Biomarker Profiles
Resistance to Targeted Therapies
Targeted therapies are designed to inhibit specific oncogenic drivers, but their efficacy is often limited by the emergence of resistance, which can be efficiently tracked via liquid biopsy.
A key application is monitoring for the EGFR T790M mutation in non-small cell lung cancer (NSCLC) patients treated with first-generation EGFR tyrosine kinase inhibitors (TKIs). The appearance of the T790M mutation in ctDNA is a canonical mechanism of secondary resistance and can guide the subsequent use of third-generation TKIs like osimertinib [1]. Beyond single mutations, liquid biopsy can identify bypass track activation, such as MET amplification, through the analysis of copy number alterations in ctDNA [41]. Furthermore, the molecular profiling of ctDNA can reveal histological transformation, such as the transformation of NSCLC to small cell lung cancer (SCLC), by detecting associated genomic alterations.
Table 1: Key ctDNA Alterations in Targeted Therapy Resistance
| Resistance Mechanism | Example Genetic Alteration | Therapy Context | Detection Method in Liquid Biopsy |
|---|---|---|---|
| Secondary Mutation | EGFR T790M | NSCLC, EGFR TKI | ctDNA mutation detection (ddPCR, NGS) |
| Bypass Track Activation | MET Amplification | NSCLC, EGFR TKI | ctDNA copy number analysis (NGS) |
| Pathway Alteration | KRAS G12C | Colorectal Cancer, Anti-EGFR | ctDNA mutation detection (ddPCR, NGS) |
| Histological Transformation | RB1/TP53 mutations | NSCLC to SCLC transformation | ctDNA mutation profiling (NGS) |
Resistance to Immune Checkpoint Inhibitors (ICIs)
Immune checkpoint inhibitors (ICIs) have revolutionized cancer treatment, but response is highly variable. Liquid biopsy is being leveraged to unravel the complex and dynamic interplay between tumors and the immune system that leads to resistance [41].
Key resistance mechanisms that can be interrogated via liquid biopsy include an immunosuppressive tumor microenvironment (TME). Analysis of EVs in liquid biopsy can reveal cargo, such as PD-L1, that contributes to T-cell exhaustion [41]. Changes in the levels of these immunosuppressive proteins can be monitored over time. Another critical mechanism is tumor immunogenicity loss. Longitudinal ctDNA sequencing can identify the clonal selection of tumor subpopulations that have lost neoantigens, making them invisible to the immune system [41]. Furthermore, the peripheral immune state can be assessed by analyzing immune cell-derived components in the blood, providing a systemic context for treatment response.
Table 2: Liquid Biopsy Biomarkers for ICI Resistance
| Resistance Mechanism | Liquid Biopsy Analyte | Research Finding | Potential Clinical Utility |
|---|---|---|---|
| Immunosuppressive TME | PD-L1+ Extracellular Vesicles | EVs reflect tumor PD-L1 expression and suppress T-cell function [41] | Dynamic monitoring of immune evasion |
| Tumor Immunogenicity Loss | ctDNA Clonal Dynamics | Loss of neoantigen-encoding clones under ICI selection pressure [41] | Tracking tumor immunoediting |
| Dysregulated Immune Signaling | Plasma Cytokine/Chemokine Profiles | Specific signatures associated with hyperprogression and irAEs [41] | Predicting adverse events and efficacy |
Technical Methodologies for Liquid Biopsy Analysis
A robust liquid biopsy workflow is foundational to reliable data generation. The process, from sample collection to data analysis, requires stringent protocols to ensure analytical validity and reproducibility.
Core Workflow for ctDNA Analysis
The analysis of ctDNA is a cornerstone of liquid biopsy applications due to its relatively high stability and rich genetic information.
Sample Collection and Processing: Blood should be collected in specialized tubes (e.g., Streck Cell-Free DNA BCT) that stabilize nucleated cells and prevent genomic DNA contamination. Plasma must be separated from whole blood via a double centrifugation protocol (e.g., first spin at 1,600 x g for 10 min, then supernatant spin at 16,000 x g for 10 min) within a few hours of draw to minimize lysis of blood cells [1]. The resulting plasma is then aliquoted and frozen at -80°C if not used immediately.
ctDNA Extraction and Quantification: Circulating free DNA (cfDNA), which contains ctDNA, is extracted from plasma using silica-membrane or magnetic bead-based kits. The quantity and quality of the extracted cfDNA should be assessed using fluorometry (e.g., Qubit) and capillary electrophoresis (e.g., Bioanalyzer/TapeStation), respectively. A peak at ~167 bp indicates a high fraction of mononucleosomal DNA, characteristic of ctDNA [1].
Downstream Analysis - Droplet Digital PCR (ddPCR) and Next-Generation Sequencing (NGS): For the detection of known, specific mutations (e.g., EGFR T790M), ddPCR is the gold standard due to its high sensitivity and absolute quantification capabilities. For broader, hypothesis-free discovery of resistance mechanisms, targeted NGS panels are required. These panels focus on genes frequently altered in cancer and use unique molecular identifiers (UMIs) and error-suppression bioinformatic algorithms to achieve high sensitivity down to variant allele frequencies of 0.1% or lower [1].
Experimental Protocol: ctDNA Extraction and ddPCR for T790M Detection
This protocol provides a detailed, reproducible method for detecting the EGFR T790M mutation from liquid biopsy samples [42] [1].
Key Data Elements for Protocol Reporting [42]:
- Objective: Detect the EGFR T790M mutation in plasma-derived ctDNA from NSCLC patients with suspected resistance to first-generation EGFR TKIs.
- Sample Type: Human peripheral blood.
- Reagents and Equipment: Streck Cell-Free DNA BCT tubes; QIAamp Circulating Nucleic Acid Kit (Qiagen); EGFR T790M ddPCR Mutation Assay (Bio-Rad); Qubit dsDNA HS Assay Kit; QX200 Droplet Digital PCR System (Bio-Rad).
- Step-by-Step Instructions:
- Blood Collection and Processing: Collect 10 mL of whole blood into Streck BCT tubes. Invert 10 times to mix. Process within 6 hours of collection.
- Plasma Separation: Centrifuge tubes at 1,600 x g for 10 minutes at 4°C. Carefully transfer the supernatant (plasma) to a new conical tube without disturbing the buffy coat. Centrifuge the plasma a second time at 16,000 x g for 10 minutes at 4°C. Transfer the clarified plasma to a new tube.
- cfDNA Extraction: Extract cfDNA from 3-5 mL of plasma using the QIAamp Circulating Nucleic Acid Kit according to the manufacturer's instructions. Elute in 50 µL of AVE buffer.
- cfDNA Quantification: Quantify the total cfDNA concentration using the Qubit dsDNA HS Assay. Record the yield (typically 5-50 ng total).
- ddPCR Reaction Setup: Prepare the ddPCR reaction mix according to the EGFR T790M assay protocol. Typically, use 5-10 ng of cfDNA per reaction. Include no-template controls (NTC) and positive controls (T790M-mutated DNA) in each run.
- Droplet Generation and PCR: Generate droplets using the QX200 Droplet Generator. Transfer the emulsified samples to a 96-well PCR plate. Seal the plate and run the PCR with the following cycling conditions: 95°C for 10 min; 40 cycles of 94°C for 30 s and 55-60°C (per assay specification) for 60 s; 98°C for 10 min (ramp rate 2°C/s).
- Data Analysis: Read the plate on the QX200 Droplet Reader. Analyze the data using QuantaSoft software. The software will cluster droplets as mutant, wild-type, or ambiguous. Calculate the mutant allele frequency as ([Mutant]\ / ([Mutant] + [Wild-type])) * 100%.
- Troubleshooting: Low droplet count indicates issues with droplet generation; repeat the step. High background in the NTC indicates contamination; use fresh reagents. Poor cluster separation may require optimization of annealing temperature.
The Scientist's Toolkit: Essential Research Reagents and Materials
The following table details key reagents and tools critical for conducting liquid biopsy research in the context of treatment monitoring.
Table 3: Essential Research Reagents and Kits for Liquid Biopsy Analysis
| Item/Category | Specific Examples | Function and Application |
|---|---|---|
| Blood Collection Tubes | Streck Cell-Free DNA BCT; CellSave Preservative Tube | Stabilizes blood cells and prevents cfDNA background dilution for up to several days post-draw [1]. |
| cfDNA Extraction Kits | QIAamp Circulating Nucleic Acid Kit (Qiagen); MagMax Cell-Free DNA Isolation Kit (Thermo Fisher) | Isolation of high-quality, high-molecular-weight cfDNA from plasma/serum [1]. |
| CTC Enrichment Systems | CellSearch System (Menarini); Parsortix System (Angle PLC) | Immunomagnetic (CellSearch) or size-based microfluidic (Parsortix) enrichment of CTCs from whole blood [1]. |
| Extracellular Vesicle Isolation | ExoQuick (System Biosciences); Total Exosome Isolation Kit (Thermo Fisher); Ultracentrifugation | Precipitation or differential centrifugation for isolation of EVs/exosomes from biofluids [41]. |
| Targeted NGS Panels | AVENIO ctDNA kits (Roche); Oncomine Panels (Thermo Fisher) | Designed for highly sensitive and specific detection of cancer variants from low-input ctDNA samples [1]. |
| Digital PCR Systems | QX200 Droplet Digital PCR (Bio-Rad); QuantStudio Absolute Q (Thermo Fisher) | Ultra-sensitive detection and absolute quantification of known point mutations or fusions [1]. |
Detecting Minimal Residual Disease (MRD) and Predicting Early Relapse
Minimal Residual Disease (MRD), also termed molecular residual disease, refers to the presence of small numbers of cancer cells that persist in a patient during or after treatment when the patient is in remission. These residual cells cannot be detected by traditional imaging or routine clinical methods but harbor the potential to multiply and cause cancer relapse [43]. The detection and monitoring of MRD represent one of the most transformative applications of liquid biopsy in contemporary oncology research. By analyzing circulating tumor DNA (ctDNA) and other biomarkers in blood, researchers and clinicians can now identify this occult disease, strongly predict recurrence risks—often months before radiographic evidence appears—and fundamentally reshape strategies for cancer therapeutics and clinical trial design [44] [43].
The clinical significance of MRD is profound; its presence is strongly associated with future cancer recurrence, and its quantification provides a powerful prognostic biomarker [45] [46]. This technical guide delves into the core methodologies, experimental protocols, and key research tools that underpin MRD detection, framing this advanced capability within the broader, rapidly evolving context of liquid biopsy applications in oncology.
Current Technological Landscape for MRD Detection
The core principle of MRD detection via liquid biopsy involves identifying and quantifying tumor-derived signals in a patient's blood, most commonly ctDNA. These signals can be genetic mutations, epigenetic patterns, or fragmentation profiles. The technologies designed to capture these signals are broadly categorized into tumor-informed and tumor-agnostic approaches, each with distinct advantages and limitations for research and clinical application [46] [43].
Tumor-Informed vs. Tumor-Agnostic Approaches
- Tumor-Informed (Personalized) Assays: These assays require initial sequencing of the patient's tumor tissue to identify a set of somatic mutations unique to that specific cancer. This mutational fingerprint is then tracked in serial plasma samples to detect MRD. This approach is highly sensitive, as it targets a personalized panel of mutations, allowing for detection limits as low as 0.001% (1 part per 100,000) [47] [43]. The NeXT Personal assay used in the VICTORI study is a prime example, creating a personalized panel of up to 1,800 somatic variants per patient for ultrasensitive monitoring [47].
- Tumor-Agnostic (Tumor-Naive) Assays: These assays use a fixed panel of known cancer-associated mutations or biomarkers without prior knowledge of the patient's specific tumor genome. They are valuable when tumor tissue is unavailable but generally offer lower sensitivity compared to tumor-informed methods [43]. Emerging agnostic methods are exploring epigenetic features like DNA methylation and fragmentomics to improve their performance [46].
Core Detection Methodologies
The following table summarizes the primary analytical methods used in MRD detection, highlighting their principles, strengths, and limitations.
Table 1: Core Methodologies for MRD Detection
| Method | Core Principle | Key Strengths | Inherent Limitations |
|---|---|---|---|
| PCR-based (e.g., ddPCR) [19] [46] | Amplification and detection of specific, known DNA sequences. | High sensitivity for targeted mutations; fast turnaround; cost-effective. | Limited multiplexing capability; cannot easily detect copy number alterations or fusions. |
| Next-Generation Sequencing (NGS) [44] [46] | Massively parallel sequencing of DNA fragments to identify multiple mutations simultaneously. | High multiplexing capability; can discover novel variants; comprehensive genomic profile. | Higher cost; longer turnaround time; requires complex bioinformatics. |
| Fragmentomics [19] [28] | Analysis of the size, distribution, and patterns of cell-free DNA fragments. | Does not require prior knowledge of mutations; can provide information on tissue of origin. | Still largely in the research phase; clinical validity being established. |
| Methylation Analysis [19] [45] | Interrogation of DNA methylation patterns on ctDNA, which are characteristic of cancer cells. | High tissue specificity; potential for high sensitivity and cancer origin prediction. | Complex data analysis; requires specialized assays and bioinformatics. |
Detailed Experimental Protocols for MRD Assessment
Translating the technological landscape into actionable research requires robust experimental protocols. The following section details specific methodologies cited in recent key studies, providing a template for research design.
The VICTORI study provides a exemplary protocol for personalized, tumor-informed MRD monitoring in solid tumors, demonstrating the ability to detect recurrence a median of 198 days earlier than imaging, with some cases detected over a year in advance.
Step 1: Pre-Surgical Tissue Sequencing
- Objective: To define the patient-specific mutational signature for subsequent tracking.
- Method: Obtain resected tumor tissue. Perform whole-exome or whole-genome sequencing to identify a set of somatic single nucleotide variants (SNVs) and indels unique to the tumor. Select a personalized panel of up to hundreds of these clonal mutations for tracking.
Step 2: Serial Plasma Collection and Processing
- Objective: To obtain high-quality plasma for ctDNA analysis at critical time points.
- Method:
- Collection: Draw blood into cell-stabilizing tubes (e.g., Streck, Roche).
- Processing: Centrifuge within a strict timeframe (e.g., 2-4 hours) to separate plasma from peripheral blood cells. Perform a second high-speed centrifugation to remove residual cells.
- Timeline: Collect plasma pre-operatively, then post-operatively every two weeks for eight weeks, and every three months thereafter for long-term surveillance.
Step 3: Cell-free DNA Extraction and Library Preparation
- Objective: To isolate and prepare cfDNA for sequencing.
- Method: Extract cfDNA from plasma using commercial kits (e.g., QIAamp Circulating Nucleic Acid Kit). Quantify the yield. Construct sequencing libraries from the extracted cfDNA.
Step 4: Hybrid Capture and Ultra-Deep Sequencing
- Objective: To enrich and sequence the personalized panel of mutations with high sensitivity.
- Method: Use biotinylated probes designed against the patient-specific mutation panel to perform hybrid capture of the sequencing libraries. Sequence the captured libraries to an ultra-high depth (often >100,000x coverage) to detect minute ctDNA fragments present at very low allele frequencies.
Step 5: Bioinformatic Analysis and MRD Calling
- Objective: To distinguish true positive ctDNA signals from background noise and technical artifacts.
- Method: Use a custom bioinformatics pipeline. Align sequencing reads to a reference genome. Apply duplex sequencing (if available) to filter out errors by requiring the mutation to be present on both strands of the original DNA molecule. The presence of multiple patient-specific mutations above a statistically defined background threshold constitutes a positive MRD signal. The study reported detection of ctDNA as low as 2 parts per million [47].
This protocol outlines a plasma-only approach that integrates mutation and methylation profiling, circumventing the need for tumor tissue.
Step 1: Plasma-Only Assay Design
- Objective: To utilize a fixed, multi-feature panel for MRD detection.
- Method: Employ a predefined, large (e.g., 5-Mb) NGS panel designed to interrogate a combination of somatic variants and cancer-type-specific methylation profiles.
Step 2: Sample Collection and cfDNA Processing
- Objective: To collect and process longitudinal plasma samples.
- Method: Collect plasma at defined intervals (e.g., 12 and 36 months post-diagnosis). Process and extract cfDNA as described in the previous protocol.
Step 3: Multiomic Sequencing and Analysis
- Objective: To simultaneously sequence for genetic and epigenetic markers.
- Method: Subject the cfDNA to sequencing using the predefined panel. The bioinformatic classifier then analyzes the data on two axes:
- Somatic Variants: Identifies tumor-derived mutations from the panel.
- Methylation Profiling: Analyzes the methylation patterns to confirm the cancer signal.
- A positive MRD call is made based on a composite score from both data types, which enhances specificity.
Key Findings: This pilot study demonstrated 79% sensitivity (11/14) for detecting ctDNA at or before distant recurrence, with a lead time of 3.4 to 18.5 months. Specificity was 100%, as no ctDNA was detected in patients without recurrence (n=13) [45].
The Scientist's Toolkit: Key Research Reagent Solutions
Successful MRD research relies on a suite of specialized reagents and tools. The following table details essential components of the MRD research workflow.
Table 2: Essential Research Reagents and Materials for MRD Studies
| Research Tool | Function & Application | Key Considerations |
|---|---|---|
| Cell-Stabilizing Blood Collection Tubes (e.g., Streck) [47] | Preserves blood sample integrity by preventing white blood cell lysis and genomic DNA release, which can dilute the ctDNA signal. | Critical for maintaining sample quality, especially when processing is delayed beyond 4-6 hours. |
| cfDNA Extraction Kits (e.g., QIAamp Circulating Nucleic Acid Kit) [47] | Isolves and purifies cell-free DNA from plasma samples, removing proteins and other contaminants. | High recovery rate of low-concentration cfDNA is paramount for sensitivity. |
| Hybrid Capture Probes (Custom or Pan-Cancer Panels) [47] | Biotinylated oligonucleotides designed to enrich target genomic regions (patient-specific or fixed panels) from complex cfDNA libraries. | Probe design directly impacts the breadth and efficiency of target enrichment. Custom panels require prior WGS/WES of tumor tissue. |
| Ultra-High-Fidelity PCR Enzymes (e.g., for ddPCR) [19] | Amplifies specific DNA targets with minimal error rates, essential for detecting rare true mutations amidst PCR artifacts. | Low error rate is non-negotiable for assays detecting variants at <0.1% allele frequency. |
| Methylation Conversion Reagents (e.g., Bisulfite) [19] [45] | Chemically treats DNA to convert unmethylated cytosine to uracil, allowing for subsequent sequencing-based discrimination of methylated loci. | Can be harsh and cause significant DNA degradation; requires careful optimization. |
| Reference Standard Materials | Synthetic or cell-line-derived DNA with known mutations at defined allele frequencies, used for assay validation and calibration. | Essential for determining the limit of detection (LOD) and limit of blank (LOB) of any MRD assay. |
Clinical Validation and Quantitative Data Synthesis
The utility of MRD detection is underscored by robust clinical data across various cancer types. The following table synthesizes key quantitative findings from recent studies presented in the search results.
Table 3: Clinical Performance Metrics of MRD Detection Across Selected Studies
| Cancer Type / Study | Key Quantitative Findings | Clinical Implication |
|---|---|---|
| Colorectal Cancer (VICTORI) [47] | - 87% of recurrences were ctDNA-positive within 8 weeks post-surgery.- Median lead time over imaging: 198 days.- All recurrences were ctDNA-positive before imaging. | ctDNA testing at 4-8 weeks post-surgery is a highly sensitive prognostic indicator for recurrence. |
| Breast Cancer (Janni et al.) [45] | - Sensitivity for detecting recurrence: 79% (11/14 patients).- Lead time range: 3.4 to 18.5 months.- Specificity: 100% (0/13 non-recurring patients). | Plasma-only multiomic assay is feasible for MRD detection and early relapse prediction in EBC. |
| dMMR Solid Tumors (MSKCC Phase II) [28] | - 86.4% (11/13) of ctDNA-positive patients treated with pembrolizumab cleared MRD and remained recurrence-free at 2 years. | ctDNA can guide effective preemptive immunotherapy, preventing relapse in high-risk patients. |
| Bladder Cancer (TOMBOLA Trial) [19] | - 82.9% concordance between ddPCR and WGS for ctDNA detection.- ddPCR showed higher sensitivity in low tumor fraction samples. | Both ddPCR and WGS are valid methods, with ddPCR potentially more sensitive for very low-level disease. |
Emerging Frontiers and Future Research Directions
The field of MRD detection is rapidly advancing beyond simple mutation detection. Key emerging frontiers include:
- Fragmentomics: Analyzing the size and end-motif patterns of cfDNA fragments. Research presented at AACR 2025 showed that fragmentomic patterns, derived from as little as one nanogram of cfDNA, were connected to outcomes in lung cancer patients treated with immunotherapy, offering a mutation-agnostic monitoring tool [19] [28].
- Novel Enrichment Technologies: Assays like MUTE-Seq are pushing the boundaries of sensitivity. This method uses a highly precise engineered Cas9 variant (FnCas9-AF2) to selectively eliminate wild-type DNA, thereby enriching for mutant alleles and enabling superior detection of low-frequency mutations for MRD [19].
- Adaptive Clinical Trial Design: MRD is revolutionizing clinical trials by enabling patient stratification and guiding treatment escalation or de-escalation. The SERENA-6 trial in breast cancer, which modified therapy based on early ESR1 mutation detection via ctDNA, exemplifies this paradigm [48]. Ongoing studies, like the EORTC 2148 MRD in head and neck cancer, aim to generate evidence for integrating ctDNA into routine follow-up to guide these "adaptive" strategies [49].
Visualizing the MRD Workflow and Assay Principles
The following diagrams illustrate the core workflows and technological principles described in this guide.
Diagram 1: MRD Detection Research Workflow
Diagram 2: Tumor-Informed vs. Tumor-Agnostic Assay Principles
Liquid biopsy is a minimally invasive technique that analyzes tumor-derived components circulating in bodily fluids, primarily blood. This approach has revolutionized cancer management by providing real-time insights into tumor dynamics, heterogeneity, and therapeutic response. In the context of immunotherapy, liquid biopsy offers unique opportunities to guide treatment selection, monitor response, and identify mechanisms of resistance through serial sampling. The most commonly analyzed biomarkers include circulating tumor DNA (ctDNA), circulating tumor cells (CTCs), and extracellular vesicles (EVs), each providing complementary molecular information about the tumor landscape [2] [1].
Compared to traditional tissue biopsy, liquid biopsy presents significant advantages including minimal invasiveness, ability for frequent serial monitoring, rapid turnaround time, and capacity to capture tumor heterogeneity [2]. These characteristics are particularly valuable in immunotherapy, where treatment responses can be unpredictable and often exhibit unconventional patterns. The integration of liquid biopsy into immuno-oncology represents a paradigm shift toward data-driven, personalized treatment strategies that can be dynamically adjusted based on molecular response.
Analytical Components of Liquid Biopsy
Circulating Tumor DNA (ctDNA)
Circulating tumor DNA consists of fragmented DNA molecules released into the bloodstream through tumor cell apoptosis or necrosis. ctDNA typically represents 0.1-1.0% of total cell-free DNA and has a short half-life of approximately 16 minutes to 2.5 hours, enabling real-time monitoring of tumor dynamics [1]. Molecular analysis of ctDNA focuses primarily on somatic mutations, copy number variations (CNVs), and epigenetic modifications such as DNA methylation patterns [50] [51].
In immunotherapy, ctDNA dynamics have emerged as a sensitive biomarker for early response assessment. Decreasing ctDNA levels following immune checkpoint inhibitor (ICI) initiation often correlate with clinical benefit, while persistent or rising levels may indicate primary resistance [52] [19]. Specific genomic features detectable in ctDNA, including tumor mutational burden (TMB) and microsatellite instability (MSI), can help identify patients most likely to benefit from immunotherapy [51].
Circulating Tumor Cells (CTCs)
Circulating tumor cells are intact cancer cells shed from primary or metastatic tumors into the circulation. While extremely rare (approximately 1 CTC per 1 million leukocytes), CTCs provide valuable information about phenotypic changes and protein expression patterns [1]. The CellSearch system remains the only FDA-cleared method for CTC enumeration, though emerging microfluidic technologies like Parsortix enable capture and molecular characterization of CTCs without reliance on surface marker expression [1] [53].
In immunotherapy, CTC analysis permits direct assessment of PD-L1 expression on tumor cells. Studies have demonstrated that PD-L1+ CTCs may be detected even when tissue biopsies show low PD-L1 expression, potentially identifying patients who could benefit from ICIs despite negative tissue testing [53]. Additionally, morphological evaluation of CTCs can reveal features of chromosomal instability, which has been associated with resistance to taxane chemotherapy in metastatic prostate cancer [19].
Tumor-Derived Extracellular Vesicles (EVs)
Extracellular vesicles, including exosomes, are membrane-bound particles released by cells that carry proteins, nucleic acids, and lipids from their cell of origin. Tumor-derived EVs play important roles in intercellular communication and modulation of the tumor microenvironment [2]. Techniques for EV isolation primarily exploit physical and biochemical properties, with preparative ultracentrifugation being the most common method [2].
In neuroblastoma, plasma EV concentration and nucleolin expression have been found to be higher in high-risk patients, suggesting potential as prognostic biomarkers [19]. EV-based liquid biopsies offer the advantage of protecting their molecular cargo from degradation, potentially providing more stable biomarkers than cell-free nucleic acids alone.
Clinical Applications in Immunotherapy
Treatment Selection and Patient Stratification
Liquid biopsy enables non-invasive molecular profiling to identify biomarkers predictive of response to immunotherapy. Key applications include:
- PD-L1 expression analysis: Comparative studies have shown good agreement between PD-L1 expression in CTCs and matched tumor tissue, with CTC analysis sometimes identifying PD-L1+ patients who would have been missed by tissue testing alone [53].
- Tumor Mutational Burden (TMB) assessment: Both tissue and blood-based TMB measurement can help identify patients with mutation-rich tumors that are more likely to respond to ICIs [51].
- Microsatellite Instability (MSI) detection: Liquid biopsy approaches for MSI detection are increasingly validated as alternatives to tissue testing [2].
Table 1: Liquid Biopsy Biomarkers for Immunotherapy Patient Selection
| Biomarker | Analytic | Utility in Immunotherapy | Clinical Validation Status |
|---|---|---|---|
| PD-L1 Expression | CTCs | Identifies patients likely to respond to ICIs | Demonstrated in prospective studies [53] |
| Tumor Mutational Burden | ctDNA | Predicts response to immune checkpoint inhibitors | Validated in multiple cancer types [51] |
| Microsatellite Instability | ctDNA | Identifies patients for pan-cancer ICI approval | FDA-approved tissue testing; liquid biopsy emerging |
| ESR1 Mutations (Breast Cancer) | ctDNA | Guides switching to alternative therapies | Validated in SERENA-6 trial [52] |
| Chromosomal Instability in CTCs | CTCs | Predicts taxane resistance in prostate cancer | Associated with outcomes in CARD trial [19] |
Response Monitoring and Resistance Detection
Early detection of response to immunotherapy is crucial for clinical decision-making. Liquid biopsy enables more rapid assessment of treatment efficacy than conventional imaging:
- ctDNA dynamics: Changes in ctDNA levels often precede radiographic changes by weeks to months. The Guardant Reveal test has demonstrated capability to detect responses to immunotherapy up to 5 months earlier than standard imaging, with decreased tumor fraction strongly associated with improved outcomes [54].
- Multi-analyte approaches: Tempus's xM for TRM assay integrates multiple parameters including copy number variations and variant allele frequencies to comprehensively estimate circulating tumor fraction during ICI treatment [50].
- Molecular response assessment: In advanced solid tumors treated with ICIs, longitudinal monitoring of ctDNA can identify molecular responders who show improved survival compared to non-responders [50].
Table 2: Liquid Biopsy Assays for Immunotherapy Monitoring
| Assay Name | Manufacturer/Developer | Key Analytes | Reported Performance |
|---|---|---|---|
| xM for TRM | Tempus | ctDNA (CNVs, VAFs) | Detects molecular response prior to 6 weeks of ICI treatment [50] |
| Guardant Reveal | Guardant Health | Epigenomic signals (methylation) | Detects immunotherapy response up to 5 months earlier than imaging [54] |
| Signatera | Natera | ctDNA mutations | ctDNA dynamics associated with time to next treatment in advanced breast cancer [52] |
| MUTE-Seq | Research Use | Low-frequency mutations | Ultrasensitive MRD detection for immunotherapy monitoring [19] |
| uRARE-seq | Research Use | Cell-free RNA (cfRNA) | 94% sensitivity for MRD in bladder cancer patients [19] |
Experimental Methodologies
CTC Isolation and PD-L1 Detection Protocol
The following detailed protocol is adapted from methods used in clinical studies evaluating PD-L1 expression on CTCs in NSCLC patients [53]:
Blood Collection: Collect 7.5 mL peripheral blood into Transfix CTC preservation tubes (Cytomark) and process within 24-72 hours of collection.
CTC Enrichment: Use the Parsortix system (ANGLE plc) for size-based microfluidic enrichment of CTCs. Apply pressure to pass blood through a 6.5 μm gap cassette, capturing cells based on size and deformability.
Cell Harvesting: Flush captured cells from the cassette into cytospin funnels and centrifuge onto glass slides (RCF 190 × g, 5 minutes). Air-dry slides overnight and store at -80°C until analysis.
Immunofluorescence Staining:
- Fix cells with 0.5% PFA for 10 minutes at room temperature
- Wash three times with 1× PBS (3 minutes each)
- Block with 10% AB-serum (20 minutes)
- Incubate with primary antibody (rabbit anti-human PD-L1, clone HL1041, 1:100 dilution) overnight at 4°C
- Wash three times with PBS
- Incubate with secondary antibody (BD Horizon BV421 goat anti-rabbit, 1:200) for 45 minutes
- Wash three times with PBS
- Incubate with directly conjugated antibodies: pan-keratin AE1/AE3-eFluor560 (1:200), CD45-PerCP (1:200), and DRAQ5 nuclear stain (1:5000) for 60 minutes
- Apply coverslip with ProLong Gold Antifade reagent
Microscopy and Analysis: Image slides using fluorescence microscopy. Identify CTCs as keratin-positive, DRAQ5-positive, CD45-negative cells with intact morphology. Evaluate PD-L1 expression as positive or negative based on membrane staining.
ctDNA-Based Therapy Response Monitoring
For monitoring response to immunotherapy using ctDNA, the following protocol represents methodologies used in recent clinical studies [50] [54]:
Blood Collection and Plasma Separation:
- Collect blood in cell-free DNA collection tubes (e.g., Streck Cell-Free DNA BCT)
- Process within 6 hours of collection: centrifuge at 1600 × g for 10 minutes at 4°C
- Transfer plasma to fresh tubes and centrifuge at 16,000 × g for 10 minutes to remove cellular debris
- Store plasma at -80°C or proceed immediately to DNA extraction
Cell-Free DNA Extraction:
- Extract cfDNA from 4-10 mL plasma using commercially available kits (e.g., QIAamp Circulating Nucleic Acid Kit)
- Elute in 20-50 μL TE buffer or nuclease-free water
- Quantify using fluorometric methods (e.g., Qubit dsDNA HS Assay)
Library Preparation and Sequencing:
- Convert 10-50 ng cfDNA into sequencing libraries using hybrid capture or amplicon-based approaches
- For targeted sequencing, include baits for relevant immunotherapy biomarkers (e.g., PD-L1, TMB-associated genes, MSI markers)
- For whole-genome methylation approaches, perform bisulfite conversion prior to library preparation
Bioinformatic Analysis:
- Align sequences to reference genome (e.g., GRCh38)
- Call somatic variants using specialized algorithms for low-frequency mutations
- Calculate tumor fraction using multiple approaches:
- Somatic variant allele frequencies
- Copy number variations
- Epigenomic signatures (methylation patterns)
- For response monitoring, compare variant allele frequencies and overall tumor fraction across sequential timepoints
Interpretation and Reporting:
- Define molecular response as significant decrease in tumor fraction (>50% reduction)
- Define molecular progression as significant increase in tumor fraction or emergence of new resistance mutations
- Correlate ctDNA dynamics with radiographic and clinical findings
Computational and Bioinformatics Approaches
Advanced computational methods are essential for analyzing complex liquid biopsy data in immunotherapy applications. Key approaches include:
- Multi-parametric algorithms: Assays like Tempus xM integrate copy number variations along with somatic and germline variant allele frequencies for comprehensive estimation of circulating tumor fraction [50].
- Methylation-based deconvolution: Models capable of quantifying proportions of different histology subtypes within a single blood sample have achieved 85.1% accuracy, with detection sensitivity down to 0.1% tumor fraction [19].
- Fragmentomics analysis: Evaluation of cfDNA fragmentation patterns can distinguish cancer states with high accuracy (AUC 0.92), providing an alternative approach for cancer detection and monitoring [19].
- Composite scoring systems: The CIRI-LCRT model integrates radiomic features from CT scans with serial ctDNA measurements, predicting progression 2-3 months earlier than conventional post-treatment MRD assays alone [19].
The following diagram illustrates the integrated computational workflow for liquid biopsy data analysis in immunotherapy monitoring:
Liquid Biopsy Computational Workflow
Research Reagent Solutions
Table 3: Essential Research Reagents for Liquid Biopsy in Immunotherapy Studies
| Reagent/Category | Specific Examples | Function/Application | Considerations for Immunotherapy Studies |
|---|---|---|---|
| Blood Collection Tubes | Streck Cell-Free DNA BCTTransfix CTC-TVTs | Preserves cellular and molecular integrity during storage/transport | CTC tubes enable PD-L1 protein detection; cfDNA tubes prevent genomic DNA contamination |
| Nucleic Acid Extraction Kits | QIAamp Circulating Nucleic Acid KitMaxwell RSC ccfDNA Plasma Kit | Isolation of high-quality cfDNA/RNA from plasma | High recovery of short fragments essential for ctDNA analysis |
| - Enrichment Systems | ParsortixCellSearchISET | CTC isolation and enrichment | Size-based methods (Parsortix, ISET) capture heterogeneous CTC populations including epithelial-mesenchymal transition phenotypes |
| Library Preparation | AVENIO ctDNA kitsSafe-SeqSMUTE-Seq | Preparation of sequencing libraries from low-input cfDNA | Unique molecular identifiers improve detection sensitivity for low-frequency variants |
| Target Enrichment | Hybrid capture panelsAmplicon panels | Enrichment of cancer-relevant genomic regions | Panels should include immunotherapy-relevant genes (PD-L1, TMB, MSI markers) |
| Sequencing Platforms | Illumina NovaSeqIon Torrent Genexus | High-throughput sequencing | Ultra-deep sequencing (>10,000x) required for low-frequency variant detection in ctDNA |
| Immunofluorescence Reagents | PD-L1 antibodies (clone 28-8, HL1041)Pan-keratin antibodiesCD45 antibodies | CTC identification and characterization | Antibody validation critical for accurate PD-L1 detection on CTCs |
Current Clinical Trials and Evidence
The clinical utility of liquid biopsy in immunotherapy is being evaluated in numerous ongoing trials. As of March 2025, there were 25 United States registered governmental clinical trials targeting immunotherapy and liquid biopsy, with 20 trials actively recruiting and 5 not yet recruiting [2]. Key practice-changing studies include:
SERENA-6 trial: This registrational study demonstrated that switching therapies based on ctDNA findings has clinical utility. Patients with advanced HR-positive HER2-negative breast cancer receiving CDK4/6 inhibitors with aromatase inhibitors were monitored for ESR1 mutations in ctDNA. Those with detected ESR1 mutations without radiographic progression were randomized to switch to camizestrant (SERD) or continue aromatase inhibition. The study demonstrated improved progression-free survival and quality of life for patients switching therapies upon molecular progression [52].
DYNAMIC-III trial: This prospective randomized study in resected stage III colon cancer assigned patients to ctDNA-informed or standard management. While treatment escalation strategies for ctDNA-positive patients did not improve recurrence-free survival, the study highlighted the importance of novel escalation strategies beyond current standard therapies [52].
ROME trial: An exploratory analysis demonstrated that combining tissue and liquid biopsy improved detection of actionable alterations and led to improved survival outcomes in patients receiving tailored therapy, despite only 49% concordance between the two modalities [19].
RADIOHEAD study: A large clinical validation study focused on immune checkpoint inhibitor response across multiple solid tumors demonstrated that Guardant Reveal successfully detected responses to immunotherapy up to 5 months earlier than standard imaging [54].
Future Perspectives and Challenges
While liquid biopsy shows significant promise in immunotherapy applications, several challenges remain. Analytical sensitivity for early-stage disease detection requires improvement, as current ctDNA assays have limited sensitivity for stage I cancers [52]. Standardization of methodologies, interpretation criteria, and reporting across platforms is essential for broader clinical adoption. The integration of multi-analyte approaches (combining ctDNA, CTCs, and EVs) may provide a more comprehensive assessment of tumor dynamics and immune interactions.
Future directions include the development of real-time adaptive clinical trials using liquid biopsy for patient selection and response assessment, exploration of novel biomarkers beyond current applications, and implementation of artificial intelligence approaches for complex data integration. As evidence accumulates, liquid biopsy is poised to become an integral component of immuno-oncology practice, enabling more personalized, dynamic treatment approaches that ultimately improve patient outcomes.
Multi-cancer early detection (MCED) tests represent a transformative approach in oncology, leveraging liquid biopsy to screen for multiple cancers simultaneously from a single blood draw. Framed within the broader applications of liquid biopsy, these tests aim to overcome the fundamental limitation of current cancer screening, which is largely confined to single-organ, site-specific tests. In the United States, routine screening is recommended for only five cancer types (breast, cervical, colorectal, lung, and prostate), leaving approximately 70% of cancer cases without recommended screening options [55] [56]. This gap is significant, as cancers without screening protocols account for nearly three-quarters of all cancer deaths [55]. MCED technologies harness the molecular analysis of circulating tumor DNA (ctDNA) and other cancer-derived biomarkers in the blood, potentially revolutionizing population-scale cancer screening by detecting malignancies at earlier, more treatable stages [57] [58].
The clinical imperative is clear: early detection substantially improves survival outcomes. For example, the five-year survival rate for stage I colorectal cancer is 92.3%, compared to only 18.4% for stage IV [58]. MCED tests are designed to complement existing standard-of-care screenings, not replace them, thereby creating a more comprehensive early detection ecosystem [56]. By identifying cancers at earlier stages, MCED tests have the potential to significantly reduce late-stage diagnoses. Simulation modeling indicates that supplementing standard care with annual MCED testing could lead to a 45% decrease in stage IV diagnoses over ten years, with the most substantial absolute reductions in lung, colorectal, and pancreatic cancers [59]. This whitepaper provides an in-depth technical examination of MCED technologies, their performance characteristics, underlying methodologies, and the research tools driving their development.
Technological Foundations of MCED Tests
MCED tests analyze cell-free DNA (cfDNA), which consists of short DNA fragments released into the bloodstream from cells throughout the body. In cancer patients, a subset of cfDNA originates from malignant cells and is termed circulating tumor DNA (ctDNA). The core challenge lies in identifying the minute cancerous signals within the background of normal cfDNA; ctDNA can represent as little as 0.5% of total cfDNA in early-stage cancer patients [57]. MCED tests employ various molecular strategies to detect these subtle signals, primarily focusing on three analytical approaches:
- DNA Methylation Analysis: This epigenetic profiling examines patterns of methyl chemical groups attached to DNA, which regulate gene expression without altering the underlying DNA sequence. Cancer cells exhibit distinct methylation patterns that can serve as highly specific biomarkers. The Galleri test (GRAIL), for example, targets over 100,000 genomic regions with differential methylation patterns associated with cancer [57].
- Somatic Mutation Detection: This approach identifies acquired genetic mutations in cancer-associated genes. CancerSEEK, a forerunner to Exact Sciences' Cancerguard, initially assayed mutations in 16 genes (covering >1,900 distinct genomic positions) [57].
- Multi-Analyte Profiling: More recent assays integrate multiple biomarker classes to enhance sensitivity. For instance, Exact Sciences' Cancerguard in development combines DNA methylation, protein biomarkers, and a DNA mutation reflex (MP-r) approach to improve early-stage cancer detection [60].
The following diagram illustrates the core workflow of an MCED test, from blood draw to clinical reporting:
Figure 1: MCED Test Workflow. The process begins with blood collection, followed by plasma separation and cell-free DNA (cfDNA) extraction. Molecular analysis through next-generation sequencing generates data for bioinformatics processing using artificial intelligence algorithms. The final step involves cancer signal detection with or without tissue of origin prediction, leading to a clinical report.
Performance Landscape of Leading MCED Platforms
The evolving MCED landscape features several advanced platforms in development and validation stages. The performance characteristics of these tests are crucial for understanding their potential clinical utility. The table below summarizes key performance metrics for leading MCED tests based on recent studies and publications:
Table 1: Performance Characteristics of Select MCED Tests in Development
| Test Name | Company/Developer | Key Biomarkers | Reported Sensitivity | Reported Specificity | Cancer Types Detected |
|---|---|---|---|---|---|
| Galleri | GRAIL | Methylation patterns (>100,000 regions) | 51.5% (all stages) [58]; 76.4% for 12 high-signal cancers (Stages I-IV) [57] | 99.5% [58] | >50 cancer types [58] |
| Cancerguard (in dev) | Exact Sciences | Methylation, proteins, DNA mutation reflex | Stage I sensitivity increased 28% with MP-r approach [60] | 98.5% [60] | Multiple cancers, including those without screening options |
| CancerSEEK | Exact Sciences | 16 gene mutations, 8 proteins | 62% (across 8 cancer types) [58] | >99% [58] | 8 cancer types (lung, breast, colorectal, pancreatic, etc.) |
| Shield | Guardant Health | Genomic mutations, methylation, fragmentation | 83% for colorectal cancer (all stages) [58] | N/R | Currently colorectal cancer, expanding to multi-cancer |
| DELFI | Delfi Diagnostics | cfDNA fragmentation profiles | 73% [58] | 98% [58] | Lung, breast, colorectal, pancreatic, and others |
N/R = Not Reported; dev = development
Recent clinical studies provide compelling evidence for the potential impact of MCED testing. The PATHFINDER 2 study, presented in 2025, found that adding the Galleri test to standard screening increased cancer detection more than seven-fold compared to standard screening alone. Importantly, 73% of the cancers detected had no existing screening tests, and 53.5% were detected at stage I or II [61]. The test demonstrated a low false-positive rate of 0.4% and correctly identified the tissue of origin in over 90% of detected cancers [61].
Sensitivity for MCED tests varies significantly by cancer stage, with higher sensitivity for advanced stages. For the Galleri test, sensitivity across 50 cancer types was reported at 54.9% for stages I-IV combined, but when analyzed by stage, sensitivity was 39% for stage I, increasing to 92% for stage IV [57]. This stage-dependent sensitivity highlights the technological challenge of detecting early-stage cancers that shed minimal ctDNA.
Experimental Protocols and Methodological Frameworks
Pre-Analytical Sample Processing
Standardized pre-analytical protocols are critical for reliable MCED results due to the low abundance and fragility of ctDNA. The following protocol outlines a validated workflow for cfDNA extraction:
- Sample Collection: Collect blood into specialized cell-stabilizing tubes (e.g., Streck Cell-Free DNA BCT or PAXgene Blood cDNA tubes) to prevent genomic DNA contamination from white blood cell lysis. Maintain samples at room temperature and process within 24-48 hours of collection [62].
- Plasma Separation: Perform sequential centrifugations - initial centrifugation at 800-1,600 × g for 10-20 minutes at room temperature to separate plasma from blood cells, followed by a second centrifugation at 16,000 × g for 10 minutes at 4°C to remove remaining cellular debris [62].
- cfDNA Extraction: Utilize magnetic bead-based extraction systems for high recovery efficiency. The optimized protocol should yield cfDNA with a characteristic nucleosomal fragmentation pattern (~167 bp) and minimal genomic DNA contamination. Validate recovery rates using spike-in controls like synthetic cfDNA reference standards [62].
- Quality Control: Quantify cfDNA using fluorometric methods (e.g., Qubit) and assess fragment size distribution via microfluidic electrophoresis (e.g., Agilent TapeStation). Acceptable samples should show a peak at ~167 bp with less than 5% of fragments >500 bp [62].
Analytical Validation Approaches
Rigorous validation is essential to establish test performance characteristics. The following methodologies represent current best practices:
- Limit of Detection (LOD) Determination: Conduct serial dilutions of reference materials with known variant allele frequencies (VAF). The LOD is defined as the lowest VAF at which ≥95% of replicates test positive. Advanced assays like Northstar Select have achieved LODs of 0.15% VAF for SNVs/Indels and 0.30% for gene fusions [63] [64].
- Analytical Specificity Evaluation: Test a minimum of 100-200 cancer-free individuals to establish specificity and false-positive rates. High-specificity thresholds (>99%) are crucial for population screening to minimize unnecessary follow-up procedures [57] [61].
- Precision Assessment: Perform repeat testing across multiple days, operators, and instruments to determine intra-run and inter-run precision. Criteria for acceptance typically require ≥95% concordance between replicates [62].
- Reference Materials: Utilize commercially available multiplexed reference standards (e.g., Seraseq ctDNA, AcroMetrix multi-analyte controls) containing clinically relevant variants across multiple genes and alteration types at defined VAFs [62].
The following diagram illustrates the molecular analysis and computational pipeline for MCED tests:
Figure 2: MCED Analysis Pipeline. Following cfDNA extraction, libraries are prepared and sequenced. Bioinformatics pipelines process the raw data and extract molecular features. Machine learning algorithms integrate these features to classify samples as cancer-positive or negative, often with prediction of the tissue of origin.
The Scientist's Toolkit: Essential Research Reagents and Platforms
Successful implementation of MCED research requires carefully selected reagents, reference materials, and analytical platforms. The following table details essential components for establishing a robust MCED research workflow:
Table 2: Essential Research Reagents and Platforms for MCED Development
| Category | Specific Product/Platform | Research Application | Key Characteristics |
|---|---|---|---|
| Blood Collection Tubes | Streck Cell-Free DNA BCT | Blood sample stabilization | Preserves cell integrity, prevents gDNA release, enables room temp storage up to 48h [62] |
| Reference Standards | Seraseq ctDNA Complete | Analytical validation | Contains 25 multiplexed variants (SNVs, INDELs, CNVs, SVs) at defined VAFs (0.1-5%) [62] |
| Reference Standards | AcroMetrix Multi-analyte ctDNA Plasma Control | Extraction efficiency testing | Includes 7 SNVs, 4 INDELs, 2 CNVs at VAFs of 0%, 0.1%, 0.5%, 1% in plasma matrix [62] |
| Extraction Systems | Magnetic bead-based cartridge systems | Automated cfDNA extraction | High-throughput, consistent fragment size distribution, minimal gDNA contamination [62] |
| QC Instruments | Agilent TapeStation | cfDNA fragment size analysis | Assesses fragment distribution (mononucleosomal ~167 bp), detects gDNA contamination [62] |
| Sequencing Platforms | Illumina NovaSeq, PacBio Sequel | Target enrichment & sequencing | High-depth sequencing for low VAF detection; long-read for methylation patterns |
| Bioinformatics Tools | Custom machine learning algorithms | Cancer signal classification | Integrates multiple biomarker classes, reduces false positives, predicts tissue of origin [57] |
MCED technologies represent a paradigm shift in cancer screening, potentially addressing significant gaps in early detection for many deadly cancer types. Current evidence suggests that these tests, when used alongside standard screenings, can detect more cancers and at earlier stages, particularly for cancers with no recommended screening [59] [61]. However, several research challenges remain before widespread clinical implementation can occur.
Key research priorities include validating MCED tests in large, diverse population cohorts through pivotal trials to demonstrate reduction in cancer-specific mortality [56]. The optimal screening interval (annual vs. other frequencies) needs determination, and diagnostic pathways for positive MCED results require standardization to ensure efficient, cost-effective workups [56] [61]. Additionally, researchers must address the risk of overdiagnosis and the psychological impact of screening, while developing strategies to ensure these innovative technologies reduce rather than exacerbate healthcare disparities [61].
The integration of multiple biomarker classes—methylation, fragmentation patterns, mutations, and proteins—appears promising for enhancing early-stage sensitivity while maintaining high specificity [60]. As these technologies evolve, MCED tests hold potential to substantially contribute to the Cancer Moonshot goal of reducing cancer mortality by half within 25 years, fundamentally transforming the early cancer detection landscape through the power of liquid biopsy [56].
Navigating Challenges and Enhancing Performance in Liquid Biopsy
Addressing Sensitivity and Specificity in Early-Stage Cancers
The detection of early-stage cancers represents a formidable challenge in oncology, primarily due to the minimal disease burden and low abundance of tumor-derived biomarkers in circulation. Liquid biopsy has emerged as a transformative approach for non-invasive cancer detection, profiling, and monitoring by analyzing tumor-derived components from bodily fluids [2] [1]. Unlike traditional tissue biopsies, liquid biopsies provide a systemic view of tumor heterogeneity and enable real-time monitoring of disease progression through serial sampling [2]. However, the clinical utility of liquid biopsy in early-stage cancers critically depends on overcoming fundamental limitations in analytical sensitivity and specificity, which must be sufficient to detect and validate rare tumor signals against a background of predominantly normal cellular material [1] [65].
The biological challenge is substantial: in early-stage disease, circulating tumor DNA (ctDNA) can constitute less than 0.1% of total cell-free DNA (cfDNA), requiring technologies capable of detecting a single mutant molecule among thousands of wild-type fragments [1]. This technical guide examines the evolving methodologies and multidimensional approaches being developed to enhance the performance characteristics of liquid biopsy platforms, with particular emphasis on their application in early cancer detection within oncology research and drug development programs.
Performance Metrics of Current Liquid Biopsy Modalities
The diagnostic performance of liquid biopsy varies significantly across technological platforms, biomarker classes, and cancer types. The following table summarizes recent performance data for various liquid biopsy approaches in early cancer detection:
Table 1: Performance Metrics of Liquid Biopsy Modalities in Early Cancer Detection
| Technology/Biomarker | Cancer Type(s) | Sensitivity (Stage I) | Specificity | Key Features |
|---|---|---|---|---|
| cfDNA Fragmentomics | Renal Cell Carcinoma [66] | 87.8% | 93.8% | Analyzes copy number variation, fragment size ratio, and nucleosome footprint |
| cfDNA Fragmentomics | Liver Cirrhosis/HCC [19] | N/A | N/A | AUC 0.92 for identifying cirrhosis facilitating HCC surveillance |
| Methylation-based MCED [19] | 12 Tumor Types | 59.7% (Overall) | 98.5% | 88.2% top prediction accuracy for Cancer Signal Origin |
| Hybrid-Capture Methylation [19] | Multiple | 73% (cancers without screening) | 98.5% | High sensitivity in pancreatic, liver, esophageal cancers (74%) |
| Proteomic Analysis [19] | Breast Cancer | 19 proteins (premenopausal) 3 proteins (postmenopausal) | N/A | Risk stratification by menopausal status |
| Multi-omics [19] | Smoking-associated cancers | N/A | N/A | 27-plasma biomarker panel validated for cancer prediction |
Multiple studies have demonstrated that multi-analyte approaches generally outperform single-analyte platforms. For instance, the combination of fragmentomics with mutation analysis has shown enhanced sensitivity for early-stage renal cell carcinoma (RCC), achieving 90.5% sensitivity and 93.8% specificity in a recent study [66]. Similarly, in hepatocellular carcinoma (HCC) surveillance, cfDNA fragmentomics distinguished cirrhosis and HCC from healthy states with an area under the curve (AUC) of 0.92, facilitating earlier intervention in high-risk populations [19].
Critical Biomarkers and Their Technical Considerations
Circulating Tumor DNA (ctDNA) and Fragmentomics
CtDNA consists of short DNA fragments (approximately 20-50 base pairs) released into circulation primarily through apoptosis and necrosis of tumor cells [1]. The half-life of ctDNA is approximately 114 minutes, enabling real-time monitoring of tumor dynamics [67]. In early-stage cancers, ctDNA often represents less than 0.1% of total cfDNA, necessitating extremely sensitive detection methods [1]. Fragmentomics leverages the observation that ctDNA exhibits distinct fragmentation patterns compared to normal cfDNA, with specific patterns of nucleosome protection and cleavage that reflect the epigenetic landscape of tumor cells [19] [66]. These fragmentation patterns can be identified through low-coverage whole genome sequencing (5X coverage), analyzing features such as copy number variation, fragment size ratio, and nucleosome footprint [66].
DNA Methylation Signatures
DNA methylation represents one of the earliest and most stable cancer-associated epigenetic alterations, occurring in CpG islands throughout the genome [67]. Methylation patterns are tissue-specific, enabling not only cancer detection but also identification of the tissue of origin (cancer signal origin) [19]. Technically, methylation analysis typically involves bisulfite conversion, which deaminates unmethylated cytosines to uracils while leaving methylated cytosines unchanged, followed by sequencing or array-based detection [67]. Panels targeting genes such as RASSF1A, OPCML, and BRCA1 have demonstrated sensitivity and specificity as high as 91% for early malignancy detection [67].
Circulating Tumor Cells (CTCs) and Other Analytes
CTCs are intact cancer cells shed from primary or metastatic sites into the bloodstream, typically at very low concentrations (<10 cells/mL) [1] [67]. Their half-life ranges from 1 to 2.4 hours, and they are commonly identified using epithelial markers such as epithelial cell adhesion molecule (EpCAM) or via distinct cellular traits [67]. Other valuable analytes include tumor-educated platelets (TEPs), which have absorbed tumor-derived materials (e.g., mRNA, proteins, vesicles), and exosomes (30-100 nm vesicles carrying DNA, RNA, miRNAs, and proteins) that reflect the molecular makeup of their cells of origin [67].
Table 2: Comparison of Key Liquid Biopsy Biomarkers for Early Detection
| Biomarker | Abundance in Early Cancer | Half-Life | Primary Detection Methods | Advantages | Limitations |
|---|---|---|---|---|---|
| ctDNA | <0.1% of total cfDNA [1] | ~114 min [67] | ddPCR, NGS, BEAMing | Short half-life enables real-time monitoring, captures tumor heterogeneity | Very low fraction in early disease, requires high-sensitivity detection |
| Methylation Signatures | Varies by gene and cancer type | Stable epigenetic mark | Bisulfite sequencing, arrays | Tissue-specific patterns, early event in carcinogenesis | Complex bioinformatics, requires large reference datasets |
| CTCs | <10 cells/mL blood [67] | 1-2.4 hours [67] | CellSearch, microfluidic devices, filtration | Provides intact cells for functional studies | Extremely rare in early disease, technical challenges in isolation |
| Exosomes | Increased in cancer [67] | Variable | Ultracentrifugation, nanomembrane filtration, tetraspanin capture | Protected cargo, reflects cellular origin, multiple molecular species | Heterogeneous population, standardization challenges |
| Proteins | Varies by protein | Hours to days | Immunoassays, mass spectrometry | Established methodologies, some clinically validated | Limited specificity individually, often requires panels |
Advanced Methodologies for Enhanced Sensitivity
Ultrasensitive Mutation Detection
Novel approaches are pushing the boundaries of mutation detection sensitivity. The MUTE-Seq (Mutation tagging by CRISPR-based Ultra-precise Targeted Elimination in Sequencing) method leverages a highly precise FnCas9-AF2 variant to selectively eliminate wild-type DNA, enabling highly sensitive detection of low-frequency cancer-associated mutations for minimal residual disease (MRD) evaluation [19]. This method demonstrates significant improvement in the sensitivity of simultaneous mutant detection in non-small cell lung cancer (NSCLC) and pancreatic cancer [19].
Another emerging approach involves the use of personalized, tumor-informed assays that first identify tumor-specific mutations through tissue sequencing, then design custom panels to monitor these mutations in plasma. This strategy, exemplified by assays like NeXT Personal and Signatera, can achieve sensitivities down to 1 part per million (ppm), making them particularly valuable for MRD detection and early recurrence monitoring [27].
Multi-modal and Multi-omic Integration
The integration of multiple biomarker classes significantly enhances both sensitivity and specificity. Multi-cancer early detection (MCED) tests now routinely combine various analytic approaches, as demonstrated by Cancerguard, which analyzes multiple biomarker classes to detect over 50 cancer (sub)types [27]. Similarly, the PROMISE study explores multi-omics liquid biopsy approaches for multi-cancer early detection, integrating genomic, epigenomic, and fragmentomic features [27].
The biological rationale for multi-omic integration lies in the complementary nature of different biomarker classes. For instance, while ctDNA mutations provide direct evidence of tumor-specific genetic alterations, fragmentomic patterns reflect the epigenetic state of cells, and protein biomarkers can indicate systemic responses to early malignancy [19]. This integration is particularly powerful when combined with machine learning algorithms, as demonstrated by the stacked ensemble model used in RCC detection that achieved an AUC of 0.96 [66].
Experimental Workflows and Protocols
Comprehensive Liquid Biopsy Workflow for Early Cancer Detection
The following diagram illustrates a integrated workflow for early cancer detection using multi-modal liquid biopsy approaches:
Detailed Methodological Protocols
Pre-analytical Phase: Sample Collection and Processing
Blood Collection and Plasma Separation Protocol:
- Collect blood in cell-stabilization tubes (e.g., Streck, PAXgene) to prevent genomic DNA contamination and preserve analyte integrity [2]
- Process within 4-6 hours of collection: centrifuge at 800-1600 × g for 10 minutes at 4°C to separate plasma from cellular components
- Transfer supernatant to microcentrifuge tubes and perform a second centrifugation at 16,000 × g for 10 minutes to remove residual cells
- Aliquot plasma and store at -80°C to prevent freeze-thaw degradation
cfDNA Extraction Protocol:
- Use commercial cfDNA extraction kits (e.g., QIAamp Circulating Nucleic Acid Kit, MagMAX Cell-Free DNA Isolation Kit) following manufacturer's instructions
- Quantify cfDNA using fluorometric methods (e.g., Qubit dsDNA HS Assay)
- Assess fragment size distribution using Bioanalyzer or TapeStation to verify typical cfDNA profile (peak ~167 bp)
Analytical Phase: Multi-modal Analysis
Fragmentomics Analysis Protocol:
- Perform low-pass whole genome sequencing (0.5-5X coverage) using Illumina platforms
- Library preparation with 15-25 ng of cfDNA using kits compatible with low-input materials
- Sequence to achieve ~5 million read pairs per sample for fragmentomics analysis
- Analyze sequencing data for:
- Fragment size distribution: Calculate ratio of short (90-150 bp) to long (151-220 bp) fragments
- Copy number variation: Identify regional deviations from expected coverage
- Nucleosome positioning: Infer nucleosome footprint from end motifs and coverage patterns
DNA Methylation Analysis Protocol:
- Treat 20-50 ng cfDNA with bisulfite using commercial conversion kits (e.g., EZ DNA Methylation Kit)
- Perform bisulfite sequencing using targeted approaches (e.g., bisulfite padlock probes) or whole-genome bisulfite sequencing
- Map sequencing reads to bisulfite-converted reference genome
- Identify differentially methylated regions (DMRs) by comparing to healthy control samples
- Apply machine learning classifiers trained on methylation signatures of specific cancer types
Targeted Mutation Detection Protocol:
- For ddPCR: Design mutant-specific probes and wild-type suppression probes for known driver mutations
- For NGS: Use hybrid capture or amplicon-based approaches with molecular barcoding (e.g., Safe-SeqS, TAm-Seq)
- Include duplicate removal and error correction in bioinformatic pipeline
- Set variant calling threshold based on background error rate and validation data
The Scientist's Toolkit: Essential Research Reagents and Platforms
Table 3: Essential Research Tools for Liquid Biopsy in Early Cancer Detection
| Category | Specific Products/Platforms | Research Application | Key Features |
|---|---|---|---|
| Commercial Assays | Guardant360 CDx [27] | Companion diagnostic for ESR1 mutations in breast cancer | FDA-approved, detects mutations in 55+ genes |
| Galleri (Grail) [67] | Multi-cancer early detection | Methylation-based, >50 cancer types | |
| Cancerguard (Exact Sciences) [27] | Multi-cancer early detection | Multi-analyte, 50+ cancer types | |
| Emerging Platforms | NeXT Personal (Personalis) [19] [27] | MRD detection | Tumor-informed, ultra-sensitive (10 ppm) |
| Foundation Medicine MRD [27] | MRD research | Tissue-informed whole genome sequencing | |
| Northstar Select (BillionToOne) [27] | Comprehensive genomic profiling | Enhanced SNV/indel and CNV detection | |
| Analysis Tools | uRARE-seq [19] | Urine-based MRD in bladder cancer | cfRNA-based, 94% sensitivity |
| CIRI-LCRT model [19] | Predictive modeling in NSCLC | Integrates radiomics, pathology, ctDNA | |
| Stacked ensemble ML [66] | RCC detection from fragmentomics | Combines multiple fragmentomic features |
Biological Framework: Mechanisms of Biomarker Release
The following diagram illustrates the biological mechanisms through which tumor-derived biomarkers enter circulation in early-stage cancers:
Advancing sensitivity and specificity in early-stage cancer detection requires continued innovation across multiple domains. Emerging approaches include the development of more sophisticated machine learning algorithms that integrate fragmentomic patterns with other molecular features, the identification of novel protein biomarkers through comprehensive proteomic profiling, and the creation of highly multiplexed assays that simultaneously evaluate thousands of genomic, epigenomic, and proteomic features [19] [27]. Additionally, the integration of liquid biopsy with other data modalities, such as medical imaging and clinical risk factors, promises to further enhance predictive accuracy while reducing false positives [19].
For translational researchers, the path forward involves not only technological refinement but also rigorous validation in diverse populations and clinical settings. The Vanguard Study, part of the NCI Cancer Screening Research Network, exemplifies this approach by establishing feasibility and equitable recruitment strategies for future large-scale randomized controlled trials of multi-cancer detection assays [19]. As these technologies mature, they hold the potential to transform cancer screening paradigms, enabling earlier detection and intervention across a broad spectrum of malignancies.
Liquid biopsy, the analysis of circulating tumor DNA (ctDNA) from blood plasma, has emerged as a transformative tool in oncology research and clinical practice [19] [68]. This minimally invasive approach provides a dynamic snapshot of tumor genetics, enabling applications in early cancer detection, therapeutic target identification, treatment response monitoring, and minimal residual disease (MRD) detection [69]. However, the journey from blood draw to analyzable ctDNA is fraught with technical challenges. ctDNA represents a small fraction of the total cell-free DNA (cfDNA) in circulation, often present at low concentrations, especially in early-stage disease or pediatric cancers [70] [68]. Its integrity is vulnerable to numerous pre-analytical factors from the moment of blood collection through processing and storage. Variations in these procedures can significantly impact DNA yield, fragment size distribution, and the detectability of tumor-derived variants, potentially compromising the reliability of downstream analyses [71] [72]. Standardizing pre-analytical workflows is therefore paramount to ensuring data quality, reproducibility, and the successful translation of liquid biopsy from research settings into routine clinical diagnostics [69]. This guide details the critical pre-analytical variables in blood collection, processing, and stabilization that govern ctDNA analysis quality, providing evidence-based protocols for oncology researchers and drug development professionals.
Blood Collection Variables
The foundation of robust ctDNA analysis is laid at the very first step: blood collection. The choice of collection tube and adherence to strict handling protocols immediately after venipuncture are critical determinants of sample quality, primarily by preventing the release of genomic DNA from blood cells which would dilute the ctDNA fraction.
Blood Collection Tubes
K2- or K3-EDTA Tubes are widely used for cfDNA analysis. EDTA acts as an anticoagulant by chelating calcium, which prevents clotting and inhibits nuclease activity, thereby protecting cfDNA from degradation [69]. A significant limitation of EDTA tubes is that they require rapid processing. The integrity of blood cells diminishes over time, leading to leukocyte lysis and contamination of the plasma with high molecular weight genomic DNA. This dilution effect reduces the fractional abundance of ctDNA, potentially pushing it below the detection limit of sensitive assays [69] [70]. Consequently, plasma separation must be completed within 4-6 hours of blood collection when using EDTA tubes [69] [73].
Cell-stabilizing Blood Collection Tubes (BCTs), such as PAXgene Blood ccfDNA Tubes, contain preservatives that minimize cell lysis and stabilize the cellular components of blood. This allows for extended storage at ambient temperatures—up to 10 days at 25°C, 7 days at 30°C, or 3 days at 37°C—without significant degradation or genomic DNA contamination [73]. This flexibility is invaluable for multi-center studies where immediate processing is logistically challenging. Research has demonstrated that cfDNA yield, fragment size, and background noise in sequencing data from samples collected in BCTs and processed within 72 hours show no significant differences compared to EDTA tubes processed within 1 hour [70].
Table 1: Comparison of Blood Collection Tubes for ctDNA Analysis
| Tube Type | Mechanism | Maximum Storage Before Processing | Key Advantages | Key Limitations |
|---|---|---|---|---|
| K2/K3 EDTA Tubes [69] [73] | Anticoagulant that chelates calcium, inhibiting clotting and nucleases. | 4-6 hours at 4°C or room temperature [69]. | Low cost; readily available; does not inhibit PCR [69]. | Short processing window; risk of gDNA contamination from cell lysis. |
| Cell-stabilizing Tubes (BCTs) [73] [70] | Chemical preservatives that prevent cell lysis and stabilize cfDNA. | Up to 10 days at 25°C, 7 days at 30°C, or 3 days at 37°C [73]. | Enables flexible shipping and batch processing; reduces gDNA background [70]. | Higher cost; potential for chemical modification of DNA (varies by product). |
Blood Collection and Initial Handling
The technique for collecting blood is as important as the tube selected. Phlebotomy should be performed by trained personnel to minimize hemolysis, which can release intracellular contaminants and nucleases [73]. The blood collection tube must be filled to the specified volume to maintain the correct blood-to-additive ratio [69]. Immediately after collection, the tube should be gently inverted 8-10 times to ensure proper mixing of the blood with the anticoagulant or preservative [69]. Agitation and extreme temperature fluctuations during transport to the laboratory must be avoided to prevent hemolysis and cellular damage [69] [73]. For tests requiring high sensitivity, such as MRD detection, collecting additional blood volume (multiple tubes) is recommended to increase the input plasma volume and, consequently, the amount of recoverable ctDNA [69].
Plasma Processing and Storage
Following blood collection, the precise separation of plasma from cellular components is a critical step to preserve the native cfDNA population and prevent contamination.
Plasma Preparation Protocols
The recommended protocol is a two-step centrifugation process. It is crucial to note that the specific protocols differ between standard EDTA tubes and specialized BCTs.
For EDTA Tubes:
- First Centrifugation (Soft Spin): Centrifuge at 800–1,600 × g at 4°C for 10 minutes. This step separates plasma from red blood cells and the buffy coat (containing leukocytes and platelets). The supernatant (plasma) must be carefully aspirated, avoiding the buffy coat layer to prevent white blood cell contamination [69] [73].
- Second Centrifugation (Hard Spin): Transfer the supernatant to a new tube and centrifuge at a higher force of 14,000–16,000 × g at 4°C for 10 minutes. This second spin pellets any remaining platelets, cell fragments, and apoptotic bodies, yielding cell-free plasma [69] [73]. A speed of 3,000 × g is sufficient for platelet removal, while 16,000 × g will also remove larger extracellular vesicles [73].
For Cell-stabilizing BCTs: The centrifugation protocol may differ. For PAXgene Blood ccfDNA Tubes, the manufacturer recommends a two-step centrifugation, both performed at room temperature at 1,600–3,000 × g (first for 15 minutes, second for 10 minutes) [73]. Users should always follow the specific manufacturer's instructions for their chosen BCT.
The following workflow diagram summarizes the key decision points and steps in plasma processing.
Plasma Quality Control and Storage
After processing, plasma should undergo quality control before cfDNA extraction. Visual inspection is a simple first step: red or orange coloration indicates hemolysis, while a dark yellow/greenish hue suggests icterus, and opacity indicates lipemia [69]. These conditions can interfere with downstream analysis. Spectrophotometric measurement of oxyhemoglobin absorbance at 414 nm provides a more objective assessment of hemolysis [73].
To preserve the cfDNA profile, nuclease activity must be minimized. cfDNA extraction immediately after plasma separation is ideal. For short-term storage, plasma can be kept at 4°C for up to 3 hours or at -20°C for longer periods. For long-term storage, -80°C is recommended [69] [73]. Plasma is generally more stable than whole blood, and frozen plasma can be stored for up to two years at -20°C to -80°C without significant degradation [73]. Freezing and thawing cycles should be minimized.
Assessment of Sample Quality and ctDNA Stability
Evaluating the success of the pre-analytical phase is essential before proceeding to costly downstream genetic analysis. Key parameters include cfDNA concentration, fragment size, and the degree of background genomic DNA contamination.
Analytical Methods for Quality Control
Droplet Digital PCR (ddPCR) offers a highly sensitive method for quantifying amplifiable cfDNA and assessing its fragment size profile. Multiplexed ddPCR assays can be designed with short amplicons (e.g., ~71 bp) and long amplicons (e.g., ~471 bp) targeting single-copy genomic loci [70]. The ratio of short to long amplicons provides a measure of the low molecular weight cfDNA fraction, with a higher ratio indicating a purer cfDNA sample with less contamination from high molecular weight genomic DNA [70]. This method is particularly useful because it requires minimal input DNA and can be correlated with sequencing library diversity [70].
Capillary Electrophoresis (e.g., Agilent Bioanalyzer) provides a direct visualization of the DNA fragment size distribution. A high-quality plasma cfDNA sample typically shows a dominant peak at ~166 bp, corresponding to mononucleosomal DNA, with smaller peaks at integer multiples indicative of oligonucleosomes [71] [70]. A significant smear of high molecular weight DNA suggests contamination from lysed blood cells.
Impact of Pre-analytical Variables on Experimental Outcomes
Variations in pre-analytical handling have measurable consequences. A systematic comparison of seven different cfDNA extraction kits demonstrated significant variability in both cfDNA yield and the resulting fragment size distribution [70]. Furthermore, the timing of plasma processing influences the fragment profile; plasma processed immediately after venipuncture contains shorter cfDNA fragments, while delays can lead to an increase in background DNA from lysed cells, altering the profile and potentially obscuring the tumor-derived signal [70]. These findings underscore the necessity of consistent, standardized protocols across all samples within a study.
Table 2: Key Quality Control Metrics and Methods for ctDNA Analysis
| QC Parameter | Recommended Method(s) | Optimal/Expected Result | Interpretation of Suboptimal Result |
|---|---|---|---|
| cfDNA Concentration & Purity [70] | Multiplexed ddPCR (short vs. long amplicons); Fluorometry (Qubit). | Sufficient concentration for downstream assay; High short:long amplicon ratio. | Low yield may lead to assay failure; Low ratio indicates gDNA contamination. |
| Fragment Size Distribution [71] [70] | Capillary Electrophoresis (Bioanalyzer, TapeStation). | Dominant peak at ~166 bp. | Smear of high molecular weight DNA indicates cellular contamination. |
| Sample Purity (Hemolysis) [69] [73] | Visual inspection; Spectrophotometry (414 nm absorbance). | Plasma is clear, straw-colored; Low 414 nm absorbance. | Red/orange color or high 414 nm absorbance indicates hemolysis, which can interfere with PCR. |
The Scientist's Toolkit: Essential Research Reagents and Materials
The following table catalogues critical reagents and materials necessary for implementing a standardized pre-analytical workflow for ctDNA analysis.
Table 3: Research Reagent Solutions for ctDNA Pre-analytical Workflow
| Product Category/Name | Primary Function | Key Features & Considerations |
|---|---|---|
| PAXgene Blood ccfDNA Tubes [73] | Blood collection and stabilization. | Stabilizes nucleated blood cells for up to 10 days at room temperature, preventing gDNA release and preserving the native cfDNA profile. |
| K2/K3 EDTA Blood Collection Tubes [69] | Blood collection and anticoagulation. | Standard anticoagulant tube; requires plasma separation within 6 hours to minimize cell lysis. |
| QIAamp Circulating Nucleic Acid Kit [70] | Nucleic acid extraction. | Spin-column based method for the purification of cfDNA and other circulating nucleic acids from plasma; validated in multiple studies. |
| Various cfDNA Extraction Kits (A-G) [70] | Nucleic acid extraction. | Includes both spin-column and magnetic bead-based technologies; performance (yield and size selectivity) varies significantly between kits. |
| Droplet Digital PCR (ddPCR) Assays [70] | Quality control and quantification. | Enables absolute quantification of amplifiable DNA and assessment of fragment size distribution via short/long amplicon multiplexing. |
| Agilent BioAnalyzer High Sensitivity DNA Kit [70] | Quality control and fragment analysis. | Capillary electrophoresis system for visualizing DNA fragment size distribution and quantifying the 166 bp peak. |
The reliability of liquid biopsy in oncology research is fundamentally dependent on rigorous control of pre-analytical variables. From the selection of appropriate blood collection tubes and adherence to precise centrifugation protocols to proper sample storage and comprehensive quality assessment, each step in the process directly influences the quantity and quality of the recovered ctDNA. The implementation of standardized, evidence-based protocols—such as the two-step centrifugation for plasma preparation and the use of cell-stabilizing tubes for multi-center studies—is not merely a matter of procedure but a critical component of scientific rigor. As liquid biopsy applications expand into early detection, MRD monitoring, and pediatric cancers [19] [68], the demand for high-quality ctDNA will only intensify. By meticulously managing the pre-analytical phase, researchers and drug developers can ensure the integrity of their data, enhance the reproducibility of their findings, and fully leverage the potential of liquid biopsy to advance cancer research and patient care.
Tumor Heterogeneity and Variable Shedding Rates Across Cancer Types
Tumor heterogeneity represents a fundamental characteristic of cancer, manifesting as genetic, epigenetic, and phenotypic diversity within and between tumors. This complexity underlies varied clinical presentations, therapeutic responses, and ultimately, differential patient outcomes [74]. The emergence of liquid biopsy as a minimally invasive diagnostic tool has revolutionized our ability to probe this heterogeneity by analyzing tumor-derived components circulating in bodily fluids [2] [1]. These components—including circulating tumor cells (CTCs), circulating tumor DNA (ctDNA), and extracellular vesicles (EVs)—are shed from tumors at variable rates influenced by numerous biological factors [75].
Understanding the relationship between tumor heterogeneity and variable shedding rates is crucial for advancing liquid biopsy applications in oncology research and drug development. This technical guide explores the molecular foundations of tumor heterogeneity, quantitative approaches for its measurement, and experimental frameworks for investigating shedding dynamics across cancer types, all within the context of optimizing liquid biopsy for clinical and research applications.
Molecular Foundations of Tumor Heterogeneity
Dimensions of Heterogeneity
Tumor heterogeneity operates across multiple spatial and temporal dimensions, each with distinct implications for liquid biopsy approaches:
Intratumoral Heterogeneity: Refers to genetic and phenotypic diversity within a single tumor mass, driven by continuous evolution of multiple clonal populations under selective pressures [74]. This heterogeneity creates a reservoir of cellular diversity that contributes significantly to treatment resistance and disease recurrence.
Intertumoral Heterogeneity: Encompasses differences between tumors at different anatomical sites within the same patient, comparing primary lesions with metastases or metastases among themselves [74]. These differences are influenced by factors including tissue of origin, metastatic colonization, vascular access, and distinct tumor microenvironments.
Temporal Heterogeneity: Describes genetic diversity emerging over time within a single tumor or between different tumors in the same patient, resulting from accumulation of additional mutations or selection of different subclones due to therapy or environmental influences [76].
Interpatient Heterogeneity: Refers to genotypic and phenotypic diversity in tumors across different patients with histopathologically similar cancers originating from the same sites [74]. This explains why patients with seemingly similar cancers experience disparate treatment responses and outcomes.
Biological Drivers of Heterogeneous Shedding
The release of tumor-derived components into circulation is not uniform across cancer types or individual tumors. Several biological factors contribute to variable shedding rates:
Tumor Vascularization: Heterogeneous vascular patterns within tumors significantly impact component shedding. Regions with high blood vessel density demonstrate more effective release of tumor components compared to avascular regions [76]. The expression of pro-angiogenic factors like VEGF varies among tumors and even within regions of the same tumor, leading to differences in vascularization and consequent shedding potential.
Cellular Turnover Rates: Apoptosis and necrosis rates differ across cancer types and subtypes, directly influencing the release of ctDNA and other cellular components. Aggressive tumor subtypes often exhibit higher turnover rates, potentially increasing shedding [1].
Tumor Microenvironment (TME) Composition: The TME consists of a complex ecosystem including immune cells, fibroblasts, endothelial cells, extracellular matrix, and soluble factors [76]. Interactions between tumor cells and TME components significantly influence cellular behavior, including the release of CTCs and EVs. Immune pressures can particularly impact which subclones survive and potentially shed into circulation.
Metastatic Potential and Invasive Characteristics: Cancers with higher metastatic potential often demonstrate enhanced shedding capabilities, particularly of CTCs [1]. Epithelial-to-mesenchymal transition (EMT), a process linked to metastasis, may alter the surface markers and detectability of CTCs in circulation.
Quantitative Profiling of Heterogeneity and Shedding Dynamics
Analytical Frameworks for Heterogeneity Quantification
Advanced computational approaches enable researchers to quantify heterogeneity metrics from complex molecular data:
Table 1: Quantitative Metrics for Tumor Heterogeneity Assessment
| Metric | Description | Application in Liquid Biopsy | Reference |
|---|---|---|---|
| Copy Number Alteration (CNA) Score | Quantifies genomic instability from sequencing data | Distinguishes aggressive breast cancer subtypes; correlates with transcriptional heterogeneity | [77] |
| Transcriptomic Entropy | Measures diversity of gene expression patterns at single-cell resolution | Identifies cell clusters with elevated mitotic activity in aggressive subtypes | [77] |
| Local Inverse Simpson's Index (LISI) | Evaluates batch effect correction and cellular diversity | Confirms absence of batch effects in single-cell subclusters from pan-cancer studies | [78] |
| Aggregate Variant Allele Frequency (aggVAF) | Sum of all detected variant allele frequencies in a ctDNA sample | Enables molecular response categorization via LB-RECIST criteria | [79] |
Variable Shedding Rates Across Cancer Types
Comprehensive pan-cancer studies reveal substantial variation in tumor component shedding across cancer types:
Table 2: Shedding Patterns and Detection Rates Across Cancer Types
| Cancer Type | ctDNA Detection Rate | CTC Prevalence | Notable Molecular Features | Clinical Implications | |
|---|---|---|---|---|---|
| Metastatic Colorectal Cancer (mCRC) | 95.3% (106/111 at baseline) | Variable | APC, KRAS, TP53 mutations detectable | LB-RECIST criteria prognostic for PFS and OS | [79] |
| Breast Cancer | Variable by subtype | 1 CTC per 1 million leukocytes (average) | HER2 amplification in 15-20%; ESR1 mutations | CTC count independently predicts OS and PFS | [1] [74] |
| Non-Small Cell Lung Cancer (NSCLC) | High in advanced stages | Less characterized | EGFR mutations detectable in plasma | Plasma ctDNA approved for EGFR testing | [75] [74] |
| Melanoma (MEL) | Moderate to high | Variable | TCF7+ TEX-cells enriched | CD8+ TEX-cells most frequent | [78] |
| Glioblastoma Multiforme (GBM) | Lower (blood-brain barrier limitation) | Rare in peripheral blood | Tissue-specific markers | CSF liquid biopsy potentially more informative | [78] |
Experimental Protocols for Investigating Shedding Dynamics
Single-Cell RNA Sequencing for Cellular Heterogeneity
Protocol Overview: This methodology enables decomposition of tumor ecosystem complexity at single-cell resolution, particularly valuable for identifying rare cell populations and their potential contribution to shedding patterns [78] [77].
Detailed Methodology:
- Sample Preparation: Collect 230 treatment-naive samples across multiple cancer types using standardized dissociation protocols to minimize technical variability [78].
- Single-Cell Isolation: Use 10X Genomics platform (either 5' or 3' scRNA-seq) to partition individual cells into nanoliter-scale droplets.
- Library Preparation: Reverse transcription, cDNA amplification, and library construction with unique molecular identifiers (UMIs) to correct for amplification biases.
- Sequencing: Perform high-depth sequencing (average 1,358 genes detected per cell) across 611,750 high-quality single cells.
- Bioinformatic Analysis:
- Quality control filtering based on library size, gene counts per cell, and mitochondrial content (approximately 15% cells typically excluded) [77]
- Cell type identification using marker genes and reference databases
- Subclustering within cell types applying Harmony algorithm to correct for batch effects
- Calculation of LISI scores to confirm batch effect removal
- Identification of 70 pan-cancer single-cell subtypes across 5 cell types
Key Applications: Characterizes cellular heterogeneity within Tumor Microenvironment (TME), identifies co-occurrence patterns of immune cell subtypes, and correlates specific cellular communities with therapy response [78].
Circulating Tumor DNA Analysis for Molecular Response Assessment
Protocol Overview: Quantitative monitoring of ctDNA dynamics enables real-time assessment of tumor burden and molecular response to therapy [79].
Detailed Methodology:
- Sample Collection: Serial blood draws (e.g., baseline and week 8 of treatment) in EDTA-containing tubes from mCRC patients.
- Plasma Separation: Centrifugation at 800-1600×g for 10 minutes within 2 hours of collection, followed by secondary centrifugation at 16,000×g for 10 minutes.
- cfDNA Extraction: Use commercial circulating nucleic acid kits following manufacturer protocols.
- Next-Generation Sequencing:
- Library preparation using Oncomine Colon cfDNA Assay (Ion Torrent S5)
- Target capture sequencing of relevant cancer genes
- Sequencing depth >10,000X for sensitive variant detection
- Variant Analysis:
- Identification of somatic variants with allele frequency >0.1%
- Calculation of aggregate Variant Allele Frequency (aggVAF) - sum of all detected variant allele frequencies
- LB-RECIST Categorization:
- ctDNA Complete Response (CCR): Complete clearance of ctDNA
- ctDNA Partial Response (CPR): >50% decrease in aggVAF
- ctDNA Progressive Disease (CPD): >50% increase in aggVAF
Key Applications: Enables molecular response assessment earlier than radiological evaluation, correlates with progression-free and overall survival (P<0.0001), and provides prognostic stratification [79].
Visualization of Heterogeneity and Shedding Relationships
Tumor Component Shedding and Detection Workflow
Diagram 1: Tumor Heterogeneity Influences Component Shedding and Detection. This workflow illustrates how multidimensional tumor heterogeneity drives variable shedding rates of tumor-derived components into circulation, enabling liquid biopsy applications in cancer research and clinical management.
Molecular Response Assessment Framework
Diagram 2: Molecular Response Assessment via ctDNA Dynamics. This framework outlines the experimental workflow for LB-RECIST categorization using serial ctDNA analysis, enabling early assessment of treatment response before radiological evaluation.
The Scientist's Toolkit: Essential Research Reagents and Platforms
Table 3: Essential Research Reagents and Platforms for Heterogeneity and Shedding Studies
| Category | Specific Product/Platform | Research Application | Key Features | Reference |
|---|---|---|---|---|
| Single-Cell RNA Sequencing | 10X Genomics Chromium Platform | Cellular heterogeneity analysis | Partitions cells into nanoliter-scale droplets; 5' and 3' chemistry available | [78] |
| CTC Enrichment/Detection | CellSearch System | CTC enumeration and characterization | FDA-cleared; immunomagnetic separation using EpCAM antibodies | [1] [75] |
| ctDNA Extraction | Commercial circulating nucleic acid kits | Isolation of cell-free DNA from plasma | Optimized for low-abundance DNA; compatible with various sample types | [79] |
| Targeted Sequencing | Oncomine Colon cfDNA Assay (Ion Torrent) | ctDNA mutation profiling | Designed for low-frequency variant detection in liquid biopsy samples | [79] |
| Bioinformatic Tools | inferCNV | CNA identification from scRNA-seq data | Distinguishes cancer cells from normal cells using copy number variation | [77] |
| Batch Effect Correction | Harmony Algorithm | Integration of single-cell datasets | Removes technical artifacts while preserving biological heterogeneity | [78] |
| Spatial Transcriptomics | Various commercial platforms | Spatial mapping of heterogeneity | Correlates cellular composition with anatomical location in tumors | [78] |
The intricate relationship between tumor heterogeneity and variable shedding rates represents both a challenge and opportunity for liquid biopsy applications in oncology research. Quantitative assessment of heterogeneity through single-cell technologies and careful analysis of shedding dynamics provide critical insights into cancer biology and therapeutic resistance mechanisms.
Future research directions should focus on standardizing liquid biopsy methodologies across platforms, integrating multi-omics approaches to capture the full spectrum of heterogeneity, and developing more sophisticated computational models that can predict shedding patterns based on tumor characteristics. Furthermore, expanding pan-cancer studies across diverse patient populations will enhance our understanding of how heterogeneity influences diagnostic sensitivity and therapeutic outcomes.
As liquid biopsy technologies continue to evolve, they offer unprecedented opportunities to monitor tumor evolution in real-time, track the emergence of resistant subclones, and ultimately guide more personalized therapeutic approaches that address the fundamental challenge of tumor heterogeneity in cancer management.
Liquid biopsy, the analysis of tumor-derived components from blood, has emerged as a transformative tool in oncology research and clinical practice. However, its potential is challenged by biological confounders, principally clonal hematopoiesis (CH), which introduces significant "biological noise" by generating non-tumor derived mutations in cell-free DNA (cfDNA). This whitepaper details the impact of CH on liquid biopsy interpretation, synthesizes current methodologies for its discrimination, and provides a framework of experimental protocols and reagent solutions to overcome this critical hurdle, thereby ensuring the accuracy of molecular data for drug development and clinical research.
The Clinical Significance of Clonal Hematopoiesis in Liquid Biopsy
Clonal hematopoiesis is a common age-associated condition in which a hematopoietic stem cell acquires somatic mutations, leading to its clonal expansion and the presence of mutant DNA in the bloodstream. These mutations are detected in cfDNA during liquid biopsy and can be erroneously attributed to the tumor.
- Prevalence and Impact: CH increases dramatically with age, affecting over a third of the elderly population [80]. A pivotal 2020 study found that 29% (11/38) of colorectal cancer patients had at least one CH-derived mutation in their plasma cfDNA [81]. Critically, these mutations persisted in postoperative plasma samples and could be misinterpreted as evidence of residual disease or lack of treatment response, potentially leading to misinformed clinical management [81].
- Mutational Landscape: CH is driven by somatic mutations in a specific set of genes, many of which are also classic drivers of hematological malignancies. The most frequently mutated genes include those involved in epigenetic regulation (DNMT3A, TET2, ASXL1), DNA damage response (TP53, PPM1D), RNA splicing (SF3B1, SRSF2), and signal transduction (JAK2) [82] [80]. The prevalence of specific CH subtypes varies with age and sex [80].
Table 1: Common CH Driver Genes and Their Associations
| Gene | Primary Function | Association with Hematologic Malignancy | Notes |
|---|---|---|---|
| DNMT3A | DNA methylation | Yes | Most common CH driver; prevalence rises early in life [80]. |
| TET2 | DNA demethylation | Yes | Highly prevalent; strongly associated with cardiovascular inflammation [82]. |
| ASXL1 | Chromatin modification | Yes | Mutations show strong association with smoking history [80]. |
| TP53 | DNA damage response | Yes | Associated with higher risk of transformation. |
| JAK2 | Cytokine signaling | Yes | Strongly associated with myeloproliferative neoplasms; mutations can affect cholesterol levels [80]. |
| SF3B1 | RNA splicing | Yes | More common in older individuals; associated with myelodysplastic syndromes [80]. |
Methodologies for Discriminating CH from Tumor-Derived Mutations
Accurately differentiating CH-related mutations from true circulating tumor DNA (ctDNA) is paramount. The gold-standard approach involves sequencing matched samples to identify the mutational source.
Experimental Protocol for CH Identification
The following workflow, as employed in clinical studies, provides a robust method for identifying CH-related noise [81]:
- Sample Collection: Collect matched samples from a single patient:
- Plasma: For cfDNA extraction, representing the liquid biopsy.
- Tumor Tissue: For tumor DNA extraction, to define the tumor-specific mutational profile.
- Peripheral Blood Cells (PBCs): For germline DNA and hematopoietic cell DNA extraction, to identify CH mutations.
- DNA Extraction and Sequencing:
- Extract cfDNA from plasma, genomic DNA from tumor tissue, and genomic DNA from PBCs (e.g., buffy coat).
- Perform ultradeep next-generation sequencing (NGS) on all three DNA samples using the same targeted pan-cancer or custom panel (e.g., Oncomine Pan-Cancer Panel).
- Bioinformatic Analysis:
- Call somatic mutations from the plasma cfDNA and tumor tissue, comparing them to the PBC-derived germline baseline.
- Call somatic mutations present in the PBC DNA itself to identify CH.
- Variant Annotation and Filtering:
- Any nonsynonymous mutation detected in plasma cfDNA that is also present in the PBC DNA is identified as a CH-derived "confounder."
- The final, tumor-informed liquid biopsy result reports only plasma cfDNA mutations that are absent in the PBC DNA.
The following diagram illustrates this confirmatory workflow.
Advanced and Emerging Strategies
Beyond the standard protocol, several strategies are enhancing CH discrimination:
- Variant Allele Frequency (VAF) Analysis: CH-derived mutations in plasma often have a VAF below 1-2%, but this is not a reliable differentiator alone, as ctDNA from early-stage disease can also have low VAF.
- Fragmentomics: Analyzing the size and fragmentation patterns of cfDNA. Tumor-derived DNA fragments are often shorter and display distinct end motifs compared to DNA from hematopoietic cells.
- Epigenetic Profiling: Examining cell-type-specific methylation patterns in cfDNA can determine the tissue of origin for a given mutation, directly distinguishing hematopoietic from tumor-derived signals.
- Artificial Intelligence (AI) Integration: Machine and deep learning models are being trained to integrate multi-omics data (genomic, fragmentomic, epigenetic) to improve the classification of variant origin [83].
The Scientist's Toolkit: Essential Research Reagents and Materials
Successfully navigating CH confounders requires a suite of specialized reagents and tools. The following table details key solutions for researchers designing experiments in this field.
Table 2: Key Research Reagent Solutions for CH-Informed Liquid Biopsy
| Research Reagent / Material | Function | Application Notes |
|---|---|---|
| Targeted NGS Panels | Simultaneously sequences key cancer driver and CH genes from low-input DNA. | Panels like the Oncomine Pan-Cancer Panel are validated for ultradeep sequencing of matched cfDNA and PBCs [81]. Custom panels can focus on specific CH hotspots. |
| Cell-Free DNA Collection Tubes | Stabilizes blood samples to prevent genomic DNA contamination and cfDNA degradation during transport. | Critical for preserving sample integrity. Tubes containing preservatives allow for longer room-temperature storage before processing. |
| DNA Extraction Kits | Isolate high-purity cfDNA from plasma and genomic DNA from PBCs/tissue. | Kits optimized for low-concentration cfDNA are essential. Separate, high-yield kits are used for PBC and tissue DNA. |
| Unique Molecular Identifiers (UMIs) | Short DNA tags added during library prep to correct for PCR amplification errors and enable accurate sequencing. | Vital for ultradeep sequencing to distinguish true low-frequency variants (e.g., CH, ctDNA) from technical artifacts [81]. |
| Bioinformatic Software for Somatic Calling | Algorithms to identify low-frequency somatic mutations against a germline background. | Tools like MuTect2, VarScan2, or commercial suites must be calibrated for high-sensitivity/specificity in both cfDNA and PBC samples. |
The field is rapidly evolving to address the challenge of CH. Genome-wide association studies (GWAS) have identified 14 germline loci that predispose individuals to CH, implicating biological pathways like DNA damage repair (PARP1, ATM, CHEK2) and hematopoietic stem cell homing (CD164), offering new insights into its etiology [80]. Furthermore, Mendelian randomization analyses have established causal links between smoking and longer leukocyte telomere length with increased CH risk [80]. The integration of artificial intelligence with liquid biopsy and radiomics represents a promising frontier, creating multimodal models that combine blood-based mutation data with medical imaging to enhance diagnostic specificity [83].
In conclusion, clonal hematopoiesis is a pervasive source of biological noise that, if unaddressed, compromises the validity of liquid biopsy. The research community must adopt rigorous experimental designs that include sequencing of matched PBCs as a standard practice. By leveraging the protocols, tools, and emerging technologies outlined in this whitepaper, researchers and drug developers can overcome this confounder, thereby unlocking the full potential of liquid biopsy for precise oncology research and personalized cancer therapy.
Liquid biopsy has emerged as a revolutionary non-invasive approach in oncology research, enabling the detection of tumor-derived components from bodily fluids. Despite its promise, a significant limitation has been its suboptimal sensitivity for detecting early-stage cancers and minimal residual disease (MRD), primarily due to the low abundance of circulating tumor DNA (ctDNA) in these scenarios [83]. The convergence of two advanced technological fields—fragmentomics, the detailed study of cell-free DNA (cfDNA) fragmentation patterns, and artificial intelligence (AI)—is poised to overcome this critical sensitivity barrier [84]. This whitepaper details how this powerful synergy is creating a new, highly sensitive diagnostic paradigm, framing it within the broader thesis that liquid biopsy is transitioning from a reactive tool to a proactive platform for cancer interception and personalized monitoring in oncology research and drug development.
Fragmentomics leverages the fundamental discovery that the release and fragmentation of cirDNA into the bloodstream are non-random processes [84]. These patterns are deeply influenced by the cell of origin's chromatin organization and nuclease activity. Crucially, cancer cells exhibit distinct patterns compared to healthy cells, providing a rich source of biomarker information beyond mere mutation detection [84]. Meanwhile, AI, particularly machine learning (ML) and deep learning (DL), provides the essential computational framework to decode the immense complexity of these fragmentomic patterns and integrate them with other multi-omics data, a task beyond the scope of conventional bioinformatics [83] [85]. This integration is pushing the boundaries of sensitivity and specificity, paving the way for earlier cancer detection, more precise monitoring of treatment response, and more refined patient stratification in clinical trials.
Core Principles of Fragmentomics
Biological Foundations of cirDNA Fragmentation
The fragmentation of circulating DNA is a highly structured process that reflects the epigenetic landscape of its tissue of origin. The predominant structural units in the bloodstream are mononucleosomes, which offer stability to cirDNA fragments [84]. The size distribution of these fragments is not arbitrary; it bears the specific signature of the cell death pathway involved.
- Apoptosis: This programmed cell death pathway results in a characteristic DNA laddering pattern, producing fragments that are multiples of approximately 180-200 base pairs (bp), corresponding to DNA wrapped around a nucleosome core plus the linker DNA [84].
- Necrosis: This chaotic form of cell death leads to the release of longer, more variable DNA fragments, often exceeding 10,000 bp [84].
A key observable phenomenon in sequencing data is the ~10 bp periodicity of fragment sizes, detectable down to very short fragments (~30-40 bp) [84]. This periodicity arises because DNA is cleaved at positions where it is most exposed on the nucleosome surface, specifically every helical turn (approximately 10 bp) as the DNA strand wraps around the histone core. The most frequent fragment sizes observed in circulation correspond to a trimmed mononucleosome, or chromatosome (~166 bp), and the core mononucleosome itself (~147 bp) [84]. The distribution of fragment ends and sizes across the genome is therefore a direct readout of nucleosome positioning and occupancy, which differs between cell types and disease states.
Fragmentomic Features as Cancer Biomarkers
Fragmentomics transforms cirDNA sequencing data into quantitative features that can distinguish cancer-derived DNA from healthy cfDNA. The following features have shown significant diagnostic power:
- Size Distribution: The proportional abundance of fragments of specific sizes is a primary biomarker. For instance, cancer patients often show a shift in the fragment size profile, such as a higher prevalence of shorter fragments [84].
- Nucleosome Positioning and Occupancy: The patterns of where nucleosomes are located along the DNA and how densely they are packed can be inferred from sequencing coverage data. Cancer cells can exhibit altered nucleosome positioning in regulatory regions like transcription start sites [84].
- End Motifs: The analysis of preferred nucleotide sequences at the endpoints of cfDNA fragments (fragment ends) can reveal biases in nuclease activity (e.g., DNASE1L3) that are associated with malignancy [28].
The screening power of these features has been considerably strengthened in the omics era, with sophisticated technologies assisted by machine learning enabling high-resolution analysis [84].
AI and Machine Learning for Fragmentomic Data Integration
AI Model Architectures and Applications
The high-dimensional nature of fragmentomic data necessitates advanced AI models capable of discerning subtle, non-linear patterns that elude traditional statistical methods.
Table 1: AI Models and Their Applications in Fragmentomics
| AI Model Category | Specific Examples | Application in Fragmentomics & Liquid Biopsy |
|---|---|---|
| Machine Learning (ML) | Support Vector Machines (SVMs), Random Forest | Classifying cancer vs. non-cancer samples based on fragment size distributions and other fragmentomic features [83]. |
| Deep Learning (DL) | Convolutional Neural Networks (CNNs), Recurrent Neural Networks (RNNs) | Identifying complex spatial and sequential patterns in fragmentomic data across the genome; analyzing exoRNA profiles [83] [85]. |
| Ensemble Models & Stacked Classifiers | Stacked Ensemble Models | Improving prediction robustness and accuracy by combining multiple base models. A study on renal cell carcinoma (RCC) used this to achieve an AUC of 0.96 [66]. |
| Emerging & Specialized Approaches | Generative Adversarial Networks (GANs), Quantum Machine Learning (QML), Federated Learning | Generating synthetic data to augment training sets; exploiting quantum computing for pattern recognition; training models across decentralized data silos without sharing patient data [83] [86] [85]. |
Multi-Omics Data Integration
A key strength of AI is its ability to perform multi-omics integration, creating a more holistic view of the tumor. AI-driven algorithms can combine fragmentomic data with other layers of molecular information, such as:
- Methylation Profiling: AI models can detect hyper/hypomethylation patterns in ctDNA, which is highly informative for cancer detection and determining the tissue of origin [85] [19].
- Copy Number Variation (CNV): ML models can identify chromosomal gains and losses from low-pass whole-genome sequencing data of cfDNA [66].
- Radiomics: AI can integrate fragmentomic data with quantitative features extracted from medical images (CT, PET), providing a spatial context to the molecular findings and enhancing predictive power for outcomes like treatment response [83].
This multimodal AI approach supports the broader vision of precision medicine by moving beyond a single data type to an integrative, patient-specific diagnostic and monitoring strategy [83].
Experimental Protocols and Performance Validation
Detailed Workflow for a Fragmentomics Study
The following workflow outlines a standard protocol for an AI-enhanced fragmentomics study, synthesizing methodologies from recent research.
Sample Collection & Processing:
- Collect peripheral blood (e.g., 10-20 mL) in cell-stabilizing tubes (e.g., Streck).
- Centrifuge to separate plasma from cellular components (e.g., 1600 × g for 10 min, followed by 16,000 × g for 10 min to remove residual cells).
- Store plasma at -80°C until DNA extraction.
cfDNA Extraction & QC:
- Extract cfDNA from plasma using commercial kits (e.g., QIAamp Circulating Nucleic Acid Kit).
- Quantify cfDNA using a fluorescence-based assay (e.g., Qubit dsDNA HS Assay).
- Assess fragment size distribution using a high-sensitivity bioanalyzer (e.g., Agilent 2100 Bioanalyzer, TapeStation).
Library Preparation & Sequencing:
- Construct sequencing libraries from cfDNA without size selection to preserve the native fragmentome.
- Use double-stranded DNA library preparation methods optimized for short, fragmented DNA.
- Perform low-pass whole-genome sequencing (e.g., 5X coverage) on a high-throughput platform (e.g., Illumina) to capture genome-wide fragmentomics features [66].
Bioinformatic Preprocessing:
- Align sequencing reads to the reference human genome (e.g., hg38).
- Calculate fragment size for each unique sequencing read pair.
- Generate genome-wide coverage and fragment size profiles.
Feature Extraction:
- Fragmentomics Features: Calculate size distribution (e.g., ratio of short/long fragments), frequency of fragments in specific size ranges (e.g., 90-150 bp), and nucleosome positioning signals [66] [84].
- Other Omics Features: Extract concurrent features like CNV signals and methylation status (if sequencing data allows).
AI/ML Modeling & Validation:
- Partition data into training (e.g., ~70%) and validation (e.g., ~30%) sets.
- Train a selected ML model (e.g., Random Forest, Stacked Ensemble) on the training set using the extracted features to classify samples (e.g., cancer vs. healthy).
- Validate the model's performance on the held-out validation set using metrics like AUC, sensitivity, and specificity. Employ cross-validation to ensure robustness.
Key Research Reagent Solutions
Table 2: Essential Research Reagents and Materials for Fragmentomics Workflows
| Item | Function/Application | Examples / Notes |
|---|---|---|
| Cell-Free DNA Blood Collection Tubes | Stabilizes nucleated blood cells to prevent genomic DNA contamination during shipment and storage. | Streck Cell-Free DNA BCT, PAXgene Blood cDNA Tube |
| cfDNA Extraction Kits | Isolate high-integrity, short-fragment cfDNA from plasma or serum. | QIAamp Circulating Nucleic Acid Kit (Qiagen), MagMAX Cell-Free DNA Isolation Kit (Thermo Fisher) |
| DNA Quantitation Assays | Fluorometric quantification of double-stranded DNA; critical for input into library prep. | Qubit dsDNA HS Assay (Thermo Fisher) |
| Fragment Analyzer Systems | Pre- and post-library preparation quality control, specifically assessing the cfDNA size profile. | Agilent 2100 Bioanalyzer (HS DNA kit), Agilent TapeStation (Genomic DNA ScreenTape) |
| Library Prep Kits for cfDNA | Prepare sequencing libraries from low-input, fragmented cfDNA without introducing bias. | KAPA HyperPrep Kit (Roche), Illumina DNA Prep Kit |
| Whole Genome Sequencing Kits | Generate sequencing libraries for low-pass WGS to capture fragmentomic and CNV data. | Illumina NovaSeq X Series, low-pass (e.g., 5X coverage) is often sufficient [66] |
Quantitative Performance Metrics
Recent studies demonstrate the exceptional performance of AI-enhanced fragmentomic assays.
Table 3: Performance Metrics of AI-Enhanced Fragmentomic Liquid Biopsies in Recent Studies
| Cancer Type | Study / Assay Details | Key Performance Metrics | Citation |
|---|---|---|---|
| Renal Cell Carcinoma (RCC) | cfDNA fragmentomics (CNV, size ratio, nucleosome footprint) with a stacked ensemble ML model. | AUC: 0.96Sensitivity: 90.5%Specificity: 93.8%Stage I Sensitivity: 87.8% | [66] |
| Liver Cirrhosis/HCC | cfDNA fragmentome analysis for identification of liver cirrhosis. | AUC: 0.92 (in a 724-person cohort) | [19] |
| Lung Cancer | AI and radiomics to enhance liquid biopsy for early detection. | Demonstrated a shift towards earlier detection, though specific metrics not provided. | [83] |
| Multi-Cancer Detection | Hybrid-capture methylation assay evaluating fragmentomic patterns. | Overall Sensitivity: 59.7%Specificity: 98.5%Late-Stage Sensitivity: 84.2%Aggressive Cancer Sensitivity (e.g., pancreatic, liver): 74% | [19] |
Visualizing Workflows and Signaling Pathways
AI-Enhanced Fragmentomic Analysis Workflow
The following diagram illustrates the integrated experimental and computational pipeline from sample collection to clinical insight.
Diagram 1: AI-Enhanced Fragmentomic Analysis Workflow. This diagram outlines the key stages from biological sample processing to the generation of a clinical report, highlighting the integration of laboratory and computational steps.
Nucleosome-Derived Fragment Biology
The diagram below conceptualizes the biological basis of fragmentomics, showing how nucleosome structure and nuclease activity determine the cirDNA fragment landscape.
Diagram 2: Origin of Cancer-Specific Fragmentomic Signals. This diagram illustrates how the distinct chromatin organization and biology of cancer cells give rise to a unique cirDNA fragmentome that serves as a diagnostic signature.
The integration of fragmentomics with AI-powered data analysis represents a significant leap forward for liquid biopsy applications in oncology research. This synergy addresses the core challenge of sensitivity, enabling the detection of cancer signals at earlier stages and lower concentrations, such as in MRD, which were previously undetectable [83] [28]. The ability of AI to integrate fragmentomic data with other omics and radiomic features is forging a more comprehensive and dynamic view of tumor biology, essential for both basic research and translational drug development.
Looking ahead, several key areas will define the future of this field. Federated learning promises to accelerate AI model development by enabling collaboration across institutions without sharing sensitive patient data, thus addressing data scarcity and privacy concerns [85]. Quantum machine learning, though nascent, has shown potential in early studies to outperform classical methods in distinguishing exosomes from cancer patients, suggesting a future of even more powerful pattern recognition [86]. Furthermore, as the technology matures, a strong push towards standardization and rigorous multi-center validation will be critical for clinical adoption [83] [85]. Finally, maintaining a human-centered, interpretable AI approach is paramount to build trust among researchers and clinicians, ensuring that these complex models provide actionable insights rather than opaque predictions [87]. For researchers and drug developers, these innovations signal a shift towards a future where non-invasive, highly sensitive, and multi-parametric monitoring of cancer becomes a routine reality, fundamentally enhancing clinical trials and personalized therapy.
Liquid biopsy, the analysis of tumor-derived components from bodily fluids, represents a transformative approach in oncology research and clinical practice. While tissue biopsy remains the gold standard for tumor diagnosis, its limitations—including invasiveness, inability for serial sampling, and failure to capture tumor heterogeneity—have driven the exploration of liquid-based alternatives [1]. Initially, liquid biopsy focused on single-analyte approaches, primarily circulating tumor DNA (ctDNA) or circulating tumor cells (CTCs). However, the complex, multifactorial nature of cancer has necessitated a more comprehensive strategy. Multimodal integration, which simultaneously analyzes diverse biomarker classes from a single sample, provides a more holistic view of tumor dynamics, evolution, and therapeutic response [88] [2]. This paradigm shift enables researchers and clinicians to overcome the limitations of single-analyte tests, offering unprecedented opportunities for precision medicine in cancer drug development and patient management. By leveraging complementary information from multiple biological sources, multimodal liquid biopsy creates a powerful toolkit for understanding the complete tumor ecosystem.
Core Biomarkers in Liquid Biopsy
The analytical power of multimodal liquid biopsy stems from the synergistic use of distinct, complementary biomarkers. Each component provides unique information about the tumor's genetic, transcriptomic, proteomic, and cellular state.
Circulating Tumor DNA (ctDNA)
Circulating tumor DNA consists of short, fragmented DNA molecules shed into the bloodstream by apoptotic or necrotic tumor cells. CtDNA typically constitutes only 0.1–1.0% of the total cell-free DNA (cfDNA) in cancer patients, with the remainder originating mainly from normal leukocytes and stromal cells [1]. Its key advantage lies in its short half-life (approximately 1–2.5 hours), enabling real-time monitoring of tumor dynamics and treatment response [1]. Analysis focuses on detecting tumor-specific genetic and epigenetic alterations, including:
- Somatic Mutations: Single nucleotide variants (SNVs) in oncogenes (e.g., KRAS, EGFR, PIK3CA) and tumor suppressor genes (e.g., TP53, APC) [1] [2].
- Copy Number Alterations (CNAs): Gains or losses of DNA segments that can drive oncogenesis and therapy resistance [2].
- Methylation Changes: Hypermethylation or hypomethylation of promoter regions that can serve as early cancer detection markers and are frequently more abundant than mutation signals [1].
CtDNA levels correlate with tumor burden and have demonstrated prognostic significance across multiple cancer types, including colorectal, pancreatic, and breast cancers [1].
Circulating Tumor Cells (CTCs)
CTCs are intact cancer cells disseminated from primary or metastatic tumors into the bloodstream or lymphatic system. First identified in 1869 by Thomas Ashworth, CTCs are exceptionally rare, with approximately one CTC per million leukocytes, and most perish within 1–2.5 hours in circulation [1]. Their presence and enumeration are strongly associated with metastatic potential and poor clinical outcomes. Technological challenges in isolating these rare cells have driven the development of sophisticated capture methods based on physical properties (size, deformability, density) or biological markers (e.g., EpCAM, vimentin, N-cadherin) [1]. The CellSearch system remains the only FDA-cleared method for prognostic CTC monitoring in metastatic breast, colorectal, and prostate cancers [1]. Beyond enumeration, molecular characterization of CTCs—through single-cell RNA sequencing, protein analysis, or functional culture—provides direct insights into metastatic mechanisms, tumor heterogeneity, and resistant cell populations.
Extracellular Vesicles (EVs) and Other Analytes
Tumor-derived extracellular vesicles, including exosomes, are membrane-bound nanoparticles released by cells that carry molecular cargo—proteins, nucleic acids (DNA, RNA, miRNA), and lipids—from their parent cells. EVs play crucial roles in intercellular communication, pre-metastatic niche formation, and immune modulation [2]. Their analysis offers several advantages: they are abundant in bodily fluids, contain protected biomolecules resistant to degradation, and reflect the cellular state of diverse tumor subpopulations. Isolation typically employs techniques like ultracentrifugation (the most common method), ultrafiltration, or immunoaffinity capture, though standardization remains challenging [2].
Additional emerging analytes include:
- Tumor-Educated Platelets (TEPs): Platelets that have absorbed tumor-derived biomolecules (RNA, proteins), altering their cargo and potentially contributing to cancer progression [1] [2].
- Cell-Free RNA (cfRNA): Including microRNAs (miRNAs) and other RNA species that can provide information on gene expression regulation and tumor-specific transcriptional activity [1].
Table 1: Core Analytical Targets in Multimodal Liquid Biopsy
| Biomarker | Origin | Primary Analytes | Key Applications | Technical Challenges |
|---|---|---|---|---|
| Circulating Tumor DNA (ctDNA) | Apoptotic/Necrotic Tumor Cells | DNA (Mutations, CNAs, Methylation) | Treatment Monitoring, MRD Detection, Genotyping | Low abundance in early-stage disease, background from hematopoietic cells |
| Circulating Tumor Cells (CTCs) | Viable Tumor Cells in Circulation | Whole Cells (DNA, RNA, Protein) | Metastasis Research, Drug Resistance Studies, Prognostic Assessment | Extreme rarity, viability preservation, heterogeneity |
| Extracellular Vesicles (EVs) | Active Secretion from Tumor Cells | Proteins, Nucleic Acids, Lipids | Biomarker Discovery, Tumor Microenvironment Analysis, Early Detection | Standardization of isolation, heterogeneity in size and content |
| Tumor-Educated Platelets (TEPs) | Platelets Interacting with Tumors | RNA, Proteins | Cancer Subtyping, Response Prediction, Metastasis Monitoring | Complex isolation, signal differentiation from non-tumor influences |
Multimodal Integration Methodologies
Integrating data from multiple liquid biopsy analytes requires sophisticated computational approaches that can handle high-dimensional, heterogeneous datasets. The fundamental challenge lies in reconciling different data types—continuous (e.g., ctDNA variant allele frequency), categorical (e.g., mutation presence), and count-based (e.g., CTC enumeration)—into a unified analytical framework.
Data Integration Frameworks
Early Integration (Data-Level): Raw data from different modalities are combined into a single matrix before model training. This approach requires extensive normalization and preprocessing to make features comparable but can capture complex cross-modal interactions. It is often used with deep learning models like variational autoencoders (VAEs) that learn joint representations directly from the fused data [89].
Intermediate Integration (Feature-Level): This is the most common approach where dedicated feature extractors are used for each modality. For example, a convolutional neural network (CNN) might extract features from pathological images, while a deep neural network processes genomic data. These feature vectors are then concatenated or fused using specialized architectures (e.g., cross-attention mechanisms) before final prediction [88]. This preserves modality-specific characteristics while enabling interaction.
Late Integration (Decision-Level): Separate models are trained for each data type, and their predictions are combined through voting, averaging, or meta-learners. While computationally simpler and more flexible for adding new data types, this approach may miss important cross-modal correlations [89].
Advanced Computational Models
Deep Generative Models: Variational autoencoders (VAEs) and generative adversarial networks (GANs) are increasingly employed for multimodal integration. These models can handle missing data—a common challenge in liquid biopsy studies—through imputation, learn robust joint embeddings that capture shared biological signals, and correct for technical batch effects across different processing platforms [89].
Multimodal Foundation Models: Inspired by advances in natural language processing, large-scale foundation models pre-trained on extensive multi-omics datasets can be fine-tuned for specific liquid biopsy applications. These models capture fundamental biological relationships that transfer well to downstream tasks like cancer subtyping or treatment response prediction [88] [89].
Graph Neural Networks (GNNs): GNNs effectively model biological networks where nodes represent entities (genes, proteins, cells) and edges represent interactions. This approach is particularly valuable for integrating spatial transcriptomics data with mutational profiles to understand cellular organization within the tumor microenvironment [88].
Table 2: Computational Methods for Multimodal Data Integration
| Method Category | Key Algorithms/Approaches | Strengths | Best-Suited Applications |
|---|---|---|---|
| Classical Statistical | Multiple Kernel Learning, Canonical Correlation Analysis | Interpretability, Stability with Small Sample Sizes | Exploratory Analysis, Hypothesis Generation |
| Matrix Factorization | Joint Non-negative Matrix Factorization, Multi-Omics Clustering | Dimensionality Reduction, Identification of Latent Factors | Patient Stratification, Biomarker Discovery |
| Deep Learning | Variational Autoencoders (VAEs), Multimodal Neural Networks | Handling Non-Linearity, Missing Data Imputation, Feature Learning | Complex Phenotype Prediction, Tumor Subtyping |
| Graph-Based | Graph Neural Networks (GNNs) | Modeling Biological Networks, Spatial Relationships | Tumor Microenvironment Analysis, Signaling Pathway Mapping |
Experimental Workflows and Protocols
Implementing a robust multimodal liquid biopsy study requires carefully designed experimental workflows that maintain sample integrity while enabling comprehensive biomarker analysis.
Integrated Sample Processing Pipeline
Sample Collection and Handling:
- Collect whole blood in cell-stabilization tubes (e.g., Streck, PAXgene) to preserve analyte integrity. Process within 4-6 hours of collection.
- Centrifuge at 800-1600×g for 10-20 minutes to separate plasma from peripheral blood mononuclear cells (PBMCs). Aliquot plasma and store at -80°C to prevent degradation.
- For CTC studies, process blood within 24-72 hours using approved systems (e.g., CellSearch) or microfluidic devices for enumeration and isolation.
Parallel Biomarker Isolation:
- ctDNA Extraction: Use commercial circulating nucleic acid kits (e.g., QIAamp Circulating Nucleic Acid Kit) with appropriate carrier RNA. Include digestion steps to eliminate contaminating genomic DNA.
- CTC Enrichment: Employ negative depletion (removing CD45+ cells) or positive selection (targeting EpCAM, HER2, or other surface markers) strategies. Microfluidic platforms (e.g., CTC-iChip) enable label-free isolation based on size and deformability.
- EV Isolation: Implement ultracentrifugation (100,000-120,000×g for 70-120 minutes) or size-exclusion chromatography to obtain EV-enriched fractions. Validate with nanoparticle tracking analysis and Western blotting for tetraspanin markers (CD9, CD63, CD81).
Downstream Molecular Analysis:
- ctDNA Analysis: Utilize targeted next-generation sequencing panels covering relevant cancer genes. For low-frequency variants, employ error-corrected sequencing methods (e.g., safeSEQ, duplex sequencing). Digital PCR (dPCR) provides highly sensitive quantification of known mutations.
- CTC Characterization: Perform immunocytochemistry for protein markers, single-cell RNA sequencing for transcriptional profiling, or functional assays using ex vivo culture.
- EV Biomarker Profiling: Extract RNA for small RNA sequencing (miRNA) or protein for mass spectrometry-based proteomics. Multiplexed assays (e.g., Luminex) can quantify multiple EV-associated proteins simultaneously.
Quality Control and Validation
Establishing rigorous quality control metrics is essential for reliable multimodal analysis:
- ctDNA: Quantify total cfDNA yield (Qubit), fragment size distribution (Bioanalyzer/TapeStation), and confirm absence of genomic DNA contamination.
- CTCs: Validate recovery rates using spike-in experiments with cultured cancer cells. Confirm tumor origin through immunostaining (cytokeratin+/CD45-).
- EVs: Characterize particle concentration and size distribution (nanoparticle tracking analysis), verify enrichment of marker proteins (CD63, CD81), and confirm absence of apolipoprotein contaminants.
Analytical validation should include limit of detection studies for low-frequency mutations in ctDNA, cell line spike-in controls for CTC recovery efficiency, and standardized reference materials for EV analysis.
Applications in Oncology Research and Drug Development
Multimodal liquid biopsy approaches are revolutionizing multiple aspects of oncology research and therapeutic development by providing comprehensive molecular insights that were previously inaccessible.
Enhanced Tumor Characterization and Molecular Subtyping
Integrating multiple biomarker classes enables more precise tumor characterization than any single analyte. For example, combining DNA methylation patterns from ctDNA with protein markers from EVs and transcriptomic data from CTCs can identify distinct molecular subtypes with different clinical outcomes and therapeutic vulnerabilities [88]. In breast cancer, multimodal models that fuse pathological image features with genomic and other omics data have demonstrated superior accuracy in predicting molecular subtypes compared to unimodal approaches [88]. Large-scale studies integrating transcriptome, exome, and pathology data from over 200,000 tumors have developed multilineage cancer subtype classifiers with clinical-grade performance [88].
Monitoring Treatment Response and Resistance Mechanisms
Multimodal liquid biopsy provides unprecedented insights into dynamic tumor evolution under therapeutic pressure. While ctDNA levels can rapidly decrease following effective treatment, the emergence of resistance mutations provides early indication of treatment failure. Simultaneous analysis of CTCs can reveal phenotypic adaptations (e.g., epithelial-to-mesenchymal transition) and functional signaling changes in resistant cell populations. EV profiles may reflect alterations in the tumor microenvironment that promote resistance. This comprehensive view enables researchers to identify dominant resistance mechanisms and design combination therapies that target multiple escape pathways simultaneously [1] [2].
Predicting Immunotherapy Response
Immunotherapy represents a breakthrough in cancer treatment, but reliable biomarkers for patient selection remain limited. Multimodal integration has shown exceptional promise in this area by capturing the complex immunological events required for effective anti-tumor immunity. Chen et al. developed a multimodal model combining radiology, pathology, and clinical information that accurately predicts response to anti-human epidermal growth factor receptor 2 (HER2) combination immunotherapy (AUC=0.91) [88]. Another approach integrated annotated CT scans, digitized immunohistochemistry slides, and genomic alteration data from non-small cell lung cancer (NSCLC) patients to improve prediction of response to programmed cell death protein 1 (PD-1) or programmed death-ligand 1 (PD-L1) blockade [88]. These models outperform single-modality biomarkers by collectively capturing tumor mutational burden, immune cell infiltration, spatial organization, and host factors.
Minimal Residual Disease (MRD) Detection and Early Relapse Prediction
The extreme sensitivity of multimodal approaches makes them ideal for detecting minimal residual disease following curative-intent treatment. Combining ctDNA mutation analysis with cancer-specific methylation markers significantly improves sensitivity over either approach alone. Integration of CTC detection and EV profiles provides orthogonal confirmation of persistent disease. Longitudinal monitoring of this multimodal signature can identify molecular relapse months before clinical or radiographic recurrence, creating opportunities for early intervention [2]. Current clinical trials are actively exploring this application, with several demonstrating the clinical validity of multimodal MRD detection in breast, colorectal, and lung cancers.
The Scientist's Toolkit: Essential Research Reagents and Platforms
Implementing multimodal liquid biopsy research requires specialized reagents, equipment, and computational resources. The following toolkit outlines critical components for establishing a robust research pipeline.
Table 3: Essential Research Reagents and Platforms for Multimodal Liquid Biopsy
| Category | Specific Products/Platforms | Primary Function | Key Considerations |
|---|---|---|---|
| Sample Collection & Stabilization | Streck Cell-Free DNA BCT, PAXgene Blood cDNA Tubes | Preserves blood sample integrity during transport and storage | Different tubes optimized for specific analytes (ctDNA vs. CTCs); critical for multicenter studies |
| Nucleic Acid Extraction | QIAamp Circulating Nucleic Acid Kit, MagMax Cell-Free DNA Isolation Kit | Isolation of high-quality ctDNA/cfRNA from plasma | Yield, fragment size preservation, elimination of contaminants and PCR inhibitors |
| CTC Enrichment Systems | CellSearch, CTC-iChip, IsoFlux, Parsortix | Isolation and enumeration of circulating tumor cells | Enumeration vs. molecular analysis requirements; epitope-dependent vs. label-free approaches |
| EV Isolation Platforms | Ultracentrifugation, qEV Size Exclusion Columns, ExoQuick | Extraction of extracellular vesicles from biofluids | Purity vs. yield trade-offs; downstream compatibility with omics analyses |
| Sequencing & Detection | Illumina Sequencing Panels, dPCR Systems (Bio-Rad), Nanostring | Molecular profiling of nucleic acids | Sensitivity for low-frequency variants; coverage uniformity; input requirements |
| Single-Cell Analysis | 10X Genomics, Fluidigm C1, DEPArray | Molecular characterization of individual CTCs | Viability requirements, whole transcriptome vs. targeted approaches, integration with CTC isolation |
| Data Integration Software | VAE Frameworks (PyTorch, TensorFlow), R/Bioconductor Packages | Multimodal data analysis and visualization | Computational resource requirements, scalability, customization capabilities |
Multimodal integration represents the frontier of liquid biopsy research, transforming how we study cancer biology and develop therapeutics. By simultaneously interrogating multiple biomarker classes—ctDNA, CTCs, EVs, and beyond—researchers can construct comprehensive models of tumor heterogeneity, evolution, and therapeutic resistance that were previously unattainable. While significant challenges remain in standardization, analytical validation, and computational integration, the accelerating pace of methodological development promises to overcome these barriers. As multimodal approaches mature, they will increasingly enable precise patient stratification, guide combination therapy development, and facilitate dynamic monitoring of treatment response. For oncology researchers and drug development professionals, embracing this integrated paradigm is essential for advancing the next generation of cancer diagnostics and therapeutics.
Assay Validation, Comparative Performance, and the Evolving Market Landscape
The integration of liquid biopsy into oncology research represents a paradigm shift in cancer management, offering a non-invasive method for genomic profiling and disease monitoring. Analytical validation serves as the critical foundation that establishes the performance characteristics of a liquid biopsy assay, ensuring that results are reliable, accurate, and reproducible for both research and clinical applications [1] [90]. This process provides the essential evidence that an test consistently performs as intended within its specified technical parameters, creating a bridge between basic research discoveries and clinically actionable information [91] [92].
In the context of liquid biopsy, analytical validation focuses on key performance metrics including precision (reproducibility of results), limit of detection (LOD) (lowest detectable amount of analyte), and concordance (agreement with established methods) [90] [93]. The evaluation framework for these assays typically follows a structured approach encompassing verification, analytical validation, and clinical validation (V3), which combines established practices from both software development and clinical science [92]. This systematic evaluation is particularly crucial for liquid biopsy applications due to the technical challenges associated with detecting low-abundance circulating tumor DNA (ctDNA) against a background of predominantly normal cell-free DNA, often requiring exceptional sensitivity to identify variants present at variant allele frequencies (VAF) below 1% [64] [1].
Table 1: Key Performance Metrics in Analytical Validation
| Performance Metric | Definition | Industry Standard Threshold | Technical Challenge in Liquid Biopsy |
|---|---|---|---|
| Limit of Blank (LoB) | Highest apparent analyte concentration in blank samples | False positive rate ≤5% [94] | Distinguishing true variants from sequencing artifacts |
| Limit of Detection (LOD) | Lowest VAF detected with defined confidence | Detection rate ≥95% [94] | Detecting low VAF variants in low-shedding tumors |
| Analytical Sensitivity | Proportion of true positives detected | Varies by variant type and input [90] | Overcoming biological and technical noise |
| Analytical Specificity | Proportion of true negatives correctly identified | Often >99.9% for specific variants [95] | Differentiating clonal hematopoiesis from tumor mutations |
| Precision | Reproducibility of results under specified conditions | High concordance between replicates [90] | Accounting for pre-analytical and analytical variability |
Core Principles of Analytical Validation
Limit of Detection (LOD) and Limit of Blank (LoB)
The Limit of Detection (LOD) represents the lowest variant allele frequency (VAF) at which a mutation can be reliably detected with a defined degree of confidence, typically set at ≥95% detection rate per industry standards [94]. Establishing the LOD requires testing serially diluted samples with known variants across multiple replicates, with the LOD defined as the lowest VAF where detection meets or exceeds the 95% threshold [94] [93]. For liquid biopsy assays, LOD values vary significantly based on the technology employed and the variant type being detected. Recent advancements have demonstrated increasingly sensitive LODs, with some assays achieving detection as low as 0.15% VAF for single nucleotide variants (SNVs) and insertions/deletions (indels) [64], while others report LODs between 0.25-0.5% VAF for SNVs and indels using 30ng of input cell-free DNA [90].
The Limit of Blank (LoB) is determined through testing multiple replicates of negative samples (known to not contain the analyte) at or near maximal assay input [94]. Industry standards permit a false positive rate not exceeding 5% of total specimen replicates assayed to claim an LoB of zero [94]. The relationship between LoB and LOD is critical—only when LoB is reliably distinguished from LOD can true positive variants at VAF below the established LOD be detected and reported in clinical specimens while maintaining minimal false positives [94]. This distinction enables some assays to confidently report variants below the formal LOD when stringent quality metrics are met, expanding the clinical utility of the test without compromising specificity.
Figure 1: Conceptual workflow for determining Limit of Blank (LoB) and Limit of Detection (LOD) in analytical validation.
Precision: Repeatability and Reproducibility
Precision in analytical validation encompasses both repeatability (intra-assay consistency) and reproducibility (inter-assay consistency), measuring the agreement between results obtained from the same sample under varying conditions [90] [95]. This metric evaluates the assay's robustness against potential sources of variability, including different operators, instruments, days, and reagent lots. In comprehensive validation studies, precision is typically demonstrated through high concordance rates between replicates, with some assays achieving 100% concordance for SNVs and 94.9% average positive agreement for sequence mutations across precision, reproducibility, and repeatability (PRR) assessments [90] [95].
The validation of precision requires carefully designed experiments that test the assay under conditions reflecting real-world variability. These studies assess consistency across multiple dimensions: intra-run, inter-run, inter-operator, inter-instrument, and inter-day variations [95]. For example, in the Tempus xF assay validation, inter-instrument concordance was 96.70% for SNVs and 100% for indels, demonstrating robust performance across different laboratory environments [90]. Similarly, the Labcorp Plasma Complete test demonstrated 94.9% average positive agreement and 99.9% average negative agreement for sequence mutations across precision studies [95]. These rigorous evaluations ensure that liquid biopsy tests deliver consistent results regardless of where or when the testing occurs, establishing essential reliability for both research and clinical applications.
Concordance with Orthogonal Methods
Concordance assessment measures the agreement between the liquid biopsy assay and established testing methods, serving as a critical indicator of analytical accuracy [90] [93]. This validation component typically involves comparison with multiple orthogonal methods, including tissue-based comprehensive genomic profiling (CGP), digital droplet PCR (ddPCR), and other validated liquid biopsy assays [90]. The comparison with tissue-based profiling is particularly important as tissue biopsy remains the gold standard for tumor diagnosis and molecular profiling [1].
Studies demonstrate variable concordance rates depending on the variant type and assay characteristics. For example, the PAN100 panel showed 73.1% positive percent agreement (PPA) for SNVs and 80.0% for indels when compared to tissue-based NGS [93]. The Tempus xF assay demonstrated 68.18% sensitivity for SNVs and indels relative to matched tissue testing, with this value increasing to 74.31% when analysis was limited to clinically actionable targets [90]. These concordance values are influenced by several biological and technical factors, including tumor shedding characteristics, spatial and temporal heterogeneity, and the time interval between tissue and liquid biopsy collection. Importantly, the development of dynamic filtering methods and matched normal sequencing has improved concordance by reducing false positives resulting from clonal hematopoiesis and germline variants [90].
Experimental Protocols for Validation Studies
Sample Selection and Processing
Robust analytical validation requires carefully planned experiments using appropriate reference materials and clinical samples. For sample selection, validation studies typically employ three categories of samples: commercially available reference standards with known variant profiles, cell lines with characterized mutations, and well-annotated patient-derived samples with matched tissue and plasma [90] [93]. Each sample type serves a distinct purpose in the validation workflow. Reference materials, such as Seraseq ctDNA Reference Materials, provide standardized samples with predetermined variant allele frequencies for establishing analytical sensitivity and LOD [93]. Cell lines offer renewable resources for precision studies, while patient samples with matched tissue enable concordance analysis with the gold standard of tissue profiling [90].
The pre-analytical phase encompasses all steps from sample collection to nucleic acid extraction and requires stringent standardization to ensure reproducible results. Key considerations include blood collection tube type (e.g., Streck, EDTA, or specialized cfDNA collection tubes), time-to-processing, centrifugation protocols for plasma separation, and cfDNA extraction methods [90]. For example, in the Tempus xF validation, plasma samples were processed within specified timeframes from blood draws to prevent genomic DNA contamination and preserve cfDNA integrity [90]. Similarly, in the endometrial cancer liquid biopsy study, plasma samples, white blood cell buffy coats, and tumor tissue were collected under standardized protocols from all participants to ensure sample quality and enable matched analyses [96]. These standardized procedures minimize pre-analytical variability that could compromise validation results and subsequent test performance.
Analytical Sensitivity and LOD Determination
The experimental protocol for determining analytical sensitivity and LOD involves a systematic approach using serially diluted reference materials with known variant concentrations. The process begins with preparing dilution series from reference standards containing confirmed variants, spanning a range of variant allele frequencies that bracket the expected LOD of the assay [94] [93]. Each dilution level is tested with multiple replicates (typically 20-60 per level) to establish statistical confidence in detection rates [94]. The LOD is then defined as the lowest VAF where detection meets or exceeds the 95% threshold across replicates [94].
Experimental data from recent studies demonstrates the progression of LOD values across different variant types. For instance, the Northstar Select assay achieved a LOD of 0.15% VAF for SNVs/indels, while the PAN100 panel demonstrated a LOD of 0.3% VAF [64] [93]. The Tempus xF assay showed differential sensitivity across variant classes, reliably detecting SNVs at 0.25% VAF, indels at ≥0.5% VAF, CNVs at ≥0.5% VAF, and rearrangements at ≥1% VAF with 30ng of input DNA [90]. This tiered sensitivity reflects the technical challenges associated with detecting different variant types in ctDNA, with structural variants typically requiring higher VAF for reliable detection compared to single nucleotide variants.
Table 2: Experimentally Determined LOD Values from Recent Liquid Biopsy Assays
| Assay Name | SNVs/Indels LOD | CNV LOD | Fusion LOD | Input DNA | Reference |
|---|---|---|---|---|---|
| Northstar Select | 0.15% VAF | 2.11 copies (amplifications)1.80 copies (losses) | 0.30% | Not specified | [64] |
| Tempus xF | 0.25% VAF (SNVs)≥0.5% VAF (indels) | ≥0.5% VAF | ≥1% VAF | 30ng | [90] |
| PAN100 Panel | 0.3% VAF | Not specified | Not specified | Not specified | [93] |
| FoundationOne Liquid CDx | 0.45% VAF (EGFR Ex19del) | Not specified | 0.68% VAF (ALK) | Not specified | [94] |
Precision and Reproducibility Testing
The experimental design for precision testing encompasses multiple dimensions of variability that might be encountered in real-world implementation. The protocol involves testing the same sample set across different operators, instruments, days, and reagent lots to quantify each source of variability [90] [95]. Intra-assay precision (repeatability) is assessed by running multiple replicates of the same samples within a single batch, while inter-assay precision (reproducibility) evaluates consistency across different batches, typically performed on different days with different reagent lots [95]. For comprehensive genomic profiling assays, precision is evaluated across all variant types, with acceptance criteria typically set at >95% concordance for established variants [95].
In the Labcorp Plasma Complete validation, precision, reproducibility, and repeatability (PRR) assessments resulted in 94.9% average positive agreement and 99.9% average negative agreement for sequence mutations, with 100% agreement for CNAs, translocations, and MSI-H status [95]. Similarly, the Tempus xF assay demonstrated 100% intra-assay and inter-assay concordance for SNVs, indicating a high degree of repeatability and reproducibility [90]. These studies also evaluate the impact of potential interfering substances such as genomic DNA, ethanol, and isopropanol, with the Tempus xF assay showing 100% concordance between controls and samples with interfering substances that passed filtering criteria [90].
Figure 2: Experimental workflow for precision testing in analytical validation studies.
The Scientist's Toolkit: Essential Research Reagents
Table 3: Essential Research Reagents for Liquid Biopsy Validation
| Reagent Category | Specific Examples | Function in Validation | Considerations for Selection |
|---|---|---|---|
| Reference Standards | Seraseq ctDNA Reference Materials [93] | Establish analytical sensitivity, LOD, and accuracy | Verify commutability with clinical samples; select appropriate variant mix |
| Cell Lines | Commercially available cancer cell lines with characterized mutations [90] | Assess precision and reproducibility | Ensure genetic stability across passages; document culture conditions |
| Negative Controls | Plasma from healthy donors [93] | Determine Limit of Blank (LoB) and specificity | Match demographic characteristics; exclude individuals with clonal hematopoiesis |
| Extraction Kits | cfDNA extraction kits (various vendors) | Isolate cell-free DNA from plasma | Evaluate yield, fragment size distribution, and inhibitor removal |
| Library Prep Kits | Hybridization capture-based NGS kits [90] [95] | Prepare sequencing libraries | Assess conversion efficiency, complexity, and bias |
| Target Enrichment Panels | Custom or commercial panels (e.g., 105-gene Tempus xF) [90] | Capture genomic regions of interest | Consider coverage uniformity, off-target rates, and GC bias |
| Sequencing Platforms | Illumina sequencers (e.g., NovaSeq, NextSeq) [90] | Generate raw sequencing data | Evaluate output, read length, and quality scores |
| Bioinformatic Tools | Variant callers, clonal hematopoiesis filters [90] | Analyze sequencing data | Establish thresholds for sensitivity/specificity balance |
Clinical Implications and Applications
The rigorous analytical validation of liquid biopsy assays has profound implications for their application in oncology research and clinical practice. Clinical utility is established when biomarkers detected by validated assays demonstrate improved patient outcomes, as evidenced by a recent study showing that 67-72% of patients with biomarkers detected below LOD still responded to matched targeted therapies, exceeding prespecified thresholds for clinical utility [94]. This finding underscores the importance of comprehensive analytical validation that extends beyond establishing basic performance characteristics to demonstrating real-world clinical impact.
The validation framework directly supports key applications in precision oncology, including therapy selection, treatment monitoring, and early detection of resistance mechanisms [1] [90]. For example, in endometrial cancer, liquid biopsy identified pathogenic mutations in plasma ctDNA in 93% of cases with 65% concordance between plasma and solid tumor mutations, highlighting its potential as a minimally invasive diagnostic and monitoring tool [96]. Similarly, the Tempus xF assay demonstrated capability in distinguishing clonal hematopoiesis variants from true tumor-derived mutations, reducing false positives and improving clinical interpretation [90]. These applications leverage the analytically validated performance characteristics of liquid biopsy assays to provide real-time insights into tumor biology, enabling more dynamic and personalized cancer management approaches that complement traditional tissue-based profiling.
The principles of analytical validation—encompassing precision, LOD, and concordance—form the essential foundation for establishing liquid biopsy as a reliable tool in oncology research and clinical practice. As the field continues to evolve, ongoing refinement of validation standards and methodologies will be crucial to keep pace with technological advancements. Future directions include the development of more sensitive assays capable of detecting increasingly lower variant allele frequencies, standardized approaches for validating multi-analyte liquid biopsy tests, and establishment of universal reference materials that enable cross-platform comparisons. Through rigorous analytical validation that demonstrates both technical excellence and clinical utility, liquid biopsy promises to revolutionize cancer management by providing non-invasive, real-time insights into tumor dynamics.
Comprehensive Genomic Profiling (CGP) has become indispensable in precision oncology, enabling clinicians and researchers to identify targetable genomic alterations in cancer patients. As the number of available CGP assays grows, rigorous head-to-head comparisons are essential to guide assay selection for clinical practice and research protocols. This technical guide synthesizes recent evidence from direct comparisons of commercial CGP platforms, focusing on their performance characteristics, technical capabilities, and suitability for different research applications within liquid biopsy and tissue-based profiling.
The evolution of CGP has progressed from tissue-based approaches to increasingly sophisticated liquid biopsy applications that analyze circulating tumor DNA (ctDNA). Liquid biopsy offers distinct advantages including minimal invasiveness, ability to capture tumor heterogeneity, and potential for serial monitoring of treatment response and resistance mechanisms [1]. Current CGP assays employ various technological approaches including hybrid capture, multiplex PCR, and emerging advanced fidelity techniques, each with unique performance characteristics that must be understood for proper implementation in research settings.
Performance Metrics in CGP Assay Comparisons
Analytical Sensitivity and Limit of Detection
The limit of detection (LOD) represents a critical performance parameter for CGP assays, particularly in liquid biopsy applications where ctDNA fractions can be exceptionally low. Analytical validation studies demonstrate that newer assays are achieving progressively lower LOD values, enabling detection of minimal residual disease (MRD) and early-stage cancers.
Recent evaluations of the Northstar Select liquid biopsy assay demonstrated a 95% LOD of 0.15% variant allele frequency (VAF) for single nucleotide variants (SNVs) and insertions/deletions (indels), confirmed by digital droplet PCR (ddPCR) [64]. This represents a significant improvement over earlier commercial assays, with the same study reporting sensitive detection of copy number variations (CNVs) down to 2.11 copies for amplifications and 1.80 copies for losses, and 0.30% for gene fusions. These advances address a key challenge in liquid biopsy testing where variant abundance is frequently low.
External quality assessment (EQA) studies across multiple institutions have further defined practical detection limits, revealing that the VAF with a 95% detection rate was approximately 6-6.1% for nucleic acids from cancer cell lines and 10.8-10.9% for formalin-fixed paraffin-embedded (FFPE) samples [97]. These studies highlighted significant variability in detection rates among laboratories, particularly for variants with VAF below 10%, emphasizing the importance of standardization in pre-analytical processing.
Concordance Rates Between Tissue and Liquid Biopsy
Tumor-tissue concordance represents a fundamental metric for validating liquid biopsy assays. A 2025 study of 874 patients with cancer across 21 tumor types demonstrated high concordance for coding (median = 97%) and clinical oncogenic mutations (median = 88% concordance) between matched tumor and blood specimens [98]. Therapeutically actionable mutations were identified in 233 patients by both assays, while 48 patients (11%) had actionable mutations detected only in cfDNA assays, and 23 patients (5%) had mutations in tumor only.
Table 1: Tissue-Liquid Biopsy Concordance Across Studies
| Study/Assay | Patient Population | Coding Mutation Concordance | Clinical Oncogenic Mutation Concordance | Actionable Mutations Detected Only in Liquid Biopsy |
|---|---|---|---|---|
| Allegheny Health Network (2025) [98] | 430 patients across 21 tumor types | Median 97% | Median 88% | 11% of patients |
| ROME Trial Exploratory Analysis [19] | Advanced solid tumors | - | 49% overall actionable alteration concordance | Combined approach increased actionable detection |
| Memorial Sloan Kettering Cancer Center [98] | 617 patients | 59% mutation overlap | - | - |
| Tempus Pan-Cancer Study [98] | 3,209 patients across 4 cancer types | - | 66.4% actionable variant concordance | - |
Notably, concordance rates remain variable across different study designs and clinical settings. The ROME trial reported only 49% concordance between tissue and liquid biopsies in detecting actionable alterations, yet combining both modalities significantly increased overall detection of actionable alterations and led to improved survival outcomes [19]. This suggests that liquid and tissue biopsies provide complementary rather than redundant genomic information, a crucial consideration for research protocols.
Head-to-Head Comparisons of Commercial CGP Assays
Liquid Biopsy Assay Performance
Direct comparative studies provide the most actionable data for assay selection. In a prospective head-to-head comparison of 182 patients, the Northstar Select assay outperformed on-market CGP liquid biopsy assays, identifying 51% more pathogenic SNVs/indels and 109% more CNVs [64]. This enhanced sensitivity resulted in 45% fewer null reports (assays with no pathogenic or actionable results), addressing a significant limitation of earlier liquid biopsy technologies. The majority (91%) of additional clinically actionable SNVs/indels detected by Northstar Select were found below 0.5% VAF, highlighting its particular utility for low-shedding tumors [64].
Technological innovations continue to push sensitivity boundaries. The MUTE-Seq method, presented at AACR 2025, leverages a highly precise FnCas9-AF2 variant to selectively eliminate wild-type DNA, enabling highly sensitive detection of low-frequency cancer-associated mutations for MRD evaluation in non-small cell lung cancer and pancreatic cancer [19]. Such specialized methods may complement broader CGP approaches for specific research applications requiring exceptional sensitivity.
Tissue-Based CGP Performance with Challenging Samples
Tissue-based CGP faces unique challenges related to sample quality and quantity. Analysis of 31,165 consecutive real-world tissue samples revealed that 59% had <25 mm² tumor surface area and 11% had <20% tumor content [99]. Despite these limitations, an optimized PCR-based CGP approach coupled with an inclusive exception testing policy delivered reportable results for 94% of samples, including 81% of samples not meeting minimum input requirements [99].
Table 2: Tissue CGP Success Rates with Suboptimal Samples
| Sample Characteristic | Percentage of Received Samples | Reportability Rate with Optimized PCR-CGP |
|---|---|---|
| Tumor Surface Area <25 mm² | 59.2% | >94% overall reportability |
| Tumor Content <20% | 10.7% | - |
| Exception samples (not meeting input requirements) | 26.0% | 80.5% |
| Cytology cell blocks (FNA and fluid cytology) | 7.8% | - |
These findings demonstrate that optimized CGP approaches can successfully profile the majority of real-world tissue samples, potentially expanding the proportion of patients who can undergo biomarker-guided therapies. The success with exception samples is particularly relevant for rare cancers or difficult-to-biopsy tumor locations where tissue is often limited.
Methodologies for CGP Benchmarking Studies
Standardized Blood Collection and Plasma Processing
Robust pre-analytical protocols are fundamental for reliable liquid biopsy results. The Allegheny Health Network study implemented a standardized approach where whole blood samples were collected in three 10-mL Streck Cell-Free DNA BCT tubes followed by gentle inversion and maintenance at room temperature (18°C to 25°C) [98]. To minimize germline DNA contamination, a three-step sequential centrifugation protocol was employed:
- Initial centrifugation at 1600 × g for 10 minutes at 4°C using a swinging bucket rotor with no brake
- Secondary centrifugation of plasma layer at 10,000 × g for 10 minutes at 4°C in a fixed-angle rotor with soft brake
- Third identical centrifugation step to eliminate residual cells [98]
This rigorous processing yielded cfDNA comprised predominantly of mononucleosomal fragments (mean ± SD = 166 ± 5 bp) that generated comparably sized sequencing reads (mean ± SD = 162 ± 25 bp) across 874 patients [98].
Analytical Validation Approaches
Comprehensive analytical validation establishes assay performance characteristics. The Northstar Select validation included:
- Limit of Detection Studies: Using contrived samples with known mutation VAFs to establish 95% LOD for different variant types
- Accuracy Assessment: Comparison to orthogonal methods like ddPCR for verification
- Precision Evaluation: Within-run and between-run reproducibility testing
- Interference Studies: Assessing potential interference from substances like genomic DNA, hemoglobin, and lipids [64]
For tissue-based CGP, validation must address challenges specific to FFPE samples, including DNA fragmentation, cross-linking, and deamination artifacts. The integration of DNA and RNA analysis in dual panels, such as the Todai OncoPanel, enables more comprehensive profiling but requires careful quality control of both nucleic acid types [100].
Diagram 1: Liquid Biopsy Workflow for CGP Analysis. This diagram illustrates the standardized three-step centrifugation protocol for plasma processing and subsequent analytical steps for comprehensive genomic profiling.
Quality Metrics and Standardization
Critical Quality Control Parameters
Consistent quality control is essential for reliable CGP results across platforms. Key metrics include:
- For DNA panels: ddCq values (indicating DNA fragmentation) serve as indicators of sequencing depth, while Q-values reflect uniformity of sequencing across different regions [100]
- For RNA panels: DV200 values assess RNA quality and predict coverage of housekeeping genes [100]
- Sequencing metrics: On-target rate, mean depth, coverage uniformity, and target exon coverage provide comprehensive quality assessment [100]
Significant inter-laboratory and inter-platform variability in quality metrics has been observed. EQA studies revealed wide variability in VAF measurements among laboratories (relative standard deviation 13-60%) for variants with <20% VAF [97]. This highlights the need for continued standardization efforts, particularly for pre-analytical processes like nucleic acid extraction from FFPE samples, which critically impact variant detection sensitivity.
External Quality Assessment Programs
Implementation of external quality assessment (EQA) and proficiency testing (PT) programs is increasingly recognized as essential for CGP standardization. A cost-effective EQA program across 10 Japanese institutions demonstrated that preanalytical processes, particularly nucleic acid extraction from FFPE samples, are critical for variant detection accuracy [97]. This study revealed that 10% VAF in pre-analytic processing represents a critical threshold for reliable variant detection in CGP analysis.
EQA programs also identify common bioinformatic pitfalls. In the Japanese study, incorrect variant calling was observed where BRAF c.1798_1799delinsAA (p.V600K) was mistakenly interpreted as c.1798G>A when using certain analysis pipelines [97]. Such findings underscore the importance of comprehensive EQA that includes both wet-lab and bioinformatic components.
The Scientist's Toolkit: Essential Research Reagents and Materials
Table 3: Essential Research Reagents for CGP Benchmarking Studies
| Reagent/Material | Function | Application Notes |
|---|---|---|
| Streck Cell-Free DNA BCT Tubes | Blood collection and stabilization | Prevents leukocyte lysis and preserves cfDNA profile for up to 14 days at room temperature [98] |
| Magnetic beads for cfDNA extraction | cfDNA purification from plasma | Size-selective isolation optimizes for mononucleosomal fragments (≈166 bp) [98] |
| Hybrid capture or PCR-based target enrichment | Library preparation for NGS | Hybrid capture enables larger gene panels; PCR-based approaches may offer better sensitivity for limited samples [99] [64] |
| Unique molecular identifiers (UMIs) | Error suppression and quantification | Enables distinction of PCR duplicates from unique molecules and reduces sequencing errors |
| Reference standard materials | Assay validation and QC | Commercially available contrived samples with known mutation VAFs enable LOD determination [97] |
| FFPE quality control metrics | Tissue sample QC | ddCq, Q-value, and tumor content assessment critical for reliable tissue CGP [100] |
| Bioinformatics pipelines | Variant calling and annotation | Critical for accurate variant identification; multiple pipelines should be compared in benchmarking studies [97] |
Emerging Technologies and Future Directions
Multi-Omics Integration and Artificial Intelligence
The future of CGP lies in integrating multiple analytical modalities. Multi-omics approaches combining genomic, transcriptomic, and fragmentomic data are enriching our understanding of cancer biology and opening new possibilities for precise tumor classification [101]. For example, cfDNA fragmentome analysis has demonstrated high accuracy (AUC = 0.92) in distinguishing liver cirrhosis and hepatocellular carcinoma from healthy states in a 724-person cohort [19].
Artificial intelligence is increasingly applied to extract maximum information from CGP data. Methylation-based deconvolution models can now quantify proportions of lung cancer histology subtypes within a single blood sample with 85.1% accuracy, detecting subclonal populations as low as 0.1% [19]. Similarly, the CIRI-LCRT model integrates radiomic and pathological features from CT scans with serial ctDNA measurements to predict progression in NSCLC patients a median of 2-3 months ahead of conventional post-treatment MRD assays [19].
Advanced Fidelity Enzymes and Detection Methods
Novel detection methods continue to enhance CGP sensitivity. The MUTE-Seq method employs engineered advanced-fidelity FnCas9 to selectively eliminate wild-type DNA, enabling highly sensitive detection of low-frequency cancer-associated mutations [19]. Such approaches address the fundamental challenge of detecting rare variants against a background of predominantly wild-type molecules.
Protein-based biomarkers are also gaining attention as complementary approaches. In the European Prospective Investigation into Cancer and Nutrition (EPIC) cohort, proteomic analysis identified 19 proteins associated with premenopausal breast cancer risk and three with postmenopausal risk, suggesting novel pathways and potential biomarkers that vary by menopausal status [19]. Multi-analyte approaches that combine ctDNA with protein markers may offer enhanced sensitivity for early detection applications.
Diagram 2: CGP Technology-Application Relationships. This diagram illustrates the connections between different CGP technologies, their performance characteristics, and optimal research applications, highlighting technology-specific strengths.
Benchmarking studies of commercial CGP assays reveal a rapidly evolving landscape with significant performance differences between platforms. The choice between liquid and tissue-based CGP depends on specific research objectives, with liquid biopsy offering advantages for serial monitoring and capturing heterogeneity, while tissue remains essential for comprehensive genomic assessment when sample quality is adequate. Emerging technologies including advanced fidelity enzymes, multi-omics integration, and artificial intelligence are steadily improving sensitivity and expanding clinical applications.
For researchers designing studies incorporating CGP, key considerations include expected tumor fraction, required sensitivity, need for complementary biomarkers, and availability of standardized protocols. As CGP technologies continue to advance, ongoing benchmarking efforts will be essential to guide optimal assay selection and implementation in precision oncology research.
The tumor-agnostic principle represents a paradigm shift in oncology, moving from tissue-based classification to molecular alteration-focused treatment. This approach targets shared molecular biomarkers across diverse cancer types, demonstrating validated clinical efficacy and expanding therapeutic options for patients with rare and refractory cancers. This whitepaper examines the validation of this principle across cancer types, with particular emphasis on the enabling role of liquid biopsy technologies in biomarker detection, resistance monitoring, and outcome assessment. The integration of tumor-agnostic therapies with advanced diagnostic methods like liquid biopsy is reshaping cancer drug development and precision oncology implementation, offering a framework for more personalized and effective cancer care.
Molecular Foundations of Tumor-Agnostic Therapeutics
The fundamental premise of tumor-agnostic therapy rests on targeting driver molecular alterations that initiate and sustain tumor growth across histological boundaries, rather than focusing on the tumor's anatomical origin [102]. This approach acknowledges cancer as a disease driven by genetic and molecular aberrations, enabling therapies to target universal drivers across diverse tumor types [102]. The distinction between driver mutations, which are critical therapeutic targets, and passenger mutations, which do not directly drive tumorigenesis, is central to the rationale for tumor-agnostic therapies [102].
Advancements in comprehensive molecular profiling through initiatives like The Cancer Genome Atlas (TCGA) have revealed shared molecular constellations across traditionally distinct cancer types, providing the scientific foundation for tissue-agnostic drug development [103]. These pan-cancer analyses have identified characteristic mutational signatures and significantly mutated genes involved in diverse cellular processes, including TP53, PTEN, APC, KRAS, and RB1 [103]. The discovery that certain molecular alterations—such as gene fusions, specific mutations, and immune biomarkers—occur across multiple cancer types regardless of tissue origin has enabled the development of therapies that target these shared vulnerabilities [102] [104].
Table 1: Key Molecular Targets for Tumor-Agnostic Therapies
| Molecular Target | Alteration Type | Therapeutic Approach | Common Cancer Types with Alteration |
|---|---|---|---|
| MSI-H/dMMR | Defective DNA mismatch repair | Immune checkpoint inhibitors | Colorectal, endometrial, gastric [104] |
| NTRK | Gene fusion | Tyrosine kinase inhibitors | Thyroid, salivary gland, breast, brain, lung, soft tissue sarcomas [104] |
| BRAF V600E | Point mutation | BRAF/MEK inhibitor combination | Melanoma, lung, thyroid, colon, biliary tract, brain cancers [104] |
| TMB-H | High tumor mutational burden | Immune checkpoint inhibitors | Skin (melanoma), bladder, lung, small bowel, colon, endometrium [104] |
| RET | Gene fusion | RET inhibitors | Thyroid, lung, breast, colon, esophagus, ovary, stomach cancers [104] |
| HER2 | Overexpression | Antibody-drug conjugates | Breast, gastroesophageal, lung, colorectal, salivary gland cancers [104] |
The transformative potential of tumor-agnostic therapies lies in their ability to bridge molecular precision with broad applicability. By targeting fundamental cancer drivers and relevant microenvironmental factors, these therapies align with precision medicine principles while offering therapeutic options for cancers that lack effective standard treatments [102]. This approach has proven particularly valuable for rare malignancies with shared molecular alterations across tissue types, where traditional drug development pathways are challenging due to limited patient populations [102].
Clinical Validation Across Cancer Types
Regulatory Milestones and Efficacy Evidence
The validation of the tumor-gnostic principle began with the landmark 2017 U.S. Food and Drug Administration (FDA) approval of pembrolizumab for microsatellite instability-high (MSI-H) or mismatch repair-deficient (dMMR) solid tumors, marking the first therapy approved based on a molecular biomarker regardless of tumor location [102]. This milestone established that targeting molecular features irrespective of tumor origin was clinically feasible and paved the way for subsequent approvals targeting NTRK fusions, BRAF V600E mutations, TMB-H, RET fusions, and HER2 overexpression [102] [104].
As of 2025, eight drugs or regimens have received FDA approval for six distinct tumor-agnostic indications [104]. These approvals demonstrate remarkable efficacy across diverse cancer types. For NTRK fusions, tyrosine kinase inhibitors including larotrectinib and entrectinib have shown significant activity across at least 45 different cancer types, with particularly strong responses in thyroid, salivary gland, breast, brain, and lung cancers as well as soft tissue sarcomas [104]. The combination of dabrafenib and trametinib represents the only tumor-agnostic drug combination approved for solid tumors with BRAF V600E mutations, which have been identified in 28 different cancer types [104].
Real-world evidence from large-scale analyses provides critical insights into the clinical applicability of tumor-agnostic therapies across cancer types. A comprehensive analysis of 295,316 molecularly-profiled tumor samples revealed that 21.5% of tumors harbored at least one tissue-agnostic indication, with 5.4% lacking a cancer-specific alternative, highlighting the significant molecular burden addressable by this approach [105]. This analysis demonstrated immense variability in the frequency of tissue-agnostic indications across tumor lineages, ranging from 0% (pituitary carcinoma) to 87% (basal cell skin cancer) [105].
Real-World Outcomes and Variability
Real-world evidence provides crucial insights into the nuanced application of tumor-agnostic therapies across different cancer types. While these treatments demonstrate broad efficacy, significant variability exists in treatment benefit and overall survival across tumor types [105]. For TMB-High cancers, analysis of pembrolizumab treatment reveals substantial differences in median time on treatment (TOT), ranging from 2.4 months for small cell lung cancer to 4.9 months for non-small cell lung cancer [105].
Similarly, for MSI-High/MMRd cancers, variability in TOT with pembrolizumab was observed across cancer types, from 3.0 months for prostate cancer to 6.3 months for colorectal cancer [105]. These findings indicate that while tissue-agnostic therapies can be applied across cancer types based on molecular markers, treatment effects are not uniformly consistent across all tissues, suggesting the potential influence of additional tumor-specific factors on therapeutic outcomes.
Table 2: Real-World Clinical Outcomes for Tumor-Agnostic Therapies Across Selected Cancer Types
| Biomarker | Therapy | Cancer Type | Median Time on Treatment (Months) | Overall Survival Trends |
|---|---|---|---|---|
| TMB-High | Pembrolizumab | Non-small cell lung cancer | 4.9 [105] | Significantly shorter [105] |
| Small cell lung cancer | 2.4 [105] | Significantly shorter [105] | ||
| Melanoma | > Global median [105] | Significantly prolonged [105] | ||
| Endometrial cancer | > Global median [105] | Significantly prolonged [105] | ||
| MSI-H/MMRd | Pembrolizumab | Colorectal cancer | 6.3 [105] | Data not specified |
| Prostate cancer | 3.0 [105] | Data not specified | ||
| NTRK Fusions | Larotrectinib, Entrectinib | Multiple cancer types | Real-world uptake only ~33% [105] | N/A |
Analysis of real-world treatment patterns also reveals challenges in clinical adoption, particularly for rare biomarkers. For NTRK gene fusions (present in only 0.2% of all cases), real-world data shows that only approximately one-third of patients receive FDA-approved NTRK-targeting agents in any given year, indicating significant barriers to implementation despite drug availability [105]. Patients who did not receive NTRK-targeted therapy were more likely to have concurrent MSI-High or TMB-High status, suggesting preferential use of checkpoint inhibitors in these cases [105].
Trial Methodologies for Tumor-Agnostic Drug Development
Innovative Trial Designs
The development of tumor-agnostic therapies requires innovative clinical trial methodologies that transcend traditional tumor-specific frameworks. Basket trials have emerged as a predominant design, evaluating the effect of a targeted therapy on multiple cancer types that share a common molecular alteration [102]. These trials enable researchers to assess drug efficacy across diverse populations rapidly and with increased efficiency in patient recruitment [102]. Notable examples include the NCI-MATCH trial, which matched patients to therapies based on actionable molecular targets, and the KEYNOTE-158 trial, which evaluated pembrolizumab in MSI-H or dMMR tumors and supported its approval as a tumor-agnostic therapy [102].
Umbrella trials represent another innovative approach, stratifying patients with a single cancer type by multiple biomarkers to evaluate targeted therapies [102]. Examples include the National Lung Matrix Trial (NLMT) and Lung-MAP study, which tested therapies for advanced non-small cell lung cancer with specific genomic alterations [102]. These designs allow for the evaluation of multiple targeted therapies within a single trial infrastructure, accelerating drug development for specific biomarker-defined populations.
Platform trials add further flexibility through their adaptive and perpetual design, enabling continuous evaluation of novel therapies with the ability to add or remove treatment arms based on interim results [102]. The I-SPY 2 trial for high-risk breast cancer and GBM AGILE for glioblastoma exemplify this approach, efficiently testing multiple therapeutic strategies against a shared control group [102].
Methodological Considerations and Protocols
Tumor-agnostic trial methodologies present unique methodological considerations, particularly regarding biomarker assessment and patient stratification. Centralized biomarker testing using next-generation sequencing (NGS) panels is essential for accurately identifying eligible patients across cancer types [105]. The incorporation of real-world evidence (RWE) has become increasingly important for understanding the practical therapeutic implications of tissue-agnostic therapies, as demonstrated by analyses combining NGS data with insurance claims databases to evaluate treatment patterns and outcomes [105].
Protocols for tumor-agnostic trials must address several unique challenges, including the need for robust biomarkers, complexities of regulatory requirements, and statistical considerations for rare cancer populations [102]. These trials often employ hierarchical primary endpoints, initially establishing overall efficacy across the basket population, then examining consistency of treatment effects across individual cancer types [102]. Adaptive statistical designs may be incorporated to allow for modifications based on interim analyses, particularly important when investigating rare biomarker-cancer type combinations [102].
Figure 1: Workflow of Tumor-Agnostic Clinical Trial Methodology. This diagram illustrates the sequential process from patient identification through molecular screening to trial assignment and endpoint analysis in tumor-agnostic drug development.
Liquid Biopsy in Tumor-Agnostic Applications
Technological Foundations and Methodologies
Liquid biopsy represents a transformative technology for tumor-agnostic applications, enabling non-invasive detection of molecular biomarkers through analysis of circulating tumor DNA (ctDNA), cell-free DNA (cfDNA), cell-free RNA, proteins, and metabolites in blood and other bodily fluids [106]. This approach substantially broadens the spectrum of detectable cancers and enhances population coverage, addressing limitations of traditional tissue-based biopsy methods [106]. The technological foundation of liquid biopsy for tumor-agnostic applications relies on sensitive detection methods including next-generation sequencing (NGS), digital PCR, and emerging fragmentomics approaches that analyze the size, structure, and distribution of cfDNA fragments [28].
Advanced liquid biopsy methodologies enable comprehensive molecular profiling for tumor-agnostic biomarkers without the invasiveness and sampling limitations of tissue biopsies. Ultrasensitive assays like the NeXT Personal assay can detect ctDNA as low as two parts per million, allowing for identification of minimal residual disease and early cancer recurrence [28]. Fragmentomic patterns provide an additional dimension of biomarker information, capturing disease dynamics that complement mutation-based monitoring and requiring only minimal blood volumes (as little as one nanogram of cell-free DNA in a few milliliters of plasma) [28]. This method is particularly suitable for tumor-agnostic applications as it doesn't depend on tracking specific mutations, making it applicable across many cancer types [28].
Clinical Applications and Workflows
Liquid biopsy enables several critical applications within the tumor-agnostic framework. In ctDNA-guided immunotherapy, liquid biopsy can intercept cancer at molecular signs of relapse months before clinical evidence emerges. A phase II study presented at the AACR Annual Meeting 2025 demonstrated that patients with early-stage, dMMR solid cancers who had detectable ctDNA post-surgery achieved an 86.4% recurrence-free rate at two years when treated with pembrolizumab, compared to 66.7% in ctDNA-positive patients who did not receive the drug [28]. This approach allows for dynamic monitoring of treatment response and earlier intervention for high-risk patients while avoiding overtreatment in those unlikely to benefit [28].
The VICTORI study illustrated the remarkable sensitivity of liquid biopsy for detecting cancer recurrence, identifying all post-resection clinical recurrences in colorectal cancer patients before imaging, with half of recurrences detected at least six months prior to radiological evidence [28]. Optimal timing for post-operative ctDNA testing is critical, as surgery-induced cfDNA spikes may dilute the ctDNA signal at very early timepoints (e.g., two weeks post-resection), making slightly later measurement (e.g., four weeks) more reliable for clinical decision-making [28].
Figure 2: Liquid Biopsy Workflow for Tumor-Agnostic Biomarker Detection. This diagram illustrates the integrated process from sample collection through analysis to clinical application of liquid biopsy in identifying tumor-agnostic biomarkers.
Research Reagent Solutions for Liquid Biopsy Applications
Table 3: Essential Research Reagents for Liquid Biopsy-Based Tumor-Agnostic Studies
| Reagent Category | Specific Examples | Research Application | Technical Considerations |
|---|---|---|---|
| Cell-Free DNA Extraction Kits | Silica-membrane columns, Magnetic bead-based systems | Isolation of high-quality cfDNA from plasma | Yield, fragment size preservation, inhibitor removal [28] |
| Next-Generation Sequencing Libraries | Hybrid capture panels, Amplicon-based panels | Comprehensive mutation profiling | Target regions covering tumor-agnostic biomarkers (NTRK, RET, BRAF, etc.) [105] [28] |
| MSI/dMMR Detection Assays | PCR-based panels, NGS panels | Assessment of microsatellite instability | Pan-cancer applicability, sensitivity for low-frequency variants [104] [28] |
| TMB Calculation Algorithms | Bioinformatics pipelines | Tumor mutational burden quantification | Standardized thresholds, filtering of germline variants [104] [105] |
| Fragmentomics Analysis Tools | Bioinformatics software for size distribution analysis | Pattern-based cancer detection | Machine learning integration, tissue-of-origin determination [28] |
| ctDNA Reference Standards | Synthetic cfDNA controls, Reference materials | Assay validation and quality control | Defined variant allele frequencies, representative genomic contexts [28] |
Future Directions and Implementation Challenges
The tumor-agnostic landscape continues to evolve with several promising directions. Researchers are investigating new drugs for currently identified targets such as RET, along with combination immunotherapy treatments to overcome drug resistance [104]. Novel targets under investigation include ALK, NRG1, KRAS G12C, FGFR, mesenchymal-epithelial transition factor, ROS1, and tumor protein p53 Y220C [104]. Additionally, studies are exploring the use of tumor-agnostic agents in neoadjuvant and first-line settings, potentially expanding their clinical utility beyond the current focus on advanced and refractory diseases [104].
Implementation challenges remain significant, particularly regarding equitable access to comprehensive molecular testing and targeted therapies. Real-world evidence reveals substantial gaps in adoption, with only approximately one-third of patients with rare NTRK fusions receiving FDA-approved targeted treatments [105]. This underscores the need for improved biomarker testing access, provider education, and removal of financial barriers to ensure eligible patients receive appropriate tumor-agnostic therapies.
The integration of liquid biopsy technologies offers promising solutions to several implementation challenges by enabling less invasive molecular profiling and monitoring. However, standardization of testing methodologies, interpretation criteria, and reimbursement policies will be essential for widespread adoption [106] [28]. As the field advances, continued collaboration between researchers, clinicians, diagnostic developers, and regulators will be crucial for realizing the full potential of tumor-agnostic therapies across the spectrum of cancer care.
The validation of the tumor-agnostic principle across cancer types represents a fundamental evolution in oncology, shifting the focus from anatomical classification to molecular drivers of disease. While challenges remain in implementation and optimizing clinical benefit across diverse cancer types, the continued integration of advanced diagnostic approaches like liquid biopsy with targeted therapeutic strategies promises to further personalize cancer treatment and improve outcomes for patients across the molecular spectrum of cancer.
Liquid biopsy has emerged as a transformative technology in oncology, providing a non-invasive means to access tumor-derived molecular information through blood samples. This whitepaper examines the current regulatory framework established by the U.S. Food and Drug Administration (FDA) for liquid biopsy assays, with particular focus on companion diagnostic (CDx) indications that guide targeted therapy selection. The adoption of comprehensive liquid biopsy panels represents a paradigm shift in cancer management, enabling real-time genomic profiling to inform treatment decisions across multiple cancer types [107]. These assays analyze circulating tumor DNA (ctDNA) and other blood-based biomarkers to identify targetable genomic alterations, overcoming limitations of traditional tissue biopsies including invasiveness, tissue availability, and tumor heterogeneity [108] [1]. The regulatory landscape for these tests continues to evolve rapidly, with the FDA granting increasing numbers of CDx indications that allow clinicians to match patients with effective targeted therapies based on blood-based genomic profiling.
FDA-Approved Liquid Biopsy Platforms
The FDA has approved several comprehensive liquid biopsy platforms that profile multiple cancer-related genes from a simple blood draw. Two leading platforms—Guardant360 CDx and FoundationOne Liquid CDx—have received the most extensive CDx indications and market authorization [107]. These tests utilize next-generation sequencing (NGS) technologies to detect guideline-recommended genomic alterations in ctDNA, providing clinicians with critical information for therapeutic decision-making.
Table 1: FDA-Approved Comprehensive Liquid Biopsy Platforms
| Test Name | Manufacturer | Genes Analyzed | Key Biomarkers | Approval Date |
|---|---|---|---|---|
| FoundationOne Liquid CDx | Foundation Medicine | 300+ genes | MSI-H, bTMB, fusions, SNVs, indels | Initial approval August 26, 2020 [107] |
| Guardant360 CDx | Guardant Health | 60+ genes | SNVs, indels, fusions, CNVs | Initial approval August 7, 2020 [107] |
Both platforms have demonstrated high concordance with tissue-based testing, particularly when ctDNA tumor fraction is sufficient (>1%) [109]. The analytical validation of these tests has enabled their use as companion diagnostics for multiple targeted therapies across cancer types, providing a minimally invasive alternative to tissue biopsy for genomic profiling [107].
Companion Diagnostic Indications
FDA-approved liquid biopsy tests now carry numerous companion diagnostic indications that directly link specific genomic findings to approved targeted therapies. These indications provide clinicians with validated biomarker-therapy pairs to guide treatment selection.
FoundationOne Liquid CDx Indications
FoundationOne Liquid CDx holds the most extensive list of CDx indications, with approvals spanning multiple cancer types and therapeutic agents [109].
Table 2: Select FDA-Approved Companion Diagnostic Indications for FoundationOne Liquid CDx
| Cancer Type | Biomarker(s) | Therapy | Therapeutic Class |
|---|---|---|---|
| Non-Small Cell Lung Cancer (NSCLC) | ALK rearrangements | Alectinib (Alecensa) | ALK inhibitor [109] |
| NSCLC | EGFR exon 19 deletions, L858R | Osimertinib (Tagrisso), Gefitinib, Erlotinib | EGFR inhibitors [107] |
| NSCLC | ROS1 fusions | Entrectinib (Rozlytrek) | ROS1 inhibitor [109] |
| NSCLC | MET exon 14 skipping | Capmatinib (Tabrecta), Tepotinib (Tepmetko) | MET inhibitors [109] |
| Prostate Cancer | BRCA1, BRCA2 alterations | Rucaparib (Rubraca) | PARP inhibitor [107] |
| Prostate Cancer | BRCA1, BRCA2, ATM alterations | Olaparib (Lynparza) | PARP inhibitor [110] |
| Ovarian Cancer | BRCA1, BRCA2 alterations | Rucaparib (Rubraca) | PARP inhibitor [110] |
| Breast Cancer | PIK3CA mutations | Alpelisib (Piqray) | PI3K inhibitor [110] |
| Colorectal Cancer | BRAF V600E | Encorafenib (Braftovi) + Cetuximab | BRAF inhibitor + EGFR inhibitor [109] |
Guardant360 CDx Indications
Guardant360 CDx has secured six companion diagnostic indications, with recent expansions into breast cancer biomarkers [111].
Table 3: FDA-Approved Companion Diagnostic Indications for Guardant360 CDx
| Cancer Type | Biomarker(s) | Therapy | Indication Date |
|---|---|---|---|
| NSCLC | EGFR exon 19 deletions, L858R, T790M | Osimertinib (Tagrisso) | Initial approval [107] |
| NSCLC | EGFR exon 20 insertions | Amivantamab (Rybrevant) | 2021 [111] |
| NSCLC | ERBB2 (HER2) activating mutations | Fam-trastuzumab deruxtecan (Enhertu) | 2022 [111] |
| NSCLC | KRAS G12C mutations | Sotorasib (Lumakras) | 2021 [111] |
| Breast Cancer | ESR1 mutations (codons 310-547) | Elacestrant (Orserdu) | 2023 [111] |
| Breast Cancer | ESR1 mutations (E380, V422del, S463, L469, L536, Y537, D538) | Imlunestrant (Inluriyo) | September 2025 [111] |
The September 2025 approval of Guardant360 CDx as a CDx for imlunestrant in ESR1-mutated advanced breast cancer represents the most recent expansion of liquid biopsy CDx indications [111]. This approval was based on the phase III EMBER-3 trial, which demonstrated a 38% reduction in disease progression risk compared to fulvestrant or exemestane in patients with ER-positive, HER2-negative advanced breast cancer [111].
Technical Methodologies and Experimental Protocols
Sample Collection and Processing
Liquid biopsy testing requires standardized pre-analytical procedures to ensure reliable results. The recommended protocol involves:
- Blood Collection: Two 8.5-10mL blood draws into cell-free DNA collection tubes (e.g., Streck Cell-Free DNA BCT or PAXgene Blood cDNA tubes) [109]. These tubes contain preservatives that prevent white blood cell lysis and genomic DNA contamination.
- Sample Transport: Stable at room temperature for up to 96 hours post-collection, enabling shipment to centralized testing facilities.
- Plasma Separation: Two-step centrifugation protocol (first at 1600-3000×g for 10-20 minutes, then at 16,000×g for 10 minutes) to separate plasma from cellular components [108].
- Cell-Free DNA Extraction: Isolation using silica membrane-based columns or magnetic beads, typically yielding 10-30ng/mL of cell-free DNA from plasma [108].
Library Preparation and Sequencing
The core analytical workflow involves converting ctDNA into sequence-ready libraries:
Liquid Biopsy NGS Workflow
- Library Construction: Cell-free DNA undergoes end repair, A-tailing, and adapter ligation using unique molecular identifiers (UMIs) to label original DNA molecules, enabling error correction during bioinformatic analysis [109].
- Target Enrichment: Hybrid capture-based enrichment using biotinylated probes targeting cancer-related genes (300+ genes for FoundationOne Liquid CDx, 60+ genes for Guardant360 CDx) [109] [107].
- Sequencing: Next-generation sequencing on Illumina platforms with average coverage of 10,000-30,000× to detect low-frequency variants (down to 0.1% variant allele frequency) [108].
Bioinformatic Analysis and Interpretation
The bioinformatic pipeline involves multiple specialized steps:
- Sequence Alignment: Mapping reads to reference genome (GRCh37/hg19) using optimized aligners like BWA-MEM.
- Variant Calling: Specialized algorithms for different alteration types:
- Single nucleotide variants (SNVs) and small insertions/deletions (indels): MuTect2, VarScan2
- Copy number alterations (CNAs): Depth of coverage-based algorithms with correction for GC bias
- Gene fusions: Split-read and discordant read pair analysis
- Tumor Fraction Estimation: Computational estimation of ctDNA fraction using aneuploidy, variant allele frequency, fragment length patterns, and clonal hematopoiesis predictions [109].
- Clinical Interpretation: Annotation of variants according to established guidelines (OncoKB, AMP/ASCO/CAP) and matching to therapies with approved indications or clinical trial eligibility.
Critical Analytical Parameters
ctDNA Tumor Fraction and Assay Sensitivity
The analytical sensitivity of liquid biopsy tests is critically dependent on ctDNA tumor fraction, which represents the proportion of cell-free DNA derived from tumor cells [109].
Impact of ctDNA Tumor Fraction
When FoundationOne Liquid CDx results are negative and ctDNA tumor fraction is low, reflexing to tissue testing with FoundationOne CDx identifies previously unrecognized actionable alterations in 52% of patient samples [109]. In contrast, when ctDNA tumor fraction is high (>1%), reflex testing finds no additional actionable alterations, demonstrating the importance of this parameter in test interpretation [109].
Concordance with Tissue Biopsy
Multiple studies have demonstrated high positive percent agreement (PPA) between liquid and tissue biopsy when ctDNA tumor fraction is sufficient:
- NSCLC: ~100% concordance for driver mutations when ctDNA tumor fraction >1% [109]
- Prostate Cancer: 94% PPA for BRCA1/2 alterations when ctDNA tumor fraction >1% [109]
- Breast Cancer: 98% PPA for ESR1 mutations when ctDNA tumor fraction >1% [109]
- Colorectal Cancer: 96% PPA for guideline-recommended biomarkers when ctDNA tumor fraction >1% [109]
The Scientist's Toolkit: Essential Research Reagents
Table 4: Essential Research Reagents for Liquid Biopsy Development
| Reagent/Category | Function | Examples/Formats |
|---|---|---|
| Cell-Free DNA Collection Tubes | Blood collection and stabilization of nucleated cells | Streck Cell-Free DNA BCT, PAXgene Blood cDNA tubes [109] |
| Nucleic Acid Extraction Kits | Isolation of cell-free DNA from plasma | QIAamp Circulating Nucleic Acid Kit, MagMAX Cell-Free DNA Isolation Kit [108] |
| Library Preparation Kits | Conversion of cell-free DNA to sequencing libraries | KAPA HyperPrep, Illumina DNA Prep with unique dual indices [109] |
| Hybrid Capture Panels | Target enrichment of cancer-related genes | Integrated DNA Technologies xGen Pan-Cancer Panel, Twist Human Core Exome [109] |
| Sequencing Platforms | High-throughput DNA sequencing | Illumina NovaSeq 6000, NextSeq 550Dx [109] |
| Bioinformatics Tools | Variant calling, annotation, and interpretation | BWA-MEM, MuTect2, VarScan2, OncoKB [109] |
Future Directions and Regulatory Trends
The regulatory landscape for liquid biopsy continues to evolve rapidly, with several emerging trends:
- Expansion into Additional Cancer Types: Recent approvals include new indications in breast cancer (ESR1 mutations) and additional NSCLC biomarkers [111].
- Minimal Residual Disease (MRD) Detection: Emerging applications for detecting molecular residual disease after curative-intent therapy [27].
- Multi-Cancer Early Detection: Development of tests for detecting multiple cancer types simultaneously in asymptomatic individuals [27].
- Standardization of ctDNA Tumor Fraction Reporting: Increasing recognition of the importance of quantitative ctDNA measurement for test interpretation [109].
- Complementary Diagnostic Approvals: Regulatory pathways for tests that identify patients likely to benefit from treatments without being strictly linked to specific drugs [107].
The FDA's Breakthrough Device designation program has accelerated the development and regulatory review of novel liquid biopsy technologies, facilitating their integration into clinical practice [110]. As evidence accumulates regarding the clinical utility of liquid biopsy, these tests are increasingly being incorporated into professional guidelines and standard care pathways across multiple cancer types.
The management of cancer is increasingly shifting toward the preemptive detection of minimal residual disease (MRD), the small population of cancer cells that persists after treatment and can lead to relapse. Circulating tumor DNA (ctDNA) analysis has emerged as a powerful, non-invasive liquid biopsy tool for MRD detection, offering a real-time reflection of tumor burden that is transforming oncology research and drug development [112] [113]. The central technological divide in ctDNA-based MRD detection lies between tumor-informed and tumor-naïve (also known as tumor-agnostic) approaches [114] [112]. The tumor-informed approach requires high-quality tumor tissue to identify patient-specific mutations for creating a bespoke assay, while the tumor-naïve approach uses fixed panels of cancer-associated genomic or epigenomic features without prior knowledge of the tumor's genetics [112]. This guide provides an in-depth technical comparison of these two paradigms, detailing their methodologies, performance metrics, and applications within modern oncology research.
Core Technological Paradigms
Tumor-Informed Assays: The Bespoke Approach
Tumor-informed assays represent a highly personalized strategy. This process begins with the genomic profiling of a patient's tumor tissue, typically via whole-exome sequencing (WES) or large next-generation sequencing (NGS) panels, to identify clonal, tumor-specific mutations [112]. A custom assay is then designed to track these specific mutations in the patient's plasma over time.
Key platforms utilizing this approach include Signatera (Natera), RaDaR (Inivata/NeoGenomics), and ArcherDX PCM (Invitae), which employ amplicon-based targeted NGS. Newer, more sensitive platforms like MRDetect (Veracyte), C2-Intelligence (C2i Genomics), and NeXT Personal (Personalis) leverage whole-genome sequencing (WGS) to broaden genomic coverage, tracking over 1000 variants and using advanced computational methods to achieve a limit of detection (LoD) as low as 0.0001% tumor fraction [112]. A notable innovation is the hybrid-approach of CancerDetect, which combines bespoke mutations with tumor-agnostic, clinically actionable hotspot targets. This assay has been analytically validated to achieve an LoD of 0.001% (10⁻⁵) with 99.9% specificity [115].
The major strength of this approach is its high sensitivity and specificity, as it focuses on a set of mutations known to be present in the patient's tumor, effectively minimizing false positives from clonal hematopoiesis of indeterminate potential (CHIP) [112] [113]. Its primary limitations are the prerequisite for high-quality tumor tissue, longer turnaround times due to the custom assay design, and the potential inability to capture newly emergent, therapy-resistant clones not present in the original tumor sample [114] [112].
Tumor-Naïve Assays: The Universal Approach
Tumor-naïve assays forego the need for tumor tissue sequencing. Instead, they utilize predefined panels designed to detect recurrent cancer-associated features in plasma cfDNA. These panels can target genomic alterations, such as hotspot mutations in driver genes, or epigenomic patterns like DNA methylation [112]. To overcome the lower inherent sensitivity of a fixed panel, advanced tumor-naïve assays often integrate multiple genomic features—or "multi-omics"—such as mutation detection, copy number alteration (CNA) analysis, and fragmentomics (the study of cfDNA fragmentation patterns) [114] [116].
Prominent tumor-naïve platforms include InVisionFirst-Lung (Inivata) and Guardant Reveal (Guardant Health) [112]. A recent study validated a multimodal tumor-naïve assay that integrates mutation detection (using both amplicon and hybridization capture sequencing), CNA analysis, and fragmentomics (fragment length and end-motif signatures) derived from shallow whole-genome sequencing (sWGS) [114] [116]. This integration of multiple features was shown to increase ctDNA detection sensitivity by more than 10% in metastatic cancers [116].
The principal advantages of the tumor-naïve approach are its operational efficiency, faster turnaround time, and independence from often-limited tumor tissue resources [114] [116]. Its main drawback is a generally lower sensitivity compared to tumor-informed assays, particularly in early-stage disease where ctDNA levels can be exceptionally low. The broader genomic coverage also increases the risk of false positives from CHIP, necessitating the sequencing of white blood cell (WBC) DNA to filter out these confounding signals [114] [112].
The following diagram illustrates the core workflows and decision points for both approaches.
Methodologies and Experimental Protocols
Detailed Protocol for Tumor-Naïve Multimodal Assay
A validated protocol for a tumor-naïve multimodal assay, as described by Tu et al., involves a multi-omic approach to maximize sensitivity without prior tumor tissue information [114] [116].
Step 1: Sample Preparation and Library Construction
- Blood samples are collected in cell-stabilizing tubes (e.g., Streck) and centrifuged to isolate plasma. Cell-free DNA (cfDNA) is extracted from plasma using a commercial kit (e.g., Maxwell RSC ccfDNA Plasma Kit).
- cfDNA libraries are prepared using a kit designed for low-input cfDNA (e.g., xGen cfDNA Library Prep v2), with barcoding using Unique Molecular Identifiers (UMIs) to correct for sequencing errors and PCR duplicates.
Step 2: Parallel Mutation Detection
- Hybridization Capture: Libraries are pooled and hybridized with custom probes targeting a panel of 22 cancer-associated genes. Sequencing is performed at an average depth of 500x.
- Multiplex PCR (mPCR): In a separate reaction, cfDNA is amplified using primers targeting approximately 500 known hotspot mutations. This is followed by ultra-deep amplicon sequencing at an average depth of 100,000x to detect very low-VAF variants.
- The combination of both methods provides broader variant coverage and higher sensitivity than either method alone [114].
Step 3: Analysis of Non-Mutation Features via sWGS
- A portion of the prepared cfDNA libraries is subjected to shallow whole-genome sequencing (sWGS) at a low depth (e.g., 0.5x).
- Copy Number Alteration (CNA): sWGS data is analyzed using tools like ichorCNA to estimate tumor fraction from genome-wide copy-number profiles.
- Fragmentomics: The BAM files from sWGS are processed to extract two key features:
- Fragment Length (FLEN): Fragment lengths (50-350 bp) are extracted to construct a 301-dimensional feature vector, which is then transformed into an NMF_FLEN score using non-negative matrix factorization.
- End-Motif (EM) Signatures: The frequency of 4bp sequences at the ends of cfDNA fragments is calculated. The total absolute difference between the motif frequency of a cancer sample and the average frequency in non-cancer controls is computed as an EM score.
Step 4: Data Integration and CHIP Filtering
- Variant calling is performed on data from both mutation detection workflows. Any variant detected in cfDNA is cross-referenced against a sequencing assay of matched white blood cell (WBC) gDNA (sequenced at 10,000x).
- Variants with a variant allele frequency (VAF) between 0.1% and 10% in WBC are flagged as CHIP and excluded from the ctDNA call [114] [116].
- A final tumor fraction is determined: if mutations are detected, it is the mean VAF of all positive mutations; if mutations are absent, it is the higher value between the CNA-derived tumor fraction or the converted NMF_FLEN signal.
Detailed Protocol for an Ultra-Sensitive Tumor-Informed Assay
The CancerDetect assay exemplifies a modern, ultra-sensitive tumor-informed approach that uses a large-scale mutation profiling strategy [115].
Step 1: Tumor and Normal Sequencing for Variant Discovery
- DNA from formalin-fixed paraffin-embedded (FFPE) tumor tissue and matched WBCs (as a germline control) is sequenced via WES or a large NGS panel.
- Somatic variants are identified by comparing tumor and normal sequences. Hundreds to thousands of these clonal, tumor-specific single nucleotide variants (SNVs) are selected for the bespoke plasma assay.
Step 2: Bespoke Panel Design and Manufacturing
- A custom biotinylated probe panel (e.g., using Twist Bioscience's platform) is synthesized to target the selected patient-specific SNVs. The panel also often includes a set of clinically actionable hotspot mutations for a hybrid tumor-informed/agnostic approach.
Step 3: Plasma Analysis and Ultra-Deep Sequencing
- cfDNA is extracted from patient plasma and converted into sequencing libraries with UMIs.
- Libraries are hybridized with the custom bespoke panel for target enrichment.
- The captured libraries are sequenced on a high-throughput platform (e.g., Illumina NovaSeq 6000) to achieve an ultra-deep average on-target coverage of 100,000x. This extreme depth is critical for detecting ctDNA fragments present at frequencies as low as 0.001%.
Step 4: Data Analysis and MRD Calling
- Sequencing data is processed using a bioinformatics pipeline: FASTQ files are trimmed, UMIs are extracted and used to generate consensus reads, and reads are aligned to the reference genome (hg38).
- The pipeline then identifies and quantifies the patient-specific mutations in the plasma. The presence of a defined number of these mutations above a statistically determined background error rate leads to an MRD-positive call. The high number of tracked mutations compensates for the fact that any single mutation may be present at an extremely low VAF, allowing the aggregate signal to confirm the presence of ctDNA.
Performance Comparison and Clinical Validation
Analytical and Clinical Performance Metrics
The performance of tumor-informed and tumor-naïve assays has been systematically evaluated in recent studies. The table below summarizes key quantitative findings for a direct comparison.
Table 1: Analytical and Clinical Performance of Tumor-Informed vs. Tumor-Naïve MRD Assays
| Performance Metric | Tumor-Informed Assay (CancerDetect) | Tumor-Naïve Multimodal Assay |
|---|---|---|
| Limit of Detection (LoD) | 0.001% (10⁻⁵) tumor fraction [115] | Not explicitly stated; relies on composite features. |
| Specificity | 99.9% (analytical validation) [115] | 98.8% (Breast Cancer), 100% (Colorectal Cancer) [114] [116] |
| Sensitivity for Recurrence (Breast Cancer) | N/A (Contextually higher) | 54.5% [114] [116] |
| Sensitivity for Recurrence (Colorectal Cancer) | N/A (Contextually higher) | 80.0% [114] [116] |
| Hazard Ratio (HR) for Recurrence | N/A | HR=23.3 (Breast Cancer), HR=35.6 (Colorectal Cancer) [114] |
| Key Strengths | Ultra-high sensitivity, low false-positive rate [115] [112] | Operational efficiency, tissue independence, real-time tumor evolution monitoring [114] [116] |
Contextual Performance and Application Gaps
The data in Table 1 highlights a clear performance gap, which is highly dependent on cancer type and stage. The tumor-naïve assay showed markedly higher sensitivity in colorectal cancer (80.0%) than in breast cancer (54.5%), underscoring that its performance is better in "high ctDNA-shedding" cancers and at metastatic stages [114]. The addition of CNA and fragmentomics features significantly boosted sensitivity in metastatic cancers but provided only a modest improvement in early-stage disease, where ctDNA levels are minimal [114].
In a direct comparison using identical samples, the overall accuracy of the tumor-naïve method was lower than that of the tumor-informed method [114]. This supports the clinical perspective that "tumor-informed assays are more sensitive than tumor-agnostic assays, especially in the early-stage setting," where the amount of MRD is very low [113]. For contexts where de-escalation of therapy is the goal, ultra-sensitive tumor-informed assays are preferred, whereas for treatment escalation or in metastatic settings, a less sensitive assay might be sufficient [113].
Essential Research Reagents and Tools
The development and execution of advanced MRD assays rely on a suite of specialized reagents and computational tools. The following table catalogues key solutions used in the protocols cited in this guide.
Table 2: Research Reagent Solutions for MRD Assay Development
| Reagent / Tool | Function / Application | Example Use Case |
|---|---|---|
| xGen cfDNA Library Prep Kit | Preparation of sequencing libraries from low-input, fragmented cfDNA. | Used in tumor-naïve protocol for initial NGS library construction [114]. |
| Custom Hybridization Capture Probes | Enrichment of specific genomic regions (e.g., gene panels, bespoke mutations) from sequencing libraries. | Used in both approaches: fixed 22-gene panel (tumor-naïve) and patient-specific panels (tumor-informed) [114] [115]. |
| Unique Molecular Identifiers (UMIs) | Molecular barcoding of individual DNA molecules to correct for sequencing errors and PCR duplicates. | Essential for both tumor-informed and tumor-naïve assays to achieve high specificity at low VAF [114] [115]. |
| ichorCNA Software | Computational tool to estimate tumor fraction from low-coverage whole-genome sequencing data by detecting copy number alterations. | Used in tumor-naïve workflow to derive a non-mutation-based tumor fraction from sWGS data [114]. |
| Maxwell RSC ccfDNA Plasma Kit | Automated, column-based extraction of cell-free DNA from plasma samples. | Used for the extraction of cfDNA from blood plasma in referenced studies [115] [116]. |
| Seraseq ctDNA MRD Reference Material | Commercially available, synthetic reference material with defined mutations at specific VAFs. | Used for analytical validation and determining the limit of detection (LoD) of MRD assays [115]. |
The choice between tumor-informed and tumor-naïve MRD assays is not a matter of declaring a universal winner but of matching the technology to the research or clinical objective. The tumor-informed approach remains the gold standard for sensitivity, making it the preferred tool for studies requiring the utmost detection power, such as therapy de-escalation trials in early-stage cancer [112] [113]. The tumor-naïve approach, particularly with multi-omic enhancements, offers a practical, efficient, and tissue-independent alternative that demonstrates robust performance, especially in high-shedding cancers and for monitoring metastatic disease [114] [116].
The future of MRD detection is likely to see a convergence of these strategies and further refinement of existing technologies. Key trends include the expansion of large-scale mutation profiling in tumor-informed assays to push sensitivity below 0.001% [115] [112], the integration of artificial intelligence to better interpret complex multi-omic data from tumor-naïve tests [117] [116], and a strong focus on validating these assays in large, prospective clinical trials across diverse populations and cancer types to firmly establish their clinical utility and drive global adoption [114] [113]. As these technologies mature, they will undoubtedly become integral components of personalized oncology, enabling earlier intervention and more dynamic management of cancer treatment.
Liquid biopsy has solidified its role as a transformative technology in oncology research and clinical practice. By enabling the detection and analysis of circulating tumor DNA (ctDNA) and other biomarkers from a simple blood draw, it provides a minimally invasive window into tumor dynamics. The field is currently experiencing rapid evolution, driven by strategic partnerships, novel product launches, and compelling clinical trial data. These developments are expanding applications from late-stage cancer management into minimal residual disease (MRD) detection, therapy selection, and multi-cancer early detection, fundamentally reshaping the landscape of cancer research and drug development [118] [119] [28].
This technical guide synthesizes the most significant recent advancements in the liquid biopsy arena, providing researchers and drug development professionals with a comprehensive overview of the collaborative frameworks, technological innovations, and clinical evidence that are defining the current state of the field and informing its future trajectory.
Key Industry Partnerships
Strategic alliances between diagnostic companies, pharmaceutical firms, and research institutions are accelerating the development and global availability of advanced liquid biopsy technologies. These partnerships are crucial for combining specialized expertise, expanding market reach, and advancing regulatory approvals.
Table 1: Selected Strategic Partnerships in the Liquid Biopsy Industry (2024-2025)
| Companies/Institutions | Partnership Focus | Key Outcomes & Objectives |
|---|---|---|
| Guardant Health & Quest Diagnostics [27] | Broaden access to Shield blood-based colorectal cancer (CRC) screening test | Make test available through Quest's network & EHR; expected availability early 2026 |
| Myriad Genetics & SOPHiA GENETICS [27] | Develop global liquid biopsy companion diagnostic (CDx) tests | Leverage Myriad's US lab & SOPHiA's international network; initial focus: MSK-ACCESS with SOPHiA DDM |
| A.D.A.M. Innovations & SOPHiA GENETICS [120] | Advance liquid biopsy testing & CDx in Japan | Launch MSK-ACCESS powered with SOPHiA DDM locally; develop CDx for Japanese market; faster turnaround, lower cost |
| Guardant Health & PathGroup [27] | Expand reach of Guardant Shield blood test | Bring Shield test to 250+ hospitals & health systems across 25 US states |
| Exact Sciences & Quest Diagnostics [27] | Nationwide blood collection for Cancerguard | Provide phlebotomy access for Exact's multi-cancer early detection test |
These collaborations highlight several strategic priorities within the industry. A dominant theme is improving patient and physician access to established blood-based tests by leveraging large laboratory networks, particularly for cancer screening applications [27]. Furthermore, partnerships are increasingly focused on global companion diagnostic development, aiming to create standardized testing protocols that support pharmaceutical development and personalized treatment strategies across international markets [27] [120]. Such collaborations often combine US-based laboratory capabilities with international testing networks and regulatory expertise to navigate diverse approval pathways.
Recent Product Launches & Portfolio Expansions
The liquid biopsy market has seen a wave of new product launches and significant portfolio expansions from key players, reflecting a trend toward more comprehensive genomic profiling and novel application areas.
Table 2: Notable Liquid Biopsy Product Launches and Expansions (2024-2025)
| Company | Product / Platform | Technology & Key Features | Intended Use / Application |
|---|---|---|---|
| Exact Sciences [27] | Cancerguard | Multi-cancer early detection (MCED) test; analyzes multiple biomarker classes | Laboratory-developed test (LDT) detecting >50 cancer (sub)types |
| Foundation Medicine [27] [121] | Tissue-informed WGS MRD test (FlexOMx Lab) | Whole genome sequencing for MRD detection | Research use only (RUO); feasibility study detected ctDNA down to 10 parts per million (ppm) |
| Foundation Medicine [121] | FoundationOneRNA | Tissue-based RNA sequencing test | Detects cancer-related gene fusions & rearrangements; complements FoundationOne CDx |
| Florida Cancer Specialists & Research Institute (FCS) [122] | Liquid Biopsy NGS Profile | In-house liquid biopsy using Illumina NovaSeq | Focuses on genetic changes in solid tumors (e.g., lung, colorectal); not for hematologic malignancies |
| Haystack Oncology (Quest Dx) [123] | Haystack MRD | Tumor-informed, next-generation sequencing | Detects ultralow levels of ctDNA for MRD assessment; available as LDT |
Several key technological trends are evident from these launches. There is a marked emphasis on enhancing minimal residual disease (MRD) detection, with new assays achieving exceptional sensitivity down to 10 parts per million, enabling the identification of microscopic disease levels previously undetectable [27]. The launch of Cancerguard signifies continued progress in the complex area of multi-cancer early detection (MCED), aiming to detect dozens of cancer types from a single blood sample [27]. Furthermore, the introduction of FoundationOneRNA highlights a growing recognition of the importance of RNA-level analysis, particularly for detecting gene fusions and rearrangements that may be missed by DNA-only tests, thereby providing a more complete genomic profile for both research and clinical applications [121].
Diagram 1: Core Liquid Biopsy NGS Workflow. The process begins with blood collection and plasma processing, followed by cell-free DNA (cfDNA) extraction. After library preparation and sequencing, sophisticated bioinformatic algorithms analyze the data to distinguish tumor-derived variants from background noise, culminating in a clinical or research report. This foundational workflow underpins most modern liquid biopsy applications, from MRD detection to therapy selection.
Clinical Trial Highlights and Study Results
Recent clinical trials and studies have generated compelling evidence supporting the utility of liquid biopsy across a spectrum of applications, including therapy guidance, MRD detection, and predicting treatment outcomes.
ctDNA-Guided Immunotherapy and MRD Detection
A landmark phase II study presented at the AACR Annual Meeting 2025 investigated ctDNA-guided adjuvant immunotherapy in patients with early-stage, DNA mismatch repair-deficient (dMMR) solid cancers [28]. Patients with detectable ctDNA at 6-10 weeks post-surgery received pembrolizumab. The results were striking: 86.4% (11/13) of ctDNA-positive patients who received pembrolizumab cleared their disease and remained recurrence-free at the two-year mark. This compared to 66.7% (4/6) in a comparator group of ctDNA-positive patients who did not receive the drug and 98% (149/152) of ctDNA-negative patients [28]. This study demonstrates that ctDNA can be used not just as a predictive biomarker, but as a dynamic compass for directing timely interventions to prevent relapse.
The VICTORI study, focused on colorectal cancer, showcased the power of ultrasensitive MRD testing. Using the tumor-informed NeXT Personal assay, which tracks up to 1,800 patient-specific variants, researchers detected ctDNA at sensitivities as low as two parts per million [28]. Critically, the test identified all post-surgical recurrences before they were visible on imaging, with half of these recurrences detected at least six months earlier. In some cases, ctDNA signaled relapse over a year before radiographic evidence [28]. This provides a critical window for early therapeutic intervention.
Predicting Outcomes in Lung and Other Cancers
Data from the phase 3 AEGEAN trial in resectable non-small cell lung cancer (NSCLC) showed that clearance of ctDNA during neoadjuvant treatment (durvalumab + chemotherapy) was associated with improved pathological response and event-free survival (EFS) [118]. Furthermore, findings from the Phase 3 NeoADAURA trial demonstrated that Personalis's NeXT Personal MRD test was a strong predictor of outcomes in patients with stage II-IIIb, EGFR-mutated NSCLC receiving neoadjuvant therapy [27].
A prospective, head-to-head validation study published for BillionToOne's Northstar Select liquid biopsy comprehensive genomic profiling (CGP) assay demonstrated its superior performance against six other commercially available assays. Northstar Select detected 51% more pathogenic single nucleotide variants (SNVs) and indels and 109% more copy number variants (CNVs) than its competitors, while also yielding 45% fewer null reports [27].
Fragmentomics and Novel Analytical Approaches
Moving beyond the search for specific mutations, research into "fragmentomics" – the analysis of the size, structure, and distribution of cfDNA fragments – shows significant promise. Work presented by Valsamo Anagnostou, MD, PhD, of Johns Hopkins Medicine revealed that fragmentomic patterns were correlated with outcomes in lung cancer patients treated with immunotherapy [28]. A key advantage of this approach is its clinical feasibility, as it requires only minimal amounts of cfDNA (as low as one nanogram in a few milliliters of plasma) and is not dependent on identifying tumor-specific mutations, making it potentially applicable across a wide range of cancer types [28].
Experimental Protocols & Research Toolkit
For researchers designing studies involving liquid biopsy, understanding the detailed methodologies and essential reagents is critical for generating robust, reproducible data.
Detailed Methodology for Tumor-Informed MRD Detection
The following protocol outlines the core steps for a tumor-informed MRD assay, as utilized in recent clinical studies [123] [28]:
Tissue and Blood Sample Collection:
- Tumor Tissue: Acquire fresh-frozen or formalin-fixed paraffin-embedded (FFPE) tumor tissue specimen during surgical resection or diagnostic biopsy.
- Matched Normal Tissue/Blood: Collect a matched normal sample (e.g., peripheral blood mononuclear cells - PBMCs, or buccal swab) to distinguish somatic tumor mutations from germline variants and clonal hematopoiesis.
- Peripheral Blood for Liquid Biopsy: Collect venous blood (typically 2-4 tubes of 8-10 mL each) in cell-stabilizing blood collection tubes (e.g., Streck Cell-Free DNA BCT or PAXgene Blood ccfDNA Tubes). Invert gently 10 times and store at room temperature until processing (ideally within 48-96 hours, per manufacturer's specifications).
Plasma Processing and cfDNA Extraction:
- Centrifuge blood tubes twice: first at 1,600-2,000 x g for 10-20 minutes to separate plasma from cells, followed by a high-speed centrifugation of the plasma at 16,000 x g for 10 minutes to remove residual cells and debris.
- Extract cfDNA from the clarified plasma using commercially available silica-membrane or magnetic bead-based kits (e.g., QIAamp Circulating Nucleic Acid Kit, MagMax Cell-Free DNA Isolation Kit). Precisely quantify the yield using fluorescent assays (e.g., Qubit dsDNA HS Assay).
Next-Generation Sequencing (NGS) Library Preparation:
- For Tumor and Normal DNA: Construct sequencing libraries from tumor and matched normal gDNA. This involves DNA fragmentation (if needed), end-repair, A-tailing, and adapter ligation.
- For Plasma cfDNA: Construct libraries from the extracted cfDNA, which is naturally fragmented. This typically involves end-repair and adapter ligation, often leveraging specialized kits designed for low-input and degraded DNA.
- Perform target capture or amplification. For tumor-informed MRD assays, whole-exome sequencing (WES) or a large, custom pan-cancer gene panel (e.g., 1,800+ variants) is typically used on the tumor-normal pair to identify patient-specific somatic mutations.
Sequencing and Bioinformatics Analysis:
- Sequence the prepared libraries on a high-throughput sequencer (e.g., Illumina NovaSeq 6000). For MRD detection, sequence plasma cfDNA libraries to a very high depth (often >100,000x coverage) to enable the detection of ultrarare variants.
- Bioinformatic Processing:
- Primary Analysis: Perform base calling, demultiplexing, and quality control (e.g., using FastQC).
- Secondary Analysis: Align sequencing reads to a reference genome (e.g., hg38) using optimized aligners (e.g., BWA-MEM). For tumor-informed assays, create a personalized panel of 16-50+ somatic variants (e.g., SNVs, indels) identified from the tumor WES/panel sequencing for each individual patient.
- Tertiary Analysis: Apply ultra-sensitive variant callers (e.g., based on unique molecular identifiers - UMIs) to track the patient-specific mutations in the plasma cfDNA. Use statistical models to distinguish true ctDNA signals from sequencing errors and define a patient-specific MRD status (positive/negative).
Diagram 2: Key ctDNA Biomarkers and Associated Therapies. This diagram illustrates the logical relationship between specific genomic alterations detectable in ctDNA and the targeted therapies or immunotherapies they can inform. For instance, ESR1 mutations detected in blood are now validated companion diagnostic biomarkers for specific endocrine therapies in breast cancer [27] [48].
Table 3: The Scientist's Toolkit: Essential Research Reagent Solutions for Liquid Biopsy
| Research Reagent / Material | Function & Application in Liquid Biopsy |
|---|---|
| Cell-Free DNA Blood Collection Tubes (e.g., Streck, PAXgene) | Preserves blood sample integrity by stabilizing nucleated cells and preventing lysis, which could contaminate the cfDNA background with genomic DNA. Critical for pre-analytical standardization. |
| cfDNA Extraction Kits (e.g., QIAamp CNA, MagMax ccfDNA) | Silica-membrane or magnetic bead-based isolation of high-purity, short-fragment cfDNA from plasma, separate from high-molecular-weight genomic DNA. |
| Library Preparation Kits for Low-Input DNA | Facilitates NGS library construction from low-concentration, fragmented cfDNA samples. Often incorporates Unique Molecular Identifiers (UMIs) to tag original molecules and correct for PCR and sequencing errors. |
| Hybridization Capture Panels (e.g., Illumina, IDT) | Biotinylated oligonucleotide probes designed to capture and enrich specific genomic regions of interest (e.g., cancer gene panels, whole exome) from complex NGS libraries prior to sequencing. |
| NGS Sequencing Flow Cells & Reagents (e.g., Illumina) | Consumables for the sequencing instrument that enable massive parallel sequencing. Ultra-deep sequencing (>100,000x coverage) is often required for MRD applications. |
The liquid biopsy landscape is characterized by dynamic growth and innovation, as evidenced by the strategic partnerships, product launches, and clinical trial data summarized in this guide. The field is moving decisively beyond single-gene mutation testing toward highly sensitive, multi-modal applications that include MRD detection, therapy guidance, and early cancer screening.
For researchers and drug development professionals, the implications are profound. Liquid biopsy is becoming an indispensable tool for accelerating oncology clinical trials, enabling real-time monitoring of treatment response, and facilitating the development of companion diagnostics for targeted therapies. The integration of novel analytical approaches like fragmentomics and the continuous push for greater detection sensitivity promise to further expand the research and clinical utility of this technology. As these trends converge, liquid biopsy is poised to remain at the forefront of precision oncology, driving a deeper understanding of cancer biology and creating new paradigms for patient management and drug development.
Conclusion
Liquid biopsy has firmly established itself as an indispensable tool in oncology, moving beyond a mere tissue supplement to a core platform for genomic profiling, therapy guidance, and disease monitoring. Its capacity for real-time, longitudinal assessment provides an unprecedented window into tumor dynamics and evolution. While challenges in sensitivity for early-stage disease and technical standardization persist, innovations in assay sensitivity, fragmentomics, artificial intelligence, and multimodal integration are rapidly advancing the field. The future points toward liquid biopsy's expanded role in de-escalating or escalating therapy based on MRD detection, population-wide cancer screening, and the realization of truly personalized, dynamic cancer treatment strategies, fundamentally reshaping clinical trials and patient care.
References
- 1. Liquid biopsy in cancer: current status, challenges and ... [https://www.nature.com/articles/s41392-024-02021-w]
- 2. Liquid biopsy – a narrative review with an update on current ... [https://pmc.ncbi.nlm.nih.gov/articles/PMC12333414/]
- 3. Liquid biopsy: An innovative tool in oncology. Where do we ... [https://www.sciencedirect.com/science/article/abs/pii/S0093775425000259]
- 4. Liquid Biopsy and Tissue Biopsy Comparison with Digital ... [https://pmc.ncbi.nlm.nih.gov/articles/PMC8824896/]
- 5. Liquid Biopsy: The Challenges of a Revolutionary ... [https://www.mdpi.com/1422-0067/26/11/5013]
- 6. Clinical Translation of ctDNA Epigenetic Signatures in ... [https://www.sciencedirect.com/science/article/abs/pii/S0006291X2501352X]
- 7. Advances in CTC and ctDNA detection techniques [https://breast-cancer-research.biomedcentral.com/articles/10.1186/s13058-025-02024-7]
- 8. The 'Liquid' Biopsy [https://www.cap.org/member-resources/articles/the-liquid-biopsy]
- 9. Research progress of CTC, ctDNA, and EVs in cancer liquid ... [https://pmc.ncbi.nlm.nih.gov/articles/PMC10850354/]
- 10. Tumor-educated platelets in lung cancer [https://www.sciencedirect.com/science/article/abs/pii/S000989812500186X]
- 11. Platelet‑circulating tumor cell crosstalk [https://www.spandidos-publications.com/10.3892/or.2025.9007?text=fulltext]
- 12. The growing field of liquid biopsy and its Snowball effect on ... [https://www.sciencedirect.com/science/article/pii/S2950195425000098]
- 13. Liquid Biopsies Move Closer to Broad Clinical Adoption [https://www.onclive.com/view/liquid-biopsies-move-closer-to-broad-clinical-adoption]
- 14. Liquid biopsy in gastrointestinal oncology - PubMed Central [https://pmc.ncbi.nlm.nih.gov/articles/PMC12580207/]
- 15. The history and development of liquid biopsy [https://frontlinegenomics.com/the-history-and-development-of-liquid-biopsy/]
- 16. Liquid Biopsy Market Trends & Growth Outlook 2025-2035 [https://www.futuremarketinsights.com/reports/liquid-biopsy-market]
- 17. Tracing the history of clinical practice of liquid biopsy [https://pmc.ncbi.nlm.nih.gov/articles/PMC12105997/]
- 18. Unlocking the Potential of Liquid Biopsy: A Paradigm Shift ... [https://www.mdpi.com/2075-4418/15/15/1916]
- 19. Cancer in a Drop: Liquid biopsy insights from AACR 2025 [https://pmc.ncbi.nlm.nih.gov/articles/PMC12223554/]
- 20. Unlocking the Potential of Liquid Biopsy - PubMed Central - NIH [https://pmc.ncbi.nlm.nih.gov/articles/PMC12346894/]
- 21. AACR 2025: Tailored Treatment Guided by Combined ... [https://www.pharmacytimes.com/view/tailored-treatment-guided-by-combined-tissue-and-liquid-biopsies-may-improve-outcomes-in-advanced-solid-tumors]
- 22. Liquid biopsy- A pivotal test to help navigate clinical ... [https://www.sciencedirect.com/science/article/pii/S2950195425000396]
- 23. Quantitative and Qualitative Analysis of Blood-based Liquid ... [https://pmc.ncbi.nlm.nih.gov/articles/PMC8941682/]
- 24. Liquid Biopsies, Novel Approaches and Future Directions - PMC [https://pmc.ncbi.nlm.nih.gov/articles/PMC10000663/]
- 25. Cell-free DNA Testing (Liquid Biopsy) for the Management of ... [https://guidelines.carelonmedicalbenefitsmanagement.com/cell-free-dna-testing-liquid-biopsy-for-the-management-of-cancer-2024-11-17-updated-2025-07-01/]
- 26. Cancer in a drop: Liquid biopsy highlights from the American ... [https://pmc.ncbi.nlm.nih.gov/articles/PMC12447415/]
- 27. Liquid Biopsy | September Round-Up 2025 [https://www.decibio.com/insights/liquid-biopsy-september-round-up-2025]
- 28. Leveraging Liquid Biopsy to Improve Cancer Care | Blog [https://www.aacr.org/blog/2025/05/21/breakthroughs-in-the-blood-leveraging-liquid-biopsy-to-improve-cancer-care/]
- 29. Liquid Biopsy, ctDNA Diagnosis through NGS - PMC [https://pmc.ncbi.nlm.nih.gov/articles/PMC8468354/]
- 30. Next-generation sequencing in liquid biopsy - Human Genomics [https://humgenomics.biomedcentral.com/articles/10.1186/s40246-019-0220-8]
- 31. Liquid biopsy and PCR-free ultrasensitive detection systems ... [https://pmc.ncbi.nlm.nih.gov/articles/PMC6086621/]
- 32. Performance Comparison of Droplet Digital PCR and Next- ... [https://pubmed.ncbi.nlm.nih.gov/40346007/]
- 33. NGS vs qPCR [https://www.illumina.com/science/technology/next-generation-sequencing/beginners/advantages/ngs-vs-qpcr.html]
- 34. Next-generation sequencing in cancer diagnosis and ... [https://pmc.ncbi.nlm.nih.gov/articles/PMC12009796/]
- 35. Comparative performance of a targeted next-generation ... [https://www.sciencedirect.com/science/article/abs/pii/S1525157825002375]
- 36. An Overview of Comprehensive Genomic Profiling ... - NCBI [https://www.ncbi.nlm.nih.gov/books/NBK603368]
- 37. Comprehensive genomic profiling of over 10000 advanced ... [https://www.oncotarget.com/article/28757/text/]
- 38. FoundationOne CDx | Foundation ... [https://www.foundationmedicine.com/test/foundationone-cdx]
- 39. Feasibility of Comprehensive Genomic Profiling (CGP) in Real ... [https://pmc.ncbi.nlm.nih.gov/articles/PMC9955416/]
- 40. Tumor diagnosis recharacterization enabled by ... [https://www.nature.com/articles/s41698-025-00942-5]
- 41. Leveraging liquid biopsy to uncover resistance ... [https://pmc.ncbi.nlm.nih.gov/articles/PMC12264632/]
- 42. A guideline for reporting experimental protocols in life sciences [https://pmc.ncbi.nlm.nih.gov/articles/PMC5978404/]
- 43. - Wikipedia Minimal residual disease [https://en.wikipedia.org/wiki/Minimal_residual_disease]
- 44. Cancer Minimal Testing in the Real World: 5 Uses... Residual Disease [https://www.linkedin.com/pulse/cancer-minimal-residual-disease-testing-real-world-5-kldue]
- 45. of Detection and prediction of recurrence in... minimal residual disease [https://pubmed.ncbi.nlm.nih.gov/40120523/]
- 46. Circulating Tumor DNA as a Prognostic and Predictive ... [https://pmc.ncbi.nlm.nih.gov/articles/PMC12564818/]
- 47. A Liquid Biopsy-based Assay Could Detect Recurrence ... [https://www.aacr.org/about-the-aacr/newsroom/news-releases/a-liquid-biopsy-based-assay-could-detect-recurrence-prior-to-imaging-in-patients-with-resectable-colorectal-cancer/]
- 48. SABCS 2025 to highlight dynamic landscape of liquid biopsy [https://www.sabcsmeetingnews.org/sabcs-2025-to-highlight-dynamic-landscape-of-liquid-biopsy/]
- 49. 2148 MRD Study Reaches Milestone With First Patient In ... [https://www.eortc.org/blog/2025/08/04/2148-mrd-study-first-patient-in/]
- 50. Tempus Introduces xM, An Assay to Monitor ... [https://www.tempus.com/news/tempus-introduces-xm-an-assay-to-monitor-immunotherapy-response-for-patients-with-advanced-cancers/?srsltid=AfmBOoqTVNlQqTxKt0VUmeQrMVXquExWgWTkdK_uJzDfBjhIzCOtYIJe]
- 51. Comprehensive Liquid Biopsy Approaches for the Clinical ... [https://www.mdpi.com/1422-0067/26/23/11304]
- 52. Circulating tumour DNA assays in focus: highlights from ... [https://www.nature.com/articles/s44276-025-00181-y]
- 53. Comparative evaluation of PD‐L1 expression in cytology ... [https://pmc.ncbi.nlm.nih.gov/articles/PMC10158776/]
- 54. Guardant Health Expands Tissue-Free Reveal Test to ... [https://investors.guardanthealth.com/press-releases/press-releases/2025/Guardant-Health-Expands-Tissue-Free-Reveal-Test-to-Include-Late-Stage-Therapy-Response-Monitoring/default.aspx]
- 55. Multi-Cancer Early Detection [https://www.accc-cancer.org/home/learn/precision-medicine/cancer-diagnostics/multi-cancer-early-detection-changes-on-the-horizon]
- 56. Future of Multi-Cancer Early Detection: A Recap and Horizon [https://www.onclive.com/view/future-of-multi-cancer-early-detection-a-recap-and-horizon]
- 57. Emerging Multi-Cancer Early Detection Technologies - NCBI [https://www.ncbi.nlm.nih.gov/books/NBK598992/]
- 58. Transforming cancer screening: the potential of multi-cancer early... [https://pmc.ncbi.nlm.nih.gov/articles/PMC11785667/]
- 59. The impact of multicancer early detection tests on cancer ... [https://pmc.ncbi.nlm.nih.gov/articles/PMC12598375/]
- 60. Exact Sciences Unveils Data Showing Promise of... | Exact Sciences [https://www.exactsciences.com/newsroom/press-releases/exact-sciences-unveils-data-showing-promise-of-multi-cancer-early-detection-at-aacr]
- 61. New Study Finds Multi-Cancer Blood Test May Detect More ... [https://privatehealth.com/new-study-finds-multi-cancer-blood-test-may-detect-more-cancers-earlier/]
- 62. Standardized Workflow and Analytical Validation of Cell ... [https://www.mdpi.com/2073-4409/14/14/1062]
- 63. Validation of a liquid biopsy assay with increased ... [https://www.sciencedirect.com/science/article/pii/S2950195425000384]
- 64. Validation of a liquid biopsy assay with increased ... [https://pubmed.ncbi.nlm.nih.gov/40980342/]
- 65. Review Liquid biopsy-based multi-cancer early detection [https://www.sciencedirect.com/science/article/pii/S2095927325006565]
- 66. Can a Liquid Biopsy Detect Early-Stage RCC? [https://www.cancernursingtoday.com/post/fragmentomics-liquid-biopsy-accurately-detects-early-rcc]
- 67. Liquid biopsy in gynecological cancers: a translational ... [https://jeccr.biomedcentral.com/articles/10.1186/s13046-025-03371-1]
- 68. Liquid Biopsy Breakthrough Highlights the Importance of ... [https://www.pcrf-kids.org/2025/09/04/liquid-biopsy-breakthrough-improves-pediatric-cancer-diagnosis-highlights-the-importance-of-emerging-investigators/]
- 69. Clinical Practice Guideline for Blood-based Circulating Tumor ... [https://pmc.ncbi.nlm.nih.gov/articles/PMC10813828/]
- 70. Evaluation of pre-analytical factors affecting plasma DNA ... [https://www.nature.com/articles/s41598-018-25810-0]
- 71. The impact of preanalytical variables on the analysis of cell ... [https://pmc.ncbi.nlm.nih.gov/articles/PMC11111958/]
- 72. What do we need to obtain high quality circulating tumor ... [https://www.sciencedirect.com/science/article/pii/S0009898121001893]
- 73. How to Ensure cfDNA Stability in Blood and Urine Samples [https://www.qiagen.com/us/knowledge-and-support/knowledge-hub/bench-guide/cell-free-dna-guide/handling-cfdna/preanalytical-handling-and-cfdna-stability]
- 74. Heterogeneity in Cancer - PMC - PubMed Central [https://pmc.ncbi.nlm.nih.gov/articles/PMC11816170/]
- 75. Liquid biopsy entering clinical practice: Past discoveries ... [https://www.sciencedirect.com/science/article/abs/pii/S1040842825000010]
- 76. Decoding Cancer Heterogeneity for Enhanced Treatment ... [https://pmc.ncbi.nlm.nih.gov/articles/PMC10525472/]
- 77. Unraveling Tumor Heterogeneity: Quantitative Insights from ... [https://xiahepublishing.com/1555-3884/GE-2024-00071]
- 78. Decoding tumor heterogeneity: A spatially informed pan ... [https://pmc.ncbi.nlm.nih.gov/articles/PMC12629804/]
- 79. Clinical validation of liquid biopsy-RECIST (LB- ... [https://pubmed.ncbi.nlm.nih.gov/40907207/]
- 80. Genome-wide analyses of 200453 individuals yield new ... [https://www.nature.com/articles/s41588-022-01121-z]
- 81. Clinical significance of clonal hematopoiesis in the interpretation of blood liquid biopsy - PubMed [https://pubmed.ncbi.nlm.nih.gov/32449983/]
- 82. Global trends and research status in clonal hematopoiesis [https://pmc.ncbi.nlm.nih.gov/articles/PMC12055686/]
- 83. Artificial Intelligence-Enhanced Liquid Biopsy and Radiomics ... [https://pmc.ncbi.nlm.nih.gov/articles/PMC12524159/]
- 84. Circulating DNA fragmentomics and cancer screening - PMC [https://pmc.ncbi.nlm.nih.gov/articles/PMC9903826/]
- 85. AI-powered liquid biopsy for early detection of ... [https://www.sciencedirect.com/science/article/abs/pii/S0009898125003638]
- 86. Quantum AI creates a better liquid biopsy for cancer [https://pme.uchicago.edu/news/quantum-ai-creates-better-liquid-biopsy-cancer]
- 87. A human-centered approach to data visualization [https://news.mit.edu/2025/human-centered-approach-data-visualization-arvind-satyanarayan-0905]
- 88. Multimodal Integration in Health Care - PubMed Central - NIH [https://pmc.ncbi.nlm.nih.gov/articles/PMC12370271/]
- 89. A technical review of multi-omics data integration methods [https://arxiv.org/abs/2501.17729]
- 90. Validation of a liquid biopsy assay with molecular and ... [https://www.nature.com/articles/s41698-021-00202-2]
- 91. Validation of Analytical Methods for Biomarkers Employed ... [https://pmc.ncbi.nlm.nih.gov/articles/PMC2744124/]
- 92. Verification, analytical validation, and clinical validation (V3) [https://www.nature.com/articles/s41746-020-0260-4]
- 93. Development and Performance Validation of a ... [https://pubmed.ncbi.nlm.nih.gov/40888113/]
- 94. Clinical utility of companion diagnostic biomarker results ... [https://pmc.ncbi.nlm.nih.gov/articles/PMC12205977/]
- 95. Analytical Validation of the Labcorp Plasma Complete Test, ... [https://www.sciencedirect.com/science/article/pii/S152515782500008X]
- 96. The Application of Liquid Biopsy for the Development ... [https://pmc.ncbi.nlm.nih.gov/articles/PMC11988008/]
- 97. Importance of EQA/PT for the detection of genetic variants ... [https://www.nature.com/articles/s41598-024-84714-4]
- 98. Cell-Free DNA, Tumor Molecular Concordance, and Clinical ... [https://pmc.ncbi.nlm.nih.gov/articles/PMC12489365/]
- 99. Real-World Performance of a Comprehensive Genomic ... [https://pmc.ncbi.nlm.nih.gov/articles/PMC8384401/]
- 100. Analysis of quality metrics in comprehensive cancer ... [https://www.sciencedirect.com/science/article/pii/S2352551724000143]
- 101. Celebrating milestones and the future of oncology in China [https://www.illumina.com/company/news-center/feature-articles/CSCO-2025.html]
- 102. Tumor-Agnostic Therapies in Practice - PubMed Central - NIH [https://pmc.ncbi.nlm.nih.gov/articles/PMC11899253/]
- 103. Tumor-Agnostic Therapy—The Final Step Forward in ... [https://www.mdpi.com/2073-4409/13/12/1071]
- 104. An Oncology Nurse's Guide to Tumor-Agnostic Therapies [https://www.ons.org/publications-research/voice/news-views/01-2025/oncology-nurses-guide-tumor-agnostic-therapies]
- 105. Real-world evidence provides clinical insights into tissue ... [https://www.nature.com/articles/s41467-025-57941-0]
- 106. [Expert consensus on liquid -based multi-cancer early detection... biopsy [https://pubmed.ncbi.nlm.nih.gov/40692248/]
- 107. FDA Approves Blood Tests That Can Help Guide Cancer ... [https://www.cancer.gov/news-events/cancer-currents-blog/2020/fda-guardant-360-foundation-one-cancer-liquid-biopsy]
- 108. Liquid biopsy for early detection and therapeutic ... [https://pmc.ncbi.nlm.nih.gov/articles/PMC10035729/]
- 109. FoundationOne Liquid CDx [https://www.foundationmedicine.com/test/foundationone-liquid-cdx]
- 110. FDA approves liquid biopsy NGS companion diagnostic ... [https://www.fda.gov/drugs/resources-information-approved-drugs/fda-approves-liquid-biopsy-ngs-companion-diagnostic-test-multiple-cancers-and-biomarkers]
- 111. FDA Clears Guardant360 CDx as Companion Diagnostic ... [https://www.onclive.com/view/fda-clears-guardant360-cdx-as-companion-diagnostic-for-imlunestrant-in-esr1-mutated-breast-cancer]
- 112. A comprehensive overview of minimal residual disease in ... [https://www.nature.com/articles/s41698-025-00984-9]
- 113. How MRD Is Being Used to Guide Treatment Decisions [https://www.targetedonc.com/view/how-mrd-is-being-used-to-guide-treatment-decisions]
- 114. Tumor-naïve multimodal profiling of circulating tumor DNA ... [https://pmc.ncbi.nlm.nih.gov/articles/PMC12627382/]
- 115. Analytical validation of a hybrid-approach combining tumor ... [https://pmc.ncbi.nlm.nih.gov/articles/PMC12599964/]
- 116. New Study Validates Tumor-Naïve, Multi-omics ctDNA ... [https://genesolutions.com/news/new-study-validates-ai-powered-multimodal-tumor-naive-ctdna-assay-for-enhanced-mrd-detection-and-recurrence-prediction-across-solid-tumors]
- 117. Minimal Residual Disease (MRD) Testing Market Size to ... [https://www.precedenceresearch.com/minimal-residual-disease-testing-market]
- 118. Cancer in a drop: Liquid biopsy highlights from the ... [https://pubmed.ncbi.nlm.nih.gov/40980343/]
- 119. Cancer in a drop: Liquid biopsy highlights from the ... [https://www.sciencedirect.com/science/article/pii/S2950195425000360]
- 120. News - Investor Relations | SOPHiA GENETICS, Inc. [https://ir.sophiagenetics.com/2025-10-16-A-D-A-M-Innovations-and-SOPHiA-GENETICS-partner-to-advance-liquid-biopsy-testing-and-companion-diagnostics-for-precision-oncology-in-Japan]
- 121. Forging Forward - Our Progress in Biopharmaceutical ... [https://www.foundationmedicine.com/blog/progress-biopharma-partnerships-outlook-2025]
- 122. FCS Launches Liquid Biopsy [https://flcancer.com/articles/liquid-biopsy-launch/]
- 123. Mass General Brigham Launches Two Clinical Trials ... [https://newsroom.questdiagnostics.com/2025-08-07-Mass-General-Brigham-Launches-Two-Clinical-Trials-to-Study-Haystack-MRD-ctDNA-as-Guide-for-Post-surgical-Treatment-for-Two-Cancer-Types]