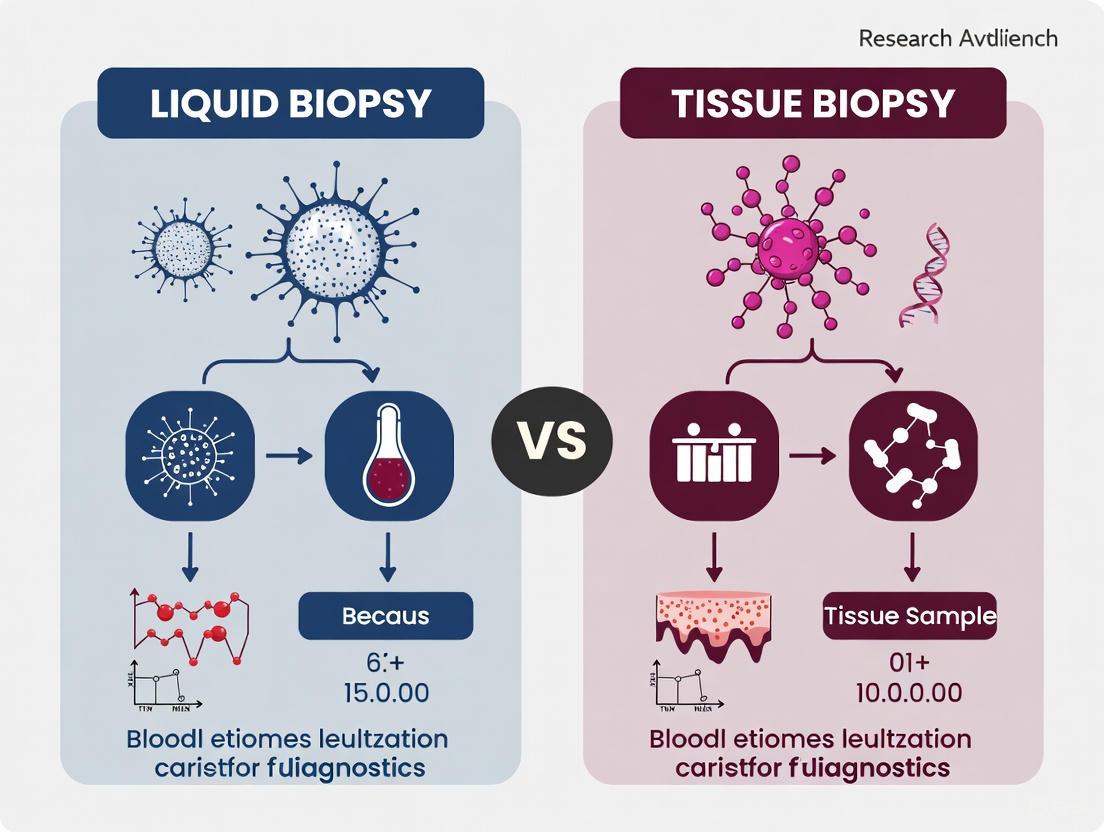
Liquid Biopsy vs Tissue Biopsy in Oncology: A Strategic Guide for Research and Drug Development
This article provides a comprehensive analysis of liquid and tissue biopsy for researchers and drug development professionals.
Liquid Biopsy vs Tissue Biopsy in Oncology: A Strategic Guide for Research and Drug Development
Abstract
This article provides a comprehensive analysis of liquid and tissue biopsy for researchers and drug development professionals. It covers the fundamental principles, technological platforms, and biomarkers underpinning each method. The content explores clinical applications from early detection to therapy monitoring, addresses key technical challenges and optimization strategies, and presents comparative data on clinical performance and emerging evidence for integrated use. Recent clinical trial results, including the phase II ROME trial, are discussed to highlight the growing paradigm of combining both techniques for superior patient stratification and outcomes in precision oncology.
Core Principles and Biomarkers: Deconstructing Liquid and Tissue Biopsies
For decades, tissue biopsy has represented the gold standard for tumor diagnosis and characterization in clinical oncology [1]. This foundational procedure enables direct histological examination of suspicious lesions, providing critical information about tumor type, grade, and stage that forms the basis of treatment decisions [2]. The diagnostic precision offered by tissue biopsy stems from its ability to preserve the architectural context of tumor cells within their native tissue microenvironment—a feature that remains unmatched by alternative diagnostic modalities [3].
Despite its established role, tissue biopsy faces significant limitations in the era of precision oncology. These constraints include its inherent invasiveness, susceptibility to sampling bias due to tumor heterogeneity, and inability to repeatedly capture the dynamic evolution of tumors under therapeutic pressure [2]. This technical review examines both the foundational protocols that underpin tissue biopsy's diagnostic authority and the practical constraints that motivate the development of complementary approaches like liquid biopsy for comprehensive cancer management.
The Histological Gold Standard: Methodological Foundations
The diagnostic supremacy of tissue biopsy is anchored in rigorous, time-tested histological protocols that enable comprehensive tissue characterization at cellular and molecular levels.
Tissue Acquisition and Processing Protocols
Representative tissue sampling forms the critical first step in the diagnostic pathway. The mapping procedure employs incisional biopsies from areas with different reaction patterns to ensure adequate representation of both normal and pathological tissue [3]. Specimen collection must include the full depth of the mucosa when applicable, with samples of sufficient size to enable accurate pathological assessment without requiring additional procedures [3].
Following acquisition, tissue specimens require immediate stabilization through fixation in buffered formalin to preserve cellular architecture and prevent degradation [3]. This process maintains protein-nucleic acid interactions and prevents autolysis, ensuring that histological and molecular analyses accurately reflect the in vivo state. Fixed tissues then undergo processing, embedding, sectioning, and staining according to standardized protocols optimized for different analytical endpoints.
Table 1: Key Research Reagents for Tissue Biopsy Processing
| Reagent/Category | Primary Function | Technical Considerations |
|---|---|---|
| Buffered Formalin | Tissue fixation and preservation | Maintains structural integrity for histological evaluation |
| Hematoxylin | Nuclear staining | Differentiates nuclear morphology for grading and classification |
| Eosin | Cytoplasmic staining | Highlights cytoplasmic details and stromal relationships |
| Antibody Panels (IHC) | Protein biomarker detection | Enables molecular subtyping (e.g., hormone receptors, HER2) |
| Nucleic Acid Extraction Kits | DNA/RNA isolation | Quality and quantity requirements for downstream genomic assays |
Analytical Modalities and Diagnostic Information
Histological analysis of processed tissue sections provides multidimensional diagnostic information through complementary assessment techniques:
Histomorphological Assessment: Routine staining with hematoxylin and eosin (H&E) enables evaluation of tumor architecture, cellular pleomorphism, mitotic activity, and invasion patterns—features essential for tumor classification and grading [3].
Immunohistochemistry (IHC): Antibody-based detection of protein biomarkers facilitates lineage determination, molecular subtyping, and identification of therapeutic targets such as hormone receptors or checkpoint proteins [2].
Molecular Profiling: Nucleic acids extracted from biopsy material enable comprehensive genomic characterization, including mutation identification, copy number alteration assessment, and gene expression profiling to guide targeted therapy selection [4].
The integration of these analytical modalities positions tissue biopsy as the definitive method for establishing primary diagnosis and initial therapeutic planning in oncology.
Figure 1: Standard Tissue Biopsy Workflow from Sample Acquisition to Diagnosis
Inherent Limitations of Tissue Biopsy in Modern Oncology
Despite its diagnostic authority, tissue biopsy suffers from several fundamental constraints that impact its utility in comprehensive cancer management.
Invasiveness and Procedural Risks
The invasive nature of tissue acquisition presents significant patient risks, including pain, bleeding, infection, and potential damage to adjacent structures [2]. These risks escalate for tumors located in anatomically challenging sites such as lung, brain, or pancreas, where biopsy accessibility is limited and procedural morbidity increases substantially [2]. The requirement for specialized interventional expertise and facility resources further constrains implementation across diverse healthcare settings.
Temporal and Spatial Sampling Limitations
Tissue biopsies provide only a single temporal snapshot of tumor biology, captured at a specific moment in the disease continuum [2]. This static assessment cannot capture the dynamic evolution of tumors under selective therapeutic pressure, including the emergence of resistant subclones that drive disease progression [4]. Additionally, the spatial constraint of sampling from a single tumor region fails to represent the heterogeneity present across different geographical sites within primary tumors or between metastatic lesions [4].
The ROME trial highlighted this limitation, demonstrating that tissue and liquid biopsies identified the same actionable alterations in only 49.2% of cases, with tissue biopsy exclusively detecting actionable alterations in 34.7% of patients and liquid biopsy exclusively detecting alterations in 16% [4]. This discordance stems from sampling different tumor sites with distinct molecular profiles.
Analytical Challenges and Tumor Heterogeneity
The subjective interpretation of histological features introduces variability in diagnosis and grading, particularly for borderline lesions or those with complex morphological patterns [3]. Intra-tumor heterogeneity further complicates accurate characterization, as a single biopsy may not capture the complete spectrum of molecular alterations present throughout the tumor ecosystem [4].
Table 2: Comparative Analysis of Tissue vs. Liquid Biopsy Performance Characteristics
| Parameter | Tissue Biopsy | Liquid Biopsy |
|---|---|---|
| Invasiveness | Surgical procedure with associated risks [2] | Minimal (blood draw) [2] |
| Turnaround Time | Days to weeks [5] | Potentially faster (hours to days) [5] |
| Spatial Representation | Single site/single region [4] | Captures contributions from multiple tumor sites [2] |
| Temporal Resolution | Single time point assessment [2] | Enables serial monitoring [2] |
| Diagnostic Accuracy | High for histology and cellular architecture [5] | Lower sensitivity for early-stage/low-shedding tumors [6] |
| Genomic Coverage | Comprehensive but region-specific [4] | Genome-wide but limited by ctDNA shed [7] |
Integration with Liquid Biopsy: A Complementary Diagnostic Paradigm
The limitations of tissue biopsy have motivated the development of liquid biopsy as a complementary approach that captures different aspects of tumor biology.
Technical Synergies in Comprehensive Profiling
Liquid biopsy analyzes circulating tumor DNA (ctDNA), which consists of short DNA fragments (approximately 20-50 base pairs) shed into the bloodstream from apoptotic or necrotic tumor cells [1]. While ctDNA represents only 0.1-1.0% of total cell-free DNA, advanced detection platforms can identify tumor-specific alterations with sensitivities reaching 0.01% variant allele frequency using next-generation sequencing or droplet digital PCR [8]. The complementary value of combined profiling was demonstrated in the ROME trial, where patients with concordant tissue-liquid biopsy findings who received tailored therapy showed significantly improved overall survival (11.05 vs. 7.7 months) and progression-free survival (4.93 vs. 2.8 months) compared to standard of care [4].
Figure 2: Complementary Diagnostic Value of Tissue and Liquid Biopsy Approaches
Clinical Applications and Context-Dependent Utility
Specific clinical scenarios highlight the respective strengths of each biopsy modality:
Initial Diagnosis: Tissue biopsy remains essential for comprehensive histopathological evaluation, including tumor typing, grading, and assessment of invasive front characteristics [3].
Therapy Selection: Combined profiling identifies a broader spectrum of actionable alterations, with tissue providing baseline characterization and liquid biopsy capturing heterogeneity across tumor sites [4].
Monitoring Dynamic Change: Liquid biopsy excels in serial assessment of treatment response, detection of resistance mechanisms, and identification of minimal residual disease—applications poorly served by repeated tissue sampling [8].
Technical Limitations: Liquid biopsy sensitivity remains suboptimal for early-stage disease or low-shedding tumors, where tumor DNA in circulation falls below detection thresholds of current platforms [6].
Future Directions and Concluding Perspectives
The evolving diagnostic landscape increasingly recognizes the complementary rather than competitive relationship between tissue and liquid biopsy modalities. Technological advances in both domains continue to address their respective limitations—with tissue biopsy benefiting from multiregional sampling approaches and liquid biopsy achieving enhanced sensitivity through improved assay design [7].
Future diagnostic pathways will likely leverage integrated profiling strategies that combine the histological foundation of tissue biopsy with the dynamic systemic perspective offered by liquid biopsy. This synergistic approach promises to overcome the inherent limitations of each method individually, ultimately advancing personalized oncology through more comprehensive molecular characterization of heterogeneous tumor ecosystems. As precision medicine evolves, the gold standard of tissue biopsy will continue to provide the essential diagnostic foundation, while liquid biopsy expands our capacity for longitudinal monitoring and adaptive therapeutic management.
Liquid biopsy represents a transformative approach in oncology, enabling the analysis of tumor-derived components from bodily fluids such as blood. This minimally invasive technique provides a dynamic snapshot of tumor biology, offering significant advantages over traditional tissue biopsy for cancer diagnosis, monitoring, and treatment selection [9] [1]. As a complementary tool to tissue-based methods, liquid biopsy facilitates real-time tracking of tumor evolution and heterogeneity, which is crucial for implementing precision medicine strategies in cancer care [9].
The clinical adoption of liquid biopsy has accelerated due to its ability to overcome limitations inherent in tissue biopsy, including invasiveness, sampling constraints, and inability to repeatedly assess tumor genomics throughout treatment. This technical guide examines the core components, methodologies, and applications of liquid biopsy within the broader context of cancer research and drug development.
Liquid Biopsy vs. Tissue Biopsy: A Comparative Analysis
The following table summarizes the key distinctions between liquid biopsy and traditional tissue biopsy approaches:
Table 1: Comparative Analysis of Liquid Biopsy versus Tissue Biopsy
| Parameter | Liquid Biopsy | Tissue Biopsy |
|---|---|---|
| Invasiveness | Minimally invasive (blood draw) [1] | Invasive surgical procedure [9] |
| Sampling Frequency | Allows serial monitoring and longitudinal assessment [9] [10] | Limited by procedure risks and patient tolerance |
| Turnaround Time | Rapid processing potential [10] | Longer processing times typically required |
| Tumor Heterogeneity | Captures composite tumor profile from multiple sites [10] | Limited to sampled region, may miss heterogeneity [9] |
| Risk to Patient | Low risk (equivalent to blood draw) [1] | Higher risk (bleeding, infection, pain) [9] |
| Tissue Access | Accessible even for difficult-to-biopsy locations | Anatomically challenging for some tumor types |
| Cost | Potentially lower overall costs [9] | Higher procedure and facility costs |
| Sensitivity | Can have limitations in sensitivity, especially early disease [9] | High sensitivity for direct tumor analysis |
| Clinical Applications | Early detection, monitoring, MRD assessment, resistance mechanism identification [9] | Gold standard for initial diagnosis and histopathological characterization [1] |
Core Biomarkers in Liquid Biopsy
Liquid biopsy encompasses multiple analyte classes that provide complementary information about tumor biology:
Circulating Tumor Cells (CTCs)
CTCs are cells shed from primary and metastatic tumors that circulate in the peripheral blood. First identified in 1869 by Thomas Ashworth, CTCs are exceptionally rare, with approximately 1 CTC per 1 million leukocytes, and have a short half-life of 1-2.5 hours in circulation [1]. Despite their rarity, CTC enumeration and characterization provide valuable insights into the metastatic process and disease progression [1].
The CellSearch system remains the only FDA-cleared method for CTC enumeration and monitoring in metastatic breast, colorectal, and prostate cancers [1]. CTC detection methodologies can be broadly categorized into:
- Biophysical property-based methods: Density gradient centrifugation, inertial focusing, and filtration exploiting differences in size, density, and deformability between CTCs and hematological cells [1].
- Biological property-based methods: Immunomagnetic separation targeting surface markers such as epithelial cell adhesion molecule (EpCAM), vimentin, and N-cadherin; microfluidic devices for enhanced capture efficiency [1].
Circulating Tumor DNA (ctDNA)
ctDNA comprises fragmented DNA molecules released into the bloodstream through apoptosis, necrosis, and active secretion from tumor cells [9] [1]. It represents a small fraction (0.1-1.0%) of total cell-free DNA (cfDNA) in cancer patients, with fragment sizes typically ranging from 20-50 base pairs - notably shorter than cfDNA derived from healthy cells [1]. This size differential facilitates isolation and enrichment strategies.
The clinical utility of ctDNA stems from its short half-life (approximately 2 hours), enabling real-time monitoring of tumor dynamics and treatment response [1]. ctDNA analysis focuses primarily on:
- Somatic mutations: Identification of single nucleotide variants (SNVs), insertions/deletions (indels), and copy number alterations (CNAs) in cancer-associated genes [9].
- Epigenetic modifications: Detection of aberrant DNA methylation patterns that often precede malignant transformation and serve as early detection biomarkers [1].
- Quantitative assessment: Monitoring changes in ctDNA variant allele frequency (VAF) to track tumor burden and therapeutic response [1].
Extracellular Vesicles (EVs) and Other Analytes
Tumor-derived extracellular vesicles, including exosomes, are membrane-bound particles carrying proteins, nucleic acids, and lipids that reflect their cell of origin [9]. EV isolation typically exploits their physical and biochemical properties, with preparative ultracentrifugation being the most common method (>50% of protocols) [9]. Emerging techniques include nanomembrane ultrafiltration concentrators, which show promise for improving yield and purity [9].
Additional liquid biopsy analytes include:
- tumor-educated platelets (TEPs): Platelets that have incorporated tumor-derived biomolecules and display altered RNA and protein profiles [9].
- circulating cell-free RNA (cfRNA): Including microRNAs (miRNAs) and other non-coding RNAs with regulatory functions in cancer progression [9].
Technical Standards and Preanalytical Variables
Robust liquid biopsy testing requires strict adherence to preanalytical standards to ensure reproducible results. The BloodPAC Consortium has established Minimum Technical Data Elements (MTDEs) for cell-free DNA analysis that represent critical variables requiring documentation and standardization [10]:
Table 2: Minimum Technical Data Elements (MTDEs) for Liquid Biopsy Preanalytical Processing
| Data Element | Description | Examples/Standards |
|---|---|---|
| Blood Collection Tube Type | Tube used for sample collection | EDTA, CellSave, Streck, Acid Citrate Dextrose (ACD) [10] |
| Sample Composition | Cellular composition of sample | Clinical, CTC, Buffy Coat, Bone Marrow Components [10] |
| Shipping Temperature | Temperature during transport (°C) | Float value in centigrade [10] |
| Blood Fractionalization Method | Method for blood component separation | Ficoll Method, specific centrifugation protocols [10] |
| Time to Fractionation | Time from blood draw to processing (hours) | Upper and lower limits in hours [10] |
| Analyte Isolation Method | Method for analyte extraction | Commercial kits, proprietary protocols [10] |
| Time to Freezer | Time from processing to preservation (hours) | Upper and lower limits in hours [10] |
| Storage Temperature | Temperature during preservation (°C) | Float value in centigrade [10] |
| Concentration | Molecular or cellular concentration | ng/μL for molecules, cells/μL for cellular [10] |
| Assay Method | Analytical characterization method | Targeted Sequencing, Copy Number Analysis [10] |
| Time to Assay | Time from indexing to analysis (days) | Integer value in days [10] |
Experimental Workflows and Methodologies
Integrated Liquid Biopsy Workflow
CTC Capture and Analysis Methodology
Principle: Isolation of rare circulating tumor cells from peripheral blood based on physical and biological properties.
Protocol Details:
- Sample Collection: Collect 10-20mL peripheral blood into FDA-approved preservation tubes (CellSave) to maintain CTC viability and prevent degradation [1].
- Enrichment:
- Immunomagnetic Separation: Incubate blood with antibody-coated magnetic beads targeting EpCAM or other epithelial markers. Apply to magnetic field to separate labeled CTCs [1].
- Size-Based Filtration: Pass blood through microfluidic devices with pores sized to retain larger CTCs while allowing hematological cells to pass through [1].
- Density Gradient Centrifugation: Layer blood over Ficoll solution and centrifuge to separate mononuclear cells (including CTCs) from other blood components [1].
- Identification and Characterization:
- Immunofluorescence staining for epithelial markers (CK8,18,19), absence of leukocyte marker CD45, and nuclear stain DAPI [1].
- Morphological analysis to distinguish malignant from normal cells.
- Molecular profiling including single-cell sequencing, FISH, or RNA analysis to characterize tumor biology.
Technical Considerations: CTC recovery rates vary significantly by methodology. The CellSearch system demonstrates high reproducibility but may miss epithelial-mesenchymal transition (EMT) phenotypes with reduced EpCAM expression [1].
ctDNA Extraction and Analysis Methodology
Principle: Isolation and analysis of tumor-derived fragmented DNA from plasma.
Protocol Details:
- Plasma Preparation:
- Centrifuge blood at 800-1600×g for 10 minutes at 4°C to separate plasma from cellular components.
- Transfer supernatant to fresh tube and centrifuge at 16,000×g for 10 minutes to remove remaining cells and debris.
- Store plasma at -80°C or proceed immediately to extraction.
- ctDNA Extraction:
- Use commercial silica-membrane columns or magnetic bead-based systems optimized for small fragment recovery.
- Include enzymatic digestion steps to eliminate contaminating proteins.
- Elute in low-volume buffers (10-50μL) to maximize concentration.
- Quality Control:
- Quantify DNA using fluorometric methods sensitive to low concentrations (Qubit).
- Assess fragment size distribution using Bioanalyzer or TapeStation.
- Mutation Detection:
- Targeted Next-Generation Sequencing: Amplify regions of interest using multiplex PCR or hybrid capture approaches. Sequence to high coverage (10,000×) to detect low-frequency variants [1].
- Digital PCR: Partition samples into thousands of individual reactions to detect rare mutations with high sensitivity and absolute quantification [1].
- BEAMing Technology: Combine beads, emulsion, amplification, and magnetics to detect hotspot mutations with high sensitivity as demonstrated by Diehl et al. for monitoring colorectal cancer patients [1].
Technical Considerations: Preanalytical variables significantly impact ctDNA integrity and yield. Standardized collection tubes, processing times, and storage conditions are critical for reproducible results [10].
Research Reagent Solutions and Essential Materials
Table 3: Essential Research Reagents and Materials for Liquid Biopsy Applications
| Reagent/Material | Function | Application Notes |
|---|---|---|
| CellSave Preservative Tubes | Maintain CTC viability and integrity | FDA-cleared for CTC enumeration; prevents coagulation and preserves cell surface epitopes [1] |
| Streck Cell-Free DNA BCT Tubes | Stabilize nucleated blood cells and prevent cfDNA release | Critical for accurate ctDNA quantification by minimizing background wild-type DNA contamination [10] |
| EDTA Blood Collection Tubes | Anticoagulation for blood samples | Standard collection method requiring processing within 2-6 hours to prevent hemolysis and DNA degradation [10] |
| Ficoll-Paque Density Gradient Medium | Separation of mononuclear cells from whole blood | Enables CTC enrichment based on buoyant density; must be used with controlled centrifugation conditions [1] |
| EpCAM-Coated Magnetic Beads | Immunomagnetic capture of epithelial CTCs | High specificity for epithelial tumors; may miss mesenchymal CTCs undergoing EMT [1] |
| Silica-Membrane DNA Extraction Kits | Isolation of high-purity ctDNA from plasma | Optimized for recovery of short DNA fragments; critical for maintaining ctDNA representativeness [1] |
| Digital PCR Master Mixes | Absolute quantification of tumor mutations | Enables detection of variant alleles at frequencies as low as 0.01%; requires appropriate controls and validation [1] |
| Next-Generation Sequencing Library Prep Kits | Preparation of ctDNA libraries for mutation profiling | Target enrichment approaches (hybrid capture or amplicon-based) essential for sensitive detection in low-input samples [9] |
| EV Isolation Reagents | Enrichment of extracellular vesicles | Ultracentrifugation remains gold standard; polymer-based precipitation kits offer alternatives with variable purity [9] |
Clinical Applications and Research Implications
Liquid biopsy has established utility across the cancer care continuum, supported by an expanding body of clinical evidence and integration into practice guidelines:
Early Detection and Screening
The non-invasive nature of liquid biopsy makes it ideally suited for cancer screening applications. Multi-analyte approaches combining ctDNA mutations, methylation patterns, and protein markers demonstrate promising sensitivity and specificity for detecting early-stage malignancies before clinical manifestation [9] [1].
Minimal Residual Disease (MRD) Monitoring
Liquid biopsy enables highly sensitive detection of molecular residual disease following curative-intent treatment. Decreasing ctDNA levels correlate with favorable treatment response, while persistent or rising levels indicate residual disease and higher relapse risk [9]. This application permits early intervention before radiographic progression.
Treatment Selection and Therapeutic Monitoring
Liquid biopsy identifies targetable genomic alterations to guide targeted therapy selection. Serial monitoring during treatment captures dynamic changes in tumor genomics, including the emergence of resistance mechanisms [9] [1]. For example, detection of EGFR T790M mutations in non-small cell lung cancer patients progressing on first-line EGFR inhibitors informs subsequent therapy with third-generation inhibitors.
Assessment of Tumor Heterogeneity
Unlike single-site tissue biopsies, liquid biopsy captures the composite genomic landscape of both primary and metastatic lesions, providing a more comprehensive view of tumor heterogeneity and evolution under therapeutic pressure [9] [10].
The clinical validation of liquid biopsy is evidenced by its incorporation into major cancer guidelines, including the 2015 Chinese Expert Consensus on Blood EGFR Mutation Testing in NSCLC and the 2019 CSCO Breast Cancer Guidelines [1]. As of 2025, there are 20 actively recruiting United States registered clinical trials specifically targeting immunotherapy and liquid biopsy applications, highlighting the ongoing innovation in this field [9].
Current Challenges and Future Directions
Despite significant advances, liquid biopsy faces several technical and biological challenges. Sensitivity limitations persist for early-stage disease where tumor DNA shedding may be minimal. Standardization of preanalytical variables across institutions remains challenging, necessitating implementation of Minimum Technical Data Elements as proposed by BloodPAC [10]. Biological complexities including ctDNA fragmentomics and clonal hematopoiesis of indeterminate potential (CHIP) require sophisticated bioinformatic approaches for accurate interpretation.
Future development will focus on multi-analyte integration, improved isolation technologies, and computational methods to enhance sensitivity and specificity. As liquid biopsy methodologies continue to mature, they are poised to transform cancer management through increasingly accessible, comprehensive, and dynamic molecular profiling.
Liquid biopsy has emerged as a transformative, minimally invasive approach in clinical oncology, offering a powerful alternative and complement to traditional tissue biopsy. This technical guide provides an in-depth analysis of the three core analytical targets in liquid biopsy—circulating tumor DNA (ctDNA), circulating tumor cells (CTCs), and exosomes. Within the broader research context of liquid versus tissue biopsy, we detail the biological significance, technological platforms for isolation and characterization, and clinical applications of each biomarker. The document synthesizes current methodologies, presents comparative analytical data in structured tables, and outlines standardized experimental workflows, serving as a comprehensive resource for researchers, scientists, and drug development professionals engaged in precision oncology.
Cancer management has historically relied on tissue biopsy as the gold standard for diagnosis, providing critical histopathological information and enabling molecular profiling [1]. However, tissue biopsy is an invasive procedure with inherent limitations, including sampling bias due to tumor heterogeneity, inability to perform frequent serial monitoring, and risks associated with surgical complications, particularly for tumors in hard-to-reach locations [9] [2]. In response to these challenges, liquid biopsy has developed as a revolutionary diagnostic tool.
Liquid biopsy involves the isolation and analysis of tumor-derived components from biofluids such as blood, urine, or cerebrospinal fluid [11]. Its minimally invasive nature allows for real-time monitoring of tumor dynamics, assessment of therapeutic response, and detection of emergent resistance mechanisms [9] [1]. This capability for longitudinal sampling provides a dynamic view of tumor evolution that is not feasible with single time-point tissue biopsies. The global liquid biopsy market, valued at USD 6.17 billion in 2024 and projected to reach USD 22.69 billion by 2034, reflects the rapid adoption and immense potential of this technology [12]. The three most prominent and well-studied analytes in liquid biopsy are ctDNA, CTCs, and exosomes, each offering unique biological insights and technical challenges.
Circulating Tumor DNA (ctDNA)
Biological Significance and Clinical Utility
Circulating tumor DNA (ctDNA) refers to short, fragmented DNA molecules shed into the circulation by tumor cells through processes such as apoptosis, necrosis, and active secretion [1] [13]. It represents a fraction of the total cell-free DNA (cfDNA) in the bloodstream, which is predominantly derived from normal hematopoietic cells [1]. In cancer patients, ctDNA typically constitutes 0.1% to 1.0% of total cfDNA, though this proportion can increase with tumor burden [1]. ctDNA carries tumor-specific alterations, including point mutations, copy number variations, gene fusions, and epigenetic modifications such as methylation changes [9] [13].
A key advantage of ctDNA is its short half-life of approximately 114 minutes, enabling it to provide a near real-time snapshot of tumor burden and molecular status [13]. This contrasts with the static view offered by a single tissue biopsy. Clinically, ctDNA analysis is used for:
- Early cancer detection and screening through identification of cancer-associated mutations and methylation patterns [12] [13].
- Identification of minimal residual disease (MRD) post-treatment, often before clinical or radiological evidence of recurrence [11] [13].
- Guiding targeted therapies by detecting actionable mutations (e.g., EGFR in lung cancer) [1].
- Monitoring treatment response and detecting emerging mechanisms of drug resistance through serial sampling [9] [14].
Experimental Protocols for ctDNA Analysis
The workflow for ctDNA analysis involves blood collection, plasma separation, DNA extraction, and targeted molecular analysis.
Sample Collection and Pre-processing:
- Blood Collection: Collect peripheral blood (typically 10-20 mL) in cell-stabilizing tubes (e.g., Streck Cell-Free DNA BCT or PAXgene Blood ccfDNA Tubes) to prevent lysis of nucleated blood cells and preserve cfDNA profile.
- Plasma Separation: Perform double centrifugation within a specified window (e.g., within 2-6 hours of collection).
- Initial centrifugation: 800-1600 × g for 10-20 minutes at 4°C to separate plasma from blood cells.
- Second centrifugation: 16,000 × g for 10 minutes at 4°C to remove residual cells and platelets.
- cfDNA Extraction: Isolate cfDNA from plasma using commercial silica-membrane column-based kits (e.g., QIAamp Circulating Nucleic Acid Kit from Qiagen) or magnetic bead-based technologies. Elute in a low-volume buffer (e.g., 20-50 µL) to maximize concentration.
- Quality Control and Quantification: Quantify recovered cfDNA using fluorometric methods (e.g., Qubit dsDNA HS Assay Kit) and assess fragment size distribution via microcapillary electrophoresis (e.g., Agilent 2100 Bioanalyzer with High Sensitivity DNA chips).
Downstream Analytical Techniques:
- Droplet Digital PCR (ddPCR): Used for absolute quantification of known, specific mutations with high sensitivity (down to 0.001% variant allele frequency). The workflow involves partitioning the sample into thousands of nanoliter-sized droplets, performing endpoint PCR amplification, and analyzing fluorescence in each droplet to determine the fraction of mutant-positive droplets [13].
- Next-Generation Sequencing (NGS): Allows for hypothesis-free screening of multiple genes and mutation types simultaneously. Panels can be:
- Targeted Panels: Focus on a curated set of cancer-related genes (e.g., 50-200 genes), enabling deep sequencing coverage (>10,000x) to detect low-frequency variants.
- Whole-Exome/Genome Sequencing: Provides a comprehensive view but with lower sensitivity for rare variants due to shallower sequencing depth.
- Methylation Analysis: Utilizes bisulfite conversion treatment, which deaminates unmethylated cytosines to uracils while leaving methylated cytosines unchanged. Subsequent PCR or NGS analysis can identify cancer-specific methylation signatures [13].
Figure 1: ctDNA Analysis Workflow. The process from blood draw to downstream applications, highlighting the main analytical paths.
Circulating Tumor Cells (CTCs)
Biological Significance and Clinical Utility
Circulating tumor cells (CTCs) are intact, viable cancer cells that detach from primary or metastatic tumor sites and enter the circulatory system [1] [15]. Their presence indicates an advanced disease state with metastatic potential. CTCs are exceptionally rare, with an estimated frequency of 1 CTC per 10^6-10^7 leukocytes in peripheral blood of cancer patients, and have a short half-life of 1 to 2.5 hours [1] [16]. The detection and molecular characterization of CTCs provide a unique window into the metastatic cascade.
CTCs exhibit considerable heterogeneity, encompassing epithelial tumor cells, cells undergoing epithelial-mesenchymal transition (EMT), and circulating tumor stem cells (CTSCs) with enhanced tumor-initiating potential [14]. This heterogeneity allows CTC analysis to provide insights into:
- Prognostic Stratification: Enumeration of CTCs is an independent prognostic factor in multiple cancers (e.g., breast, prostate, colorectal), with higher counts correlating with reduced progression-free and overall survival [1] [14].
- Understanding Metastasis: Functional studies of CTCs, including in vitro culture and patient-derived xenograft models, reveal mechanisms of metastasis and therapeutic resistance [14].
- Treatment Monitoring: Serial changes in CTC counts can indicate response to therapy earlier than conventional imaging [16].
Experimental Protocols for CTC Isolation and Analysis
The technical challenge of CTC analysis lies in their extreme rarity, requiring highly efficient and specific enrichment strategies before downstream characterization.
CTC Enrichment and Isolation Techniques:
- Immunomagnetic-Based Enrichment (Positive Selection):
- Principle: Uses magnetic beads conjugated with antibodies against Epithelial Cell Adhesion Molecule (EpCAM), a common epithelial marker on CTCs.
- Protocol (CellSearch System, FDA-approved):
- Incubate 7.5 mL of whole blood with anti-EpCAM ferrofluid.
- Place the sample in a magnetic field to retain EpCAM-labeled cells.
- Stain retained cells with fluorescent antibodies (cytokeratin for epithelial cells, CD45 for leukocyte exclusion, and DAPI for nuclear staining).
- Identify and enumerate CTCs as nucleated (DAPI+), epithelial (cytokeratin+), and non-hematopoietic (CD45-) cells [1] [15].
- Limitation: May miss CTCs that have undergone EMT and downregulated EpCAM [14].
Size-Based Enrichment (Label-Free):
- Principle: Exploits the fact that most CTCs are larger and less deformable than peripheral blood cells.
- Protocol (Microfluidic Filtration):
- Use microfluidic devices (e.g., Parsortix system) with precisely defined cross-sectional gaps (e.g., 6.5-8 µm).
- Pump whole blood through the device under controlled pressure.
- Larger CTCs are trapped while smaller blood cells pass through.
- Recover trapped CTCs for downstream analysis by reversing the flow [15].
- Advantage: Captures CTCs independent of surface marker expression.
Density Gradient Centrifugation:
- Principle: Separates mononuclear cells (including CTCs) from whole blood based on density using media like Ficoll-Paque.
- Protocol:
- Layer blood diluted 1:1 with PBS carefully over Ficoll in a centrifuge tube.
- Centrifuge at 400 × g for 30-40 minutes at room temperature with the brake off.
- Collect the mononuclear cell layer at the plasma-Ficoll interface.
- Wash cells with buffer and proceed to identification [15].
CTC Identification and Characterization:
- Immunofluorescence (IF) Microscopy: The standard method for confirming CTC identity post-enrichment, typically using a cocktail of antibodies (e.g., Pan-cytokeratin, CD45, DAPI) to distinguish CTCs from leukocytes [15].
- Single-Cell Analysis: Isolated CTCs can be subjected to whole-genome amplification (WGA) or whole-transcriptome amplification (WTA) for NGS, enabling the study of heterogeneity and resistance mechanisms at the single-cell level [16].
- In Vitro Culture: Efforts to expand CTCs ex vivo facilitate drug sensitivity testing and functional studies, though this remains technically challenging [14].
Table 1: Comparison of Major CTC Enrichment Technologies
| Method | Principle | Advantages | Limitations | References |
|---|---|---|---|---|
| Immunomagnetic (CellSearch) | Positive selection using anti-EpCAM magnetic beads | FDA-cleared; standardized; high specificity | Misses EpCAM-low/-negative CTCs (e.g., EMT subtypes) | [1] [15] |
| Microfluidic Filtration | Size and deformability | Label-free; captures EpCAM-negative CTCs; preserves cell viability | May miss small CTCs; potential clogging | [15] |
| Density Gradient Centrifugation | Cell density | Low cost; simple protocol; suitable for various sample types | Low purity; co-isolation of mononuclear cells | [15] |
Exosomes and Extracellular Vesicles (EVs)
Biological Significance and Clinical Utility
Exosomes are a subtype of extracellular vesicles (EVs) with a diameter of 40-160 nm, released by nearly all cell types through the endosomal pathway [17]. They are formed within multivesicular bodies (MVBs) and secreted upon fusion of MVBs with the plasma membrane. Tumor-derived exosomes play crucial roles in intercellular communication, mediating processes such as pre-metastatic niche formation, angiogenesis, and immune suppression by transferring bioactive molecules—including proteins, DNA, mRNA, and non-coding RNA—to recipient cells [17] [13].
As liquid biopsy biomarkers, exosomes offer several distinct advantages:
- High Abundance: Found in high concentrations (up to 10^9 particles/mL) in biofluids, facilitating isolation [17].
- Inherent Stability: Their lipid bilayer membrane protects molecular cargo from degradation, allowing for easier storage and analysis [17].
- Rich Cargo: They carry a diverse molecular snapshot of the parent cell, including proteins (e.g., CD63, CD81, CD9, tumor-specific antigens) and nucleic acids that reflect the tumor's genetic and phenotypic state [17] [13].
- Representation of Living Cells: Unlike ctDNA, which is largely derived from apoptotic or necrotic cells, exosomes are actively secreted by living cells, providing complementary information [17].
Clinically, exosomal cargo analysis is being investigated for:
- Early Diagnosis: Detection of cancer-specific proteins (e.g., Glypican-1 for pancreatic cancer) or nucleic acids [17].
- Disease Monitoring: Tracking changes in exosomal miRNA or protein profiles to monitor therapy response and disease progression [17] [13].
Experimental Protocols for Exosome Isolation and Analysis
A critical challenge in exosome research is their isolation with high purity and yield, given their nanoscale size and heterogeneity.
Isolation and Enrichment Techniques:
- Ultracentrifugation (Gold Standard):
- Differential Ultracentrifugation Protocol:
- Centrifuge biofluid (e.g., cell culture supernatant or plasma) at 300 × g for 10 min to remove cells.
- Centrifuge supernatant at 2,000 × g for 20 min to remove dead cells and debris.
- Centrifuge supernatant at 10,000 × g for 30 min to pellet larger vesicles/microvesicles.
- Centrifuge the resulting supernatant at high speed (100,000-120,000 × g) for 70-120 min at 4°C to pellet exosomes.
- Wash the pellet in a large volume of PBS and repeat the high-speed centrifugation to improve purity [17].
- Density Gradient Ultracentrifugation: A variation that yields higher purity by layering the sample on a sucrose or iodixanol density gradient and centrifuging. Exosomes band at a characteristic density of 1.13-1.19 g/mL [17].
- Differential Ultracentrifugation Protocol:
Size-Exclusion Chromatography (SEC):
- Principle: Separates particles based on hydrodynamic volume as they pass through a porous polymer matrix (e.g., Sepharose CL-2B).
- Protocol: Load the sample onto a pre-packed SEC column. Larger particles (like exosomes) elute first as they cannot enter the pores, while smaller soluble proteins elute later. This method preserves vesicle integrity and biological activity [17].
Precipitation-Based Kits:
- Principle: Uses volume-excluding polymers (e.g., polyethylene glycol) to precipitate exosomes out of solution.
- Protocol (e.g., ExoQuick): Mix the biofluid with the precipitation solution, incubate overnight at 4°C, and centrifuge at low speed (e.g., 1,500 × g) to pellet the exosomes. While simple and high-yield, this method often co-precipitates non-exosomal contaminants like lipoproteins [17].
Characterization and Cargo Analysis:
- Nanoparticle Tracking Analysis (NTA): Determines particle size distribution and concentration by tracking the Brownian motion of vesicles in suspension with a laser microscope.
- Transmission Electron Microscopy (TEM): Provides visual confirmation of exosome morphology (cup-shaped vesicles) and ultrastructure.
- Western Blotting: Confirms the presence of exosomal marker proteins (e.g., CD9, CD63, CD81, Alix, TSG101) and the absence of negative markers (e.g., GM130 for Golgi apparatus).
- Cargo Profiling:
- RNA Analysis: Isolate total RNA from exosome lysates using phenol-chloroform (TRIzol) methods. Analyze miRNAs or mRNAs via RNA sequencing or RT-qPCR.
- Proteomic Analysis: Identify proteins by digesting exosomal proteins with trypsin and analyzing peptides by liquid chromatography-tandem mass spectrometry (LC-MS/MS).
Figure 2: Exosome Isolation and Analysis Workflow. The primary methods for isolating exosomes from biofluids and the subsequent characterization and analytical steps.
Table 2: Comparison of Major Exosome Isolation Techniques
| Method | Principle | Advantages | Limitations | References |
|---|---|---|---|---|
| Ultracentrifugation | Sequential centrifugation based on size/density | Considered the gold standard; high yield; no requirement for specialized kits | Time-consuming; requires expensive equipment; potential for vesicle damage/aggregation | [17] |
| Size-Exclusion Chromatography (SEC) | Separation by hydrodynamic volume | High purity; preserves vesicle integrity and function; good for downstream functional studies | Sample dilution; requires specialized columns; lower resolution for similar-sized particles | [17] |
| Polymer-Based Precipitation | Precipitation using volume-excluding polymers | Simple and fast protocol; high yield; suitable for small volumes | Co-precipitation of contaminants (e.g., lipoproteins); can interfere with downstream analysis | [17] |
Integrated Comparison and Clinical Context
Comparative Analysis of Key Biomarkers
The three core analytes of liquid biopsy provide complementary information, and their combined analysis can offer a more comprehensive picture of the tumor landscape than any single marker alone.
Table 3: Comprehensive Comparison of ctDNA, CTCs, and Exosomes in Liquid Biopsy
| Feature | ctDNA | CTCs | Exosomes |
|---|---|---|---|
| Biological Origin | Apoptosis, necrosis, active release [1] [13] | Shedding from primary/metastatic tumors [1] | Active secretion via MVB pathway [17] |
| Analytical Target | Tumor-specific genetic/epigenetic alterations | Whole live cells | Proteins, nucleic acids, lipids within vesicles |
| Approximate Abundance | 0.1-1.0% of total cfDNA [1] | 1-10 cells per 10 mL blood [1] | Up to 10^9 particles/mL biofluid [17] |
| Half-Life | ~114 minutes [13] | 1-2.5 hours [1] | Long; stable in circulation [17] |
| Key Advantages | Short half-life allows real-time monitoring; broad representation of tumor heterogeneity; well-suited for NGS | Provides intact cells for functional studies, culture, and comprehensive -omics profiling; direct link to metastasis | Highly stable; abundant; rich cargo reflecting active tumor processes; potential for multi-analyte detection |
| Key Limitations | Very low concentration in early-stage disease; cannot determine cell viability | Extremely rare; technically challenging isolation; heterogeneous EpCAM expression complicates capture [14] | Standardization of isolation is challenging; cargo analysis is complex; tumor-specific origin can be difficult to prove |
| Primary Clinical Applications | MRD detection, therapy selection, monitoring resistance | Prognostic stratification, studying metastasis biology | Biomarker discovery, early detection, monitoring therapy response |
The Scientist's Toolkit: Essential Research Reagents and Kits
Table 4: Key Research Reagent Solutions for Liquid Biopsy
| Reagent/Kits | Primary Function | Example Products/Brands | Key Considerations |
|---|---|---|---|
| cfDNA Blood Collection Tubes | Stabilizes nucleated blood cells to preserve cfDNA profile post-phlebotomy | Streck Cell-Free DNA BCT; PAXgene Blood ccfDNA Tubes | Critical for pre-analytical standardization; enables sample shipping. |
| cfDNA/Exosome Extraction Kits | Isolation of high-purity, high-yield cfDNA or exosomes from plasma/serum | QIAamp Circulating Nucleic Acid Kit (Qiagen); exoRNeasy Serum/Plasma Kit (Qiagen); Total Exosome Isolation Kits (Invitrogen) | Choice depends on starting volume, downstream application (e.g., NGS, RNA-seq), and required purity. |
| CTC Enrichment Systems | Enrichment of rare CTCs from whole blood | CellSearch System (Menarini); Parsortix System (Angle); ClearCell FX System (Biolidics) | Selection depends on need for label-free vs. epitope-dependent capture and downstream analysis (enumeration vs. molecular). |
| Library Prep Kits for NGS | Preparation of sequencing libraries from low-input/ degraded cfDNA or single CTCs | AVENIO ctDNA Analysis Kits (Roche); Oncomine Pan-Cancer Cell-Free Assay (Thermo Fisher); SMARTer Ultra Low Input RNA Kit (Takara Bio) | Optimized for low-input samples; often include integrated workflows for hybrid-capture or amplicon-based targeted sequencing. |
| ddPCR Assays | Ultra-sensitive detection and absolute quantification of known mutations | Bio-Rad ddPCR Mutation Detection Assays; Qiagen ddPCR Supermix | Offers high sensitivity and specificity for validating NGS findings or monitoring specific mutations. |
The paradigm of cancer diagnostics is shifting from a reliance on single-site tissue biopsies toward a more dynamic and comprehensive approach that integrates liquid biopsy. Each of the three key analytical targets—ctDNA, CTCs, and exosomes—provides unique and complementary insights into tumor biology. ctDNA excels in tracking tumor burden and genetic evolution for therapy guidance and MRD monitoring. CTCs offer an unparalleled opportunity to study the mechanisms of metastasis and perform functional analyses. Exosomes provide a stable and information-rich snapshot of active cellular processes, holding great promise for early detection and biomarker discovery.
The choice between liquid and tissue biopsy, or more aptly, their strategic integration, depends on the clinical or research question. Tissue biopsy remains indispensable for initial diagnosis and histopathological classification. In contrast, liquid biopsy shines in scenarios requiring serial monitoring, assessing overall tumor heterogeneity, and when tissue is inaccessible or insufficient. Future advancements will focus on standardizing isolation and analytical protocols, validating these biomarkers in large prospective clinical trials, and leveraging artificial intelligence to integrate multi-analyte liquid biopsy data with clinical and imaging information. As the technology matures, a multi-modal liquid biopsy approach, simultaneously analyzing ctDNA, CTCs, and exosomes, is poised to become a cornerstone of precision oncology, enabling truly personalized and dynamic cancer management.
Tumor heterogeneity represents a fundamental characteristic of cancer that profoundly impacts diagnosis, treatment, and patient outcomes. This complexity manifests across multiple dimensions: spatial heterogeneity occurs both between different tumor sites (inter-lesional) and within individual tumors (intra-lesional), while temporal heterogeneity emerges as tumors evolve over time through clonal evolution under selective pressures such as therapy [18] [19]. The clinical consequences of this heterogeneity are significant, often leading to mixed treatment responses where some lesions regress while others progress, and ultimately contributing to therapeutic resistance and disease recurrence [18]. Understanding and addressing this heterogeneity has become a central challenge in oncology, driving the development of advanced technologies that can more comprehensively capture the dynamic molecular landscape of tumors throughout disease progression.
The emergence of sophisticated profiling technologies has revealed that heterogeneity extends beyond genetic variations to encompass epigenetic, transcriptomic, proteomic, and metabolic diversity within tumor ecosystems [19]. This multidimensional heterogeneity develops through complex evolutionary processes influenced by selective pressures in the tumor microenvironment (TME). The spatial organization of different cell types—including malignant cells, immune populations, and stromal components—creates specialized niches that drive disease progression and therapeutic resistance [20]. As we advance our understanding of these dynamics, the integration of novel analytical approaches and sampling methods has become essential for addressing the clinical challenges posed by heterogeneous tumors.
Technical Approaches: Mapping Heterogeneity Through Advanced Methodologies
Tissue-Based Spatial Profiling Technologies
Conventional tissue biopsy, while remaining the gold standard for cancer diagnosis, provides only a limited snapshot of a tumor's molecular landscape and often fails to capture its full heterogeneity due to sampling bias [18] [1]. To address this limitation, advanced spatial omics technologies have emerged that enable comprehensive molecular characterization while preserving crucial spatial context.
Spatial Transcriptomics (ST) technologies represent a groundbreaking approach for analyzing gene expression patterns within their native tissue architecture. The Visium HD platform from 10x Genomics exemplifies recent advances, offering single-cell-scale resolution through a dramatically increased oligonucleotide barcode density (~11 million continuous 2-µm features in a 6.5 × 6.5-mm capture area) compared to previous iterations [20]. This platform maintains high sensitivity and spatial accuracy, with studies demonstrating that 98.3-99% of transcripts localize to their expected morphological locations [20]. Other prominent technologies include STOmics (BGI), Curio Seeker (Curio Bioscience), and imaging-based approaches such as MERFISH and seqFISH+ that enable highly multiplexed mRNA quantification at subcellular resolution [19].
Spatial Multi-omics platforms now facilitate the simultaneous measurement of diverse molecular features from the same tissue section. Methods such as MISAR-seq enable combined chromatin accessibility and transcriptome analysis, while SPOTS supports simultaneous proteomics and transcriptomics profiling [19]. These integrated approaches provide unprecedented insights into the complex relationships between different molecular layers within the spatial context of tumors.
Table 1: Advanced Spatial Profiling Technologies for Tumor Heterogeneity Assessment
| Technology | Resolution | Molecular Targets | Key Applications | Sample Compatibility |
|---|---|---|---|---|
| Visium HD | 2-µm bins (scalable to 8/16-µm) | Whole transcriptome | Cellular mapping, TME characterization | FFPE, Fresh Frozen |
| MERFISH/seqFISH+ | Subcellular | 100-10,000+ RNAs | Subcellular localization, cell typing | Fresh Frozen |
| DBiT-seq | 10-µm | Transcriptome + Proteome | Multi-omics integration | FFPE |
| CosMx SMI | Subcellular | 6000 RNAs + 64 proteins | High-plex spatial phenotyping | FFPE |
| SPOTS | Cellular | Proteins + Transcripts | Cell-cell interactions | Fresh Frozen |
Liquid Biopsy Approaches for Temporal Monitoring
Liquid biopsy has emerged as a complementary approach that addresses limitations of tissue sampling by providing a minimally invasive method for capturing tumor heterogeneity through analysis of circulating biomarkers [1]. This approach enables real-time monitoring of tumor evolution and detection of resistance mechanisms that may be missed by single-site tissue biopsies [18].
Circulating Tumor DNA (ctDNA) analysis represents the most widely adopted liquid biopsy modality. ctDNA consists of short DNA fragments (approximately 20-50 base pairs) released into the bloodstream through processes such as apoptosis and necrosis, comprising approximately 0.1-1.0% of total cell-free DNA in cancer patients [1]. Next-generation sequencing (NGS) panels targeting cancer-associated genes can detect mutations with sensitivities below 0.1% variant allele frequency (VAF), enabling monitoring of clonal dynamics and emerging resistance [18]. Studies have demonstrated that ctDNA profiling can identify resistance mutations absent in matched tissue biopsies in up to 78% of cases in certain cancer types [18].
Circulating Tumor Cells (CTCs) offer another valuable analyte, though their extreme rarity in peripheral blood (approximately 1 CTC per 1 million leukocytes) presents technical challenges for isolation and analysis [1]. The CellSearch system remains the only FDA-cleared method for CTC enumeration, employing immunomagnetic enrichment based on epithelial cell adhesion molecule (EpCAM) expression [1]. Emerging microfluidic technologies now enable more efficient CTC capture and single-cell analysis, providing insights into metastatic processes.
Table 2: Liquid Biopsy Analytes for Monitoring Tumor Heterogeneity
| Analyte | Source | Half-life | Key Information | Detection Methods |
|---|---|---|---|---|
| ctDNA | Apoptosis/Necrosis | ~2 hours | Mutations, Methylation | NGS, dPCR |
| CTCs | Tumor shedding | 1-2.5 hours | Viable cells, Phenotype | Immunomagnetic, Microfluidics |
| Exosomes | Secretion | Unknown | Proteins, miRNAs, RNAs | Ultracentrifugation, Immunoassay |
| cfRNA | Multiple | Minutes-hours | Gene expression, Fusion | RNA-seq, RT-PCR |
Computational and Analytical Frameworks
The complex multidimensional data generated by spatial and temporal profiling technologies requires sophisticated computational approaches for meaningful interpretation. Artificial intelligence and machine learning algorithms have become indispensable for identifying patterns within high-dimensional datasets, with graph-based neural networks demonstrating particular utility for spatial data analysis [19].
Data integration strategies must address multiple challenges, including batch effects, platform-specific biases, and spatial misalignment. Computational methods are categorized based on reference points: horizontal integration combines identical omics types across slices, vertical integration merges different omics data from the same tissue slice, and diagonal integration addresses the most challenging scenario of different omics types from different tissue slices [19]. Tools such as PASTE employ optimal transport methods to align neighboring tissue slices, while GraphST and STitch3D extend this approach to create unified graphs with 3D spatial coordinates [19].
For liquid biopsy data, clonal decomposition algorithms enable reconstruction of tumor subpopulations from ctDNA mutation profiles, while phylogenetic inference methods model evolutionary relationships between detected variants. These computational approaches are essential for translating complex molecular data into biologically and clinically actionable insights.
Experimental Protocols: Methodologies for Heterogeneity Characterization
Multiregional Tissue Sampling and Spatial Transcriptomics
Protocol: Comprehensive Spatial Heterogeneity Analysis Using Visium HD
Sample Preparation:
- Obtain formalin-fixed paraffin-embedded (FFPE) or fresh frozen tissue sections at 5-10 µm thickness.
- For FFPE samples, perform dewaxing and rehydration followed by hematoxylin and eosin (H&E) staining and imaging.
- Perform tissue permeabilization optimization using a test slide to determine optimal mRNA capture conditions.
- For Visium HD, implement probe hybridization targeting the whole protein-coding transcriptome followed by ligation, tissue removal, and amplification.
Library Preparation and Sequencing:
- Generate libraries using dual-indexed primers with unique molecular identifiers (UMIs).
- Quality control using capillary electrophoresis (e.g., Bioanalyzer) to confirm library size distribution (~200-300 bp).
- Sequence on Illumina platforms (NovaSeq 6000) targeting 50,000-100,000 read pairs per spot.
Data Analysis Workflow:
- Process raw sequencing data through Space Ranger (v3.0) pipeline to generate feature-barcode matrices.
- Perform quality control metrics including genes per spot, counts per spot, and mitochondrial percentage.
- Utilize Seurat or similar packages for normalization, clustering, and differential expression analysis.
- Apply reference-based deconvolution (e.g., Cell2Location) to infer cell type abundances at each spatial location.
- Perform spatial domain identification using graph-based clustering methods.
- Analyze cell-cell communication patterns using tools such as CellChat or NicheNet.
This protocol was successfully applied in a recent colorectal cancer study that identified distinct macrophage subpopulations in different spatial niches with specialized pro-tumor and anti-tumor functions [20].
Longitudinal Liquid Biopsy Monitoring
Protocol: Serial ctDNA Analysis for Temporal Heterogeneity Assessment
Blood Collection and Plasma Processing:
- Collect peripheral blood in cell-stabilizing tubes (e.g., Streck Cell-Free DNA BCT) to prevent genomic DNA contamination.
- Process within 6 hours of collection: centrifuge at 800-1600 × g for 10 minutes to separate plasma.
- Transfer plasma to microcentrifuge tubes and perform high-speed centrifugation at 16,000 × g for 10 minutes to remove residual cells.
- Store plasma at -80°C or proceed immediately to DNA extraction.
Cell-free DNA Extraction and Quantification:
- Extract cfDNA using silica membrane-based kits (e.g., QIAamp Circulating Nucleic Acid Kit).
- Elute in 20-50 µL of low-EDTA TE buffer or nuclease-free water.
- Quantify using fluorometric methods (e.g., Qubit dsDNA HS Assay) and assess fragment size distribution (e.g., Bioanalyzer, TapeStation).
Library Preparation and Target Enrichment:
- Construct sequencing libraries using ligation-based methods with molecular barcoding.
- Perform target enrichment using hybrid capture or amplicon-based approaches targeting cancer-associated genes.
- Amplify libraries with limited cycle PCR (10-14 cycles) to maintain complexity.
Sequencing and Data Analysis:
- Sequence on Illumina platforms with minimum 10,000x raw coverage.
- Process data through bioinformatics pipeline: adapter trimming, alignment, duplicate marking, and base quality recalibration.
- Call variants using specialized tools (e.g., MuTect, VarScan) with UMI error correction.
- Filter variants against population databases and panel-specific noise models.
- Calculate variant allele frequencies and monitor clonal dynamics over time.
This approach enabled a study to demonstrate that ctDNA profiling influenced treatment decisions in 30 patients with diverse solid tumors, facilitating therapy escalation, de-escalation, and early relapse prediction [21].
Comparative Analysis: Integration of Tissue and Liquid Biopsy Modalities
Performance Characteristics and Complementarity
Direct comparisons between tissue and liquid biopsy approaches reveal both complementary strengths and limitations. A comprehensive study analyzing 56 postmortem tissue samples alongside pre-mortem liquid biopsies from 8 patients demonstrated that liquid biopsy identified 51 variants (4-17 per patient, VAFs: 0.2-31.1%), with overlapping mutations between tissue and liquid biopsy ranging from 33% to 92% across patients [18]. Notably, 22 tissue variants were absent in liquid biopsy, while 18 liquid biopsy-exclusive variants were detected (VAFs: 0.2-2.8%), highlighting the complementary nature of these approaches [18].
Clinical validation studies further support this complementarity. A pan-cancer study of a 33-gene ctDNA panel demonstrated 76% sensitivity for Tier I actionable variants compared to matched tissue testing, with actionable variants uniquely detected by ctDNA in 19% of patients with concurrent testing [22]. The addition of ctDNA testing to tissue testing increased the detection of actionable variants by 14.3%, while achieving a 21-day faster turnaround time on average [22].
Table 3: Comparative Performance of Tissue and Liquid Biopsy for Heterogeneity Assessment
| Parameter | Tissue Biopsy | Liquid Biopsy | Complementary Value |
|---|---|---|---|
| Spatial Resolution | Single-site (high) | Systemic (low) | Multi-region tissue + liquid captures broader heterogeneity |
| Temporal Resolution | Single time point | Multiple time points | Liquid enables monitoring of evolution after initial tissue diagnosis |
| Variant Detection Sensitivity | High for sampled region | Variable (0.1-10% VAF) | Liquid detects resistant clones emerging outside sampled region |
| Tumor Fraction Requirements | >10% tumor cells | 0.1-1% ctDNA fraction | Liquid works when tissue quantity/quality insufficient |
| Actionable Variant Detection | 33.3% (Tier I) | 33.3% (Tier I) [22] | Combined approaches increase actionable findings by 14.3% |
| Turnaround Time | 30+ days | ~9 days [22] | Liquid enables faster treatment initiation |
Clinical Utility in Different Cancer Types
The relative performance and utility of tissue versus liquid biopsy approaches varies across cancer types, influenced by factors such as tumor vascularity, metastatic burden, and anatomic location. In colorectal cancer, spatial transcriptomics has revealed distinct immune cell populations and macrophage subpopulations in different tumor regions that correlate with disease progression and potential treatment responses [20]. Simultaneously, ctDNA analysis in colorectal cancer has demonstrated high concordance with tissue testing for key mutations such as KRAS, NRAS, and BRAF, while enabling monitoring of minimal residual disease and emerging resistance [1].
In non-small cell lung cancer (NSCLC), ctDNA testing has received clinical validation for EGFR mutation detection, with guidelines supporting its use when tissue is unavailable [1]. Spatial analyses further reveal how tumor microenvironment organization influences therapeutic responses, with distinct immune niches associated with differential outcomes to immunotherapy [19].
For cancers where tissue biopsy is challenging due to anatomic location, such as pancreatic cancer and cholangiocarcinoma, liquid biopsy demonstrates particular utility. Studies report detectable Tier I or II variants in 65.0% of patients using ctDNA testing, including 54.5% of cholangiocarcinoma cases [22].
Visualization: Analytical Workflows for Heterogeneity Characterization
Spatial and Temporal Profiling Integration Workflow
Research Reagent Solutions: Essential Tools for Heterogeneity Studies
Table 4: Essential Research Reagents for Tumor Heterogeneity Studies
| Reagent Category | Specific Examples | Application | Key Considerations |
|---|---|---|---|
| Spatial Transcriptomics | Visium HD Gene Expression, CosMx SMI Reagents | Whole transcriptome mapping at single-cell scale | FFPE vs. fresh frozen compatibility, resolution requirements |
| Single-cell RNA-seq | 10x Genomics Chromium, Parse Biosciences | Dissecting cellular heterogeneity | Cell viability, input requirements, cost per cell |
| ctDNA Isolation Kits | QIAamp Circulating Nucleic Acid Kit, MagMAX Cell-Free DNA | Plasma cfDNA extraction | Yield, fragment size preservation, inhibitor removal |
| Target Enrichment | Illumina TruSight Oncology, IDT xGen Pan-Cancer | NGS library preparation for liquid biopsy | Coverage uniformity, molecular barcoding, input requirements |
| Immunofluorescence | Multiplex IHC/IF panels (CD3, CD8, CD68, etc.) | Spatial immune contexture characterization | Antibody validation, autofluorescence, signal unmixing |
| Computational Tools | Seurat, Space Ranger, PASTE, GraphST | Spatial data analysis and integration | Programming requirements, scalability, visualization capabilities |
The comprehensive characterization of tumor spatial and temporal heterogeneity represents both a formidable challenge and critical opportunity in cancer research and clinical management. While tissue-based spatial profiling technologies provide unprecedented resolution for understanding cellular organization and microenvironmental interactions, liquid biopsy approaches offer unique capabilities for monitoring evolutionary dynamics and emerging resistance. The integration of these complementary approaches—leveraging their respective strengths while acknowledging their limitations—provides a powerful framework for addressing the complex nature of cancer heterogeneity.
Evidence increasingly supports a synergistic diagnostic paradigm where initial tissue characterization guides spatial understanding of the tumor ecosystem, while serial liquid biopsy monitoring captures the temporal evolution of this ecosystem under therapeutic pressure. This integrated approach has demonstrated clinical utility across multiple dimensions: identifying actionable variants that would be missed by either method alone, enabling dynamic treatment adaptation based on evolving resistance mechanisms, and providing critical insights into the spatial organization of treatment-resistant niches. As technologies continue to advance—with improvements in spatial resolution, analytical sensitivity, and computational integration—the comprehensive assessment of tumor heterogeneity will increasingly inform personalized therapeutic strategies, ultimately improving outcomes for cancer patients.
Within oncology, the diagnostic workflow from sample acquisition to genomic analysis is foundational to precision medicine. This process differs significantly between the established gold standard of tissue biopsy and the minimally invasive approach of liquid biopsy. Each method offers distinct advantages and faces unique pre-analytical challenges that critically impact the success of downstream genomic applications. This guide details the technical protocols and workflows for both methods, providing a framework for their integrated use in comprehensive cancer diagnostics and research.
Sample Acquisition and Pre-Analytical Processing
The initial phase of sample collection and stabilization is critical, as pre-analytical variables directly influence nucleic acid quality and the fidelity of all subsequent genomic data.
Tissue Biopsy Workflow
Tissue biopsy provides a direct histological view of the tumor but involves an invasive collection procedure.
- Sample Acquisition: Tissue is obtained via surgical resection, core needle biopsy, or fine-needle aspiration.
- Fixation: Immediately following collection, tissue is preserved to maintain architecture and prevent degradation. The most common method is formalin fixation and paraffin-embedding (FFPE). While providing excellent morphological preservation, formalin can cause protein cross-linking and nucleic acid fragmentation, which must be addressed in later steps [23] [24].
- Sectioning and Staining: The FFPE block is sectioned into thin slices (4-5 μm) and mounted on glass slides. Hematoxylin and Eosin (H&E) staining is performed for initial pathological assessment. Immunohistochemistry (IHC) may be used to identify specific protein markers (e.g., Cytokeratin 5) for tumor classification [24].
- Macrodissection: A pathologist identifies and demarcates regions of high tumor cell density on the stained slide. This guided enrichment step is often necessary to ensure sufficient tumor content for genomic analysis.
Table 1: Key Steps and Considerations in Tissue Biopsy Processing
| Step | Description | Key Consideration |
|---|---|---|
| Tissue Collection | Surgical or needle-based acquisition of tumor tissue. | Invasiveness of procedure limits repeated sampling. |
| Fixation | Immersion in formalin to create FFPE blocks. | Over-fixation can mask antigens and damage nucleic acids [23]. |
| Sectioning | Slicing FFPE block into thin sections for slides. | Section thickness and adhesion are crucial for quality [24]. |
| Staining & Review | H&E and IHC staining for pathological assessment. | IHC requires careful antibody selection and antigen retrieval [23] [24]. |
| Macrodissection | Manual enrichment of tumor-rich areas from slides. | Essential for achieving adequate tumor purity for sequencing. |
Tissue Biopsy Pre-Analytical Pathway
Liquid Biopsy Workflow
Liquid biopsy analyzes tumor-derived material from body fluids, offering a minimally invasive "real-time" snapshot of tumor heterogeneity [1].
- Sample Acquisition: Blood is drawn into specialized collection tubes. The choice of tube is a major pre-analytical factor [25]:
- K3EDTA Tubes: Require plasma separation within 1-2 hours to prevent leukocyte lysis and contamination of the sample with genomic DNA.
- Cell-Free DNA BCT Streck Tubes: Contain preservatives that stabilize blood cells for up to 14 days at room temperature, allowing for transportation [25].
- Plasma Separation: A two-step centrifugation protocol is critical. An initial low-speed spin separates plasma from blood cells, followed by a high-speed spin to remove residual cells and platelets, yielding cell-free plasma [25].
- Cell-Free Nucleic Acid Extraction: Nucleic acids are isolated from the plasma using commercial kits based on silica-membrane columns or magnetic beads. The yield and purity of cell-free DNA (cfDNA) and RNA (cfRNA) are highly dependent on the extraction method [25].
Table 2: Comparison of Blood Collection Tubes for Liquid Biopsy
| Tube Type | Additive / Mechanism | Storage Conditions | Key Advantage |
|---|---|---|---|
| K3EDTA | Anticoagulant | Plasma must be separated within 1-2 hours at 4°C. | Low cost; no chemical preservatives. |
| Streck | Chemical crosslinking of blood cells | 14 days at Room Temperature [25]. | Excellent for cfDNA stabilization; enables shipping. |
| PAXgene | Biological apoptosis prevention | 14 days at RT; 28 days at 4°C [25]. | Stabilizes both cfDNA and cfRNA. |
| Norgen | Osmotic cell stabilization | 30 days at RT [25]. | High plasma volume and cfDNA yield. |
Liquid Biopsy Pre-Analytical Pathway
Genomic Analysis: From Nucleic Acids to Sequencing
Once nucleic acids are isolated, they are converted into sequencing-ready libraries.
Library Preparation and Target Enrichment
This process fragments the DNA and adds adapter sequences compatible with the sequencing platform.
- Library Construction: Extracted DNA is fragmented (by enzymatic or physical shearing) to a desired size. Adapters containing platform-specific sequences and sample barcodes (for multiplexing) are ligated to the fragments [26].
- Target Enrichment Strategies: For focused analyses, specific genomic regions are isolated.
- Hybridization Capture: Biotinylated probes complementary to regions of interest (e.g., all exons for whole exome sequencing) hybridize with the library, and are then pulled down with streptavidin beads [26].
- Amplicon Sequencing: PCR primers are designed to amplify the specific targeted regions directly [26].
- Quality Control (QC): The final library is quantified and assessed for size distribution using methods like Qubit fluorometry and Bioanalyzer/TapeStation electrophoresis. This step is crucial to ensure libraries are not contaminated and meet the specifications for efficient sequencing [25] [26].
Table 3: Common Next-Generation Sequencing (NGS) Types and Applications
| Sequencing Type | Target | Common Application in Oncology |
|---|---|---|
| Whole Genome (WGS) | Entire genome | Discovery of novel mutations, structural variants. |
| Whole Exome (WES) | Protein-coding exons | Identifying coding region mutations across the genome. |
| Targeted Panel | Selected genes (e.g., 50-500 genes) | Cost-effective profiling of known cancer drivers; ideal for liquid biopsy [18]. |
| RNA-Seq | Transcriptome | Gene expression, fusion genes, alternative splicing. |
| Methylation Seq | Genome-wide methylation | Epigenetic profiling; early detection biomarkers [27]. |
Analysis of Liquid Biopsy-Specific Features
Liquid biopsy analyses leverage unique properties of circulating tumor DNA (ctDNA).
- Variant Calling: Specialized bioinformatics pipelines are required to identify low-frequency somatic mutations (e.g., at an allele frequency of 0.1%) against a high background of wild-type DNA from leukocytes [18]. Digital PCR (dPCR) and droplet digital PCR (ddPCR) are also widely used for ultra-sensitive detection of known mutations [25].
- Fragmentomics: ctDNA has a characteristic fragmentation pattern around nucleosomes (peaking at ~166 bp). Tumors can alter this pattern, and shorter fragments are often enriched for tumor-derived DNA, providing an orthogonal method for detection [25] [27].
- Methylation Analysis: Bisulfite treatment of cfDNA converts unmethylated cytosines to uracils, allowing sequencing to distinguish them from methylated cytosines. Cancer-specific hypermethylation of gene promoters (e.g., CDKN2A, RASSF1A) is a stable and early epigenetic biomarker used for cancer detection and classification [27] [28].
Integrated Analysis and Clinical Translation
A single biopsy type provides a limited view. Integrating data from multiple sources offers a more complete picture of tumor heterogeneity.
- Concordance and Discordance: The ROME trial demonstrated that combining tissue and liquid biopsies increased the detection of actionable alterations by over 60% compared to either method alone. However, concordance for the same alteration was only 49%, with 35% detected only in tissue and 16% only in liquid biopsy [29]. This discordance reflects spatial heterogeneity.
- Capturing Heterogeneity: Postmortem studies comparing multiple metastatic lesions to a single liquid biopsy show that while liquid biopsy captures a broad spectrum of mutations present across different tumor sites (overlap of 33–92%), it can miss some subclonal populations and detect others not found in a single tissue sample [18]. This underscores the complementary nature of both approaches.
- Clinical Utility: The ROME trial further showed that patients receiving targeted therapy based on an alteration found in both tissue and liquid biopsy had significantly improved overall survival (11.1 vs. 7.7 months) compared to standard-of-care, highlighting the power of an integrated diagnostic approach [29].
Integrating Biopsy Data for a Comprehensive View
The Scientist's Toolkit: Essential Research Reagents and Kits
Table 4: Key Reagents and Kits for the Diagnostic Workflow
| Item | Function | Example Application |
|---|---|---|
| FFPE Tissue Sections | Preserved tissue for histology and nucleic acid source. | Gold standard for diagnosis; DNA source for tissue NGS. |
| Streck/PAXgene Blood Tubes | Stabilize blood cells and nucleic acids during transport. | Essential for reproducible liquid biopsy sampling [25]. |
| Silica-Membrane/ Magnetic Bead Kits | Isolate and purify nucleic acids from tissue or plasma. | Extracting high-quality DNA/RNA from various sample types [25] [26]. |
| IHC Antibodies (RTU) | Ready-to-Use antibodies for specific protein detection. | Tumor classification (e.g., Cytokeratin, EpCAM) [24]. |
| NGS Library Prep Kit | Fragment DNA and attach sequencing adapters. | Preparing samples for all sequencing applications [26]. |
| Hybridization Capture Probes | Enrich specific genomic regions for targeted sequencing. | Isolating exomes or cancer gene panels from a library [26]. |
| Bisulfite Conversion Kit | Chemically converts unmethylated cytosine to uracil. | Enabling DNA methylation analysis by sequencing [27]. |
Technological Platforms and Translational Applications in Clinical Trials and Drug Development
The shift toward precision oncology necessitates highly sensitive and reliable methods for detecting molecular biomarkers. While tissue biopsy has long been the gold standard for tumor genotyping, its invasive nature, inability to capture full tumor heterogeneity, and impracticality for serial monitoring present significant limitations [9]. Liquid biopsy, the analysis of tumor-derived components such as circulating tumor DNA (ctDNA) from blood, offers a minimally invasive alternative that can provide a comprehensive view of the tumor's molecular landscape and enable dynamic monitoring of treatment response and resistance [9] [30].
The clinical utility of liquid biopsy hinges on the performance of the detection technologies employed. This whitepaper provides an in-depth technical guide to three cornerstone platforms for ctDNA analysis: droplet digital PCR (ddPCR), BEAMing, and Next-Generation Sequencing (NGS). We frame this discussion within the broader thesis of liquid versus tissue biopsy research, highlighting how each technology's unique capabilities and limitations can be leveraged to advance cancer research and drug development.
The selection of an appropriate detection platform depends on the specific research or clinical question, weighing factors such as required sensitivity, breadth of genomic coverage, throughput, and cost.
Table 1: Core Characteristics of ddPCR, BEAMing, and NGS Assays
| Feature | ddPCR | BEAMing | NGS (Targeted Panels) |
|---|---|---|---|
| Core Principle | Partitioning of PCR reactions into nanoliter droplets for absolute quantification [31] | Beads, Emulsification, Amplification, and Magnetics; combines flow cytometry with PCR [32] [31] | Massively parallel sequencing of millions of DNA fragments simultaneously [33] [34] |
| Detection Sensitivity | ~0.1% Mutant Allele Frequency (MAF) [31] | ~0.03% MAF [32] [35] | ~0.1% - 0.5% MAF (can be lower with advanced error-correction) [32] [30] |
| Typical Input | ~8 µL cfDNA per reaction [32] | ~123 µL cfDNA [32] | ~10 µL cfDNA (highly variable by protocol) [32] |
| Throughput | Medium to High (multiple samples, limited targets per run) [31] | Medium [31] | Very High (multiplexing of many samples and targets) [33] [34] |
| Breadth of Target | Low (targets single or a few pre-defined mutations) [31] | Low to Medium (panels for ~34 pre-defined mutations, e.g., OncoBEAM-RAS-CRC) [32] | Very High (can interrogate dozens to hundreds of genes, including SNVs, indels, CNAs, fusions) [32] [34] [36] |
| Data Output | Absolute quantification of target molecules; digital readout (positive/negative droplets) [31] | Absolute quantification of target molecules; digital readout [32] | Sequencing reads (FASTQ); requires sophisticated bioinformatics analysis [33] [34] |
| Key Advantage | High sensitivity for known mutations; cost-effective; rapid turnaround [31] [36] | Extremely high sensitivity for known mutations; high specificity [32] | Comprehensive, hypothesis-free profiling; detects novel and co-occurring alterations [32] [36] |
| Primary Limitation | Limited to known mutations; low multiplexing capability [36] | Limited to known mutations; higher cost per sample than ddPCR [31] | Higher cost per sample for limited targets; complex data analysis; longer turnaround [32] |
Table 2: Cross-Platform Performance in Clinical Validation Studies
| Study Context | Technology | Sensitivity (%) | Specificity (%) | Positive Predictive Value (PPV, %) | Negative Predictive Value (NPV, %) |
|---|---|---|---|---|---|
| mCRC (vs. FFPE) [32] [35] | ddPCR | 47 | 77 | 70 | 55 |
| BEAMing | 93 | 69 | 78 | 90 | |
| NGS (56-gene panel) | 73 | 77 | 79 | 71 | |
| Lung Cancer (vs. ddPCR) [30] | NGS (MAPs error-correction) | 98.5 | 98.9 | N/R | N/R |
| mCRC (Dynamic Monitoring) [36] | NGS (vs. ddPCR) | 87.5 | 100 | N/R | N/R |
Detailed Experimental Protocols
Sample Collection and Processing for Liquid Biopsy
A standardized pre-analytical workflow is critical for reliable ctDNA analysis [32].
- Blood Collection: Blood is drawn into cell-stabilizing tubes (e.g., Cell-free DNA BCT tubes from Streck) to prevent genomic DNA contamination and preserve ctDNA [31].
- Plasma Isolation: A two-step centrifugation protocol is performed. First, a low-speed spin (e.g., 10 min at 1,700× g) to separate cellular components from plasma, followed by a high-speed spin (e.g., 10 min at 20,000× g) to remove any residual cells or debris [31].
- cfDNA Extraction: Cell-free DNA (cfDNA) is isolated from the plasma using commercial kits (e.g., QIAsymphony Circulating DNA Kit). The extracted cfDNA is typically eluted in a low-volume buffer (e.g., 60 µL) to maximize concentration [31].
- Quality Control and Quantification: The concentration and fragment size distribution of the extracted cfDNA are assessed using fluorometric methods (e.g., Qubit) and bioanalyzers (e.g., Agilent 2100 BioAnalyzer) [32] [31].
Core Detection Workflows
ddPCR Protocol
The following protocol uses the Bio-Rad ddPCR system and a KRAS screening kit as an example [31].
- Reaction Mixture Setup: A 22µL PCR reaction is prepared containing the cfDNA sample (e.g., 8µL), the ddPCR KRAS G12/G13 Screening Multiplex Assay (2µL), and ddPCR Supermix for Probes (no dUTP, 22µL).
- Droplet Generation: The reaction mixture is loaded into a DG8 cartridge along with droplet generation oil and placed in the QX100/QX200 Droplet Generator. This partitions the sample into approximately 20,000 nanoliter-sized droplets.
- PCR Amplification: The emulsion is transferred to a 96-well plate and sealed. PCR is run to endpoint using a standard thermal cycler with a protocol optimized for the assay.
- Droplet Reading and Analysis: The plate is transferred to a Droplet Reader, which streams each droplet past a fluorescence detector. The reader counts the number of fluorescence-positive (mutant) and negative (wild-type) droplets for each target.
- Data Interpretation and Quantification: Software (e.g., QuantaSoft) applies a dynamic limit of blank (LoB) based on a pre-determined false-positive rate to distinguish true mutant signals from background noise. The mutant allele frequency is calculated using a Poisson-based algorithm to provide absolute quantification [31].
BEAMing Protocol
BEAMing (Beads, Emulsification, Amplification, and Magnetics) is a highly sensitive technology that combines emulsion PCR with flow cytometry [32] [31].
- Primer-Bead Preparation: Magnetic beads coated with primers specific to the target mutations (e.g., KRAS mutations in the OncoBEAM-RAS-CRC assay) are prepared.
- Emulsion PCR: The beads are mixed with the cfDNA sample and PCR reagents. This mixture is emulsified in oil to create millions of microreactors, each containing a single bead and a single DNA molecule.
- Amplification and Hybridization: Within each microreactor, the DNA template is amplified onto the bead's surface. The emulsion is then broken, and the beads are collected.
- Fluorescence Labeling and Detection: The beads are incubated with fluorescently labeled probes specific for wild-type and mutant sequences. Beads that have amplified a mutant sequence will bind the mutant probe and fluoresce.
- Flow Cytometry Analysis: The beads are run through a flow cytometer to count the number of beads carrying wild-type versus mutant sequences. This digital counting provides extremely sensitive quantification, with detection thresholds as low as 0.03% mutant allele frequency [32].
Targeted NGS Protocol for ctDNA
The NGS workflow is more complex, involving library preparation, target enrichment, and sophisticated bioinformatics [33] [34].
- Library Preparation: The cfDNA fragments are end-repaired, A-tailed, and ligated to platform-specific sequencing adaptors. These adaptors contain unique molecular indices (UMIs, also called barcodes) that tag each original DNA molecule, allowing for the bioinformatic correction of PCR amplification errors and sequencing errors in downstream analysis [30] [34].
- Target Enrichment: The genomic regions of interest (e.g., a 56-gene oncology panel) are isolated from the library. This is typically done via amplicon-based (using targeted PCR primers) or hybridization-capture methods (using biotinylated probes that hybridize to the target regions, which are then pulled down with streptavidin beads) [34].
- Sequencing: The enriched libraries are loaded onto a sequencing platform (e.g., Illumina). The technology utilizes sequencing-by-synthesis (SBS) chemistry, where fluorescently labeled nucleotides are incorporated and imaged in a massively parallel fashion, generating millions to billions of sequence reads [33].
- Bioinformatic Analysis: The raw sequencing data (FASTQ files) undergoes a multi-step computational pipeline:
- Base Calling and Demultiplexing: Determining the nucleotide sequence for each read and assigning reads to their sample of origin.
- Read Alignment: Mapping the sequence reads to a reference human genome (e.g., GRCh37/hg19).
- Variant Calling: Identifying somatic mutations (SNVs, indels) by comparing the sequence data to a matched normal sample or using error-suppression models. The UMI tags are used to group reads originating from the same original molecule, enabling the distinction of true low-frequency variants from technical artifacts [30] [34].
- Annotation and Interpretation: Determining the biological and potential clinical significance of the identified variants.
The Scientist's Toolkit: Essential Research Reagents and Materials
Table 3: Key Reagents and Materials for ctDNA Analysis
| Item | Function | Example Products/Catalog Numbers |
|---|---|---|
| Cell-free DNA Blood Collection Tubes | Preserves blood sample by preventing leukocyte lysis and release of genomic DNA during storage and transport. | Streck Cell-Free DNA BCT Tubes [31] |
| cfDNA Extraction Kit | Isulates and purifies cell-free DNA from plasma samples. | QIAsymphony Circulating DNA Kit (Qiagen) [31] |
| Digital PCR System & Assays | Partitioning, amplification, and digital readout for absolute quantification of specific mutations. | Bio-Rad QX200/QX600 systems; ddPCR Mutation Detection Assays [31] |
| BEAMing Assay Kits | Complete reagent set for highly sensitive, flow cytometry-based detection of predefined mutations. | Sysmex Inostics' OncoBEAM kits (e.g., OncoBEAM-RAS-CRC) [32] [31] |
| NGS Library Prep Kit | Prepares cfDNA for sequencing by adding adapters and sample barcodes. | Illumina DNA Prep kits; Swift Biosciences Accel-Amplicon Panels [32] |
| Targeted Gene Panels | Set of probes or primers to enrich specific genomic regions of interest prior to NGS. | Illumina TruSight Panels; FoundationOne CDx; custom panels [32] [34] |
| Bioinformatic Analysis Pipelines | Software for sequence alignment, variant calling, and annotation of NGS data. | GATK; VarScan; Sophia DDM; custom in-house pipelines [34] |
Clinical and Research Applications in Liquid Biopsy Context
The complementary strengths of ddPCR, BEAMing, and NGS make them suitable for different applications within the liquid biopsy paradigm.
ddPCR and BEAMing for Ultrasensitive Monitoring: These technologies excel in longitudinal monitoring of known resistance mutations. For example, the emergence of a KRAS mutation in a colorectal cancer patient on anti-EGFR therapy can be detected in plasma weeks before radiographic progression [32] [36]. BEAMing's superior sensitivity (0.03% vs. 0.1-0.5% for NGS) is particularly valuable for detecting minimal residual disease (MRD) or early-stage cancer [32].
NGS for Comprehensive Profiling and Discovery: NGS is indispensable at diagnosis or progression to identify the full spectrum of actionable alterations (e.g., in EGFR, ALK, BRAF, KRAS, MET) across a large gene panel from a single test [32] [34]. It can reveal co-mutation patterns and tumor mutation burden (TMB), which is crucial for guiding immunotherapy. Studies show NGS can detect additional actionable mutations missed by tissue biopsy or targeted plasma tests, directly impacting treatment decisions [30] [36].
The Synergy of Combined Profiling: The ROME trial demonstrated that treatment guided by the concordant detection of an actionable alteration in both tissue and liquid biopsy led to significantly improved overall survival (11.05 vs. 7.7 months) and progression-free survival (4.93 vs. 2.8 months) compared to standard of care [4]. This underscores that tissue and liquid biopsies are complementary, not competing, modalities. Liquid biopsy can capture heterogeneity missed by a single tissue biopsy, while tissue provides histopathological context and can detect alterations in tumors that shed little ctDNA.
ddPCR, BEAMing, and NGS each occupy a critical niche in the advanced detection technology ecosystem. ddPCR offers a rapid, cost-effective, and highly sensitive solution for tracking known mutations. BEAMing provides an even higher level of sensitivity for applications requiring the utmost detection limits. NGS delivers a broad, hypothesis-free exploratory platform for comprehensive genomic profiling.
The choice among them is not a matter of identifying a single "best" technology, but rather of strategically deploying the right tool for the specific research or clinical objective. For drug development professionals and researchers, the future lies in integrated approaches that leverage the strengths of all three platforms, combined with traditional tissue analysis, to build a complete and dynamic molecular picture of cancer. This multi-modal approach is fundamental to advancing personalized oncology and improving patient outcomes.
Application in Early Cancer Detection and Multi-Cancer Screening
Liquid biopsy represents a paradigm shift in oncology, offering a minimally invasive approach for early cancer detection and multi-cancer screening. This whitepaper examines the technical foundations, current methodologies, and clinical applications of liquid biopsy technologies, contrasting them with traditional tissue biopsy within the framework of precision oncology. We provide a comprehensive analysis of circulating biomarkers, experimental protocols, and analytical validation frameworks that enable comprehensive genomic profiling from blood samples. With demonstrated sensitivities reaching 58.4% for multi-cancer detection across 14 cancer types and specificity of 92.0% in recent large-scale validations, liquid biopsy technologies are poised to transform cancer screening paradigms, particularly for tumors that are challenging to detect through conventional methods.
Cancer remains a leading cause of mortality worldwide, with early detection representing a critical factor in improving survival outcomes. Traditional tissue biopsy has long been the gold standard for cancer diagnosis, offering high laboratory standardization, consistent results, and accurate pathological assessment [1]. However, tissue biopsy presents significant limitations including invasiveness, sampling bias due to tumor heterogeneity, inability to perform serial monitoring, and practical challenges in obtaining samples from certain anatomical locations [1] [9].
Liquid biopsy has emerged as a complementary approach that addresses these limitations through the analysis of tumor-derived components circulating in bodily fluids. By capturing tumor heterogeneity and enabling real-time monitoring of disease progression, liquid biopsy provides a dynamic view of the tumor landscape that single-site tissue biopsies cannot offer [1] [9]. The minimally invasive nature of liquid biopsy facilitates repeated sampling, making it particularly valuable for tracking tumor evolution during treatment and detecting minimal residual disease.
Molecular Foundations of Liquid Biopsy
Liquid biopsy encompasses several classes of tumor-derived biomarkers, each with distinct characteristics and clinical applications. The most extensively validated biomarkers include circulating tumor DNA (ctDNA), circulating tumor cells (CTCs), and extracellular vesicles (EVs).
Circulating Tumor DNA (ctDNA)
CtDNA consists of fragmented DNA molecules released into the circulation through apoptosis, necrosis, and active secretion from tumor cells. These fragments typically range from 20-50 base pairs in length and represent approximately 0.1-1.0% of total cell-free DNA (cfDNA) in cancer patients [1]. The half-life of ctDNA is relatively short (approximately 1-2.5 hours), enabling real-time assessment of tumor burden [1].
CtDNA carries the same genetic and epigenetic alterations as the parent tumor, including single nucleotide variants (SNVs), insertions/deletions (indels), copy number variations (CNVs), gene fusions, and methylation patterns. This molecular information provides critical insights for cancer detection, monitoring, and treatment selection [1] [7].
Circulating Tumor Cells (CTCs)
CTCs are intact tumor cells shed into the bloodstream from primary or metastatic sites. First identified in 1869 by Thomas Ashworth, CTCs are exceptionally rare in peripheral blood, with approximately 1 CTC per 1 million leukocytes [1]. Despite their low abundance, CTCs play a crucial role in the metastatic cascade and serve as valuable biomarkers for prognosis and treatment response assessment [1].
The CellSearch system remains the only FDA-cleared method for CTC enumeration, demonstrating prognostic value in breast, colorectal, and prostate cancers [1]. Emerging technologies are focusing on improving CTC capture efficiency and enabling molecular characterization of isolated cells.
Extracellular Vesicles and Other Biomarkers
Tumor-derived extracellular vesicles, including exosomes, contain proteins, nucleic acids, and lipids that reflect the molecular composition of their parent cells. Other promising liquid biopsy biomarkers include cell-free RNA (cfRNA), tumor-educated platelets (TEPs), and circulating microRNAs [9]. Each biomarker class offers complementary information, and multi-analyte approaches are increasingly being developed to enhance diagnostic sensitivity.
Table 1: Comparison of Liquid Biopsy Biomarkers
| Biomarker | Composition | Approximate Abundance | Primary Applications | Technical Challenges |
|---|---|---|---|---|
| CtDNA | Fragmented tumor DNA | 0.1-1.0% of cfDNA | Early detection, treatment monitoring, minimal residual disease | Low abundance in early-stage disease |
| CTCs | Intact tumor cells | 1 cell per 10^6 leukocytes | Prognostic assessment, metastasis research | Extreme rarity, isolation complexity |
| Extracellular Vesicles | Proteins, nucleic acids, lipids | Variable | Tumor subtyping, drug resistance monitoring | Standardization of isolation methods |
| cfRNA | Various RNA species | Variable | Gene expression profiling, fusion detection | RNA stability and degradation |
Technical Methodologies and Workflows
Sample Collection and Processing
Proper sample collection and processing are critical for reliable liquid biopsy results. Blood samples (typically 2-10 mL) are collected in specialized tubes containing preservatives that prevent nucleic acid degradation and stabilize blood cells [37]. Plasma separation via centrifugation must be performed within specified timeframes (usually within 4-6 hours of collection) to minimize background cfDNA release from hematopoietic cells.
Following plasma separation, nucleic acid extraction is performed using commercial kits optimized for recovery of short DNA fragments. Quality control measures include quantification of total cfDNA and assessment of fragment size distribution to ensure sample integrity [7].
Analytical Platforms for Liquid Biopsy
Next-generation sequencing (NGS) technologies form the cornerstone of modern liquid biopsy analysis. Both targeted and whole-genome approaches are employed, with targeted sequencing offering greater sensitivity for variant detection at lower cost.
Next-Generation Sequencing Platforms: Comprehensive genomic profiling assays typically target panels of cancer-related genes (ranging from 50 to hundreds of genes) to identify SNVs, indels, CNVs, fusions, and microsatellite instability [7] [38]. Digital sequencing technologies, including digital droplet PCR (ddPCR) and bead-based amplification methods, enable absolute quantification of rare variants with variant allele frequencies (VAF) as low as 0.01% [7].
Mass Spectrometry-Based Approaches: Recent advances in mass spectrometry have enhanced sensitivity and resolution for detecting low-abundance cancer biomarkers in liquid biopsies. Novel workflows incorporating advanced separation techniques and data-independent acquisition strategies have improved multiplex biomarker quantification [39]. Artificial intelligence-driven spectral analysis further accelerates clinical translation of mass spectrometry-based diagnostics.
Single-Cell Analysis Technologies: For CTC characterization, single-cell RNA sequencing, and proteomic profiling enable comprehensive molecular analysis of rare cells. Microfluidic platforms facilitate CTC isolation based on physical properties (size, deformability) or surface marker expression (e.g., EpCAM, vimentin) [1].
Diagram 1: Liquid Biopsy NGS Workflow
Research Reagent Solutions
Table 2: Essential Research Reagents for Liquid Biopsy Applications
| Reagent/Category | Specific Examples | Function/Purpose |
|---|---|---|
| Blood Collection Tubes | Cell-free DNA BCT tubes | Stabilize nucleated blood cells, prevent contamination |
| Nucleic Acid Extraction Kits | QIAamp Circulating Nucleic Acid Kit | High recovery of short DNA fragments |
| Library Prep Systems | AVENIO ctDNA Library Prep Kits | Error-corrected sequencing libraries |
| Target Enrichment Panels | Northstar Select (84 genes) | Comprehensive genomic profiling |
| Methylation Analysis | OvaPrint methylation panel | Epigenetic biomarker detection |
| Single-Cell Isolation | CellSearch CTC system | CTC enumeration and isolation |
Analytical Validation and Performance Characteristics
Rigorous analytical validation is essential for establishing the clinical utility of liquid biopsy assays. Key performance parameters include sensitivity, specificity, limit of detection (LOD), and reproducibility across variant types.
Analytical Sensitivity and Specificity
Recent technological advancements have significantly improved the sensitivity of liquid biopsy assays. The Northstar Select assay demonstrates a 95% limit of detection of 0.15% variant allele frequency for SNVs and indels, with sensitive detection of CNVs down to 2.11 copies for amplifications and 1.80 copies for losses [7] [38]. This enhanced sensitivity enables identification of 51% more pathogenic SNVs/indels and 109% more CNVs compared to previous generation assays [38].
In multi-cancer early detection (MCED) applications, the OncoSeek platform achieved an area under the curve (AUC) of 0.829 across 15,122 participants, with 58.4% sensitivity and 92.0% specificity for detecting 14 common cancer types [40]. Performance varied by cancer type, with highest sensitivities observed for bile duct (83.3%), gallbladder (81.8%), and pancreatic (79.1%) cancers [40].
Concordance with Tissue Biopsy
Studies evaluating concordance between liquid and tissue biopsy have shown generally high agreement, with some context-dependent variability. In advanced non-small cell lung cancer (NSCLC), concordance between standard-of-care tissue genotyping and ctDNA next-generation sequencing was 71.2% [41]. Discordant results occurred in 25.4% of cases, though most without direct therapeutic impact [41].
Several factors influence concordance, including tumor shedding characteristics, anatomic location, and assay sensitivity. Tumors with high vascularization and rapid turnover tend to release more ctDNA into circulation, resulting in higher concordance rates.
Table 3: Performance Characteristics of Liquid Biopsy Assays Across Cancer Types
| Cancer Type | Assay/Sample | Sensitivity | Specificity | Key Applications |
|---|---|---|---|---|
| Multiple Cancers (14 types) | OncoSeek (Plasma) | 58.4% | 92.0% | Multi-cancer early detection |
| Ovarian Cancer | Methylation Panel (Plasma) | 85.3% (Stage I) | 90.5% | Early-stage detection |
| Non-Small Cell Lung Cancer | ctDNA-NGS (Plasma) | 71.2% concordance | N/A | Therapy selection |
| Breast Cancer | CTC Count (Blood) | N/A | N/A | Prognostic assessment |
| High-Grade Serous Ovarian Cancer | TP53 mutations (ctDNA) | 75-100% | >80% | Diagnosis and monitoring |
Clinical Applications in Early Detection and Multi-Cancer Screening
Multi-Cancer Early Detection (MCED)
MCED tests represent the most promising application of liquid biopsy for population-based cancer screening. These assays utilize machine learning algorithms to analyze patterns in ctDNA methylation, fragmentomics, or protein biomarkers to detect multiple cancer types simultaneously and predict tissue of origin.
The OncoSeek test demonstrates the potential of this approach, detecting 14 cancer types that collectively account for 72% of global cancer deaths [40]. In a large-scale validation across 15,122 participants, the test achieved 70.6% accuracy in tissue of origin prediction for true positives, facilitating targeted diagnostic workup [40].
Organ-Specific Early Detection Applications
Ovarian Cancer: Liquid biopsy shows particular promise for ovarian cancer detection, where late diagnosis contributes significantly to mortality. Combining CA125 with additional protein biomarkers and ctDNA methylation signatures improves early detection sensitivity. The OvaPrint platform utilizes a cfDNA methylation-based classifier to discriminate benign pelvic masses from high-grade serous ovarian cancer preoperatively [37].
Lung Cancer: In NSCLC, ctDNA analysis enables detection of targetable mutations such as EGFR variants when tissue biopsy is not feasible. Studies demonstrate that ctDNA testing can identify actionable drivers in patients who would otherwise go untested due to contraindications for invasive procedures [41].
Pancreatic Cancer: Pancreatic cancers often shed ctDNA abundantly even at early stages, making liquid biopsy particularly valuable for this difficult-to-diagnose malignancy. Studies show that ctDNA levels are elevated in pancreatic cancer patients and decrease following treatment, enabling monitoring of treatment response [1].
Diagram 2: MCED Testing Process
Current Challenges and Future Directions
Despite significant progress, liquid biopsy for early cancer detection faces several challenges that must be addressed to realize its full potential.
Technical Limitations
Sensitivity remains suboptimal for early-stage cancers, where tumor shedding of biomarkers is minimal. The low abundance of ctDNA in early-stage disease (often <0.1% VAF) requires extremely sensitive detection methods [1]. Pre-analytical variables including sample collection, processing, and storage introduce variability that must be standardized across laboratories [9].
Clinical Implementation Barriers
Integration of liquid biopsy into routine clinical practice requires demonstration of clinical utility through randomized controlled trials. Evidence must show that liquid biopsy-based screening reduces cancer-specific mortality without excessive false positives that lead to unnecessary invasive procedures [40]. Additionally, equitable access and cost-effectiveness must be addressed, particularly for resource-limited settings [40].
Emerging Technologies and Future Prospects
Artificial intelligence and machine learning are enhancing liquid biopsy performance through improved pattern recognition in complex multi-analyte datasets [42] [43]. Multi-omics approaches that combine genomic, epigenomic, transcriptomic, proteomic, and metabolomic data are increasing sensitivity and specificity for early detection [39].
Novel biosensing technologies, including nanotechnology-based platforms and single-molecule detection systems, promise to further lower detection limits and reduce costs. These advancements may eventually enable liquid biopsy to become a ubiquitous tool for routine cancer screening and risk assessment.
Liquid biopsy has emerged as a transformative technology for early cancer detection and multi-cancer screening, addressing fundamental limitations of traditional tissue biopsy. Through analysis of circulating tumor-derived biomarkers, particularly ctDNA, liquid biopsy provides a minimally invasive window into tumor biology that enables serial monitoring and comprehensive assessment of tumor heterogeneity.
Recent technical advancements have significantly improved sensitivity and specificity, with MCED platforms now capable of detecting multiple cancer types with predictive tissue of origin localization. While challenges remain in sensitivity for early-stage disease and clinical validation, the rapid pace of innovation suggests liquid biopsy will play an increasingly prominent role in cancer screening, diagnosis, and management.
As evidence accumulates through ongoing clinical trials and technological refinement continues, liquid biopsy is poised to revolutionize cancer detection paradigms, ultimately enabling earlier diagnosis and personalized intervention that improves patient outcomes.
Real-Time Therapy Monitoring and Detection of Resistance Mechanisms
The rise of antimicrobial and anticancer resistance represents a critical challenge in modern medicine, driven by the limitations of traditional, single-timepoint diagnostic methods. Real-time therapy monitoring has emerged as a pivotal strategy for addressing this challenge by enabling dynamic tracking of treatment response and early detection of resistance mechanisms. This paradigm is fundamentally shifting clinical practice from reactive to proactive medicine.
Within this field, the comparison between liquid biopsy and tissue biopsy frameworks is particularly relevant. While tissue biopsy remains the historical gold standard for definitive diagnosis, it provides only a snapshot in time, is invasive, and struggles to capture tumor heterogeneity [1]. Liquid biopsy, analyzing circulating biomarkers such as circulating tumor DNA (ctDNA) and circulating tumor cells (CTCs) from blood or other biofluids, offers a minimally invasive alternative that facilitates serial monitoring [44]. This capability for repeated sampling is essential for assessing therapy efficacy, monitoring minimal residual disease, and identifying the emergence of resistance mutations during treatment [45] [46].
The following technical guide explores the core technologies, methodologies, and analytical frameworks underpinning real-time monitoring, with a specific focus on its application within antimicrobial and oncological contexts to combat the silent pandemic of treatment resistance.
Core Technologies for Real-Time Monitoring
Advanced technological platforms form the foundation of effective real-time therapy monitoring. These technologies can be broadly categorized into molecular, sensor-based, and sequencing approaches, each with distinct strengths and applications for tracking therapeutic agents and resistance markers.
Molecular and Genomic Technologies
Molecular techniques provide high sensitivity for detecting specific genetic markers of resistance, making them invaluable for guiding targeted therapies.
Digital PCR (dPCR): This technology partitions a PCR reaction into thousands of nanoliter-scale reactions, allowing for the absolute quantification of nucleic acids. It is exceptionally suited for detecting low-frequency resistance mutations in ctDNA, with studies demonstrating a coefficient of variance for plasma HER2 detection as low as 2-3% and a limit of detection of 2.36 copies per diploid gene [45]. This sensitivity is critical for identifying emerging resistance in cancer patients.
Next-Generation Sequencing (NGS): NGS enables comprehensive profiling of resistance mechanisms by sequencing entire genes or panels of genes relevant to drug resistance. In metastatic Non-Small Cell Lung Cancer (NSCLC), liquid biopsy-based NGS demonstrates a 94.8% to 100% concordance with tissue biopsy for guideline-recommended biomarkers and returns results an average of 26.8 days faster, enabling more timely treatment decisions [46].
CRISPR-Based Diagnostics: Leveraging the precision of CRISPR-Cas systems, these tools allow for ultra-specific detection of resistance genes. They can be designed to identify single-nucleotide polymorphisms associated with resistance, even in complex biological samples, providing a rapid and highly accurate genotypic assessment [47] [48].
Sensor-Based and Continuous Monitoring Platforms
Sensor technologies represent a frontier in monitoring, offering the potential for continuous, real-time data acquisition.
Biosensors and Wearables: These devices typically use optical or electrochemical methods to measure drug concentrations. A recognition element (e.g., antibody, aptamer) binds to the drug analyte, generating a quantifiable signal [49]. The SENSBIT (Stable Electrochemical Nanostructured Sensor for Blood In situ Tracking) device is a prominent example—a microfabricated soft needle that can continuously monitor drug concentrations (e.g., the antibiotic kanamycin) in flowing blood for up to seven days, a significant leap from previous devices that failed after 11 hours [50].
Mass Spectrometry: Matrix-Assisted Laser Desorption/Ionization Time-of-Flight (MALDI-TOF) mass spectrometry is widely used for the rapid identification of pathogens and their resistance profiles. It analyzes protein spectra from microorganisms, providing results in minutes to hours compared to days for traditional culture methods, thus accelerating the initiation of targeted antimicrobial therapy [51] [48].
Table 1: Comparison of Key Real-Time Monitoring Technologies
| Technology | Primary Function | Typical Turnaround Time | Key Advantage | Readiness Level |
|---|---|---|---|---|
| Digital PCR (dPCR) | Quantitative detection of mutations/amplifications | 3-6 hours | Absolute quantification; high sensitivity for low-frequency variants | Established |
| Next-Generation Sequencing (NGS) | Comprehensive resistance profiling | 5-10 days | Broad, hypothesis-free analysis of multiple resistance genes | Established |
| CRISPR-Based Assays | Ultra-specific gene detection | 1-2 hours | High specificity; potential for point-of-care use | Emerging |
| Biosensors (e.g., SENSBIT) | Continuous drug level monitoring | Real-time, continuous | Provides pharmacokinetic data in real-time | Experimental |
| MALDI-TOF MS | Pathogen identification & resistance profiling | 10-30 minutes | Rapid identification directly from clinical samples | Established |
Detection of Antimicrobial Resistance (AMR) Mechanisms
In infectious disease management, rapidly identifying the mechanism behind antimicrobial resistance is crucial for selecting effective treatment. Resistance in bacteria is mediated through several well-defined pathways.
Key AMR Mechanisms
- Enzymatic Inactivation: Bacteria produce enzymes that directly modify or destroy antibiotics. A critical example is the production of Extended-Spectrum Beta-Lactamases (ESBLs), which confer resistance to penicillin, cephalosporins, and aztreonam. ESBL-producing Enterobacterales are a major global health threat, necessitating updated expert consensuses for their management [52].
- Efflux Pumps: The overexpression of membrane-associated transporters actively pumps antibiotics out of the bacterial cell, reducing the intracellular concentration to sub-therapeutic levels. This is a common mechanism of multidrug resistance [48].
- Target Site Modification: Mutations in the genes encoding the target proteins of antibiotics can prevent drug binding. For instance, mutations in the rpoB gene in Mycobacterium tuberculosis prevent rifampicin from binding to its RNA polymerase target [48].
- Reduced Permeability: Changes in the bacterial cell wall, particularly in Gram-negative bacteria, can limit the uptake of antibiotics. This often involves the downregulation of porin channels, effectively blocking the drug's entry into the cell [48].
The following diagram illustrates the logical relationships and functional outcomes of these primary antimicrobial resistance mechanisms.
Advanced AMR Diagnostic Technologies
Conventional culture-based antimicrobial susceptibility testing (AST) is slow, taking 48-72 hours. Advanced technologies are critical for accelerating detection.
- Automated AST Systems: Systems like VITEK 2 and PhoenixTM use optical measurements to track bacterial growth in the presence of antibiotics in liquid medium, providing a phenotypic result in as little as 4-8 hours [48].
- Flow Cytometry: This technology allows for real-time, single-cell analysis of phenotypic resistance. By using fluorescent dyes that indicate cell viability or membrane integrity, it can dynamically monitor bacterial responses to antibiotics, providing results much faster than traditional growth-based assays [48].
Table 2: Advanced Technologies for AMR Detection
| Technology | Detection Principle | Typical Turnaround Time | Key Advantage |
|---|---|---|---|
| Automated AST Systems (e.g., VITEK 2) | Phenotypic; microbial growth detection | 4-18 hours | Standardized, high-throughput |
| Flow Cytometry | Phenotypic; single-cell viability | 1-4 hours | Real-time monitoring; rapid viability assessment |
| MALDI-TOF MS | Proteomic; protein mass fingerprinting | 10-30 minutes (ID) + AST time | Rapid pathogen identification |
| CRISPR-Based Assays | Genotypic; nucleic acid detection | 1-2 hours | Ultra-high specificity for resistance genes |
| Lateral Flow Immunoassays (LFIAs) | Immunoassay; antigen detection | 10-30 minutes | Low cost, point-of-care use |
Experimental Protocols for Therapy Monitoring
Robust experimental protocols are essential for generating reliable data in therapy monitoring. The following sections detail standard methodologies for liquid biopsy analysis and sensor-based drug monitoring.
Protocol 1: Liquid Biopsy for Resistance Mutation Detection in Oncology
This protocol describes the process for isolating cell-free DNA (cfDNA) from plasma and using digital PCR (dPCR) to detect and quantify specific resistance mutations, such as HER2 amplification in breast cancer [45].
- Step 1: Blood Collection and Plasma Preparation: Collect 10 mL of peripheral blood into a specialized cell-free DNA blood collection tube (e.g., PAXgene Blood ccfDNA Tube). Centrifuge the blood at 1900 ×g for 15 minutes at room temperature. Transfer the supernatant and perform a second centrifugation at 1900 ×g for 10 minutes to remove any remaining cells. The final plasma supernatant should be stored at -80°C until cfDNA extraction.
- Step 2: cfDNA Extraction: Use a commercial cfDNA extraction kit (e.g., QIAamp Circulating Nucleic Acid Kit) following the manufacturer's instructions. This typically involves digesting proteins, binding cfDNA to a silica membrane, washing, and eluting the purified cfDNA in a small volume of buffer. The extracted cfDNA should be quantified using a fluorometer.
- Step 3: Digital PCR (dPCR) Setup: Prepare the dPCR reaction mixture. A typical 14.5 μL reaction may contain approximately 5.8 μL of cfDNA (around 5 ng), 7.25 μL of dPCR Master Mix, and 1.45 μL of a primer/probe assay specific for the target (e.g., HER2) and a reference gene (e.g., RPP30).
- Step 4: Partitioning and Amplification: Load the dPCR reaction mixture into a microfluidic chip or droplet generator to create thousands of individual partitions. Seal the chip and perform PCR amplification on a thermal cycler with conditions optimized for the assay (e.g., initial denaturation at 96°C for 10 minutes, followed by 39 cycles of denaturation and annealing/extension).
- Step 5: Data Analysis: After amplification, read the chip on a dPCR reader. Partitions containing the target sequence will fluoresce. Use the instrument's software to count the positive and negative partitions for both the target and reference genes. Apply Poisson statistics to calculate the absolute copy number of each and determine the target-to-reference ratio (e.g., HER2 ratio). A ratio above a validated threshold (e.g., 2.36) indicates amplification.
Protocol 2: Continuous Drug Monitoring with an Implantable Biosensor
This protocol outlines the principles for using a sensor like SENSBIT for real-time, in-situ monitoring of drug concentrations in the bloodstream [50].
- Step 1: Sensor Functionalization: The microfabricated sensor is coated with synthetic antibodies (aptamers) that act as molecular switches. These aptamers are specifically selected to bind the target drug molecule (e.g., the antibiotic kanamycin) with high affinity.
- Step 2: Implantation and Signal Calibration: The soft, needle-like sensor is implanted into a blood vessel. Upon exposure to flowing blood, the aptamers change conformation upon binding the target drug, generating a measurable electrochemical signal (e.g., a change in current or impedance). The signal is continuously transmitted to an external monitor. An initial in-situ calibration is performed to correlate the signal intensity with known drug concentrations.
- Step 3: Real-Time Pharmacokinetic Monitoring: The sensor continuously tracks the drug concentration as it is administered, distributed, metabolized, and eliminated. This generates a rich, high-resolution pharmacokinetic (PK) profile, revealing absorption rates, peak concentration levels, and elimination half-lives in real-time.
- Step 4: Data Interpretation and Dose Adjustment: The continuous PK data is analyzed to determine if the drug concentration remains within the therapeutic window throughout the dosing interval. This information can be used by clinicians to make informed, personalized adjustments to the dosing regimen (e.g., changing the dose or frequency) to optimize efficacy and minimize toxicity.
The workflow for this continuous monitoring process, from sensor implantation to clinical decision-making, is visualized below.
The Scientist's Toolkit: Essential Research Reagents and Materials
Successful implementation of real-time monitoring protocols requires a suite of specialized reagents and tools. The following table details key solutions for a core liquid biopsy and biosensor workflow.
Table 3: Essential Research Reagent Solutions for Therapy Monitoring
| Item | Function/Application | Example Product/Catalog |
|---|---|---|
| cfDNA Blood Collection Tubes | Stabilizes nucleated blood cells and prevents genomic DNA contamination during transport and storage. | PAXgene Blood ccfDNA Tubes (Qiagen, Cat. No. 768115) |
| cfDNA Extraction Kit | Purifies high-quality, protein-free circulating nucleic acids from plasma/serum for downstream molecular analysis. | QIAamp Circulating Nucleic Acid Kit (Qiagen, Cat. No. 55114) |
| dPCR Master Mix | A optimized PCR mix containing DNA polymerase, dNTPs, and buffer, formulated for partitioning in digital PCR systems. | ProFlex 2X Flat PCR System Master Mix (Thermo Fisher, Cat. No. 4484078) |
| Target-Specific dPCR Assays | Primer and probe sets for absolute quantification of specific drug resistance mutations or gene amplifications. | HER2 Amplification Detection Kit (Questgenomics, Cat. No. Q0137365402) |
| Electrochemical Aptamer | A synthetic, single-stranded DNA or RNA oligonucleotide that binds a specific target drug, inducing a conformational change that generates an electrochemical signal for biosensors. | Custom-synthesized Kanamycin-binding Aptamer [50] |
| Microfluidic Chip | A device that partitions a dPCR reaction into thousands of nanoliter-scale reactions for absolute quantification. | Questgenomics Chip Loader |
| MALDI-TOF Matrix Solution | A chemical (e.g., sinapinic acid) that co-crystallizes with the sample, absorbs the laser energy, and facilitates the desorption/ionization of proteins for mass spectrometry analysis. | α-Cyano-4-hydroxycinnamic acid (HCCA) |
The integration of real-time therapy monitoring into clinical and research practice marks a transformative shift towards dynamic, personalized medicine. The technologies and protocols detailed in this guide—from liquid biopsy-based tracking of ctDNA to continuous biosensing of drug levels—provide the tools necessary to move beyond static diagnoses. Within the ongoing debate of liquid biopsy vs. tissue biopsy, it is evident that liquid biopsy is not merely a replacement but a complementary and often more practical framework for longitudinal assessment. Its capacity for serial sampling captures the temporal and spatial heterogeneity of diseases, enabling the early detection of resistance that would be missed by a single tissue sample.
The ultimate promise of this approach is the closure of the feedback loop between diagnosis and treatment. By providing a continuous stream of molecular and pharmacological data, these monitoring platforms empower clinicians to preempt treatment failure, rationally switch or modify therapies, and usher in an era of truly adaptive and precision-driven patient management. This is critical for combating the escalating threat of antimicrobial and anticancer resistance, turning the tide from reactive to proactive healthcare.
Liquid Biopsy in Clinical Trial Design and Patient Enrollment Strategies
Liquid biopsy has emerged as a transformative approach in oncology clinical trials, offering a minimally invasive alternative to traditional tissue biopsies that enables real-time monitoring of tumor dynamics. This technical guide examines the integration of liquid biopsy methodologies within clinical trial frameworks, focusing on applications across cancer screening, minimal residual disease (MRD) detection, and therapeutic monitoring. Unlike single-site tissue sampling, liquid biopsy captures tumor heterogeneity by analyzing circulating biomarkers released from multiple tumor sites into peripheral blood [9] [1]. The analytical validity of these approaches has advanced significantly, with recent assays demonstrating a 95% limit of detection at 0.15% variant allele frequency for single nucleotide variants and indels [38] [7]. For clinical trial designers, these technological improvements address previous limitations in sensitivity while creating new opportunities for patient-centric trial designs that reduce invasive procedures and enable more frequent molecular monitoring.
Current Applications in Clinical Trials
Multi-Cancer Early Detection and Screening Trials
Liquid biopsy platforms for multi-cancer early detection (MCED) represent a growing focus of clinical research. The Vanguard Study, part of the NCI Cancer Screening Research Network, has demonstrated the feasibility of implementing MCED tests in real-world settings, enrolling over 6,200 participants with high adherence across diverse populations [53]. These platforms utilize various analytical approaches, including cfDNA methylation signatures that have achieved 88.2% top prediction accuracy for identifying the cancer signal of origin across 12 tumor types [53]. Another MCED platform employing a hybrid-capture methylation assay demonstrated 98.5% specificity with overall sensitivity of 59.7%, increasing to 84.2% in late-stage tumors and 73% in cancers without standard screening options [53]. These performance characteristics make liquid biopsy particularly valuable for screening and enrollment in prevention trials targeting high-risk populations.
Minimal Residual Disease Monitoring
MRD detection represents one of the most clinically validated applications for liquid biopsy in therapeutic trials. In the VICTORI study of colorectal cancer patients, ctDNA analysis using the neXT Personal MRD detection assay demonstrated that 87% of recurrences were preceded by ctDNA positivity, while no ctDNA-negative patients relapsed [53]. Similar approaches have been successfully implemented across tumor types, with technological innovations continuously improving sensitivity. The MUTE-Seq method leverages precise FnCas9-AF2 variants to selectively eliminate wild-type DNA, enabling highly sensitive detection of low-frequency cancer-associated mutations for MRD evaluation in NSCLC and pancreatic cancer [53]. These capabilities allow trial designers to use MRD as intermediate endpoints that may predict overall survival benefits.
Therapy Selection and Response Monitoring
Liquid biopsy enables dynamic monitoring of treatment response and resistance mechanisms throughout therapeutic trials. Research presented at AACR 2025 demonstrated that in metastatic prostate cancer, high baseline circulating tumor cell (CTC) counts exhibiting chromosomal instability were significantly associated with worse overall survival and could predict differential benefit from taxane treatment [53]. Similarly, in the phase II RAMOSE trial, baseline detection of EGFR mutations in plasma at variant allele frequency >0.5% was prognostic for significantly shorter progression-free and overall survival in EGFR-mutant NSCLC patients treated with osimertinib [53]. These findings support the integration of liquid biopsy for patient stratification and response monitoring in targeted therapy trials.
Table 1: Liquid Biopsy Applications in Clinical Trial Design
| Application | Biomarkers Used | Clinical Trial Utility | Key Performance Metrics |
|---|---|---|---|
| Multi-Cancer Early Detection | ctDNA methylation patterns, protein biomarkers | Screening and enrollment of high-risk populations | 98.5% specificity, 59.7% overall sensitivity, 88.2% cancer signal origin accuracy [53] |
| Minimal Residual Disease | ctDNA mutations, cfRNA | Early endpoint for adjuvant therapy trials, recurrence prediction | 87% of recurrences preceded by ctDNA positivity; 0.15% VAF detection limit [53] [38] |
| Therapy Selection | ctDNA mutations, CTC counts, CTC chromosomal instability | Patient stratification, biomarker-defined subgroups | CTC chromosomal instability predicts taxane benefit; Baseline ctDNA EGFR mutations prognostic for OS [53] |
| Response Monitoring | ctDNA VAF dynamics, CTC enumeration | Real-time assessment of treatment efficacy | ctDNA clearance correlates with radiographic response; Rising ctDNA predicts progression months before imaging [9] [53] |
| Resistance Mechanism Identification | ctDNA mutation emergence | Guide subsequent therapy lines in platform trials | Detection of resistance mutations in EGFR, ALK, other kinase genes [9] [1] |
Analytical Validation and Performance Considerations
Sensitivity and Specificity Requirements
Analytical validation of liquid biopsy assays must establish rigorous performance characteristics suitable for clinical trial contexts. The Northstar Select assay validation demonstrated 95% limit of detection at 0.15% variant allele frequency for SNV/Indels, with sensitive detection of copy number variations down to 2.11 copies for amplifications and 1.80 copies for losses [38] [7]. This enhanced sensitivity enabled identification of 51% more pathogenic SNV/indels and 109% more CNVs compared to on-market CGP assays, resulting in 45% fewer null reports with no pathogenic or actionable results [38]. Importantly, 91% of additional clinically actionable variants were detected below 0.5% VAF, highlighting the importance of low limit of detection for comprehensive biomarker assessment in trial populations [38].
Concordance with Tissue Biopsy
Understanding concordance patterns between liquid and tissue biopsies is essential for appropriate implementation in clinical trials. The ROME trial provided critical insights, analyzing 1,794 patients with advanced solid tumors who underwent both tissue and liquid biopsy [4]. The same actionable alterations were identified in both biopsy types in 49.2% of cases, while alterations were exclusively detected via tissue biopsy in 34.7% and exclusively in liquid biopsies in 16% [4]. This discordance reflects biological differences including heterogeneous expression of genomic alterations across metastatic sites and variable shedding of ctDNA into circulation. Trial designers should note that certain pathways show higher discordance rates, particularly PI3K/PTEN/AKT/mTOR and ERBB2 [4].
Turnaround Time and Practical Considerations
Operational efficiency represents a significant advantage for liquid biopsy in clinical trials. A retrospective analysis of 170 NSCLC patients demonstrated significantly faster turnaround time for liquid NGS compared to tissue NGS (9.6 days vs. 36.4 days, P < .0001) [46]. This accelerated timeline can reduce screening failures and facilitate more rapid treatment initiation in trial settings. Additionally, liquid biopsy showed higher testing success rates compared to tissue, which frequently suffers from insufficient sample quantity or quality [46]. These practical advantages make liquid biopsy particularly valuable in time-sensitive trial contexts and for patients with contraindications to repeated invasive procedures.
Table 2: Performance Comparison of Liquid vs. Tissue Biopsy in Clinical Studies
| Parameter | Liquid Biopsy | Tissue Biopsy | Clinical Implications for Trial Design |
|---|---|---|---|
| Turnaround Time | 9.6 days (median) [46] | 36.4 days (median) [46] | Faster screening-to-treatment time; Reduced screening failures |
| Testing Success Rate | Higher [46] | Limited by sample adequacy [46] | Fewer unevaluable samples; More complete molecular datasets |
| Spatial Heterogeneity Capture | Comprehensive (multiple tumor sites) [9] | Limited (single biopsy site) [9] | Better representation of tumor genomics landscape |
| Temporal Dynamics | Enables serial monitoring [9] [1] | Single timepoint without repeated invasiveness [9] | Adaptive trial designs with real-time response assessment |
| Actionable Alteration Detection | 76.5% (liquid-first approach) [46] | 54.9% (tissue-first approach) [46] | Improved patient matching to biomarker-driven therapies |
| Patient Risk/ Burden | Minimal (blood draw) [9] [1] | Significant (invasive procedure) [9] [54] | Improved recruitment; Serial sampling feasible; More inclusive eligibility |
Integration Strategies for Clinical Trial Protocols
Complementary Biopsy Approaches
The most effective trial designs leverage the complementary strengths of both liquid and tissue biopsies. The ROME trial demonstrated that patients with concordant findings in both biopsy modalities who received tailored therapy had significantly improved overall survival (11.05 months vs. 7.7 months with standard care) and progression-free survival (4.93 months vs. 2.8 months) [4]. This 26% reduction in risk of death highlights the potential of combined profiling approaches to optimize patient selection for targeted therapies [4]. Trial protocols should consider reflex testing algorithms where liquid biopsy serves as an initial screening tool, with tissue biopsy confirmation in negative cases or when specific alterations require histological context.
Enrollment Expansion and Diversity
Liquid biopsy facilitates more inclusive eligibility criteria by reducing barriers related to biopsy inaccessibility or patient comorbidities. This approach can enhance trial accessibility for patients with contraindications to invasive procedures, those with tumors in difficult-to-biopsy locations, or elderly/frail populations [9] [1]. Additionally, the non-invasive nature enables multi-site participation across community and academic settings without specialized interventional radiology capabilities. Trial designers should consider these advantages when developing enrollment strategies targeting historically underrepresented populations.
Novel Endpoint Definition
Liquid biopsy enables incorporation of molecular endpoints that may serve as early indicators of treatment efficacy. ctDNA clearance has been validated as a surrogate for treatment response across multiple cancer types, often preceding radiographic changes by weeks to months [53]. In bladder cancer, the uRARE-seq cfRNA-based workflow demonstrated 94% sensitivity for MRD assessment and was associated with shorter high-grade recurrence-free survival [53]. These molecular endpoints can reduce trial durations and costs by providing earlier readouts of activity, particularly in adjuvant settings where traditional endpoints require extended follow-up.
Technical Methodologies and Experimental Protocols
Sample Collection and Processing
Standardized pre-analytical protocols are critical for reliable liquid biopsy results in multi-center trials. Blood collection typically uses cell-free DNA blood collection tubes that stabilize nucleases and prevent genomic DNA contamination. Protocols should specify: (1) Tube inversion immediately after collection to ensure proper mixing with preservative; (2) Processing within specified timeframes (typically within 3-7 days at room temperature for stabilized tubes); (3) Two-step centrifugation (first at 1,600-3,000 × g to separate plasma from blood cells, then at 10,000-16,000 × g to remove residual cells and debris); (4) Plasma storage at -80°C in low-protein-binding tubes to prevent nucleic acid adsorption [38] [55].
Circulating Tumor DNA Analysis
ctDNA analysis represents the most widely implemented liquid biopsy modality in clinical trials. The Northstar Select validation study provides a representative protocol: (1) Extraction of cell-free DNA from 4-10 mL plasma using magnetic bead-based methods; (2) Library preparation using hybrid capture-based technology targeting 84 cancer-related genes; (3) Unique molecular identifiers to distinguish true variants from PCR errors; (4) Next-generation sequencing at high depth (typically 10,000× minimum coverage); (5) Bioinformatic analysis for variant calling, filtering, and annotation [38]. This approach detects SNVs/indels, CNVs, fusions, and microsatellite instability with high sensitivity down to 0.15% VAF [38].
Circulating Tumor Cell Analysis
CTC enumeration and characterization provides complementary information to ctDNA analysis. The FDA-cleared CellSearch system employs: (1) Immunomagnetic enrichment using ferrofluid nanoparticles conjugated with anti-EpCAM antibodies; (2) Immunofluorescence staining with anti-cytokeratin antibodies (CTC identification), anti-CD45 antibodies (leukocyte exclusion), and DAPI nuclear stain; (3) Automated scanning and analysis to identify EpCAM+/cytokeratin+/DAPI+/CD45- cells [55]. Advanced protocols now incorporate mesenchymal markers to address epithelial-mesenchymal transition and morphological assessment of chromosomal instability for predictive insights [53] [55].
Research Reagent Solutions
Table 3: Essential Research Reagents for Liquid Biopsy Applications
| Reagent Category | Specific Examples | Function | Technical Considerations |
|---|---|---|---|
| Blood Collection Tubes | cfDNA BCT tubes (Streck), PAXgene Blood cDNA tubes | Cellular fraction stabilization, nuclease inhibition | Maintain cfDNA profile for up to 7 days at room temperature; Critical for multi-center trials [38] [55] |
| Nucleic Acid Extraction Kits | QIAamp Circulating Nucleic Acid Kit, MagMax Cell-Free DNA Isolation Kit | Isolation of high-quality cfDNA from plasma | Magnetic bead-based methods show higher recovery; Minimum 4mL plasma recommended [38] |
| Library Preparation | Northstar Select, FoundationOne Liquid CDx | Target enrichment, adapter ligation, UMI incorporation | Hybrid capture enables comprehensive genomic profiling; UMIs reduce false positives [38] [4] |
| CTC Enrichment | CellSearch system, Parsortix system, IsoFlux system | Immunomagnetic or size-based CTC isolation | CellSearch is FDA-cleared for prognostic use in breast, prostate, CRC; EpCAM-based capture misses mesenchymal CTCs [55] |
| Sequencing Reagents | Illumina sequencing kits, Ion Torrent kits | Template preparation, sequencing chemistry | High-depth sequencing (>10,000x) required for low VAF detection; Dual-indexing reduces cross-contamination [38] |
| Bioinformatic Tools | MuTect2, VarScan2, custom pipelines | Variant calling, annotation, interpretation | Specialized algorithms needed for low VAF; Machine learning approaches improve signal-to-noise [53] [38] |
Regulatory and Ethical Considerations
Regulatory Landscape
Regulatory guidance continues to evolve for liquid biopsy implementation in clinical trials. The FDA has issued draft guidance on including tissue biopsies in clinical trials, emphasizing considerations for when biopsies are required versus optional [54]. For liquid biopsy, the agency has cleared several platforms for companion diagnostic use, though trial-specific validation is often required. Recent approvals have recognized ctDNA-based endpoints in certain contexts, particularly for MRD detection and therapy selection [9] [54]. Trial sponsors should engage early with regulatory agencies to establish fit-for-purpose analytical validation plans that address intended use contexts.
Informed Consent and Ethical Frameworks
Ethical implementation of liquid biopsy in trials requires careful informed consent processes that address unique considerations including: (1) Potential incidental findings and approach to reporting; (2) Plans for biospecimen storage and future research use; (3) Data sharing policies given the rich genomic data generated; (4) Clonal hematopoiesis interpretation and communication [54] [55]. The non-invasive nature may lower barriers to participation, but creates responsibility for clear communication about limitations and implications of results.
Liquid biopsy methodologies have matured to offer clinically validated approaches for integration into oncology trial designs. The technological advances in sensitivity, combined with practical advantages of minimal invasiveness and rapid turnaround, position these tools to transform patient enrollment strategies and endpoint assessment. Trial designers should consider complementary approaches that leverage both liquid and tissue biopsies to maximize biomarker detection, as demonstrated by the ROME trial where concordant findings predicted superior outcomes with tailored therapy [4]. Future directions include multimodal biomarker integration combining ctDNA, CTCs, and extracellular vesicles, and the application of artificial intelligence to enhance predictive models [55]. As evidence continues to accumulate, liquid biopsy is poised to become a central component of precision oncology trial design, enabling more dynamic, inclusive, and efficient evaluation of novel therapeutics.
Functional Analysis Using CTC-Derived Models and Xenografts
The paradigm for cancer diagnosis and monitoring is shifting from traditional tissue biopsies toward liquid biopsy, a minimally invasive approach that analyzes tumor-derived components from bodily fluids [9] [1]. While tissue biopsy remains the gold standard for initial tumor diagnosis and subtyping, it presents significant limitations including invasiveness, sampling constraints due to tumor heterogeneity, and inability to perform frequent monitoring [9] [1]. Liquid biopsy overcomes these limitations by providing a comprehensive molecular snapshot of both primary and metastatic tumors through analysis of circulating tumor cells (CTCs), circulating tumor DNA (ctDNA), and other biomarkers [9].
CTCs, which are neoplastic cells shed from primary or metastatic tumors into the bloodstream, play a crucial role in cancer dissemination and represent a key biomarker for liquid biopsy [56] [57]. The isolation and propagation of CTCs into preclinical models—specifically CTC-derived xenografts (CDX) and cell cultures—provides powerful tools for functional analysis that address the limitations of traditional tissue biopsies [56]. These models capture tumor heterogeneity and enable the study of metastatic mechanisms, drug resistance, and personalized treatment approaches [56]. This technical guide details the methodologies and applications of CTC-derived models for functional analysis within the broader context of liquid biopsy research.
CTC Biology and Significance in Metastasis
The Metastatic Cascade
CTCs undergo a multi-step process during metastasis, beginning with their detachment from the primary tumor site [57]. The metastatic cascade involves four critical stages:
- Dissemination: CTCs enter the bloodstream, often acquiring epithelial-mesenchymal transition (EMT) characteristics to enhance survival and adaptability [57]
- Homing: CTCs travel to distant sites, with some entering a dormant state, particularly in bone marrow (where they are termed disseminated tumor cells or DTCs) [57]
- Colonization: CTCs/DTCs establish themselves in distant organs, exhibiting organotropism [57]
- Macro-metastasis: Dormant cells awaken and form clinically detectable metastases [57]
This dynamic process is highly inefficient, with only approximately 0.02% of shed cells successfully forming secondary tumors [56].
EMT and CTC Heterogeneity
Epithelial-mesenchymal transition (EMT) is a crucial biological process wherein epithelial cells acquire mesenchymal traits, enhancing their motility and invasiveness [56] [57]. During EMT, CTCs undergo cytoskeletal reorganization, lose cell polarity, detach from the basement membrane, and gain mesenchymal functionality [57]. This transition is regulated by key signaling pathways including TGF-β, NOTCH, WNT/β-catenin, and Hippo [57].
The phenotypic plasticity of CTCs presents significant challenges for their isolation and detection. While many detection methods rely on epithelial markers like EpCAM, CTCs undergoing EMT often downregulate these markers, leading to potential underestimation [56] [57]. Emerging evidence suggests CTCs frequently exhibit a hybrid E/M state with both epithelial and mesenchymal characteristics, which may confer survival advantages during metastasis [57].
Table 1: Key Biological Characteristics of CTCs in Metastasis
| Characteristic | Biological Significance | Impact on Detection & Analysis |
|---|---|---|
| EMT Plasticity | Enhances invasion, survival, and drug resistance | Reduces EpCAM expression, complicating isolation |
| Dormancy | Enables long-term survival and late recurrence | Challenges in vitro expansion and drug testing |
| Cluster Formation | Increases metastatic potential 2-50x compared to single CTCs | Requires specialized isolation techniques |
| Heterogeneity | Reflects tumor evolution and subclonal architecture | Provides comprehensive disease profiling |
CTC Isolation and Detection Techniques
Current Methodologies
CTC isolation techniques balance multiple factors including yield, purity, viability, and ability to capture heterogeneous subpopulations [56]. The main approaches include:
EpCAM-Based Enrichment
- CellSearch System: FDA-approved for CTC enumeration in metastatic breast, prostate, and colorectal cancers [56] [1]
- Utilizes immunomagnetic separation targeting EpCAM, CK8/18/19, with CD45 exclusion [56]
- Clinical cut-offs: ≥5 CTCs/7.5mL for breast/prostate cancer; ≥3 CTCs/7.5mL for colorectal cancer [56]
- Limitation: Fails to detect EpCAM-low CTCs undergoing EMT [56] [57]
Label-Free Isolation Methods
- Parsortix PC1 System: FDA-cleared for metastatic breast cancer; isolates CTCs based on size and deformability [56]
- Filtration techniques: Exploit larger size and rigidity of most CTCs compared to blood cells [1]
- Density gradient centrifugation: Separates CTCs based on buoyancy differences [1]
Microfluidic Technologies
- Utilize sophisticated chip designs to capture CTCs with high efficiency [1]
- Can be integrated with downstream analysis including molecular characterization and culture [1]
Technical Considerations for Functional Analysis
The intended downstream application dictates the optimal isolation strategy. For functional analysis and model development, key considerations include:
- Viability: Methods must preserve cell integrity for subsequent culture [56]
- Phenotypic diversity: Techniques should capture heterogeneous CTC populations, including epithelial, mesenchymal, and hybrid phenotypes [56]
- Scalability: Sufficient cell numbers are needed for xenografting or establishing cultures [56]
- Processing time: CTCs have limited survival in circulation (approximately 1-2.5 hours) [1]
Table 2: Comparison of CTC Isolation Platforms for Model Development
| Platform/ Method | Principle | Yield | Viability | EMT CTC Capture | Suitable for Model Development |
|---|---|---|---|---|---|
| CellSearch | Immunomagnetic (EpCAM) | Medium | Low | Limited | No (fixed cells) |
| Parsortix | Size/deformability | Medium-High | High | Good | Yes |
| Microfluidic chips | Various (size, markers) | Variable | High | Good to Excellent | Yes |
| Density centrifugation | Buoyancy | Low-Medium | Medium | Good | Possible |
| Filtration | Size | Medium | Medium | Good | Possible |
Establishment of CTC-Derived Preclinical Models
CTC-Derived Xenografts (CDX)
CDX models are established by injecting patient-derived CTCs into immunocompromised mice, serving as surrogates for metastatic tissues that are often difficult to obtain [56]. These models provide a representative molecular snapshot of the disease and enable functional studies of metastasis and drug response [56].
Protocol: CDX Generation
CTC Enrichment
- Collect peripheral blood via venipuncture or leukapheresis (for higher yield) [56]
- Process within 4-6 hours of collection to maintain viability
- Enrich CTCs using size-based separation or negative selection to preserve viability
Cell Preparation
- Count enriched CTCs using validated enumeration methods
- Assess viability via trypan blue exclusion or fluorescent viability dyes
- Suspend in Matrigel:PBS (1:1 ratio) or similar extracellular matrix for injection
Mouse Strains and Injection Routes
- Utilize highly immunocompromised strains (NSG, NOG, or NRG)
- Choose injection route based on research question:
Monitoring and Validation
- Monitor for tumor growth weekly via caliper measurements (subcutaneous) or imaging (deeper implants)
- Validate engraftment through human-specific biomarkers, histology, and genomic comparison to original CTCs
- Passage established tumors for expansion or additional experiments
Successful CDX Establishment by Cancer Type
- Breast Cancer: First CDX model established using CTCs from metastatic breast cancer patients implanted into bone marrow [56]
- Triple-Negative Breast Cancer: CDX models generated from patients with >900 CTCs/7.5mL blood [56]
- Prostate Cancer: CDX development enhanced via leukapheresis yielding approximately 20,000 CTCs [56]
- Small Cell Lung Cancer: CDX models established due to high CTC shedding in this cancer type [56]
CTC-Derived Cell Cultures
Establishing in vitro cultures from CTCs enables high-throughput drug screening and functional characterization, though it presents significant technical challenges due to CTC scarcity and plasticity [56].
Protocol: CTC Culture Establishment
Culture Initiation
- Plate freshly isolated CTCs in specialized media formulations
- Use low-attachment plates to prevent anoikis
- Supplement with growth factors tailored to cancer type
- Include Rho-associated protein kinase (ROCK) inhibitor to suppress anoikis
Culture Conditions Optimization
- Co-culture with stromal cells or conditioned media from cancer-associated fibroblasts
- Utilize 3D culture systems (Matrigel, spheroids, organoids) to better mimic tumor microenvironment
- Maintain in hypoxic conditions (1-5% O₂) to simulate physiological states
Culture Maintenance and Expansion
- Monitor for emergent cell populations weekly
- Passage gently when 70-80% confluency is reached
- Cryopreserve early passages for long-term storage
Challenges and Solutions in CTC Culture
- Low proliferation: Use conditional reprogramming with J2 feeder cells and Rho kinase inhibitor
- Cellular senescence: Implement serum-free media with specific growth factors
- Stromal contamination: Employ differential trypsinization or fluorescence-activated cell sorting
Functional Analysis Applications
Drug Sensitivity and Resistance Testing
CTC-derived models enable evaluation of therapeutic response and resistance mechanisms. CDX models precisely recapitulate patient responses to therapies such as docetaxel and enzalutamide in prostate cancer [56]. Testing protocols include:
- In vitro drug screens: Expose CTC cultures to compound libraries, monitoring viability and apoptosis
- In vivo drug trials: Treat established CDX models with targeted therapies or chemotherapeutics
- Longitudinal monitoring: Track molecular changes during treatment via sequential sampling
Metastasis and Dissemination Studies
CDX models facilitate investigation of the metastatic cascade, including organotropism and colonization. Intracardiac injection of CTCs from triple-negative breast cancer patients without liver metastases led to liver metastases in mice, revealing metastasis-initiating potential [56]. Key approaches include:
- Bioluminescent imaging: Track metastatic spread in real-time using luciferase-labeled CTCs
- Lineage tracing: Identify metastasis-originating subclones through barcoding strategies
- Microenvironment analysis: Study CTC interactions with niche components during colonization
Molecular Characterization and Biomarker Discovery
CTC models enable comprehensive profiling to identify drivers of metastasis and therapeutic targets:
- Genomic analysis: Perform whole exome or targeted sequencing to identify mutations and copy number alterations
- Transcriptomic profiling: Conduct RNA sequencing to characterize EMT states and signaling pathways
- Protein expression: Utilize immunohistochemistry and flow cytometry to validate pathway activation
Signaling Pathways in CTC Biology
Understanding key signaling pathways in CTCs is essential for functional analysis and therapeutic targeting. The following diagram illustrates major pathways implicated in CTC survival, EMT, and metastasis:
Research Reagent Solutions
Table 3: Essential Reagents for CTC-Derived Model Development
| Reagent/Category | Specific Examples | Function/Application |
|---|---|---|
| CTC Enrichment Kits | CellSearch CTC Kit, Parsortix Cassettes, EasySep | Isolation and enumeration of CTCs from whole blood |
| Cell Culture Media | HITES for SCLC, M87 for prostate cancer, RPMI-1640 with growth factors | Optimized nutrition for CTC expansion in vitro |
| Extracellular Matrix | Matrigel, Cultrex BME, Collagen I | 3D culture support and xenograft implantation |
| Cytokines/Growth Factors | EGF, FGF, IGF-1, B-27 Supplement | Promote CTC survival and proliferation |
| ROCK Inhibitor | Y-27632 | Prevents anoikis in low-attachment cultures |
| Stromal Co-culture | Human fibroblasts, Mesenchymal stem cells | Provides trophic support for CTC growth |
| Mouse Models | NSG, NOG, NRG strains | Immunocompromised hosts for CDX development |
| Cell Viability Assays | CellTiter-Glo, MTT, Calcein AM | Assess CTC proliferation and drug response |
CTC-derived models represent a transformative approach in cancer research, bridging the gap between liquid biopsy and functional analysis. These models provide unique insights into metastasis, drug resistance, and tumor heterogeneity while overcoming key limitations of traditional tissue biopsies. As isolation and culture technologies continue to advance, CTC-derived xenografts and cell cultures will play an increasingly vital role in drug development and personalized cancer therapy, ultimately improving outcomes for patients with advanced disease.
Navigating Technical Challenges and Enhancing Assay Performance
Addressing Sensitivity and Specificity Limitations in Early-Stage Disease
The accurate detection of early-stage disease represents a critical challenge in modern healthcare, with significant implications for patient survival and treatment efficacy. Sensitivity and specificity are fundamental measures of a diagnostic test's performance, yet they present inherent limitations when applied to early disease stages where pathological changes are minimal. Sensitivity refers to a test's ability to correctly identify individuals with disease (true positive rate), while specificity measures its ability to correctly identify those without disease (true negative rate) [58]. In early-stage disease detection, these parameters face particular constraints due to lower disease prevalence and minimal biomarker presence, creating a diagnostic frontier where conventional approaches often prove insufficient.
This technical guide examines these limitations within the evolving paradigm of liquid biopsy versus traditional tissue biopsy approaches. Tissue biopsy, while remaining the gold standard for definitive diagnosis, presents significant challenges for early detection and continuous monitoring due to its invasive nature, potential sampling errors, and inability to capture tumor heterogeneity [1]. The emergence of liquid biopsy—analyzing tumor-derived components from bodily fluids—offers a promising complementary approach that addresses some limitations of tissue biopsy while introducing new considerations for test performance characteristics [9].
Fundamental Concepts: Sensitivity, Specificity, and Predictive Values
The performance of diagnostic tests is quantified through several inter-related statistical measures. Sensitivity (true positive rate) represents the probability that a test correctly identifies individuals with the disease, while specificity (true negative rate) represents the probability of correctly identifying non-diseased individuals [58]. These characteristics are particularly crucial in early-stage disease, where the prevalence (proportion of persons with the condition in a defined population) significantly impacts the clinical utility of screening tests [58].
The relationship between these measures is expressed through predictive values. Positive predictive value (PPV) indicates the probability that an individual with a positive test result actually has the disease, while negative predictive value (NPV) indicates the probability that an individual with a negative test result is truly disease-free [58]. These values are critically dependent on disease prevalence; when prevalence of preclinical disease is low, even tests with high sensitivity and specificity can yield low positive predictive values, resulting in numerous false positives [58]. This mathematical reality presents a fundamental challenge for early disease detection in general populations.
For diseases with multiple progressive stages, diagnostic classification extends beyond binary outcomes. In three-stage disease classification (non-disease, early disease, and full disease), sensitivity to the early disease stage (P₂) can be expressed as a function of both specificity for the non-disease stage (P₁) and sensitivity for the full disease stage (P₃): P₂ = P₂(P₁,P₃) = G(H⁻¹(1-P₃)) - G(F⁻¹(P₁)), where F, G, and H are distribution functions for non-diseased, early-diseased, and fully diseased populations, respectively [59].
Table 1: Key Performance Metrics for Diagnostic Tests
| Metric | Definition | Formula | Impact in Early-Stage Disease |
|---|---|---|---|
| Sensitivity | Ability to correctly identify diseased individuals | True Positives / (True Positives + False Negatives) | Often reduced due to low biomarker levels |
| Specificity | Ability to correctly identify non-diseased individuals | True Negatives / (True Negatives + False Positives) | Critical for population screening to minimize false positives |
| Positive Predictive Value (PPV) | Probability that a positive test indicates true disease | (Sensitivity × Prevalence) / [(Sensitivity × Prevalence) + (1-Specificity)×(1-Prevalence)] | Decreases dramatically with low prevalence |
| Negative Predictive Value (NPV) | Probability that a negative test indicates no disease | (Specificity × (1-Prevalence)) / [(Specificity × (1-Prevalence)) + (1-Sensitivity)×Prevalence] | Generally high in low prevalence settings |
| Sensitivity to Early Disease Stage | Correct classification of early-stage disease | G(c₂) - G(c₁) where c₁ and c₂ are thresholds [59] | Requires optimal threshold selection between multiple disease states |
Liquid Biopsy vs. Tissue Biopsy: A Comparative Framework
Liquid biopsy represents a paradigm shift in diagnostic approaches, analyzing tumor-derived components from bodily fluids rather than relying solely on direct tissue sampling. This approach interrogates multiple classes of biomarkers, including circulating tumor cells (CTCs), circulating tumor DNA (ctDNA), tumor-derived extracellular vesicles (EVs), tumor-educated platelets (TEPs), and circulating cell-free RNA (cfRNA) [9]. Each biomarker class offers complementary information about tumor characteristics, including mutational profiles, gene expression patterns, and protein signatures.
The comparative advantages and limitations of liquid biopsy versus tissue biopsy are particularly relevant to addressing sensitivity and specificity challenges in early-stage disease detection. Tissue biopsy, while providing histopathological confirmation and comprehensive tumor characterization, suffers from invasiveness, sampling bias due to tumor heterogeneity, and impracticality for repeated monitoring [1]. Liquid biopsy offers a minimally invasive alternative that captures information from multiple tumor sites simultaneously, enables serial sampling for monitoring disease progression and treatment response, and potentially detects molecular evidence of disease before clinical manifestation [9].
However, liquid biopsy introduces its own sensitivity challenges, particularly in early-stage disease where the concentration of tumor-derived markers in circulation may be extremely low. Circulating tumor DNA (ctDNA) typically constitutes only 0.1-1.0% of total cell-free DNA in cancer patients, presenting significant technical challenges for detection, especially in early-stage disease [1]. Similarly, circulating tumor cells (CTCs) are exceptionally rare in peripheral blood, with approximately 1 CTC per 1 million leukocytes, and most CTCs undergo rapid clearance from circulation within 1-2.5 hours [1].
Table 2: Comparative Analysis: Liquid Biopsy vs. Tissue Biopsy for Early-Stage Disease Detection
| Characteristic | Liquid Biopsy | Tissue Biopsy |
|---|---|---|
| Invasiveness | Minimally invasive (blood draw) | Invasive surgical procedure |
| Sampling Frequency | Suitable for serial monitoring | Limited by procedure risk |
| Tumor Heterogeneity | Captures composite tumor profile | Limited to sampled region |
| Turnaround Time | Rapid processing (hours to days) | Longer processing (days to weeks) |
| Sensitivity in Early Stage | Limited by low ctDNA/CTC concentration [1] | High for sampled area but subject to sampling error |
| Specificity | May detect clonal hematopoiesis or other non-malignant sources | High for confirmed malignancy |
| Spatial Information | Limited without advanced techniques | Preserves tissue architecture |
| Applications in Early Detection | Emerging for screening high-risk populations | Gold standard for diagnostic confirmation |
| Tumor Evolution Tracking | Enables monitoring of clonal dynamics | Requires repeated invasive procedures |
Methodological Approaches to Enhance Sensitivity and Specificity
Technical Advancements in Liquid Biopsy Components
Addressing sensitivity limitations in early-stage disease requires sophisticated methodological approaches across the entire liquid biopsy workflow. For circulating tumor cell (CTC) detection, technologies have evolved from basic density gradient centrifugation to advanced immunomagnetic separation (e.g., CellSearch system - the only FDA-cleared method for CTC enumeration) and microfluidic devices that enhance capture efficiency through both physical properties (size, deformability) and biological markers (EpCAM, vimentin, N-cadherin) [1]. These approaches improve sensitivity while maintaining specificity through multi-parameter validation.
For circulating tumor DNA (ctDNA) analysis, methods have progressed from simple PCR-based detection to digital PCR and next-generation sequencing (NGS) platforms that enable detection of rare mutations at allele frequencies below 0.1% [1]. The unique fragmentomic characteristics of ctDNA—typically shorter fragments (20-50 base pairs) compared to non-malignant cell-free DNA—provide an additional specificity filter when incorporated into analytical pipelines [1]. Epigenetic modifications, particularly DNA methylation patterns, offer promising avenues for enhancing specificity, as methylation imbalances often precede tumor formation and provide tissue-of-origin information [1].
Extracellular vesicle (EV) isolation techniques leverage physical and biochemical properties, with more than 50% of methods employing preparative ultracentrifugation (differential, isopycnic, and moving zone variations) to improve EV purity while reducing contamination [9]. Emerging approaches like nanomembrane ultrafiltration concentrators show promise for more efficient EV separation, potentially enhancing both sensitivity and specificity through improved sample quality.
Statistical and Bioinformatic Approaches
Beyond technical improvements, statistical methodologies play a crucial role in addressing sensitivity and specificity limitations. Empirical likelihood methods have been developed specifically for estimating sensitivity to early disease stages while accounting for predetermined specificity targets and sensitivity for full disease [59]. These non-parametric approaches avoid distributional assumptions and provide flexibility in inference procedures, which is particularly valuable when dealing with the complex distributional characteristics of molecular biomarkers in early-stage disease.
For diseases with ordinal stages (non-disease, early disease, full disease), ROC surface analysis extends traditional binary classification metrics, with volume under the surface (VUS) serving as a summary measure of three-class classification performance [59]. These approaches enable optimization of multiple threshold values (c₁, c₂) to maximize correct classification across all disease states while controlling trade-offs between sensitivity to early disease, specificity for non-disease, and sensitivity to full disease [59].
Table 3: Research Reagent Solutions for Liquid Biomarker Analysis
| Reagent/Category | Specific Examples | Function/Application |
|---|---|---|
| CTC Enrichment Systems | CellSearch EpCAM-based enrichment, Microfluidic devices (e.g., CTC-iChip) | Immunomagnetic or size-based isolation of rare circulating tumor cells from blood |
| ctDNA Extraction Kits | QIAamp Circulating Nucleic Acid Kit, Maxwell RSC ccfDNA Plasma Kit | Isolation and purification of cell-free DNA from plasma samples |
| EV Isolation Reagents | ExoQuick TC, Total Exosome Isolation Reagent, Ultracentrifugation protocols | Precipitation or size-based separation of extracellular vesicles from biofluids |
| NGS Library Prep | AVENIO ctDNA Targeted Kits, Safe-SeqS, TEC-Seq | Amplification and barcoding for error-suppressed sequencing of ctDNA |
| Methylation Analysis | EpiQuick DNA Methylation Kit, Methylation-specific PCR reagents | Bisulfite conversion and analysis of epigenetic modifications in ctDNA |
| Digital PCR Systems | ddPCR Mutation Detection Assays, BEAMing dPCR | Absolute quantification of rare mutations in ctDNA without standard curves |
| Immunofluorescence Stains | Cytokeratin antibodies, CD45 exclusion markers, DAPI nuclear stain | CTC confirmation and characterization through multiparameter microscopy |
Experimental Protocols for Validation Studies
Protocol Framework for Liquid Biopsy Validation
A rigorous research protocol is essential for validating approaches to address sensitivity and specificity limitations in early-stage disease detection. The protocol should begin with clear administrative details including principal investigator information, study title, protocol ID, and involved centers for multi-centric studies [60]. The rationale section must establish the current scientific evidence, identify knowledge gaps, and provide a logical foundation for how the proposed study will address existing limitations in early disease detection [61].
The study design should specify whether the investigation is prospective or retrospective, controlled or uncontrolled, blinded or open-label, and randomized where appropriate [60]. For early detection studies, prospective collection of samples from high-risk cohorts (based on demographic factors, medical history, or occupation) is often necessary to ensure adequate prevalence for meaningful statistical analysis [58]. The primary objective should focus on the main diagnostic performance measure under investigation, such as "To demonstrate that the multi-analyte liquid biopsy assay achieves sensitivity >70% for stage I cancer at 95% specificity." Secondary objectives may include comparison with existing standards, correlation with tissue biopsy results, and assessment across cancer subtypes [60].
Sample size calculation must be justified based on statistical power considerations, accounting for expected prevalence, confidence interval width, and drop-out rates [61]. For rare early-stage conditions, this often requires multi-center collaboration to achieve sufficient sample sizes. Inclusion and exclusion criteria should be precisely defined to minimize selection bias, including specific details about disease status confirmation, prior treatment history, and comorbidities that might affect biomarker levels [60].
Analytical Validation Procedures
The methodology section requires exhaustive detail on all laboratory procedures, including blood collection protocols (tube type, processing time, storage conditions), nucleic acid extraction methods, quality control metrics, and analytical platforms [61]. Standardization across multiple sites is critical, potentially involving central laboratory processing or rigorous harmonization procedures. For ctDNA analysis, this should include DNA quantification methods, fragment size distribution assessment, and minimum input requirements.
Statistical analysis plans must be pre-specified, including procedures for handling missing data, outlier values, and indeterminate results [61]. For diagnostic performance assessment, methodology should include receiver operating characteristic (ROC) analysis, calculation of sensitivity and specificity with confidence intervals, and if applicable, ROC surface analysis for multi-class classification [59]. Empirical likelihood methods may be employed for constructing confidence intervals for sensitivity to early disease stage at given specificity levels [59].
Quality assurance procedures should be documented, including compliance with Good Clinical Practice guidelines, data monitoring plans, and procedures for auditing study conduct [61]. The protocol should also address ethical considerations, including informed consent processes, institutional review board approval, sample usage specifications, and results reporting to participants [61].
Visualizing Workflows and Analytical Approaches
Liquid Biopsy Analytical Workflow
Multi-Threshold Classification for Early Disease Detection
Addressing sensitivity and specificity limitations in early-stage disease detection requires a multi-faceted approach combining technological innovation in liquid biopsy platforms, sophisticated statistical methods for multi-class classification, and rigorous validation protocols. The integration of multiple biomarker classes—CTCs, ctDNA, EVs—provides complementary information that can enhance overall test performance while mitigating the limitations of individual approaches. As liquid biopsy technologies continue to evolve, with ongoing refinement of isolation techniques, analytical sensitivity, and bioinformatic algorithms, their potential to transform early cancer detection and monitoring represents a frontier in diagnostic medicine that merits continued investigation through well-designed clinical studies.
Overcoming Tumor Heterogeneity and Discordant Results Between Modalities
Tumor heterogeneity presents a fundamental challenge in precision oncology, as a single tissue biopsy often fails to capture the complete genomic landscape of a patient's cancer. This spatial and temporal heterogeneity frequently leads to discordant results between different diagnostic modalities, potentially compromising treatment selection and patient outcomes. The emergence of liquid biopsy, which analyzes circulating tumor DNA (ctDNA), circulating tumor cells (CTCs), and other biomarkers from blood, offers a complementary approach to traditional tissue sampling. This technical guide examines the sources and implications of discordance between tissue and liquid biopsy results and provides evidence-based strategies to overcome these challenges within the broader context of cancer diagnostics and therapeutic development.
The clinical imperative for multi-modal assessment is underscored by findings from the ROME trial, which demonstrated that combining tissue and liquid biopsy significantly improved the detection of actionable alterations compared to either method alone. When guided by this combined approach, patients receiving tailored therapy showed markedly improved survival outcomes, with median overall survival reaching 11.05 months compared to 7.7 months with standard of care [62]. This evidence establishes that integrating complementary diagnostic modalities can effectively address tumor heterogeneity to enhance clinical decision-making.
Understanding Discordance: Biological and Technical Foundations
Discordance between tissue and liquid biopsy results arises from multiple biological and technical factors that researchers must understand to properly interpret genomic data.
- Spatial Heterogeneity: Different tumor sites and metastatic lesions may harbor distinct genomic profiles. A tissue biopsy from a single site provides only a localized snapshot, while liquid biopsy captures DNA shed from multiple tumor sites, potentially revealing a more comprehensive genomic landscape [62].
- Temporal Heterogeneity: Tumor genomes evolve over time and under therapeutic selective pressure. The timing of sample collection significantly impacts results, as liquid biopsy reflects real-time tumor dynamics while tissue biopsies represent a historical snapshot [63].
- DNA Shedding Variability: The amount of ctDNA released into circulation varies significantly between tumor types, locations, and individual patients. Tumors with low shedding rates may yield false-negative liquid biopsy results despite the presence of actionable alterations in tissue [7].
- Sensitivity Limitations: Even advanced liquid biopsy assays have detection limits typically around 0.1-0.5% variant allele frequency (VAF), potentially missing low-frequency clones detected in tissue samples [7].
- Sample Quality and Processing: Pre-analytical variables including blood collection tubes, processing delays, and DNA extraction methods can significantly impact ctDNA yield and quality [64].
- Analytical Platform Differences: Variability in gene coverage, sequencing depth, and bioinformatic pipelines between tissue and liquid biopsy platforms contributes to technical discordance [53] [7].
Table 1: Primary Sources of Discordance Between Tissue and Liquid Biopsy
| Discordance Category | Specific Factors | Impact on Results |
|---|---|---|
| Biological Factors | Spatial tumor heterogeneity | Tissue reveals localized profile, liquid captures systemic heterogeneity |
| Temporal heterogeneity & clonal evolution | Tissue provides historical data, liquid offers real-time snapshot | |
| Variable ctDNA shedding rates | Low-shedding tumors may yield false-negative liquid results | |
| Technical Factors | Assay sensitivity limitations | Liquid may miss low VAF variants detected in tissue |
| Pre-analytical variables | Sample collection & processing affect both ctDNA yield and quality | |
| Platform & methodological differences | Variability in gene coverage, sequencing depth, and analysis |
Methodological Approaches for Multi-Modal Integration
Analytical Validation Frameworks
Robust analytical validation is essential for reliable implementation of multi-modal profiling. The International Society of Liquid Biopsy (ISLB) has established minimal requirements for ctDNA testing across pre-analytical, analytical, and post-analytical phases [64]. Key considerations include:
- Reference Standards: Implementation of well-characterized reference materials for quality control across variant types and tumor fractions.
- Limit of Detection (LOD) Determination: Establishing assay sensitivity through dilution series of known mutations in wild-type background, with recommended LOD of ≤0.5% VAF for most clinical applications.
- Precision and Reproducibility: Assessment of both within-run and between-run variability across multiple operators, instruments, and days.
The Northstar Select assay validation exemplifies this approach, demonstrating a 95% limit of detection at 0.15% VAF for SNVs/indels through digital droplet PCR confirmation, with sensitive detection of copy number variations (down to 2.11 copies for amplifications) and gene fusions (0.30% VAF) [7].
Experimental Protocols for Concordance Studies
For researchers designing studies to evaluate discordance between modalities, the following protocol provides a methodological framework:
Sample Collection Protocol:
- Concurrent Sampling: Collect tissue and blood samples within 14 days, prior to initiation of new therapy.
- Blood Collection: Draw 20-30mL whole blood into cell-stabilizing tubes (e.g., Streck, PAXgene).
- Processing: Isolate plasma within 4 hours of collection through double centrifugation (1600×g for 20min, then 16,000×g for 20min).
- Storage: Aliquot and store plasma at -80°C until cfDNA extraction.
DNA Extraction and Quality Control:
- cfDNA Extraction: Use commercial cfDNA extraction kits (e.g., QIAamp Circulating Nucleic Acid Kit) with elution in low-EDTA TE buffer.
- Quality Assessment: Quantify cfDNA using fluorometric methods (e.g., Qubit dsDNA HS Assay) and assess fragment size distribution (e.g., Bioanalyzer/TapeStation).
- Tissue DNA Extraction: Use FFPE DNA extraction kits with de-crosslinking step, followed by quality assessment via spectrophotometry and fragment analysis.
Library Preparation and Sequencing:
- Library Construction: Use hybrid capture-based methods targeting 1.5-3Mb genomic regions encompassing key cancer genes.
- Sequencing: Sequence to minimum 10,000X raw coverage for liquid biopsy and 500-1000X for tissue using Illumina platforms.
- Unique Molecular Indexing: Incorporate UMIs to enable accurate variant calling and removal of PCR duplicates.
Bioinformatic Analysis:
- Variant Calling: Use dual calling approach with at least two independent variant callers, with manual review of discordant calls.
- Clonal Hematopoiesis Filtering: Filter variants present in matched white blood cells or population databases of clonal hematopoiesis.
- Actionability Assessment: Annotate variants using curated knowledge bases (e.g., OncoKB, CIViC).
Table 2: Essential Research Reagent Solutions for Multi-Modal Biopsy Studies
| Reagent Category | Specific Examples | Research Application |
|---|---|---|
| Blood Collection Tubes | Streck Cell-Free DNA BCT, PAXgene Blood cDNA Tube | Preserves cell-free DNA integrity by stabilizing nucleated blood cells |
| Nucleic Acid Extraction Kits | QIAamp Circulating Nucleic Acid Kit, Maxwell RSC ccfDNA Plasma Kit | Isolation of high-quality cfDNA from plasma with minimal contamination |
| Library Preparation | Illumina TruSight Oncology 500, AVENIO ctDNA Kit | Target enrichment for comprehensive cancer gene panels |
| Reference Standards | Seraseq ctDNA Reference Materials, Horizon Multiplex I cfDNA | Assay validation, quality control, and limit of detection studies |
| Digital PCR Systems | Bio-Rad ddPCR System, QIAGEN QIAcuity | Orthogonal validation of low-frequency variants |
Clinical Evidence and Validation Studies
The ROME Trial: A Paradigm for Multi-Modal Profiling
The phase 2 ROME trial (NCT04591431) provides compelling evidence for the clinical value of combined tissue-liquid biopsy profiling. In this study of 1,794 patients with advanced solid tumors, genomic profiling was performed using both FoundationOne CDx (tissue) and FoundationOne Liquid CDx (blood) [62]. The key findings included:
- Actionable Alterations: Combined profiling identified 400 patients with actionable alterations, with concordance between tissue and liquid biopsy in only 49.2% of cases.
- Discordance Distribution: Actionable alterations were detected exclusively in tissue in 34.7% of patients and exclusively in liquid biopsy in 16% of patients.
- Survival Benefit: Patients with concordant findings who received tailored therapy based on dual profiling showed significantly improved overall survival (11.05 months vs. 7.7 months with standard care) and progression-free survival (4.93 months vs. 2.8 months).
These findings demonstrate that neither modality alone can fully capture the molecular complexity of advanced cancers, and that combined profiling maximizes opportunities for targeted therapy intervention.
Analytical Performance of Advanced Liquid Biopsy Assays
Recent technological advancements have substantially improved the sensitivity of liquid biopsy platforms. The Northstar Select assay validation study demonstrated a 95% limit of detection at 0.15% VAF for single nucleotide variants and indels, outperforming existing commercial assays by detecting 51% more pathogenic SNVs/indels and 109% more copy number variations [7]. Importantly, 91% of the additional clinically actionable variants were detected below 0.5% VAF, highlighting the critical importance of low-end sensitivity for comprehensive genomic profiling.
Diagram 1: Multi-Modal Profiling Clinical Workflow
Emerging Technologies and Future Directions
Artificial Intelligence and Multi-Modal Data Integration
Artificial intelligence approaches are increasingly being applied to enhance the diagnostic capabilities of liquid biopsy and integrate multi-modal data streams. AI algorithms can identify subtle patterns in complex genomic data that may not be apparent through conventional analysis [65]. Promising applications include:
- Radiomics Integration: Combining liquid biopsy data with quantitative imaging features to improve early detection and monitoring.
- Multi-Omics Data Fusion: Simultaneous analysis of genomic, epigenomic, transcriptomic, and proteomic data from liquid biopsy analytes.
- Longitudinal Monitoring: Machine learning models that track changes in ctDNA profiles over time to predict treatment resistance and disease progression.
Novel Analytical Approaches
Emerging technologies show significant potential for addressing current limitations in liquid biopsy:
- Raman Spectroscopy: When combined with machine learning, this label-free technique can classify exosomes from different cancer types with high accuracy (93.3% overall in recent studies) based on their unique lipid compositions [66].
- Fragmentomics: Analysis of cfDNA fragmentation patterns provides epigenetic information that can enhance cancer detection and tissue-of-origin identification without requiring genetic mutations [53].
- Methylation Profiling: Comprehensive methylation analysis of ctDNA enables both cancer detection and determination of the cancer signal origin with high accuracy (88.2% top prediction accuracy in one study) [53].
Diagram 2: Discordance Resolution Framework
Overcoming tumor heterogeneity and discordant results between diagnostic modalities requires a systematic approach that leverages the complementary strengths of both tissue and liquid biopsies. The evidence presented demonstrates that integrated profiling significantly enhances the detection of actionable alterations and improves patient outcomes compared to single-modality approaches. As technological advancements continue to increase the sensitivity and breadth of liquid biopsy assays, while artificial intelligence enables more sophisticated multi-modal data integration, the research and clinical communities must simultaneously address standardization challenges through initiatives like those led by the International Society of Liquid Biopsy and the European Liquid Biopsy Society. The future of precision oncology lies in embracing diagnostic approaches that fully capture the spatial and temporal complexity of cancer, moving beyond the limitations of single-site, single-timepoint sampling toward dynamic, comprehensive molecular profiling.
Standardization of Pre-analytical and Analytical Variables
The evolution of precision oncology is fundamentally linked to the reliability of molecular diagnostics. While tissue biopsy has long been the gold standard for tumor profiling, its invasive nature, inability to capture full tumor heterogeneity, and impracticality for serial monitoring present significant limitations [1]. Liquid biopsy, which analyzes tumor-derived components from blood or other bodily fluids, offers a minimally invasive alternative for genomic profiling, enabling real-time monitoring of tumor dynamics and treatment response [9] [1]. However, the transition of these biomarkers from research to clinical practice is hampered by a critical challenge: a lack of standardization in both pre-analytical and analytical variables. This variability significantly contributes to the discordant results often observed between tissue and liquid biopsy platforms, potentially affecting patient management strategies [4] [67]. Standardizing these processes is therefore not merely a technical exercise but a prerequisite for advancing personalized cancer therapy and ensuring that diagnostic results are reproducible, reliable, and actionable across different laboratories and clinical settings [68] [69]. This guide provides a detailed technical framework for standardizing these variables within the context of comparative biopsy research.
The Critical Need for Standardization in Biopsy Research
The absence of standardized protocols is a major hindrance to the development of effective biomarker-driven strategies, as pre-analytical processing constitutes the single largest source of variability in laboratory testing [68]. This lack of standardization directly impacts clinical research and patient care. Findings from the phase II ROME trial highlight this issue, demonstrating that concordance between tissue and liquid biopsies for detecting actionable genomic alterations was only 49% [4] [67]. In this trial, 35% of alterations were detected exclusively in tissue, and 16% exclusively in liquid biopsy [67]. This discordance, attributed to factors such as differences in molecular alteration detection (43.3%) and test failures (21%), has profound clinical implications [67].
Crucially, the ROME trial showed that patients whose tailored therapy was guided by the same genomic alteration found in both biopsy types experienced significantly improved outcomes, with a median overall survival of 11.05 months compared to 7.7 months for standard-of-care patients [4]. This superior outcome underscores that concordance, achievable only through reliable and comparable testing methods, is key to optimal patient selection. Standardization minimizes technical noise, allowing for a clearer understanding of true biological discordance (e.g., due to tumor heterogeneity) and ensuring that clinical decisions are based on robust and reproducible data [68] [69].
Standardizing Pre-Analytical Variables
Pre-analytical variables encompass all procedures from sample collection to processing before the actual analysis. Controlling these is foundational for sample integrity.
Key Pre-Analytical Variables and Their Impact
Table 1: Controllable and Uncontrollable Pre-Analytical Variables in Blood-Based Biomarkers [68]
| Controllable Variables | Uncontrollable Variables |
|---|---|
| Time of collection & processing | Demographic characteristics (age, sex, ethnicity) |
| Fasting status | Genetic polymorphisms (e.g., ApoE ε4) |
| Needle size & location of draw | Smoking status, diet, alcohol use |
| Tube type and additives (e.g., EDTA, citrate) | Medications |
| Tube handling (e.g., number of inversions) | Non-AD comorbidities |
| Centrifugation parameters (speed, time, temperature) | Activity level |
| Time from collection to freeze/fixation | Gestation |
| Temperature of storage and freeze-thaw cycles | |
| Aliquot size and handling |
Standardized Protocols for Liquid Biopsy Samples
Liquid biopsy components like circulating tumor DNA (ctDNA) are particularly susceptible to pre-analytical variation due to their low abundance and short half-life [1]. The following workflow diagram outlines a standardized protocol for liquid biopsy sample processing:
Detailed Methodologies:
- Blood Collection: Use collection tubes validated for cell-free DNA stability (e.g., Streck Cell-Free DNA BCT or PAXgene Blood cDNA tubes) [69]. Draw blood using a standardized needle size (e.g., 21-gauge) and ensure consistent order of draw if multiple tubes are collected.
- Sample Handling: Gently invert the collection tube 8-10 times immediately after draw to ensure proper mixing of the anticoagulant [68]. Document the time of collection.
- Transport and Processing: Transport samples at a consistent temperature (e.g., room temperature for specific stabilized tubes) to the lab. Process plasma within a strict, pre-defined window (e.g., within 2-6 hours of collection) [69]. Process using a two-step centrifugation protocol: an initial centrifugation at 2,000 x g for 10 minutes at 4°C to separate plasma from cells, followed by a second, higher-speed centrifugation of the plasma at 16,000 x g for 10 minutes at 4°C to remove any remaining cellular debris [9] [1].
- Storage: Aliquot the purified plasma into cryovials to avoid freeze-thaw cycles and store immediately at ≤ -80°C [68]. Document the freeze time and storage location meticulously.
Standardized Protocols for Tissue Biopsy Samples
Tissue biopsy standardization focuses on preserving nucleic acid and protein integrity and ensuring representative sampling.
- Collection and Fixation: Immediately upon collection, place the tissue specimen in a pre-labeled container with an adequate volume of 10% Neutral Buffered Formalin. The fixation time should be standardized; for most tissues, fixation for 6-72 hours is recommended, with 24-48 hours being a common standard to prevent under- or over-fixation, which can degrade biomolecules [1].
- Processing and Embedding: Process the fixed tissue through a series of graded alcohols and xylene using an automated tissue processor under standardized run conditions. Embed in paraffin wax to create a Formal-Fixed Paraffin-Embedded (FFPE) block.
- Sectioning and Storage: Section the FFPE block at a defined thickness (e.g., 4-5 μm for DNA/RNA analysis, 4 μm for IHC). Mount sections on positively charged slides. Store FFPE blocks and slides in a cool, dry place. For long-term molecular studies, store nucleic acids extracted from FFPE tissue at -80°C.
Standardizing Analytical Variables
Analytical standardization ensures that the measurement process itself is consistent, accurate, and reproducible across different platforms and laboratories.
Key Analytical Variables
- Nucleic Acid Extraction: Use validated kits and automated extraction systems where possible to minimize manual variability. Quantify DNA/RNA using fluorometric methods (e.g., Qubit) rather than spectrophotometry for accuracy, especially for fragmented cfDNA [1].
- Platform Calibration: Regularly calibrate all equipment, including centrifuges, thermocyclers, and next-generation sequencers, according to manufacturer specifications and internal quality control schedules [70].
- Assay Validation: Establish and validate the performance characteristics of any in-house assay, including sensitivity, specificity, precision, and limit of detection (LOD). For ctDNA assays, the LOD must be defined for variant allele fractions (VAFs), often below 1% [1].
- Data Analysis and Bioinformatics: Standardize bioinformatics pipelines for variant calling, including the reference genome, aligners (e.g., BWA), and variant callers. Establish a minimum coverage depth (e.g., 1000x for ctDNA) and use a standardized set of positive and negative controls in every run to ensure analytical validity [1].
Quantitative Data Standardization Methods
In data analysis, variables measured on different scales (e.g., expression levels from different platforms) require standardization to be comparable. Common methods include:
Table 2: Common Data Standardization Formulas and Their Applications in Biomarker Research [71] [72]
| Method | Formula | Application Context | ||||||||
|---|---|---|---|---|---|---|---|---|---|---|
| Z-Score Standardization | Z = (X - μ) / σWhere μ is mean and σ is standard deviation |
Principal Component Analysis (PCA), clustering algorithms. Creates a mean of 0 and standard deviation of 1 [72]. | ||||||||
| Min-Max Scaling | S = (X - X_min) / (X_max - X_min) |
Scaling data to a fixed range [0, 1]. Useful for distance-based algorithms like k-nearest neighbors [71]. | ||||||||
| Mean Normalization | M = (X - μ) / (X_max - X_min) |
An alternative that centers data around zero based on the data's range [71]. | ||||||||
| Unit Vector Transformation | `U = X / | X | `Where | X | is the Euclidean length | Used in algorithms relying on dot products, such as cosine similarity for text or proteomic data analysis [71]. |
The Scientist's Toolkit: Essential Reagents and Materials
Table 3: Key Research Reagent Solutions for Standardized Biopsy Processing
| Item | Function & Rationale |
|---|---|
| Cell-Free DNA Blood Collection Tubes (e.g., Streck BCT) | Preserves blood cell integrity and prevents lysis, stabilizing cfDNA/ctDNA for up to 14 days at room temperature, crucial for multi-site trials [69]. |
| Magnetic Bead-Based Nucleic Acid Kits | Enable high-throughput, automated extraction of high-quality DNA/RNA from plasma or FFPE, offering better reproducibility and recovery of fragmented nucleic acids than silica-column methods. |
| Ultra-Sensitive NGS Library Prep Kits | Designed for low-input and degraded samples (e.g., from FFPE or low VAF ctDNA). Often incorporate unique molecular identifiers (UMIs) to correct for PCR errors and sequencing artifacts [1]. |
| Multiplexed PCR Assay Panels | Allow for targeted sequencing of specific cancer-related genes with high depth and low cost, facilitating standardized screening across a cohort [1]. |
| Reference Standard Materials | Commercially available synthetic or cell-line derived controls with known mutation profiles. Used to validate assay performance, determine LOD, and enable cross-lab benchmarking [70]. |
| Bioinformatics Pipeline Software (e.g., GATK, custom scripts) | Standardized, version-controlled software and parameters for data alignment, variant calling, and annotation are critical for reproducible results [1]. |
Integrated Workflow and Pathway Analysis
Success in precision oncology often relies on integrating data from multiple sources. The following diagram illustrates a robust diagnostic and therapeutic decision pathway that leverages both tissue and liquid biopsies, accounting for their respective strengths and the need for standardized results.
Analysis of Key Discordant Pathways: The ROME trial identified the PI3K/PTEN/AKT/mTOR and ERBB2 pathways as having the highest rates of discordance between tissue and liquid biopsies [67]. This can be due to biological factors, such as heterogeneous expression of these pathway alterations across different metastatic sites, or technical factors related to the different sensitivities of tissue and plasma assays to the specific genomic architecture of alterations in these genes (e.g., copy number variations vs. single nucleotide variants). Standardized protocols help isolate the biological causes from technical noise.
Distinguishing Tumor-Derived Signals from Clonal Hematopoiesis
Liquid biopsy, the analysis of tumor-derived components in bodily fluids, represents a paradigm shift in oncology, offering a minimally invasive alternative to traditional tissue biopsy for cancer diagnosis, monitoring, and treatment selection [9] [1]. This approach enables serial sampling, providing a dynamic view of tumor evolution and heterogeneity that is difficult to capture with single-site tissue biopsies [9]. However, the accurate interpretation of liquid biopsy data is complicated by a pervasive biological phenomenon: clonal hematopoiesis (CH).
Clonal hematopoiesis describes the age-related expansion of hematopoietic stem cells carrying somatic mutations, occurring in over 42% of cancer patients and a significant portion of the elderly population [73] [74]. CH-derived mutations can be detected in cell-free DNA (cfDNA) from blood samples and often affect genes commonly mutated in solid tumors, creating a critical interpretative challenge [75] [73]. This overlap confounds variant interpretation in plasma-only liquid biopsy testing, potentially leading to false-positive results that could misguide clinical decisions, such as selecting ineffective treatments or overlooking beneficial therapeutic options [73]. Consequently, distinguishing true tumor-derived signals from CH-derived background noise has emerged as an essential prerequisite for realizing the full potential of liquid biopsy in precision oncology.
Understanding Clonal Hematopoiesis and Its Interference
Biology and Prevalence of Clonal Hematopoiesis
Clonal hematopoiesis arises from somatic mutations acquired in hematopoietic stem cells over a lifetime, conferring a selective growth advantage that leads to their clonal expansion [74]. While most age-related mutations have minimal functional impact, mutations in specific driver genes can lead to significant clonal populations. CH is prevalence-dependent, detected in less than 1% of individuals under 40 but rising to 20% or more in those over 90 [74]. External factors such as smoking, obesity, infections, and exposure to cancer therapies can accelerate its development [74].
The genetic landscape of CH is dominated by mutations in a limited set of genes involved in key cellular processes:
- Epigenetic regulation: DNMT3A, TET2, ASXL1
- Signal transduction: JAK2
- RNA splicing: SF3B1, SRSF2
- DNA damage response: TP53, PPM1D [74]
While CH itself is not considered a malignancy, it is associated with a 0.5-1% per year increased risk of developing hematologic cancers [73]. More significantly for solid tumor diagnostics, CH is associated with increased overall mortality primarily driven by cardiovascular and other inflammatory diseases, underscoring its systemic impact [74].
The Diagnostic Challenge in Liquid Biopsy
In liquid biopsy analysis, the fundamental challenge stems from the significant genetic overlap between CH and solid tumors. CH-derived variants can comprise over 75% of cfDNA variants in individuals without cancer and more than 50% of cfDNA variants in those with cancer [75]. This high background noise complicates the detection of true tumor-derived circulating tumor DNA (ctDNA), particularly at low variant allele frequencies (VAFs) characteristic of early-stage disease or minimal residual disease monitoring.
The problem is particularly acute for mutations in genes like TP53, which are frequently altered in both solid tumors and CH [75]. Without robust discrimination methods, CH variants can be misclassified as tumor-derived, leading to false-positive cancer signals, incorrect assessment of tumor mutational burden, and misguided treatment selection based on potentially irrelevant mutations [73].
Diagram 1: Liquid Biopsy Workflow and CH Interpretation Challenge. The process from blood draw to variant interpretation shows the convergence of tumor-derived and CH-derived signals, creating a diagnostic challenge.
Technical Approaches for Signal Discrimination
Matched White Blood Cell Sequencing
The current gold standard for identifying CH variants involves sequencing matched white blood cells (WBCs) or peripheral blood mononuclear cells (PBMCs) alongside plasma cfDNA.
Experimental Protocol:
- Sample Collection: Collect peripheral blood in cell-stabilizing tubes (e.g., Streck, PAXgene) to prevent cell lysis and genomic DNA contamination.
- Plasma and Buffy Coat Separation: Centrifuge blood at 800-1600 × g for 10-20 minutes to separate plasma (top layer) from buffy coat (middle layer containing WBCs).
- Nucleic Acid Extraction: Extract cfDNA from plasma using silica-membrane or magnetic bead-based kits. Isolve genomic DNA from the buffy coat using standard methods.
- Library Preparation and Sequencing: Prepare sequencing libraries for both cfDNA and WBC DNA using compatible kits. Sequence to high depth (≥10,000x for cfDNA, ≥500x for WBC).
- Variant Calling and Filtering: Call variants in both samples. Filter out any variant detected in the WBC sample as CH-derived. Retain variants exclusive to plasma as potential tumor-derived signals [75].
Limitations: While effective, this approach doubles sequencing costs and requires additional sample material. Furthermore, technical challenges include the fragility of WBCs compared to red blood cells and the possibility that some CH clones may exist at levels below the detection threshold in WBC sequencing yet still contribute detectable mutations to cfDNA [75].
Bioinformatic and Machine Learning Approaches
When matched WBC sequencing is unavailable or impractical, bioinformatic methods offer alternative approaches for distinguishing CH variants. Machine learning frameworks have demonstrated particular promise in classifying variant origin from plasma-only sequencing data.
MetaCH Framework Protocol: MetaCH is an open-source machine learning framework that classifies variants in cfDNA as CH or tumor origin through three stages [75]:
Feature Extraction:
- Variant Embeddings (Eᵥ): Numerical representations learned through self-supervised models based on sequence context, associated gene, and cancer type.
- Gene Embeddings (Eᵦ): Patterns of genes with variants within individual patients using NLP-inspired approaches.
- Functional Prediction Scores (Eƒ): Impact quantification of non-synonymous variants using annotation tools (SnpEff, SnpSift).
Base Classifier Training:
- cfDNA-Based Classifier: Trained on datasets with matched WBC and tumor sequencing, incorporating VAF and cancer type features.
- Sequence-Based Classifiers: Trained on large public datasets of tumor and blood-derived variants (77,068 tumor-derived; 9,810 blood-derived variants).
Meta-Classification: A logistic regression model combines scores from base classifiers into a final CH-likelihood score (S_Meta) representing the probability that a variant originates from CH [75].
Table 1: Performance Comparison of CH Discrimination Methods
| Method | Principle | Advantages | Limitations | Reported Performance |
|---|---|---|---|---|
| Matched WBC Sequencing | Physical separation and sequencing of hematopoietic cell DNA | Gold standard; direct detection | Costly; requires extra sample; may miss low-VAF clones | >95% specificity for common CH genes [75] |
| MetaCH AI Framework | Machine learning integration of multiple feature sets | No matched sample needed; scalable | Limited by training data diversity; computational complexity | Superior auPR across multiple validation datasets [75] |
| Database Filtering | Reference databases of known CH variants | Simple implementation; fast | Misses novel/individual-specific CH variants; limited sensitivity | Variable; depends on database comprehensiveness [75] |
| VAF Thresholding | Allele frequency-based filtering | Simple; no additional data needed | Overlaps in VAF distributions; high false-negative rate | Limited accuracy for low-VAF variants [75] |
DNA Methylation Profiling
DNA methylation patterns represent another promising approach for distinguishing tissue of origin, as methylation signatures are highly tissue-specific and frequently altered in cancer.
Experimental Protocol:
- DNA Extraction and Bisulfite Conversion: Extract cfDNA from plasma and treat with bisulfite to convert unmethylated cytosines to uracils while leaving methylated cytosines unchanged.
- Library Preparation and Sequencing: Prepare sequencing libraries using bisulfite-compatible kits. Target either genome-wide methylation (Whole Genome Bisulfite Sequencing) or specific marker panels.
- Methylation Analysis: Map sequencing reads to reference genomes and calculate methylation ratios at CpG sites. Compare observed patterns to reference methylation atlas of different tissues and cancer types.
- Tissue of Origin Assignment: Use statistical models or machine learning classifiers to assign the tissue source of cfDNA fragments based on their methylation patterns [27].
This approach leverages the stability of DNA methylation patterns, which often emerge early in tumorigenesis and remain stable throughout tumor evolution [27]. The inherent stability of DNA and the relative enrichment of methylated DNA fragments in cfDNA due to nuclease protection further enhance this method's utility [27].
Diagram 2: Three Primary Technical Approaches for CH-Tumor Discrimination. Multiple computational and experimental methodologies can be applied to the same sequencing data to distinguish variant origins.
The Scientist's Toolkit: Essential Research Reagents and Materials
Table 2: Essential Research Reagents for CH Discrimination Studies
| Reagent/Material | Function | Application Notes |
|---|---|---|
| Cell-Stabilizing Blood Collection Tubes (e.g., Streck, PAXgene) | Preserves blood cell integrity, prevents gDNA release | Critical for accurate WBC separation; different stabilizers may affect downstream assays [75] |
| cfDNA Extraction Kits (silica-membrane or magnetic bead-based) | Isolation of high-quality cfDNA from plasma | Maximize yield of short cfDNA fragments; minimize contamination from cellular genomic DNA [27] |
| WBC DNA Extraction Kits | Isolation of genomic DNA from buffy coat | Standard protocols sufficient; quality checks important for sequencing [75] |
| Bisulfite Conversion Kits | Chemical treatment for methylation analysis | Convert unmethylated cytosine to uracil; optimize for low-input cfDNA [27] |
| Next-Generation Sequencing Library Prep Kits | Preparation of sequencing libraries | Select kits compatible with cfDNA fragment size; consider hybrid capture vs. amplicon approaches [75] |
| Targeted Panels for CH-Associated Genes | Enrichment of relevant genomic regions | Should include common CH drivers: DNMT3A, TET2, ASXL1, TP53, JAK2, SF3B1 [74] |
| Bioinformatic Pipelines (e.g., GATK, VarScan) | Variant calling from sequencing data | Optimize parameters for low-VAF variant detection in cfDNA [75] |
| Reference Databases (e.g., dbSNP, gnomAD, COSMIC) | Annotation of variant frequency and association | Include CH-specific databases when available [75] |
Implications for Clinical Practice and Drug Development
The accurate discrimination between tumor-derived signals and CH has profound implications across the cancer care continuum. In diagnostic settings, misclassification of CH variants can lead to false-positive cancer signals, particularly in multi-cancer early detection tests that analyze cfDNA for cancer screening [76] [73]. For treatment selection, correctly identifying variant origin is essential when using liquid biopsy to guide targeted therapies, as misattribution may lead to administration of ineffective treatments with unnecessary toxicity [73].
In therapeutic development, the challenge extends to clinical trial design and interpretation. CH can confound patient selection based on liquid biopsy biomarkers and assessment of treatment response through ctDNA monitoring [9]. Drug developers must implement rigorous CH discrimination protocols to ensure accurate endpoint measurement in trials evaluating targeted therapies, particularly for genes commonly affected by CH such as TP53 [75].
The field is increasingly moving toward integrated approaches that combine wet-lab and computational methods. As noted in clinical practice, "Alone, none of these strategies can provide the precision needed for accurate patient care. But together, they help liquid biopsy fulfill its promise: a faster, noninvasive, and more informative option for selecting the right cancer therapies" [73].
The discrimination between tumor-derived signals and clonal hematopoiesis represents a critical frontier in liquid biopsy development. Future advancements will likely come from several directions: improved computational methods integrating multi-omics data, comprehensive CH reference databases capturing population diversity, standardized experimental protocols across laboratories, and clinical validation of CH-discrimination methods in diverse patient populations [75] [27].
The integration of artificial intelligence approaches shows particular promise, with systems like MetaCH demonstrating that machine learning can capture subtle patterns in variant characteristics that distinguish their tissue of origin [75]. However, as with any AI system in medicine, these tools require rigorous validation across diverse populations and clinical settings before they can be fully relied upon in patient care [73].
As liquid biopsy continues to evolve from a research tool to clinical standard practice, the ability to accurately distinguish tumor-derived signals from the background of clonal hematopoiesis will remain essential for realizing its potential in precision oncology. Through continued methodological refinement and validation, researchers and clinicians are moving closer to the goal of comprehensive, accurate molecular profiling through minimally invasive means.
Strategies for Isolating and Analyzing Rare CTCs and ctDNA Fragments
The advent of precision oncology has been significantly accelerated by the development of liquid biopsy—a minimally invasive approach for analyzing tumor-derived components from biofluids. Unlike traditional tissue biopsies, which provide a limited snapshot of a static tumor and are constrained by invasiveness and sampling bias, liquid biopsy captures dynamic, systemic information about tumor heterogeneity and evolution in real-time [77] [9]. This technical guide focuses on the core components of liquid biopsy: Circulating Tumor Cells (CTCs), which are intact cells shed from tumors into the bloodstream, and circulating tumor DNA (ctDNA), which are short DNA fragments released from tumor cells via apoptosis or necrosis [77] [63]. The isolation and molecular analysis of these rare analytes (as low as 1-10 CTCs per billion blood cells) present unique technical challenges but offer unprecedented opportunities for early cancer detection, monitoring treatment response, identifying resistance mechanisms, and guiding personalized therapy [77] [78].
Circulating Tumor Cell (CTC) Isolation and Analysis
CTC Enrichment Strategies
CTCs are rare, with a short half-life of less than 1-2.5 hours, making their isolation technically demanding [63]. Enrichment strategies typically leverage biological or physical properties to separate CTCs from the abundant background of hematological cells.
Table 1: Comparison of Major CTC Enrichment Platforms
| Platform/Technology | Enrichment Principle | Target/Key Feature | FDA Status | Key Applications |
|---|---|---|---|---|
| CellSearch System [77] [63] | Immunomagnetic (Positive Selection) | EpCAM, Cytokeratins (CKs) | Approved | Prognostic indicator in metastatic breast, prostate, & colorectal cancer |
| Parsortix PC1 System [77] | Physical Property (Size/Deformability) | Size-based capture (>7.5 µm) | Approved | Captures heterogeneous CTC populations; viable cells for downstream analysis |
| Integrated Flow Cytometry Platform [78] | Immunomagnetic (Negative Depletion) | CD45, Ter-119 (depletes WBCs/RBCs) | Research | High-purity recovery of single cells and clusters; links phenotype to genotype |
| RosetteSep [77] [63] | Immunomagnetic (Negative Selection) | CD45, CD66b, Glycophorin A | Research | Depletes hematopoietic cells |
| Microfluidic Filtration [77] [63] | Physical Property (Size) | Size-based capture (>8 µm) | Research | Label-free approach |
Downstream Molecular Analysis of CTCs
Once enriched, CTCs can be characterized at the molecular level to uncover genetic, transcriptomic, and proteomic insights.
- Genomic Analysis: DNA from enriched CTC populations can be used for whole-exome sequencing (WES) or low-pass whole-genome sequencing (lpWGS) to identify mutations and copy number alterations [63].
- Single-Cell RNA Sequencing (scRNA-seq): This powerful tool dissects CTC heterogeneity at single-cell resolution. A standardized 12-step workflow has been proposed, spanning from viable CTC enrichment to data analysis, enabling the identification of distinct epithelial and mesenchymal sub-populations and rare hybrid cells [79]. Technological advancements like the Hydro-Seq system and NICHE nanoplatform allow for robust transcriptomic profiling of live CTCs [79].
- Protein-Level Analysis: Immunofluorescence is used to detect protein expression, such as the subcellular localization of AR-V7 in prostate cancer, which is correlated with response to AR-targeting therapies [63].
Experimental Protocol: Integrated Flow Cytometry-Based CTC Isolation
This protocol outlines a method for high-purity isolation of viable single CTCs and clusters for transcriptomic analysis [78].
- Blood Collection and Staining: Collect peripheral blood. Label with fluorescently conjugated antibodies (e.g., anti-CD45) and viability markers (e.g., DAPI). Add BD IMag magnetic particles conjugated to antibodies against leukocytes (CD45) and RBCs (Ter-119).
- Red Blood Cell Lysis: Add a gentle RBC lysis buffer to the sample to preserve CTC viability.
- Pre-Enrichment without Centrifugation: Directly load the sample onto the integrated platform to avoid cell loss.
- Magnetic Depletion: The sample passes through a magnetic separator, depleting magnetically labeled WBCs and RBCs.
- Acoustic Washing and Focusing: The sample flows through an acoustic focusing chip, which uses ultrasonic standing waves to separate larger nucleated cells (CTCs) from smaller debris, RBCs, and platelets. Wash buffer is introduced in-line to further clean the sample.
- Flow Cytometry and Cell Sorting: The pre-enriched sample is analyzed and sorted using a flow cytometer (e.g., BD Influx). The index sorting feature records the high-content phenotypic profile of every single cell sorted.
- Downstream Molecular Analysis: Isolated single cells or clusters are deposited into plates for downstream applications like whole transcriptome amplification (WTA) or quantitative PCR (qPCR).
Diagram 1: Integrated CTC isolation and analysis workflow.
Research Reagent Solutions for CTC Analysis
Table 2: Key Reagents for CTC Research
| Research Reagent | Function | Application Example |
|---|---|---|
| Anti-EpCAM Magnetic Beads [77] [63] | Immunomagnetic positive selection of epithelial CTCs | CellSearch System, AdnaTest |
| Anti-CD45 Magnetic Beads [63] [78] | Immunomagnetic negative depletion of white blood cells | Integrated flow cytometry platform, RosetteSep |
| rVAR2 Protein [80] | Extracellular staining of oncofetal chondroitin sulfate on CTCs | mRNA-friendly CTC identification for transcriptomics |
| Cytokeratin (CK 8,18,19) Antibodies [77] [63] | Intracellular staining for epithelial cell identification | CTC identification in CellSearch and other platforms |
| DAPI (Nuclear Dye) [63] [78] | Viability and nuclear staining | Distinguishing nucleated cells in flow cytometry |
Circulating Tumor DNA (ctDNA) Isolation and Analysis
ctDNA Biology and Detection Platforms
ctDNA are short (160-200 bp), double-stranded fragments with a very short half-life of 15 minutes to 2.5 hours, making them a near real-time biomarker of tumor burden [77] [63]. The tumor fraction (TF), representing the proportion of ctDNA in total cell-free DNA (cfDNA), is a critical metric for diagnosis and monitoring [77]. Detection requires highly sensitive technologies due to low TF in early-stage disease.
Table 3: Comparison of Major ctDNA Detection Platforms
| Platform/Technology | Core Technology | Biomarkers Detected | FDA Status | Key Feature |
|---|---|---|---|---|
| Guardant360 CDx [77] | Next-Generation Sequencing (NGS) | SNVs, Indels, CNVs, fusions (80+ genes) | Approved | Comprehensive genomic profiling; tumor-agnostic |
| FoundationOne Liquid CDx [77] | Next-Generation Sequencing (NGS) | SNVs, Indels, CNVs, fusions (300+ genes) | Approved | Comprehensive genomic profiling; tumor-agnostic |
| Signatera [77] | Next-Generation Sequencing (NGS) | Patient-specific somatic variants | - | Tumor-informed; highly sensitive for MRD detection |
| Digital Droplet PCR (ddPCR) [81] | PCR-based | Known single-nucleotide variants | - | Ultra-sensitive for tracking specific mutations |
Analytical Methods for ctDNA Detection
Two primary methodological approaches are used in ctDNA analysis:
- Tumor-Informed Approach (e.g., Signatera): Requires prior sequencing of tumor tissue to identify patient-specific somatic mutations (SNVs, indels). A custom assay is then designed to track these mutations in plasma cfDNA. This approach offers high sensitivity and specificity for monitoring Molecular Residual Disease (MRD) and recurrence [81].
- Tumor-Agnostic Approach (e.g., Guardant360, FoundationOne Liquid CDx): Uses a fixed panel of known cancer-related mutations to interrogate cfDNA without prior knowledge of the patient's tumor genotype. This allows for broad genomic profiling and is ideal for therapy selection but may be less sensitive for MRD detection compared to tumor-informed assays [77] [81].
Experimental Protocol: ctDNA Analysis via NGS
This protocol describes a standard workflow for NGS-based ctDNA analysis [77] [81] [82].
- Blood Collection and Plasma Separation: Collect peripheral blood in cfDNA-stabilizing tubes. Centrifuge to separate plasma from cellular components to prevent genomic DNA contamination.
- Nucleic Acid Extraction: Extract total cfDNA from plasma using commercial kits. Quantify and qualify the cfDNA (e.g., using a Bioanalyzer).
- Library Preparation: Prepare sequencing libraries from the cfDNA. For comprehensive profiling, PCR-free library prep (e.g., Illumina DNA PCR-Free Prep) is recommended to avoid biases.
- Target Enrichment & Sequencing: For panel-based tests (e.g., Guardant360), hybridize the libraries with biotinylated probes targeting the gene panel. For whole-genome approaches, this step may be omitted. Sequencing is performed on high-throughput platforms (e.g., Illumina NovaSeq).
- Bioinformatic Analysis: Process raw sequencing data through a secondary analysis pipeline (e.g., Illumina DRAGEN). This includes:
- Alignment to a reference genome (e.g., GRCh37).
- Variant calling for SNVs, indels, CNVs, and fusions.
- Filtering to distinguish somatic tumor variants from germline polymorphisms and clonal hematopoiesis.
- Variant Interpretation and Reporting: Annotate and interpret called variants using tertiary analysis software (e.g., Emedgene) to determine clinical actionability and generate a report.
Diagram 2: ctDNA analysis workflow with tumor-informed and agnostic paths.
The isolation and analysis of rare CTCs and ctDNA fragments represent a paradigm shift in cancer management, moving from static, invasive tissue biopsies to dynamic, minimally invasive liquid biopsies. While challenges in standardization, analytical sensitivity, and interpretation of heterogeneity remain, the continuous refinement of platforms like the Parsortix system, Guardant360, and Signatera, coupled with advanced molecular techniques like scRNA-seq and AI-driven bioinformatics, is rapidly overcoming these hurdles [77] [79] [82]. The integration of these sensitive and specific liquid biopsy strategies into clinical trials and routine practice is paramount for advancing personalized oncology, enabling earlier intervention, and improving patient outcomes.
Evidence-Based Comparison and the Paradigm of Combined Profiling
The paradigm for molecular profiling in oncology is shifting, moving from a reliance on traditional tissue biopsies to the incorporation of liquid biopsies. Tissue biopsy, long considered the gold standard for cancer diagnosis and molecular characterization, provides a direct snapshot of the tumor's architecture and genetics. However, it is an invasive procedure that captures a limited spatial and temporal profile of a frequently heterogeneous and evolving disease [9] [1]. Liquid biopsy, the analysis of tumor-derived components from bodily fluids such as blood, presents a minimally invasive alternative that offers a more comprehensive view of the tumor burden in real-time [9]. This in-depth technical guide provides a comparative analysis of these two modalities, focusing on the critical performance metrics of turnaround time, invasiveness, and success rate, framed within the context of advancing precision oncology and drug development.
Quantitative Comparison of Key Performance Metrics
A direct comparison of data from clinical studies highlights the operational and clinical distinctions between liquid and tissue biopsy. The table below summarizes key quantitative metrics, with a particular focus on non-small cell lung cancer (NSCLC) where comprehensive data is available.
Table 1: Comparative Performance Metrics: Liquid Biopsy vs. Tissue Biopsy
| Metric | Liquid Biopsy | Tissue Biopsy | Supporting Evidence and Context |
|---|---|---|---|
| Turnaround Time (TAT) | ~9-10 days [46] | ~36-42 days [83] [46] | A retrospective study of 170 NSCLC patients found liquid NGS TAT was 26.8 days faster than tissue NGS (9.6 vs. 36.4 days, P < .0001) [46]. |
| Invasiveness | Minimally invasive (blood draw) [1] | Invasive surgical procedure [4] | Tissue biopsies require an invasive surgical procedure, posing risks of complications, pain, and slow recovery, unlike a simple blood draw [1] [4]. |
| Analytical Success Rate | 100% [46] [84] | 89.2% [46] [84] | In a 170-patient NSCLC cohort, liquid biopsy samples had a 100% success rate for NGS, compared to 89.2% for tissue, often due to insufficient sample quantity or quality [46] [84]. |
| Guideline-Recommended Biomarker Detection Rate (First-Line) | 76.5% [46] | 54.9% [46] | In the same study, a "liquid-first" testing approach identified actionable biomarkers in a significantly higher percentage of patients compared to a "tissue-first" approach [46]. |
| Concordance with Tissue | 94.8% - 100% [46] | Gold Standard | For guideline-recommended biomarkers in NSCLC, liquid biopsy demonstrates high concordance with tissue biopsy results, validating its clinical utility [46]. |
Experimental Protocols and Workflows
The divergent TAT and success rates between biopsy modalities are rooted in their distinct laboratory workflows. The following protocols detail the standard operating procedures for each.
Protocol for Tissue Biopsy and Next-Generation Sequencing (NGS)
This protocol outlines the steps from sample acquisition to sequencing result for tissue-based NGS, explaining its inherently longer TAT [46].
- Sample Acquisition: An invasive surgical procedure (e.g., core needle biopsy, bronchoscopy, or surgical resection) is performed to obtain a tumor tissue sample. The specific procedure depends on the tumor's anatomic location and accessibility.
- Pathology Assessment & Macro-dissection: The fresh tissue sample is fixed in formalin and embedded in paraffin (FFPE) to preserve its structure. A pathologist examines the FFPE block, identifies regions with high tumor cell content, and manually dissects them to enrich for tumor DNA and reduce contamination by normal stromal cells.
- Nucleic Acid Extraction: DNA is extracted from the dissected FFPE tissue fragments using commercial kits designed to handle cross-linked and fragmented DNA typical of FFPE samples. DNA quantity and quality are assessed via spectrophotometry or fluorometry.
- NGS Library Preparation: Sequencing libraries are constructed from the extracted DNA. This involves steps such as shearing (if necessary), end-repair, adapter ligation, and amplification. For targeted sequencing, hybrid capture-based methods are commonly used to enrich for a predefined panel of cancer-related genes.
- Next-Generation Sequencing: The prepared libraries are loaded onto a sequencer (e.g., Illumina NovaSeq) for high-throughput, massively parallel sequencing.
- Bioinformatic Analysis & Reporting: Raw sequencing data is processed through a bioinformatics pipeline. This includes alignment to a reference genome, variant calling (SNVs, indels, CNAs, fusions), and annotation to determine the clinical significance of identified genomic alterations. A final interpreted report is generated for the clinician.
Figure 1: Tissue Biopsy NGS Workflow
Protocol for Liquid Biopsy and Circulating Tumor DNA (ctDNA) NGS
This protocol describes the process for plasma-based ctDNA NGS, which is less complex and more streamlined, contributing to its faster TAT [9] [46].
- Blood Collection & Plasma Separation: Two Streck Cell-Free DNA BCT blood collection tubes are typically drawn from the patient. Within a few hours, the blood is centrifuged in a multi-step process to separate the plasma component from cellular components (red blood cells, white blood cells, and platelets).
- Cell-Free DNA (cfDNA) Extraction: cfDNA, a mixture of DNA derived from normal and tumor cells, is extracted from the plasma using magnetic bead- or column-based purification kits on automated platforms.
- NGS Library Preparation & Target Enrichment: Libraries are prepared directly from the extracted cfDNA. Given the low abundance of ctDNA, highly efficient library construction methods are critical. Target enrichment is performed via hybrid capture or PCR-based amplification to focus sequencing on clinically relevant genomic regions.
- Next-Generation Sequencing: The cfDNA libraries, which are naturally short-fragmented, are sequenced with high depth (often 10,000x or more) to enable the detection of low-frequency mutations amidst a background of wild-type DNA.
- Bioinformatic Analysis & Variant Calling: Specialized bioinformatics pipelines are employed to distinguish true somatic tumor-derived variants from sequencing errors and background noise caused by clonal hematopoiesis (CHIP). This includes applying unique molecular identifiers (UMIs) to correct for amplification artifacts.
- Clinical Reporting: A report detailing the detected somatic alterations, their variant allele frequency (VAF), and therapeutic implications is generated.
Figure 2: Liquid Biopsy ctDNA NGS Workflow
The Scientist's Toolkit: Key Research Reagent Solutions
The following table catalogs essential reagents and materials used in liquid biopsy research, particularly for ctDNA-based NGS assays.
Table 2: Essential Research Reagents for Liquid Biopsy NGS
| Item | Function | Example Application in Protocol |
|---|---|---|
| cfDNA Blood Collection Tubes | Stabilizes nucleated blood cells to prevent genomic DNA contamination and preserves cfDNA for up to several days at room temperature. | Blood drawn into Streck Cell-Free DNA BCT tubes during the Blood Collection step [85]. |
| Nucleic Acid Extraction Kits | Magnetic bead- or column-based kits designed to purify short-fragment cfDNA from large-volume plasma samples with high efficiency and recovery. | Used in the cfDNA Extraction step to isolate circulating tumor DNA (ctDNA) from plasma [9]. |
| NGS Library Preparation Kits | Reagents for end-repair, adapter ligation, and amplification of low-input, fragmented cfDNA. Often include Unique Molecular Indices (UMIs). | Critical for NGS Library Preparation to construct sequencing libraries from minute amounts of ctDNA [46]. |
| Hybrid Capture Probes | Biotinylated oligonucleotide probes designed to enrich a panel of target cancer genes from the whole-genome NGS library. | Used during Target Enrichment to selectively pull down genomic regions of interest prior to sequencing [53]. |
| NGS Sequencing Kits | Reagents (e.g., enzymes, buffers, nucleotides) containing fluorescently labelled or novel nucleotides for the sequencer's detection system. | Used in the Next-Generation Sequencing step on platforms like Illumina to generate the raw sequencing data [85]. |
Clinical Integration and Decision Pathways
The strengths and limitations of each biopsy modality have led to the development of integrated clinical pathways. Evidence from the phase II ROME trial demonstrated that patients with concordant actionable alterations identified in both tissue and liquid biopsies experienced significantly improved overall survival (11.05 vs. 7.7 months) and progression-free survival (4.93 vs. 2.8 months) when receiving tailored therapy versus standard of care [4]. This underscores the complementary value of both tests. The following diagram outlines a modern, integrated diagnostic workflow for metastatic NSCLC.
Figure 3: Integrated Diagnostic Pathway for Metastatic NSCLC
The comparative analysis of turnaround time, invasiveness, and success rates firmly establishes liquid biopsy as a transformative tool in modern oncology. Its minimally invasive nature, coupled with a dramatically faster TAT and high analytical success rate, addresses critical limitations of tissue biopsy [46]. However, tissue biopsy remains indispensable for initial diagnosis, histological subtyping, and providing architectural context. The future of precision oncology lies not in choosing one over the other, but in strategically integrating both modalities. As evidenced by clinical trials, this combined approach maximizes the detection of actionable alterations and optimizes patient selection for tailored therapies, ultimately leading to improved survival outcomes [4]. For researchers and drug developers, these findings highlight the necessity of incorporating both liquid and tissue biomarker strategies into clinical trial designs to accurately assess drug efficacy, monitor resistance mechanisms, and advance the field of cancer therapeutics.
Concordance studies are fundamental to assessing the reliability and reproducibility of biomarker tests, ensuring their validity for clinical decision-making and drug development. Within the rapidly evolving field of liquid biopsy, analyzing agreement between novel circulating biomarkers and traditional tissue-based standards is a critical methodological challenge. This whitepaper provides an in-depth technical guide for designing and interpreting concordance studies for guideline-recommended biomarkers. It details statistical methodologies, experimental protocols for cross-platform validation, and specialized bioinformatics tools required to establish robust agreement metrics. Framed within the broader context of liquid biopsy versus tissue biopsy research, this review consolidates current best practices to help researchers navigate the unique complexities of validating minimally invasive biomarkers for cancer and other diseases.
The clinical validation of any biomarker hinges on demonstrating that its measurement is both consistent and accurate. Agreement analysis provides the statistical framework to quantify this reliability, distinguishing itself from mere correlation by assessing whether different tests or observers can interchangeably produce the same result [86]. In the specific context of comparing liquid biopsy to the reference standard of tissue biopsy, concordance studies are not merely an academic exercise; they are a prerequisite for clinical adoption. The methodological quality of these studies directly impacts whether novel fluid-based biomarkers can be trusted for critical tasks like early cancer detection, prognosis, and monitoring treatment response [86] [87].
A recent systematic review in intrapartum fetal heart rate monitoring highlighted common pitfalls in agreement studies, including widespread confusion between the concepts of reliability and agreement, a lack of clarity in calculations involving multiple raters, and a failure to report confidence intervals [86]. These issues are equally prevalent in biomarker research and undermine the translation of promising candidates from the lab to the clinic. This guide addresses these gaps by outlining a rigorous framework for conducting concordance studies, with a special emphasis on the challenges and opportunities presented by liquid biopsy biomarkers.
Statistical Foundations of Concordance
Choosing the correct statistical index is paramount, as an inappropriate measure can lead to misleading conclusions about a biomarker's performance. The choice depends on the type of data (continuous, ordinal, or binary) and whether an absolute difference between measurements is clinically meaningful.
Key Statistical Measures
For continuous biomarkers (e.g., concentration levels), multiple indices are used:
- Concordance Correlation Coefficient (CCC): A scaled index that measures both precision (how far observations deviate from the best-fit line) and accuracy (how far that line is from the 45-degree line of perfect concordance) [88]. It is ideal when the difference between measurements is not intrinsically interpretable.
- Bland-Altman Limits of Agreement (LoA): An absolute index that plots the difference between two measurements against their average. The LoA (mean difference ± 1.96 standard deviations of the difference) shows the range within which 95% of the differences between the two methods are expected to fall [88]. This method is powerful when a clinically acceptable difference can be defined.
- Intraclass Correlation Coefficient (ICC): Commonly used to assess reliability among multiple raters or measurements.
For categorical or binary biomarkers (e.g., mutation present/absent), different measures are applied:
- Proportion of Agreement: The simplest metric, calculating the percentage of cases where two tests agree.
- Kappa Coefficient: A more robust measure that corrects for the agreement expected by chance alone. It is particularly useful for ordinal classifications like disease severity grading [86].
Table 1: Summary of Key Agreement Indices
| Index | Data Type | Interpretation | Key Consideration |
|---|---|---|---|
| Concordance Correlation Coefficient (CCC) | Continuous | Scaled index (0 to 1); 1 indicates perfect agreement. | Used when a clinically acceptable difference is unknown [88]. |
| Bland-Altman Limits of Agreement (LoA) | Continuous | Absolute range of differences (mean ± 1.96 SD). | Requires a pre-specified, clinically acceptable difference for interpretation [88]. |
| Kappa Coefficient | Categorical/Binary | Chance-corrected agreement (<0: poor, 0-0.2: slight, 0.21-0.4: fair, 0.41-0.6: moderate, 0.61-0.8: substantial, 0.81-1: almost perfect). | Preferred for binary outcomes (e.g., positive/negative) [86]. |
Graphical Evaluation of Agreement
Visual tools are essential for complementing summary statistics. The Bland-Altman plot is the standard for continuous data, allowing researchers to identify trends, outliers, or heteroscedasticity (where the variation changes with the magnitude of the measurement) [88]. For settings where the CCC is the primary index, a CCC-based reference band has been proposed as a more consistent graphical tool. This band allows for the identification of outliers in a way that is directly tied to the scaled concordance value, providing a unified visual and quantitative assessment [88].
Guideline-Recommended Biomarkers: A Landscape Analysis
Clinical practice guidelines (CPGs) and consensus statements (CS) synthesize evidence to provide recommendations on biomarker use. Understanding this landscape is the first step in designing a concordance study that addresses real-world clinical questions.
Appraising Current Recommendations
A recent scoping review of guidelines for sepsis management in adults offers a revealing case study. The review found 10 guidance documents containing 31 biomarker recommendations, with a focus on prognosis [89]. The methodological quality was often poor, with only half of the documents demonstrating robust development. This highlights the need for high-quality evidence from rigorous agreement studies to inform future guidelines. The most frequently recommended biomarkers were lactate (74.2% of recommendations) and procalcitonin (25.8%) [89].
Table 2: Biomarker Recommendations in Sepsis Guidelines (2016-2025)
| Biomarker | Frequency of Recommendation | Primary Use Case (Diagnosis/Prognosis) | Strength of Recommendation (Strong/Conditional) |
|---|---|---|---|
| Lactate | 23/31 (74.2%) | Prognosis | Mix of Strong and Conditional [89] |
| Procalcitonin (PCT) | 8/31 (25.8%) | Prognosis | Mix of Strong and Conditional [89] |
| C-reactive Protein (CRP) | Information Not Specified | Information Not Specified | Information Not Specified |
The Challenge of Multiparametric Assessment
Many clinical conditions require a multiparametric approach, combining several biomarker readings into a single severity grade. This can be a significant source of inter-observer variability. A study on aortic regurgitation (AR) grading exemplifies this issue. When 17 expert readers assessed the same 20 cases using multiple echocardiographic parameters, the overall agreement was only moderate (kappa = 0.5) due to the absence of a standardized, hierarchical method for combining discordant parameters [90]. The development and implementation of a consensus document that prioritized left ventricular volume resolved this, significantly improving both inter-observer concordance (kappa = 0.7) and accuracy against a magnetic resonance imaging standard [90]. This underscores the importance of standardized interpretation rules, not just the analytical performance of the biomarker test itself.
Liquid Biopsy vs. Tissue Biopsy: The Concordance Paradigm
The emergence of liquid biopsy (LB) represents a paradigm shift in oncology and other fields, offering a minimally invasive source of tumor-derived biomarkers such as circulating tumor DNA (ctDNA), circulating tumor cells (CTCs), and extracellular vesicles (EVs) [9] [1]. A core component of validating these fluid-based markers is establishing their concordance with the diagnostic gold standard: tissue biopsy.
Advantages and Technical Challenges
Liquid biopsy offers distinct advantages over tissue biopsy, including minimal invasiveness, ability for serial sampling to monitor disease evolution, and the potential to capture tumor heterogeneity [9] [1]. However, this comparison introduces specific methodological challenges for concordance studies. The inherently low abundance of tumor-derived components in bodily fluids is a primary obstacle. For instance, ctDNA can constitute as little as 0.1% of the total cell-free DNA in a patient's plasma, and CTCs are exceptionally rare, with approximately one cell found per million leukocytes [1]. This low concentration demands highly sensitive detection technologies, and the resulting limit of detection becomes a critical variable in concordance analysis, directly impacting metrics like sensitivity.
Furthermore, the temporal and spatial discordance between liquid and tissue biopsies can confound agreement metrics. A tissue biopsy captures a snapshot of a single lesion at a single point in time, while a liquid biopsy may reflect the real-time genomic landscape of multiple metastatic sites. A "discordant" result may therefore represent genuine biological heterogeneity rather than a failure of the liquid biopsy assay [1].
Performance in Specific Cancers
Empirical evidence demonstrates the variable concordance of liquid biopsy across cancer types. A meta-analysis of 11 studies on cervical cancer reported a pooled sensitivity of 68% and specificity of 84% for liquid biopsy biomarkers, with a high diagnostic odds ratio of 61.10 [91]. The performance varied by biomarker type and biofluid source, with plasma-based assays and miRNA biomarkers showing superior diagnostic performance [91]. In non-small cell lung cancer (NSCLC), guidelines have acknowledged the utility of ctDNA for detecting EGFR mutations when tissue is unavailable, formalizing its clinical concordance with tissue-based genotyping [1].
Experimental Protocols for Cross-Technology Validation
A major bottleneck in biomarker development is the cross-technology translation gap, where results from discovery platforms (e.g., mass spectrometry) fail to replicate in validated clinical immunoassays [87]. A structured experimental protocol is essential to bridge this gap.
Protocol: Establishing Concordance between MS-Discovered Biomarkers and Immunoassays
This protocol outlines the steps to validate a biomarker candidate identified via mass spectrometry (MS) using a clinically applicable sandwich ELISA.
1. Biomarker Suitability Survey:
- Objective: To prioritize biomarker candidates from a discovery list for immunoassay development.
- Methods: Use bioinformatics resources to survey:
- Biological Context: Is the protein expected in the biofluid (e.g., blood) based on databases of tissue expression and secretion?
- Structural Features: Analyze protein sequence for domains, motifs, and potential post-translational modifications that might affect antibody binding.
- Proteoform Complexity: Identify known splice variants and isoforms. A candidate with a single dominant isoform is preferable.
- Output: A ranked shortlist of candidates with a high likelihood of successful immunoassay development [87].
2. Epitope and Antibody Selection:
- Objective: To choose immunogenic peptides for antibody generation and select high-performing commercial antibodies.
- Methods:
- Epitope Prediction: Use in-silico tools to predict linear or conformational epitopes. Favor regions with high antigenicity and surface accessibility.
- Antibody Reagent Databases: Query databases to find commercially available antibodies. Prioritize those validated for the specific biofluid (e.g., plasma) in your study [87].
- Output: Selected immunogenic peptide sequences and/or a pair of capture/detection antibodies for sandwich ELISA.
3. Assay Optimization and Concordance Testing:
- Objective: To develop the ELISA and formally test its concordance with MS-derived measurements.
- Methods:
- Sample Cohort: Use a set of paired samples where each sample has been analyzed by both the discovery MS platform and the new ELISA.
- Statistical Analysis: Calculate agreement indices (CCC, kappa) between the quantitative (or qualitative) results from the two platforms. A Bland-Altman plot can visualize the bias and LoA between the MS and ELISA measurements [87] [88].
The Scientist's Toolkit: Key Research Reagent Solutions
The following table details essential materials and tools for conducting robust concordance studies, particularly in the context of liquid biopsy.
Table 3: Essential Research Reagents and Tools for Biomarker Concordance Studies
| Item/Tool | Function & Application in Concordance Studies |
|---|---|
| CellSearch System | The only FDA-cleared system for enumerating Circulating Tumor Cells (CTCs); provides a standardized method for comparing CTC counts as a biomarker across studies [1]. |
| EpCAM Antibodies | Antibodies against the Epithelial Cell Adhesion Molecule (EpCAM) are widely used for the immunomagnetic capture and enrichment of CTCs from blood samples [1]. |
| Bioinformatics Databases (e.g., Marker DB) | Provide access to a broad range of validated and exploratory biomarkers, supporting the selection of candidate biomarkers and the interpretation of their biological context [89] [87]. |
| Epitope Prediction Software | In-silico tools that aid in selecting immunogenic peptide sequences for custom antibody production, helping to avoid regions with post-translational modifications or poor antigenicity [87]. |
| Reference Band Plot | A graphical tool derived from the Concordance Correlation Coefficient (CCC), providing a visual assessment of agreement that is consistent with this scaled index, especially when an acceptable difference is not known [88]. |
Advanced Topics: AI and Bioinformatics in Agreement Studies
The increasing complexity of biomarker data, including high-dimensional omics and data from digital pathology, necessitates advanced computational approaches.
Artificial intelligence (AI) models are now being developed to integrate multiple, routinely available laboratory features into powerful diagnostic tools. For example, the Sjögren Multi-criterion Feature Integration Framework (SMFIF) was built using 16 optimal features selected through ensemble learning and SHAP analysis. This model achieved an Area Under the Curve (AUC) of 0.964 in an external validation set for diagnosing Sjögren's disease, significantly outperforming single, conventional biomarkers like anti-SSA/Ro (AUC: 0.705) [92]. This demonstrates how AI can leverage the concordant and complementary patterns across multiple weak biomarkers to create a strong, integrated classifier.
Furthermore, bioinformatics workflows are critical for the development of novel immunoassays. These tools can support researchers by aiding in the selection of suitable biomarker candidates, guiding the choice of commercial affinity reagents, and predicting antibody binding regions (epitopes) to inform immunogenic peptide design. Incorporating these tools early in the development process can de-risk the transition from exploratory mass spectrometry to targeted, antibody-based clinical assays [87].
The integration of precision oncology into standard clinical practice has been hampered by a lack of randomized evidence demonstrating its superiority over traditional methods. The phase II ROME trial addressed this critical gap, demonstrating that a tumor-agnostic, genomically matched therapy significantly improves outcomes for patients with advanced solid tumors. A pivotal finding was that the superior benefit of tailored therapy was most pronounced when guided by the concordant detection of actionable genomic alterations in both tissue and liquid biopsies. This whitepaper delves into the ROME trial's methodology and results, situates its findings within the broader context of biopsy research, and provides technical resources to guide future research and clinical protocol development in precision oncology.
Precision oncology aims to improve clinical outcomes by tailoring cancer treatment to individual patients based on the specific molecular characteristics of their tumors [93]. Despite the compelling rationale and the increasing number of tumor-agnostic biomarker approvals, definitive randomized evidence supporting the clinical superiority of these approaches over standard therapies has remained limited [93]. A significant challenge in the field is the selection of the optimal biomarker profiling method. Tissue biopsy, the traditional gold standard, is invasive, may not fully capture tumor heterogeneity, and is difficult to repeat for monitoring [9] [1]. Liquid biopsy, a minimally invasive alternative that analyzes circulating tumor DNA (ctDNA) and other biomarkers in the blood, offers a systemic view of the disease and allows for serial sampling but may have lower sensitivity, particularly in low-shed tumors [9] [4] [1]. The ROME trial was designed not only to test the efficacy of genomically matched therapy but also to investigate the critical question of how tissue and liquid biopsies can be best leveraged to guide these tailored treatments.
The ROME Trial: Experimental Design and Protocol
The ROME trial was a multicenter, randomized, open-label phase II study conducted across 40 oncological centers in Italy [93].
Patient Recruitment and Eligibility
- Patient Cohort: 1,794 adults with advanced solid tumors and an ECOG Performance Status of 0 or 1, whose disease had progressed after one or two prior lines of therapy [93] [4].
- Primary Objective: To compare the efficacy of Molecular Tumor Board (MTB)-recommended tailored therapy (TT) versus standard-of-care (SoC) therapy [93].
- Primary Endpoint: Overall Response Rate (ORR). Key secondary endpoints included Progression-Free Survival (PFS), Overall Survival (OS), and safety [93].
Core Experimental Methodology
The workflow from patient screening to treatment assignment involved a standardized protocol for genomic profiling and data interpretation.
Centralized Genomic Profiling:
- Tissue Biopsy: Analyzed using FoundationOne CDx comprehensive genomic profiling assay [4] [67].
- Liquid Biopsy: Analyzed using FoundationOne Liquid CDx assay on blood samples [4] [67].
- Both assays are based on Next-Generation Sequencing (NGS) and were processed centrally to ensure consistency [93] [67].
Molecular Tumor Board (MTB) Review:
- The sequencing results from both biopsy types for each of the 897 patients with potentially actionable alterations were reviewed by a centralized, multidisciplinary MTB during 127 weekly meetings [93].
- The MTB assessed the actionability of genomic alterations using established frameworks like the ESMO Scale for Clinical Actionability of molecular Targets (ESCAT) and provided a treatment recommendation for each patient [93].
- Based on MTB recommendations, 400 patients were randomized 1:1 to receive either TT or SoC. A total of 497 patients were excluded from randomization based on predefined MTB directives [93].
Figure 1: ROME Trial Patient Workflow and Molecular Profiling Pathway. This diagram outlines the key stages from patient screening to treatment assignment.
Key Findings and Clinical Outcomes
The ROME trial successfully met its primary endpoint, demonstrating the significant benefit of a precision oncology approach.
In the intention-to-treat population of 400 randomized patients, tailored therapy showed a statistically significant improvement over standard of care.
Table 1: Primary Efficacy Endpoints in the ROME Trial ITT Population
| Endpoint | Tailored Therapy (TT) | Standard of Care (SoC) | P-value |
|---|---|---|---|
| Overall Response Rate (ORR) | 17.5% | 10.0% | 0.0294 |
| Median Progression-Free Survival (PFS) | 3.5 months | 2.8 months | 0.0002 |
| Hazard Ratio (HR) for PFS | 0.66 (95% CI: 0.53-0.82) | - | - |
| 12-Month PFS Rate | 22.0% | 8.3% | - |
| Grade 3/4 Adverse Events | 40% | 52% | - |
The overall survival was similar between the arms, which was likely influenced by a 52% crossover rate from the SoC arm to the TT arm upon disease progression [93].
The Critical Role of Biopsy Concordance
An exploratory analysis of the ROME data yielded a critical insight: the success of tailored therapy was heavily dependent on the concordance of biomarker detection between tissue and liquid biopsies [4] [67] [94].
- Concordance Rate: The same actionable genomic alteration was identified in both tissue and liquid biopsies in only 49.2% (197/400) of patients (T+L group) [4] [67].
- Discordance Rates: Actionable alterations were found exclusively in tissue biopsies in 34.7% (139/400) of patients and exclusively in liquid biopsies in 16% (64/400) of patients [4] [67].
- Causes of Discordance: Among discordant cases, 43.3% were due to differences in detecting molecular alterations, 35% to discordant high tumor mutational burden (TMB) detection, 1% to microsatellite instability (MSI) discrepancies, and 21% to test failures [67]. The PI3K/PTEN/AKT/mTOR and ERBB2 pathways exhibited the highest discordance rates [4] [67].
The clinical outcomes for patients receiving TT varied dramatically based on biopsy concordance status.
Table 2: Survival Outcomes Based on Biopsy Concordance in Patients Receiving Tailored Therapy
| Biopsy Group | Median Overall Survival (OS) | Median Progression-Free Survival (PFS) |
|---|---|---|
| Tissue + Liquid (T+L) Concordant | 11.05 months | 4.93 months |
| Tissue-Only | 9.93 months | 3.06 months |
| Liquid-Only | 4.05 months | 2.07 months |
| Standard of Care (Overall) | 7.70 months | 2.80 months |
Patients in the T+L concordant group who received TT experienced a 45% reduction in the risk of progression or death (HR for PFS = 0.55) and a 26% reduction in the risk of death (HR for OS = 0.74) compared to SoC [4] [67]. This survival benefit was markedly less pronounced or absent in groups with discordant biopsy results [67].
Figure 2: Impact of Biopsy Concordance on Tailored Therapy Outcomes. Clinical benefit was strongest with concordant results.
The Scientist's Toolkit: Research Reagents and Essential Materials
The ROME trial and contemporary studies rely on a suite of sophisticated reagents and platforms for genomic analysis.
Table 3: Key Research Reagent Solutions for Combined Biopsy Profiling
| Reagent / Platform | Function / Application | Specific Example / Kit |
|---|---|---|
| Comprehensive Genomic Profiling (CGP) Assays | NGS-based in vitro diagnostics for identifying actionable genomic alterations from tissue (CGP) and liquid (liquid CGP) samples. | FoundationOne CDx (tissue), FoundationOne Liquid CDx (plasma) [93] [67]. |
| Circulating Cell-Free DNA (cfDNA) Collection Tubes | Stabilize nucleated blood cells and prevent genomic DNA contamination during blood sample shipping and storage. | PAXgene Blood ccfDNA Tubes [45]. |
| cfDNA Extraction Kits | Isolate and purify cell-free DNA from plasma samples for downstream NGS library preparation. | QIAamp Circulating Nucleic Acid Kit [45]. |
| Digital PCR (dPCR) Systems | Absolute quantification of specific DNA sequences; used for validating mutations or detecting low-frequency variants with high sensitivity. | Chip-based dPCR (e.g., ProFlex 2X Flat PCR System) [45]. |
| Targeted Amplification Detection Kits | Detect and quantify specific gene amplifications (e.g., HER2) from liquid biopsy samples using dPCR. | HER2 Amplification Detection Kit [45]. |
Signaling Pathways with High Clinical Discordance
As identified in the ROME trial, the following pathways are prone to discordant detection between tissue and liquid biopsies, highlighting the need for complementary profiling.
Figure 3: Key Signaling Pathways with High Biopsy Discordance. The PI3K/PTEN/AKT/mTOR and ERBB2 pathways were most frequently discordant in the ROME trial.
Discussion and Future Directions
The ROME trial provides level II evidence that a tumor-agnostic precision oncology strategy significantly improves ORR and PFS. Its most transformative insight is that combining tissue and liquid biopsy modalities creates a synergistic effect, optimizing patient selection for tailored therapy and leading to the best possible outcomes.
The observed 49% concordance rate between biopsies is not a failure of either method but a reflection of biological reality. Concordance likely indicates a ubiquitously expressed truncal alteration, portending a better response to matched therapy [67]. Discordance arises from tumor heterogeneity, differential shedding of ctDNA, technical limitations of the assays, and clonal evolution [4] [45] [1]. The finding that liquid biopsy alone added over 60% more patients with actionable alterations beyond tissue testing alone underscores its value in expanding the reach of precision medicine [94].
Future research and clinical protocols should:
- Mandate Dual Biopsy Profiling: Especially in the metastatic setting, combined profiling at baseline should be standard to capture the complete genomic landscape and identify the most reliable targets.
- Leverage Serial Liquid Biopsies: The ease of repetition makes liquid biopsy an ideal tool for monitoring treatment response, detecting emergent resistance mechanisms, and guiding subsequent therapy lines [9] [1].
- Validate Multi-Omic Platforms: Emerging technologies integrating lipidomics, proteomics, and machine learning, as seen in early detection tests for ovarian cancer, show promise for increasing diagnostic accuracy and will likely play a future role in therapy selection [95] [76].
- Address Discordance Systematically: Standardized protocols are needed for cases where biopsies yield conflicting results, potentially involving repeat biopsies, imaging to guide site selection, or profiling of additional metastases.
The ROME trial marks a paradigm shift, providing robust evidence that a histology-agnostic approach guided by genomic profiling improves outcomes in advanced solid tumors. It definitively shows that the question is not whether to use tissue or liquid biopsy, but how to intelligently integrate both. The combined approach mitigates the individual limitations of each method, enhances the detection of actionable targets, and most importantly, identifies a patient population that derives profound survival benefit from tailored therapy. For researchers and drug developers, these findings argue for the incorporation of combined biopsy strategies into the design of future clinical trials to ensure the most accurate assessment of a therapy's true potential.
Within the broader research on liquid versus tissue biopsy, the impact of these diagnostic modalities on patient survival endpoints—Overall Survival (OS) and Progression-Free Survival (PFS)—is a critical area of clinical investigation. The transition towards precision oncology necessitates reliable biomarker identification to guide targeted therapies. While tissue biopsy has long been the gold standard, its invasive nature and inability to fully capture tumor heterogeneity can limit its utility [1] [9]. Liquid biopsy, a minimally invasive alternative, analyzes circulating tumor DNA (ctDNA) and circulating tumor cells (CTCs) from blood, offering a dynamic view of the tumor genome [1] [96]. This whitepaper synthesizes current clinical data and methodologies, providing researchers and drug development professionals with a technical analysis of how these biopsy strategies influence key survival metrics.
Survival Data from Key Clinical Studies
Recent clinical trials provide direct evidence of how biopsy-guided therapy impacts patient survival. The data underscores the contexts in which liquid or tissue biopsy alone, or a combination of both, yields the best outcomes.
Table 1: Overall Survival (OS) and Progression-Free Survival (PFS) from the ROME Trial (Phase II) [4] [67] [97]
| Biopsy Group & Therapy | Median OS (Months) | Hazard Ratio (HR) for Death | Median PFS (Months) | Hazard Ratio (HR) for Progression |
|---|---|---|---|---|
| T+L Concordant / Tailored Therapy | 11.05 | 0.74 | 4.93 | 0.55 |
| T+L Concordant / Standard of Care | 7.70 | [Reference] | 2.80 | [Reference] |
| Tissue-Only / Tailored Therapy | 9.93 | Not Reported | 3.06 | Not Reported |
| Liquid-Only / Tailored Therapy | 4.05 | Not Reported | 2.07 | Not Reported |
The ROME trial demonstrated that patients with concordant T+L results receiving tailored therapy had a 26% reduction in the risk of death and a 45% reduction in the risk of progression compared to standard of care [4] [67]. This highlights that the concordance of molecular findings between two independent biopsy methods may serve as a stronger predictor for therapy success.
Table 2: Comparative Outcomes in Metastatic Non-Small Cell Lung Cancer (NSCLC) [98]
| Biopsy & Treatment Approach | Testing Success & Biomarker Detection Rate | Median Turnaround Time (TAT) | Survival Outcomes |
|---|---|---|---|
| Liquid-First Approach | Higher testing success; identified biomarkers in 76.5% of patients | 26.8 days faster than tissue | No significant difference in OS or PFS compared to tissue |
| Tissue-First Approach | Identified biomarkers in 54.9% of patients | [Reference] | No significant difference in OS or PFS compared to liquid |
A retrospective study of 170 NSCLC patients showed that a liquid-first approach was logistically favorable due to faster TAT and higher testing success, without compromising survival outcomes [98]. This supports the use of liquid biopsy as an effective initial test for guiding therapy.
Detailed Experimental Protocols
Understanding the methodologies of cited experiments is crucial for evaluating the survival data and for research replication.
The ROME trial is a multicenter study designed to investigate the clinical utility of combined liquid and tissue biopsy profiling.
- Patient Cohort: Enrolled 1,794 adult patients with advanced or metastatic solid tumors who had exhausted at least one line of therapy.
- Sample Collection: All patients provided paired samples: a tissue biopsy (from archival or fresh tissue) and a liquid biopsy (blood draw).
- Next-Generation Sequencing (NGS):
- Tissue samples were profiled using the FoundationOne CDx assay.
- Liquid biopsy samples were profiled using the FoundationOne Liquid CDx assay.
- Molecular Tumor Board (MTB): A centralized, multidisciplinary board reviewed all NGS reports. They identified "actionable" genomic alterations for which a targeted therapy was available. Concordance was strictly defined as the detection of the same actionable alteration in both the tissue and liquid biopsy.
- Randomization: The 400 patients with actionable alterations were randomized. The experimental arm received tailored therapy (matched targeted therapy) based on the MTB recommendation, while the control arm received standard-of-care therapy chosen by their clinician.
- Endpoint Tracking: The primary endpoints were Overall Survival (OS) and Progression-Free Survival (PFS), tracked from randomization.
The LIQUIK study prospectively evaluated the performance of a combined ctDNA and circulating tumor RNA (ctRNA) liquid biopsy platform.
- Patient Cohort: Enrolled patients with metastatic nonsquamous NSCLC across the United States and Singapore.
- Sample Collection & Testing: Patients underwent concurrent testing with three assays:
- Tissue NGS (the reference standard).
- LiquidHALLMARK (LHM) - a combined ctDNA and ctRNA liquid biopsy.
- Guardant360 CDx (G360) - a ctDNA-only liquid biopsy.
- Primary Objective: To establish the non-inferiority of LHM ctDNA compared to tissue NGS and G360 ctDNA in detecting guideline-recommended biomarkers.
- Secondary & Exploratory Analyses: Included Turnaround Time (TAT), Objective Response Rate (ORR), PFS, and the added value of ctRNA in detecting gene rearrangements.
Workflow Diagram: Combined Biopsy Profiling
The following diagram illustrates the integrated diagnostic pathway used in modern trials like ROME to generate survival data.
The Scientist's Toolkit: Key Research Reagents & Platforms
The translation of biopsy research into clinical survival data relies on specific, validated reagents and platforms.
Table 3: Essential Research Reagents and Platforms for Biopsy-Driven Survival Studies
| Item Name | Type/Assay | Primary Function in Research Context |
|---|---|---|
| FoundationOne CDx [4] [67] | Tissue-based NGS Assay | Comprehensive genomic profiling of tumor tissue to identify actionable mutations, TMB, and MSI; serves as a reference standard in clinical trials. |
| FoundationOne Liquid CDx [4] [67] | Liquid-based NGS Assay | Analyzes ctDNA from blood to detect genomic alterations, providing a minimally invasive complement to tissue profiling. |
| Guardant360 CDx [99] | Liquid-based NGS Assay | A ctDNA-focused platform used for biomarker detection; often used in comparative performance studies. |
| LiquidHALLMARK (LHM) [99] | Combined ctDNA/ctRNA Assay | Evaluates both ctDNA and ctRNA from a single blood sample, enhancing the detection of gene fusions and transcriptional alterations. |
| CellSearch System [1] | CTC Enrichment Platform | The only FDA-cleared system for enumerating Circulating Tumor Cells (CTCs); used prognostically in breast, colorectal, and prostate cancer. |
| EpCAM Antibodies [1] [96] | Research Reagent | Key capture antibody for immunomagnetic enrichment of epithelial-derived CTCs in platforms like CellSearch. |
| BEAMing Technology [1] [96] | ctDNA Detection Method | A highly sensitive digital PCR-based method to detect and quantify rare mutant DNA molecules in plasma. |
Analysis of Discordance and Technical Challenges
A significant finding across studies is the discordance between tissue and liquid biopsy results, which directly impacts survival outcomes when guiding therapy. In the ROME trial, about 51% of cases were discordant [4] [67]. The primary reasons for discordance and their implications are:
- Biological Factors (43.3%): Discordance often reflects genuine tumor heterogeneity. A mutation detected in tissue but not in liquid biopsy may originate from a tumor subclone that does not shed DNA efficiently into the bloodstream, or from a metastatic site not captured by the liquid biopsy [4] [67]. The PI3K/PTEN/AKT/mTOR and ERBB2 pathways showed particularly high discordance rates.
- Test Failures (21%): Tissue biopsies can fail due to insufficient tumor cell content or DNA quality, while liquid biopsies can fail if the ctDNA fraction is too low [4] [67].
- Detection of Complex Biomarkers: Assays can disagree on the status of Tumor Mutational Burden (TMB) and Microsatellite Instability (MSI), which accounted for 35% and 1% of discordant cases in ROME, respectively [4] [67].
This biological and technical discordance explains the inferior survival outcomes (e.g., median OS of 4.05 months) when therapy was based solely on a target found in liquid but not tissue biopsy [4] [97]. It underscores the necessity of understanding the limitations of each modality.
The body of evidence demonstrates that the impact of biopsy modality on survival is not a matter of simple superiority. Instead, survival is optimized when the strengths of both methods are leveraged. The most significant improvements in OS and PFS are observed when tailored therapy is guided by concordant findings from both tissue and liquid biopsies [4] [67] [97]. This concordance likely indicates a dominant, systemically active tumor clone, making it a more reliable therapeutic target.
Future research will focus on standardizing methodologies, improving the sensitivity of liquid biopsies for early-stage cancer and minimal residual disease (MRD) monitoring, and integrating multi-omic data (e.g., ctRNA, methylation patterns) [99] [100]. For researchers and drug developers, these findings validate a dual-path diagnostic strategy. Designing clinical trials with paired biopsy requirements at baseline could enable better patient stratification and more robust evaluation of a drug's efficacy, ultimately accelerating the development of effective targeted therapies and improving patient survival.
Defining Clinical Contexts for Liquid-First, Tissue-First, and Complementary Approaches
The management of cancer has been transformed by the advent of molecular profiling, which enables tailored treatment strategies based on the unique genetic characteristics of a patient's tumor. Traditionally, this profiling has relied on tissue biopsy, considered the gold standard for tumor diagnosis due to its high level of laboratory standardization and accuracy [1]. However, tissue biopsies are invasive procedures fraught with limitations, including difficulty in serial sampling, inability to capture tumor heterogeneity, and the inherent risks of surgical complications [9] [1].
In response to these challenges, liquid biopsy has emerged as a revolutionary, minimally invasive diagnostic tool. By analyzing tumor-derived components such as circulating tumor DNA (ctDNA), circulating tumor cells (CTCs), and extracellular vesicles (EVs) from bodily fluids like blood, liquid biopsy provides a dynamic snapshot of the tumor's genetic landscape [9] [11]. Its clinical utility is rapidly expanding across cancer care, from early detection and prognostication to monitoring treatment response and identifying mechanisms of drug resistance [1] [101].
The critical question in modern oncology is no longer which biopsy method is superior, but rather which clinical context dictates a liquid-first, tissue-first, or complementary approach. This guide provides a structured framework for researchers, scientists, and drug development professionals to navigate this decision-making process, supported by current evidence, quantitative data, and experimental methodologies.
Key Biomarkers and Technologies in Liquid Biopsy
Liquid biopsy analysis focuses on various tumor-derived components, each with distinct advantages and technological requirements for isolation and characterization.
Circulating Tumor DNA (ctDNA)
Circulating tumor DNA (ctDNA) consists of short fragments of cell-free DNA shed into the bloodstream primarily through apoptosis or necrosis of tumor cells. It typically constitutes only 0.1% to 1.0% of total cell-free DNA (cfDNA) in the bloodstream of cancer patients [1]. ctDNA carries tumor-specific genetic and epigenetic alterations, including point mutations, copy number variations (CNAs), and methylation patterns, providing a "real-time" snapshot of tumor burden and genomic evolution [9] [37]. Its short half-life (approximately 20-50 base pairs) enables dynamic monitoring of disease status, a significant advantage over static tissue biopsies [1].
Circulating Tumor Cells (CTCs)
Circulating tumor cells (CTCs) are rare cells released from primary and metastatic tumors into the peripheral circulation, with an estimated frequency of one CTC per million leukocytes [1]. Despite their low abundance and short half-life (1-2.5 hours), CTCs provide vital information about cancer biology, particularly in the metastatic process. The CellSearch system remains the only FDA-cleared method for enumerating CTCs in blood samples, primarily using epithelial cell adhesion molecule (EpCAM) for enrichment [1]. Functional analyses of CTCs can reveal insights into their metastatic potential, including replication capacity and tissue invasiveness [8].
Emerging and Complementary Analytes
- Tumor-Educated Platelets (TEPs): Platelets that have been altered by interactions with cancer cells, displaying changes in their RNA and protein profiles [9].
- Extracellular Vesicles (EVs): Membrane-bound particles released by tumors that carry proteins, nucleic acids, and lipids. Over 50% of EV isolation methods involve preparative ultracentrifugation [9].
- Cell-Free RNA (cfRNA): Includes various RNA types such as microRNA (miRNA) and other non-coding RNAs that can provide information on gene expression changes in tumors [9] [37].
Table 1: Key Analytical Technologies in Liquid Biopsy
| Technology | Primary Use | Key Performance Metrics | Advantages | Limitations |
|---|---|---|---|---|
| Next-Generation Sequencing (NGS) | Comprehensive genomic profiling (single/multi-gene panels, whole exome/genome) | Sensitivity up to 0.01% Variant Allele Frequency (VAF); Detects SNVs, CNVs, fusions, MSI [8] [7] | Broad, hypothesis-free approach; high multiplexing capability | Higher cost; longer turnaround time; complex data analysis |
| Droplet Digital PCR (ddPCR) | Ultra-sensitive detection of known hot-spot mutations | Sensitivity as low as 0.01% for allele frequency; specificity >99% [8] | Rapid turnaround; cost-effective; absolute quantification | Limited to known targets; low multiplexing capability |
| Targeted Error Correction Sequencing (TEC-Seq) | Ultra-sensitive direct assessment of ctDNA without prior tumor tissue knowledge | Demonstrated 97.4% sensitivity and 100% specificity in studies [37] | Does not require prior knowledge of tumor genetics | Specialized protocol and bioinformatics required |
| BEAMing Technology | Detection of hotspot mutations in genes like TP53, APC, KRAS, PIK3CA [1] | Used for monitoring ctDNA mutation rate changes during treatment [1] | High sensitivity for known mutations | Limited to predefined mutations |
Defining Clinical Decision Pathways
The choice between liquid-first, tissue-first, or complementary testing strategies depends on multiple clinical and biological factors. The following diagram illustrates the key decision pathways for determining the optimal diagnostic approach.
The decision pathway above outlines the fundamental questions that guide clinical testing strategy. The following tables provide detailed clinical contexts and evidence-based recommendations for each approach.
Table 2: Clinical Contexts for Liquid-First vs. Tissue-First Approaches
| Clinical Context | Recommended Approach | Supporting Evidence | Key Considerations |
|---|---|---|---|
| Initial Diagnosis of Suspected Cancer | Tissue-First | Tissue biopsy remains the gold standard for definitive cancer diagnosis and histologic subtyping [1]. | Provides architectural context, immunohistochemistry data, and comprehensive genomic profile from sufficient DNA yield. |
| When Tissue is Inaccessible or Insufficient | Liquid-First | 40% of physicians prefer liquid biopsy when tissue samples are unavailable [8]. ESMO guidelines recommend ctDNA as a complementary/alternative tool when tissue is insufficient [8]. | Plasma-based NGS can identify actionable mutations with >80% concordance with tumor tissue in colorectal, lung, and breast cancers [8]. |
| Urgent Need for Rapid Treatment Initiation | Liquid-First | ddPCR offers advantages in detection speed and cost compared to NGS, making it practical for patients requiring urgent first-line treatment [8]. | Turnaround time for liquid biopsy is typically faster than tissue processing, sequencing, and analysis. |
| Monitoring Treatment Response in Metastatic Disease | Liquid-First | ctDNA analysis allows for serial monitoring of molecular changes through routine blood draws, enabling timely intervention [101]. | Dynamic changes in ctDNA levels often precede radiographic evidence of response or progression. |
| Detecting Minimal Residual Disease (MRD) | Liquid-First | ctDNA status post-surgery is highly predictive of recurrence risk in stage III colon cancer [101] [102]. | More sensitive than imaging for detecting micrometastatic disease; can identify patients for treatment de-escalation or intensification. |
| Identifying Resistance Mechanisms | Liquid-First | The ability of ctDNA assays to detect resistance mutations in real time has significantly improved therapeutic strategies [8]. | Enables detection of emerging resistant clones before clinical progression, allowing for early therapy modification. |
Table 3: Evidence Base for Complementary Testing Approaches
| Complementary Application | Rationale | Representative Clinical Evidence |
|---|---|---|
| Guideline-Recommended Complement | Combining tissue and liquid provides comprehensive molecular profile. | ESMO Clinical Practice Guidelines recommend comprehensive genotyping for metastatic NSCLC, with ctDNA as a complementary or alternative tool to tissue-based NGS for biomarker assessment [8]. |
| Anti-EGFR Rechallenge in mCRC | Liquid biopsy monitors dynamic resistance mutation patterns. | ctDNA analysis guides anti-EGFR rechallenge by monitoring resistance mutations (KRAS, NRAS, BRAF); therapy is reintroduced when resistant mutations become undetectable [101]. |
| Molecular Profiling in NCI-MATCH | Liquid biopsy validates tissue findings and provides alternative when tissue is insufficient. | A comparative study of 2,200 participants found 85.5% concordance between tissue and liquid biopsy for detecting oncogenic mutations, supporting liquid biopsy for patient stratification in precision medicine trials [102]. |
| Comprehensive Genomic Profiling | Tissue provides initial profile, liquid monitors evolution. | Northstar Select liquid biopsy assay demonstrated detection of SNV/Indels down to 0.15% VAF and identified 51% more pathogenic SNV/indels and 109% more CNVs than standard CGP assays [7]. |
Experimental Protocols and Methodologies
Protocol: Comprehensive Genomic Profiling via Liquid Biopsy
Objective: To detect and characterize genomic alterations in ctDNA for clinical decision-making. Sample Collection: Collect 10-20 mL of peripheral blood into cell-free DNA collection tubes (e.g., Streck Cell-Free DNA BCT or PAXgene Blood cDNA Tube) [37]. Invert gently 8-10 times to mix. Process within 4-6 hours of collection for optimal results. Plasma Separation: Centrifuge blood at 800-1600 × g for 10 minutes at 4°C. Transfer supernatant (plasma) to a fresh tube without disturbing the buffy coat. Perform a second centrifugation at 16,000 × g for 10 minutes to remove remaining cells and debris. Cell-Free DNA Extraction: Use commercial cfDNA extraction kits (e.g., QIAamp Circulating Nucleic Acid Kit, MagMAX Cell-Free DNA Isolation Kit) following manufacturer's protocols. Elute in 20-50 μL of elution buffer. Quantify cfDNA using fluorometric methods (e.g., Qubit dsDNA HS Assay). Library Preparation and Sequencing: Use targeted NGS panels covering relevant cancer genes (e.g., 84-gene panel for Northstar Select) [7]. Library preparation typically involves end-repair, A-tailing, adapter ligation, and PCR amplification. Methods like TEC-Seq enable ultra-sensitive direct assessment without prior knowledge of genetic alterations [37]. Bioinformatic Analysis: Align sequences to reference genome (GRCh38). Use specialized algorithms for variant calling (mutations, CNVs, fusions, MSI) with sensitivity down to 0.15% VAF [7]. For MRD detection, tumor-informed assays that track specific mutations identified in tissue have higher sensitivity.
Protocol: CTC Enrichment and Characterization
Objective: To isolate and characterize circulating tumor cells from peripheral blood. Sample Collection: Collect 7.5-10 mL of blood into FDA-cleared CellSave Preservative Tubes for the CellSearch system. CTC Enrichment: For CellSearch, use immunomagnetic enrichment with ferrofluid nanoparticles conjugated to anti-EpCAM antibodies. Alternative methods include size-based filtration (e.g., ISET system) or microfluidic platforms (e.g., CTC-iChip). CTC Staining and Identification: Stain enriched cells with fluorescently labeled antibodies (e.g., anti-cytokeratin for epithelial cells, anti-CD45 to exclude leukocytes, and DAPI for nuclear staining). Identify CTCs as nucleated (DAPI+), epithelial (cytokeratin+), and non-hematopoietic (CD45-) cells. Downstream Applications: Isolated CTCs can be used for morphological analysis, immunophenotyping, RNA/DNA extraction, or single-cell sequencing to investigate heterogeneity and mechanisms of metastasis.
The Scientist's Toolkit: Essential Research Reagents
Table 4: Essential Research Reagents for Liquid Biopsy Applications
| Reagent/Category | Specific Examples | Function/Application |
|---|---|---|
| Blood Collection Tubes for cfDNA | Streck Cell-Free DNA BCT; PAXgene Blood cDNA Tube; CellSave Preservative Tubes (for CTCs) | Preserves blood samples to prevent white blood cell lysis and release of genomic DNA, maintaining the integrity of ctDNA and CTCs for analysis [37]. |
| Nucleic Acid Extraction Kits | QIAamp Circulating Nucleic Acid Kit (Qiagen); MagMAX Cell-Free DNA Isolation Kit (Thermo Fisher) | Isolation of high-quality, inhibitor-free cell-free DNA from plasma samples for downstream molecular analysis [37]. |
| Targeted NGS Panels | Northstar Select (84 genes); FoundationOne Liquid CDx | Comprehensive genomic profiling to detect SNVs, Indels, CNVs, fusions, and MSI from ctDNA [101] [7]. |
| PCR Reagents | ddPCR Supermix; ddPCR Mutation Assay Panels (e.g., for PIK3CA, EGFR, KRAS) | Ultra-sensitive detection and absolute quantification of specific hotspot mutations at low variant allele frequencies (as low as 0.01%) [8]. |
| Immunomagnetic Enrichment Reagents | CellSearch CTC Kit; Anti-EpCAM magnetic beads; Anti-CD45 depletion beads | Enrichment of rare circulating tumor cells from whole blood based on surface marker expression (e.g., EpCAM) [1]. |
| Methylation Analysis Reagents | EZ-96 DNA Methylation-Gold Kit (Zymo Research); Methylation-Specific PCR (MSP) primers | Bisulfite conversion of DNA and subsequent analysis of methylation patterns in promoter regions of cancer-associated genes (e.g., RASSF1A, BRCA1, OPCML) [37]. |
The field of liquid biopsy continues to evolve rapidly, with several emerging trends poised to reshape clinical practice. Multimodal liquid biopsies that combine multiple analytes (ctDNA, CTCs, EVs, proteins) are showing great promise by providing complementary layers of biological information, potentially enabling more accurate cancer detection and monitoring [103]. Artificial intelligence and machine learning are increasingly being applied to analyze this complex multimodal data for applications such as multi-cancer early detection (MCED) and tissue of origin identification [103].
The clinical implementation of liquid biopsy faces several ongoing challenges that require collaborative efforts to overcome. Key barriers include standardization of pre-analytical and analytical processes, demonstration of cost-effectiveness, establishment of robust regulatory frameworks, and securing consistent insurance reimbursement [8] [11] [103]. International consortia such as BLOODPAC are working to address these issues by generating large datasets and developing best practices [103].
In conclusion, the decision to employ a liquid-first, tissue-first, or complementary approach depends on a nuanced assessment of the clinical context, including the urgency of treatment decisions, accessibility of tumor tissue, and the specific clinical question being addressed. As evidence from ongoing randomized controlled trials accumulates and technologies continue to advance with increased sensitivity and reduced costs, liquid biopsy is poised to become an increasingly integral component of precision oncology, working in concert with—rather than replacing—tissue-based diagnosis.
Conclusion
The evidence firmly establishes that liquid and tissue biopsies are not mutually exclusive but are complementary tools in the oncologist's and researcher's arsenal. While tissue biopsy remains indispensable for initial diagnosis and provides rich histological context, liquid biopsy offers an unparalleled, dynamic view of tumor evolution and heterogeneity. The most significant recent advancement, highlighted by the ROME trial, is the superior patient outcome achieved when tailored therapy is guided by the concordance of both biopsy types. Future directions must focus on the standardization of assays, integration of multi-omics data, and the application of artificial intelligence to fully leverage the potential of combined profiling. For drug development, this synergy paves the way for more robust biomarker-stratified trials, real-time monitoring of therapeutic efficacy, and a deeper understanding of resistance mechanisms, ultimately accelerating the delivery of precision medicines.
References
- 1. Liquid biopsy in cancer: current status, challenges and ... [https://www.nature.com/articles/s41392-024-02021-w]
- 2. Pros and Cons of Liquid Versus Tissue Biopsy in Cancer ... [https://iprocess.net/liquid-biopsy-vs-tissue-biopsy/]
- 3. Histology Using Tissue Biopsies [https://bio-protocol.org/exchange/minidetail?id=18878025&type=30]
- 4. Patient Outcomes May Improve With Tailored Treatment ... [https://www.aacr.org/about-the-aacr/newsroom/news-releases/patient-outcomes-may-improve-with-tailored-treatment-guided-by-tissue-plus-liquid-biopsies-vs-individually/]
- 5. Liquid Biopsy vs. Tissue Biopsy: Pros & Cons [https://superiorbiodx.com/blog/liquid-biopsy-vs-tissue-biopsy/]
- 6. Challenges and limitations of liquid biopsy in precision ... [https://www.sciencedirect.com/science/article/pii/B9780443274961000038]
- 7. Validation of a liquid biopsy assay with increased ... [https://www.sciencedirect.com/science/article/pii/S2950195425000384]
- 8. The prospects and limitations of liquid biopsy utilization for ... [https://pmc.ncbi.nlm.nih.gov/articles/PMC11937291/]
- 9. Liquid biopsy – a narrative review with an update on current ... [https://pmc.ncbi.nlm.nih.gov/articles/PMC12333414/]
- 10. Minimum Technical Data Elements for Liquid Biopsy ... [https://pmc.ncbi.nlm.nih.gov/articles/PMC7158216/]
- 11. Liquid biopsy in cancer management: Integrating ... [https://www.sciencedirect.com/science/article/pii/S2352551724000921]
- 12. Liquid Biopsy Market Size to Surpass USD 22.69 Billion ... [https://www.biospace.com/press-releases/liquid-biopsy-market-size-to-surpass-usd-22-69-billion-by-2034-driven-by-early-cancer-detection-and-precision-diagnostics]
- 13. Liquid biopsy in gynecological cancers: a translational ... [https://jeccr.biomedcentral.com/articles/10.1186/s13046-025-03371-1]
- 14. Clinical and biological significance of circulating tumor... | Oncotarget [https://www.oncotarget.com/article/17184/text/]
- 15. Research progress of CTC, ctDNA , and EVs in cancer liquid biopsy ... [https://pmc.ncbi.nlm.nih.gov/articles/PMC10850354/]
- 16. Enhancing detection and monitoring of circulating tumor cells [https://www.sciencedirect.com/science/article/pii/S295019542500013X]
- 17. as a new frontier of cancer liquid Exosomes | Molecular Cancer biopsy [https://molecular-cancer.biomedcentral.com/articles/10.1186/s12943-022-01509-9]
- 18. Dissecting Tumor Heterogeneity by Liquid Biopsy—A ... [https://pmc.ncbi.nlm.nih.gov/articles/PMC12347833/]
- 19. Unravelling tumour spatiotemporal heterogeneity using ... [https://pmc.ncbi.nlm.nih.gov/articles/PMC12059211/]
- 20. High-definition spatial transcriptomic profiling of immune ... [https://www.nature.com/articles/s41588-025-02193-3]
- 21. Liquid biopsy- A pivotal test to help navigate clinical ... [https://www.sciencedirect.com/science/article/pii/S2950195425000396]
- 22. Validation and Clinical Utility of a Pan-Cancer Circulating ... [https://www.sciencedirect.com/science/article/pii/S1525157825002211]
- 23. Overview of Immunohistochemistry (IHC) [https://www.thermofisher.com/us/en/home/life-science/protein-biology/protein-biology-learning-center/protein-biology-resource-library/pierce-protein-methods/overview-immunohistochemistry.html]
- 24. Intro to Immunohistochemistry (IHC) Staining: Steps & Best ... [https://www.leicabiosystems.com/us/knowledge-pathway/immunohistochemistry-an-overview-steps-to-better-ihc-staining/]
- 25. From Sampling to Sequencing: A Liquid Biopsy Pre-Analytic ... [https://pmc.ncbi.nlm.nih.gov/articles/PMC8232701/]
- 26. Sample Preparation for NGS – A Comprehensive Guide [https://frontlinegenomics.com/sample-preparation-for-ngs-a-comprehensive-guide/]
- 27. a roadmap for DNA methylation biomarkers in liquid biopsies [https://www.nature.com/articles/s41388-025-03624-5]
- 28. The Emergence of Liquid Biopsy and Epigenetic Markers [https://pubmed.ncbi.nlm.nih.gov/40959208/]
- 29. Survival Outcomes May Improve When Treatment Is... - The ASCO Post [https://ascopost.com/news/april-2025/survival-outcomes-may-improve-when-treatment-is-guided-by-using-both-tissue-and-liquid-biopsies/]
- 30. Sensitivity, specificity, and accuracy of a liquid biopsy ... [https://www.nature.com/articles/s41598-021-89592-8]
- 31. Performance of four platforms for KRAS mutation detection ... [https://www.nature.com/articles/s41598-020-64822-7]
- 32. Cross-platform comparison for the detection of RAS ... [https://pmc.ncbi.nlm.nih.gov/articles/PMC5940402/]
- 33. Next-Generation Sequencing (NGS) | Explore the technology [https://www.illumina.com/science/technology/next-generation-sequencing.html]
- 34. Next-generation sequencing and its clinical application [https://pmc.ncbi.nlm.nih.gov/articles/PMC6528456/]
- 35. Cross-platform comparison for the detection of RAS ... [https://www.oncotarget.com/article/24950/]
- 36. Advantage of Next-Generation Sequencing in Dynamic ... [https://www.sciencedirect.com/science/article/pii/S1936523318305576]
- 37. Clinical utility of various liquid biopsy samples for the early ... [https://www.frontiersin.org/journals/oncology/articles/10.3389/fonc.2025.1594100/full]
- 38. Validation of a liquid biopsy assay with increased ... [https://pubmed.ncbi.nlm.nih.gov/40980342/]
- 39. Recent progress in mass spectrometry-based liquid biopsy ... [https://www.sciencedirect.com/science/article/pii/S0165993625001591]
- 40. A large-scale, multi-centre validation study of an AI- ... [https://www.nature.com/articles/s41698-025-01105-2]
- 41. Clinical utility of liquid biopsy next-generation sequencing ... [https://pubmed.ncbi.nlm.nih.gov/40830613/]
- 42. Exploring AI Approaches for Breast Cancer Detection and ... [https://pmc.ncbi.nlm.nih.gov/articles/PMC12553387/]
- 43. How Artificial Intelligence Is Transforming Cancer Care in ... [https://oncodaily.com/oncolibrary/artificial-intelligence-ai]
- 44. Liquid Biopsy: An Evolving Paradigm for Non-invasive ... [https://pmc.ncbi.nlm.nih.gov/articles/PMC10772356/]
- 45. Liquid Biopsy and Tissue Biopsy Comparison with Digital ... [https://pmc.ncbi.nlm.nih.gov/articles/PMC8824896/]
- 46. Liquid Biopsy Versus Tissue Biopsy to Determine Front ... [https://www.sciencedirect.com/science/article/abs/pii/S1525730422002650]
- 47. Detection of antimicrobial resistance via state-of-the-art ... [https://www.frontiersin.org/journals/microbiology/articles/10.3389/fmicb.2025.1549044/full]
- 48. Understanding antimicrobial resistance (AMR) ... [https://www.sciencedirect.com/science/article/abs/pii/S073288932500272X]
- 49. Emerging therapeutic drug monitoring technologies [https://pmc.ncbi.nlm.nih.gov/articles/PMC10965556/]
- 50. Real-Time Drug Monitoring: A New Era for Drug Discovery ... [https://www.bio-itworld.com/news/2025/07/01/real-time-drug-monitoring-a-new-era-for-drug-discovery-and-development]
- 51. Diagnostic Innovations to Combat Antibiotic Resistance in ... [https://pmc.ncbi.nlm.nih.gov/articles/PMC12428289/]
- 52. Bridging clinical gaps: 2025 expert consensus targets ... [https://www.eurekalert.org/news-releases/1105849]
- 53. Cancer in a Drop: Liquid biopsy insights from AACR 2025 [https://pmc.ncbi.nlm.nih.gov/articles/PMC12223554/]
- 54. FDA Issues Draft Guidance on Including Tissue Biopsies in ... [https://www.fda.gov/news-events/press-announcements/fda-issues-draft-guidance-including-tissue-biopsies-clinical-trials]
- 55. Liquid Biopsy: The Challenges of a Revolutionary ... [https://www.mdpi.com/1422-0067/26/11/5013]
- 56. Circulating tumor cell-derived preclinical models [https://www.nature.com/articles/s41419-023-06059-6]
- 57. Clinical applications of circulating tumor cells in metastasis ... [https://pmc.ncbi.nlm.nih.gov/articles/PMC12374358/]
- 58. Disease Screening - Statistics Teaching Tools - New York State Department of Health [https://www.health.ny.gov/diseases/chronic/discreen.htm]
- 59. Empirical likelihood confidence interval for sensitivity to the early disease stage - PMC [https://pmc.ncbi.nlm.nih.gov/articles/PMC9050820/]
- 60. How to Write a Research Protocol: Tips and Tricks - PMC [https://pmc.ncbi.nlm.nih.gov/articles/PMC6172884/]
- 61. Recommended format for a 'research protocol' [https://www.who.int/groups/research-ethics-review-committee/recommended-format-for-a-research-protocol]
- 62. AACR 2025: Tailored Treatment Guided by Combined ... [https://www.pharmacytimes.com/view/tailored-treatment-guided-by-combined-tissue-and-liquid-biopsies-may-improve-outcomes-in-advanced-solid-tumors]
- 63. Quantitative and Qualitative Analysis of Blood-based Liquid ... [https://pmc.ncbi.nlm.nih.gov/articles/PMC8941682/]
- 64. International society of liquid biopsy (ISLB) perspective on ... [https://www.sciencedirect.com/science/article/pii/S2950195425000177]
- 65. Artificial Intelligence-Enhanced Liquid Biopsy and Radiomics ... [https://pmc.ncbi.nlm.nih.gov/articles/PMC12524159/]
- 66. An Interview with 2025 Emerging Leader in Molecular ... [https://www.spectroscopyonline.com/view/harnessing-raman-spectroscopy-and-machine-learning-for-liquid-biopsy-classification-an-interview-with-2025-emerging-leader-in-molecular-spectroscopy-award-winner-lingyan-shi]
- 67. Survival Outcomes May Improve When Treatment Is ... [https://ascopost.com/news/april-2025/survival-outcomes-may-improve-when-treatment-is-guided-by-using-both-tissue-and-liquid-biopsies]
- 68. Guidelines for the standardization of preanalytic variables ... [https://pmc.ncbi.nlm.nih.gov/articles/PMC4414664/]
- 69. Why Pre-Analytical Variables Can Make or Break Your Assay [https://mtgroupbio.com/the-hidden-challenge-in-assay-development-why-pre-analytical-variables-can-make-or-break-your-assay/]
- 70. 5: Standardizing Analytical Methods [https://chem.libretexts.org/Bookshelves/Analytical_Chemistry/Analytical_Chemistry_2.1_(Harvey)/05%3A_Standardizing_Analytical_Methods]
- 71. Standardize Data: Why It Matters & How to Do It Effectively! [https://atlan.com/standardize-data/]
- 72. When and why to standardize a variable [https://www.listendata.com/2017/04/how-to-standardize-variable-in-regression.html]
- 73. Making Liquid Biopsy More Accurate, One Mutation at a Time [https://www.clinicallab.com/beyond-the-blood-draw-making-liquid-biopsy-more-accurate-one-mutation-at-a-time-28484]
- 74. Global trends and research status in clonal hematopoiesis [https://pmc.ncbi.nlm.nih.gov/articles/PMC12055686/]
- 75. An artificial intelligence-based model for prediction of ... [https://www.nature.com/articles/s41698-025-00921-w]
- 76. Cancer Biomarkers: Reflection on Recent Progress, Emerging ... [https://pmc.ncbi.nlm.nih.gov/articles/PMC12468363/]
- 77. Advances in CTC and ctDNA detection techniques [https://breast-cancer-research.biomedcentral.com/articles/10.1186/s13058-025-02024-7]
- 78. An integrated flow cytometry-based platform for isolation ... [https://www.nature.com/articles/s41598-018-23217-5]
- 79. Single-cell RNA-sequencing of circulating tumour cells [https://pmc.ncbi.nlm.nih.gov/articles/PMC12500777/]
- 80. Identification and Isolation Pipeline for Single Cell ... [https://www.sciencedirect.com/science/article/pii/S2666831925001298]
- 81. Integrating Circulating Tumor DNA into Clinical Management ... [https://pmc.ncbi.nlm.nih.gov/articles/PMC12346868/]
- 82. Rare Variant Analysis and Interpretation [https://www.illumina.com/informatics/biological-interpretation/variant-analysis/rare-variants.html]
- 83. Delayed genomic test results leave thousands without ... [https://ecancer.org/en/news/26102-delayed-genomic-test-results-leave-thousands-without-targeted-lung-cancer-treatment-experts-warn]
- 84. Liquid Biopsy Market Size, Share | Global Growth Report ... [https://www.fortunebusinessinsights.com/liquid-biopsy-market-102506]
- 85. Tumor Fluid Biopsy Market Growth from 2025 to 2034 [https://www.towardshealthcare.com/insights/tumor-fluid-biopsy-market-sizing]
- 86. Measuring Agreement in Diagnostics: A Practical Guide for Researchers - PubMed [https://pubmed.ncbi.nlm.nih.gov/41103021/]
- 87. Bioinformatics tools and data resources for assay ... [https://biomarkerres.biomedcentral.com/articles/10.1186/s40364-022-00425-w]
- 88. A novel graphical evaluation of agreement | BMC Medical Research Methodology | Full Text [https://bmcmedresmethodol.biomedcentral.com/articles/10.1186/s12874-022-01532-w]
- 89. Recommendations for the use of biomarkers ... [https://pmc.ncbi.nlm.nih.gov/articles/PMC12230961/]
- 90. Development of a consensus document to improve multireader concordance and accuracy of aortic regurgitation severity grading by echocardiography versus cardiac magnetic resonance imaging - PubMed [https://pubmed.ncbi.nlm.nih.gov/22651878/]
- 91. Liquid biopsy biomarkers in cervical cancer: A systematic ... [https://www.sciencedirect.com/science/article/pii/S295019542500044X]
- 92. A multi-criterion feature integration framework for accurate ... [https://www.nature.com/articles/s41746-025-02110-2]
- 93. Genomically matched therapy in advanced solid tumors [https://www.nature.com/articles/s41591-025-03918-x]
- 94. Combined Solid and Liquid Biopsies Boost Tailored Tumor ... [https://www.insideprecisionmedicine.com/topics/oncology/combined-solid-and-liquid-biopsies-boost-tailored-tumor-treatment-rome-reveals/]
- 95. AOA Dx Demonstrates High Accuracy in AI-Powered Blood ... [https://aoadx.com/aacr2025/]
- 96. Liquid biopsy: current technology and clinical applications [https://jhoonline.biomedcentral.com/articles/10.1186/s13045-022-01351-y]
- 97. Tissue and Liquid Biopsy for Targeted Therapy | Cancer Today [https://www.cancertodaymag.org/cancer-talk/tissue-and-liquid-biopsy/]
- 98. Liquid Biopsy Versus Tissue Biopsy to Determine Front ... [https://pubmed.ncbi.nlm.nih.gov/36585341/]
- 99. Prospective Multicenter Study Evaluating a Combined ... [https://pubmed.ncbi.nlm.nih.gov/40570258/]
- 100. The growing field of liquid biopsy and its Snowball effect on ... [https://www.sciencedirect.com/science/article/pii/S2950195425000098]
- 101. Clinical utility and future perspectives of liquid biopsy in ... [https://www.nature.com/articles/s43856-025-00852-4]
- 102. Tracking cancer's every move: Biotech Connector highlights ... [https://frederick.cancer.gov/node/7583]
- 103. The Liquid Biopsy Playbook: 5th Edition [https://frontlinegenomics.com/the-liquid-biopsy-playbook-5th-edition/]