Metabolic Reprogramming in Cancer: Mechanisms, Therapeutic Targeting, and Clinical Translation
This article comprehensively examines metabolic reprogramming as a fundamental hallmark of cancer, essential for meeting the bioenergetic, biosynthetic, and redox demands of rapidly proliferating tumor cells.
Metabolic Reprogramming in Cancer: Mechanisms, Therapeutic Targeting, and Clinical Translation
Abstract
This article comprehensively examines metabolic reprogramming as a fundamental hallmark of cancer, essential for meeting the bioenergetic, biosynthetic, and redox demands of rapidly proliferating tumor cells. It explores the foundational mechanisms driving metabolic alterations in glucose, lipid, and amino acid metabolism, influenced by oncogenes, tumor suppressor genes, and the tumor microenvironment. The content details methodological approaches for investigating cancer metabolism, analyzes challenges in therapeutic targeting including drug resistance mechanisms, and evaluates emerging strategies for clinical validation. Aimed at researchers, scientists, and drug development professionals, this review synthesizes current knowledge on metabolic vulnerabilities and their exploitation for precision oncology, highlighting combination therapies and biomarker development as promising future directions.
Core Mechanisms and Drivers of Cancer Metabolic Reprogramming
Cancer cell energetics represent a fundamental departure from normal cellular metabolism, characterized by profound reprogramming to support rapid proliferation, survival, and metastasis. While the Warburg effect (aerobic glycolysis) remains a cornerstone of cancer metabolism, contemporary research reveals far more complex adaptations encompassing mitochondrial respiration, glutaminolysis, and lipid metabolism. This whitepaper synthesizes current understanding of these metabolic shifts, detailing the molecular mechanisms, experimental methodologies, and therapeutic implications. We present comprehensive quantitative analyses of metabolic fluxes, detailed protocols for investigating cancer metabolism, and visualizations of key pathways. The emerging paradigm demonstrates that cancer cells exhibit remarkable metabolic plasticity, leveraging multiple catabolic and anabolic processes through context-dependent mechanisms that offer both challenges and opportunities for therapeutic intervention.
Cancer metabolism extends far beyond the Warburg effect to encompass a network of interconnected pathways that collectively support biomass production and energy generation in challenging microenvironments. The metabolic reprogramming observed in cancer cells is now recognized as a core hallmark of cancer, driven by oncogenic mutations, tumor microenvironmental stresses, and nutrient availability [1]. Each year, cancer causes approximately 10 million fatalities globally, representing nearly one in every six deaths, which underscores the critical need to understand its fundamental biology [2]. In the United States alone, 2,041,910 new cancer cases and 618,120 cancer deaths are projected to occur in 2025, despite continued declines in cancer mortality rates that have averted nearly 4.5 million deaths since 1991 [3].
The traditional binary view of cancer metabolism as either glycolytic or oxidative has given way to more nuanced models that recognize metabolic plasticity - the ability of cancer cells to dynamically shift between different metabolic states in response to therapeutic pressures, nutrient availability, and metastatic requirements [4]. This plasticity is governed by master regulatory networks involving AMPK, HIF-1, and MYC, which coordinate the utilization of glucose, fatty acids, and glutamine to meet biosynthetic and bioenergetic demands [4]. The tumor microenvironment further shapes metabolic behavior through hypoxia, nutrient competition, and interactions with stromal cells [5] [1].
Table 1: Core Metabolic Phenotypes in Cancer
| Phenotype | Primary Fuels | Key Regulators | ATP Production | Biosynthetic Output | Clinical Context |
|---|---|---|---|---|---|
| Glycolytic (W) | Glucose | HIF-1, PKM2 | Glycolysis dominant | Nucleotides, lactate | Primary tumors, hypoxia |
| Oxidative (O) | Glucose, fatty acids | AMPK | OXPHOS dominant | Limited biomass | Quiescent cells |
| Hybrid (W/O) | Glucose, fatty acids | AMPK, HIF-1 | Mixed glycolysis/OXPHOS | Balanced biomass/energy | Aggressive carcinomas |
| Glutaminolytic (Q) | Glutamine | MYC | Glutamine oxidation | Fatty acids, GSH | Therapy-resistant tumors |
Fundamental Metabolic Shifts in Cancer Cells
The Warburg Effect: Aerobic Glycolysis
The Warburg effect describes the propensity of cancer cells to preferentially metabolize glucose to lactate even in the presence of adequate oxygen, a paradoxical metabolic behavior that seems energetically inefficient compared to complete oxidative phosphorylation [2]. This phenomenon is not merely a consequence of mitochondrial damage but represents a strategic adaptation that provides multiple advantages: rapid ATP generation, metabolic intermediates for biosynthesis, and creation of an acidic microenvironment that promotes invasion and suppresses immune responses [5].
The molecular machinery driving the Warburg effect includes overexpression of glucose transporters (particularly GLUT1), which increases glucose uptake, and isoform switching of glycolytic enzymes such as pyruvate kinase M2 (PKM2), which creates a metabolic bottleneck that shunts glycolytic intermediates into biosynthetic pathways [2]. In colorectal cancer, research demonstrates that early-stage molecular upregulation of HIF-1α, GLUT1, PKM2, and lactate dehydrogenase A (LDHA) occurs in premalignant lesions, suggesting that Warburg effect activation precedes malignant transformation [5]. The therapeutic implications are significant, as key glycolytic enzymes including hexokinase, phosphofructokinase, pyruvate kinase, and lactate dehydrogenase are now prioritized as therapeutic targets in CRC treatment strategies [5].
Mitochondrial Metabolism Beyond the Warburg Effect
Contrary to early assumptions about dysfunctional mitochondria in cancer cells, oxidative phosphorylation (OXPHOS) plays crucial roles in tumorigenesis, metastasis, and drug resistance [4]. Many cancers, including specific subtypes like triple-negative breast cancer, demonstrate significant reliance on mitochondrial respiration supported by both glucose and alternative fuels [4]. The metabolic flexibility afforded by functional mitochondria enables cancer cells to adapt to therapeutic challenges and varying microenvironmental conditions.
The reverse Warburg effect illustrates the metabolic symbiosis within tumors, where cancer-associated fibroblasts (CAFs) undergo aerobic glycolysis and export metabolites such as lactate, pyruvate, fatty acids, and ketone bodies to fuel OXPHOS in adjacent cancer cells [5]. This metabolic coupling creates therapeutic vulnerabilities, as demonstrated by studies showing that perivascular cancer cells exhibit elevated OXPHOS activity compared to their distal counterparts, revealing microenvironment-governed metabolic zonation [5]. Furthermore, cancer cells resistant to anoikis - capable of surviving in circulation as circulating tumor cells (CTCs) - show a metabolic rewiring from characteristic glycolytic pathways toward more oxidative metabolism based on glutamine and fatty acids [1].
Glutaminolysis and Amino Acid Metabolism
Glutamine metabolism serves as a critical adjunct and sometimes alternative to glucose metabolism in many cancers. Glutamine, the most abundant amino acid in plasma, fuels tumor cells through multiple mechanisms: driving the TCA cycle via oxidation, synthesizing fatty acids via reductive carboxylation, and generating glutathione (GSH) to maintain redox balance [4]. The master regulator MYC coordinates glutamine metabolism by upregulating glutamine transporters (e.g., SLC1A5) and glutaminase (GLS), which converts glutamine to glutamate [4].
Cancer cells enhance amino acid transport through increased expression of solute carriers (SLCs) and reprogramming of metabolic pathways to support protein synthesis and nucleotide production [2]. In glioblastoma, stable isotope tracing reveals that tumors actively scavenge alternative carbon sources such as amino acids from the environment while repurposing glucose-derived carbons for proliferation and invasion molecules [6]. This metabolic rewiring represents a therapeutic opportunity, as demonstrated by the sensitivity of some cancers to glutamine deprivation or inhibition of glutaminase.
Lipid Metabolic Reprogramming
Lipid metabolism in cancer cells involves coordinated increases in fatty acid uptake, de novo lipogenesis, and lipid storage/mobilization to support membrane biosynthesis, energy production, and signaling pathways [2]. Cancer cells exhibit increased lipid intake from the extracellular microenvironment and enhanced lipid storage and mobilization from intracellular lipid droplets [2]. Fatty acid oxidation (FAO) serves as an important energy source during metabolic stress and has been shown to be essential for triple-negative breast cancer progression [4].
Lipid metabolism plays a vital role in cancer stem cell (CSC) maintenance, with CSCs manipulating lipid metabolism to sustain stemness, resist therapy, and adapt to environmental stress [1]. These cells increase fatty acid content for energy, engage in β-oxidation to optimize utilization, and enhance cholesterol synthesis through the mevalonate pathway [1]. Additionally, lipid droplets serve as alternative energy reservoirs, protecting CSCs from oxidative stress, making them potential therapeutic targets.
Nucleotide Synthesis Pathways
The relentless proliferation of cancer cells creates extraordinary demands for nucleotide synthesis to support DNA and RNA production. Cancer cells meet these demands through coordinated upregulation of both the salvage and de novo nucleotide synthesis pathways [2]. In glioblastoma, glucose carbon use is shifted away from physiological processes like TCA cycle oxidation and neurotransmitter synthesis toward nucleotide production, as revealed by stable isotope tracing in patients [6].
The pentose phosphate pathway (PPP), a branch of glucose metabolism, provides essential support for nucleotide synthesis by generating ribose-5-phosphate for nucleotide backbone formation and NADPH for reductive biosynthesis and antioxidant defense [2]. Cancer cells upregulate key PPP enzymes, including glucose-6-phosphate dehydrogenase (G6PD) and transketolase-like enzymes (TKTL), to maintain flux through this pathway [2]. The interconnected nature of nucleotide, glucose, fatty acid, and amino acid metabolism creates both challenges and opportunities for therapeutic intervention, as disruption of one pathway often leads to compensatory increases in others [2].
Table 2: Quantitative Metabolic Flux Comparisons in Human Cortex vs. Glioblastoma
| Metabolic Parameter | Human Cortex | Glioblastoma (Enhancing) | Glioblastoma (Non-enhancing) | Measurement Technique |
|---|---|---|---|---|
| Glucose uptake | High | Similar to cortex | Similar to cortex | 18F-FDG PET, 13C-glucose tracing |
| Lactate production | Moderate | High | High | 13C-lactate enrichment |
| TCA cycle glucose oxidation | High | Significantly reduced | Reduced | 13C-glucose TCA intermediate labeling |
| Neurotransmitter synthesis from glucose | High (GABA, glutamate) | Minimal | Minimal | 13C-neurotransmitter labeling |
| Nucleotide synthesis from glucose | Low | Significantly increased | Increased | 13C-nucleotide precursor labeling |
| Glutamine utilization | Moderate | Increased | Increased | 13C-glutamine tracing studies |
Experimental Methodologies for Investigating Cancer Metabolism
Stable Isotope Tracing and Metabolic Flux Analysis
Stable isotope tracing has revolutionized the study of cancer metabolism by enabling direct tracking of nutrient fate through metabolic networks. The fundamental approach involves administering isotopically labeled nutrients (e.g., [U-13C]glucose, [U-13C]glutamine) to biological systems and measuring their incorporation into downstream metabolites using mass spectrometry [6]. This methodology directly monitors metabolic activity rather than just measuring metabolite levels.
Protocol 1: Human Intracranial [U-13C]Glucose Infusion Study
Patient Preparation: Patients with suspected high-grade gliomas scheduled for surgical resection are selected following appropriate ethical approval and informed consent [6].
Isotope Infusion: Initiate intravenous infusion of [U-13C]glucose at the start of craniotomy, typically maintaining for approximately 3 hours until tissue collection [6].
Monitoring Systemic Labeling: Collect arterial blood samples at regular intervals (e.g., every 30 minutes) to measure circulating [U-13C]glucose enrichment, which typically reaches 20-40% of total glucose and stabilizes after 30 minutes [6].
Tissue Collection: During resection, collect multiple tissue samples from distinct regions: contrast-enhancing tumor (aggressive, vascular areas), non-enhancing FLAIR hyperintense tumor (infiltrative regions), and surrounding cortex [6].
Sample Processing: Immediately flash-freeze tissue samples in liquid nitrogen to preserve metabolic state. Preserve aliquots for histopathological validation of tissue composition [6].
Metabolite Extraction: Homogenize frozen tissues in cold methanol-water solutions, followed by centrifugation to remove proteins and lipids [6].
Mass Spectrometry Analysis: Analyze metabolites using liquid chromatography coupled with mass spectrometry (LC-MS) to determine 13C enrichment patterns in glycolytic intermediates, TCA cycle metabolites, amino acids, and nucleotides [6].
Spatial Metabolic Imaging: Complement LC-MS with matrix-assisted laser desorption/ionization (MALDI) MS imaging on tissue slices to visualize spatial distribution of metabolite labeling [6].
Metabolic Flux Modeling: Integrate isotopomer distribution data with computational models to quantify absolute metabolic flux rates through key pathways [6].
Computational Modeling of Cancer Metabolism
Computational approaches provide powerful tools for interpreting complex metabolic data and predicting cancer cell behavior under different conditions. Phenotypic modeling couples master gene regulators with key metabolic substrates to simulate the dynamics of cancer metabolism and identify stable metabolic states [4].
Protocol 2: Development of Phenotypic Metabolic Model
Network Construction: Compile a comprehensive metabolic network featuring uptake, transportation, and utilization of three main metabolic ingredients: glucose, fatty acids, and glutamine, including their catabolic and anabolic fates [4].
Regulatory Integration: Incorporate five types of regulatory interactions: (a) competition for metabolic resources, (b) modulation by gene regulators (AMPK, HIF-1, MYC), (c) feedback by metabolic intermediates, (d) crosstalk between regulators, and (e) regulation of nutrient transporters [4].
Model Coarse-Graining: Develop a minimal network model that captures essential features while remaining computationally tractable, including three gene regulators, four key metabolites (ROS, ATP, acetyl-CoA, GSH), and six metabolic pathways [4].
Parameterization: Estimate kinetic parameters based on literature values and experimental data, with sensitivity analysis to identify critical parameters [4].
Phenotype Identification: Use computational analysis (e.g., bifurcation analysis, parameter screening) to identify all possible stable metabolic states the system can acquire [4].
Validation: Compare model predictions with experimental data from transcriptomic and metabolomic analyses of tumor samples, such as TCGA data [4].
Therapeutic Simulation: Use the validated model to simulate responses to metabolic interventions and identify synergistic combination therapies [4].
Metabolic Imaging and Diagnostic Modalities
Non-invasive imaging techniques enable clinical assessment of tumor metabolism and monitoring of therapeutic responses. 18F-fluorodeoxyglucose positron emission tomography (18F-FDG PET/CT) leverages the enhanced glucose uptake characteristic of many cancers to detect tumors, stage disease, and assess treatment efficacy [5]. This modality provides quantitative measurements of glucose avidity that correlate with tumor aggressiveness and metabolic activity.
Metabolomic analysis of circulating metabolites offers a complementary approach to characterize tumor metabolism through minimally invasive liquid biopsies. These analyses can identify distinct metabolic signatures that enable precise disease stratification and management [5]. In cervical squamous cell carcinoma, for example, pretreatment plasma omega-3 polyunsaturated fatty acids levels show promise as biomarkers for predicting treatment response and survival outcomes [1].
Metabolic Pathways and Regulatory Networks
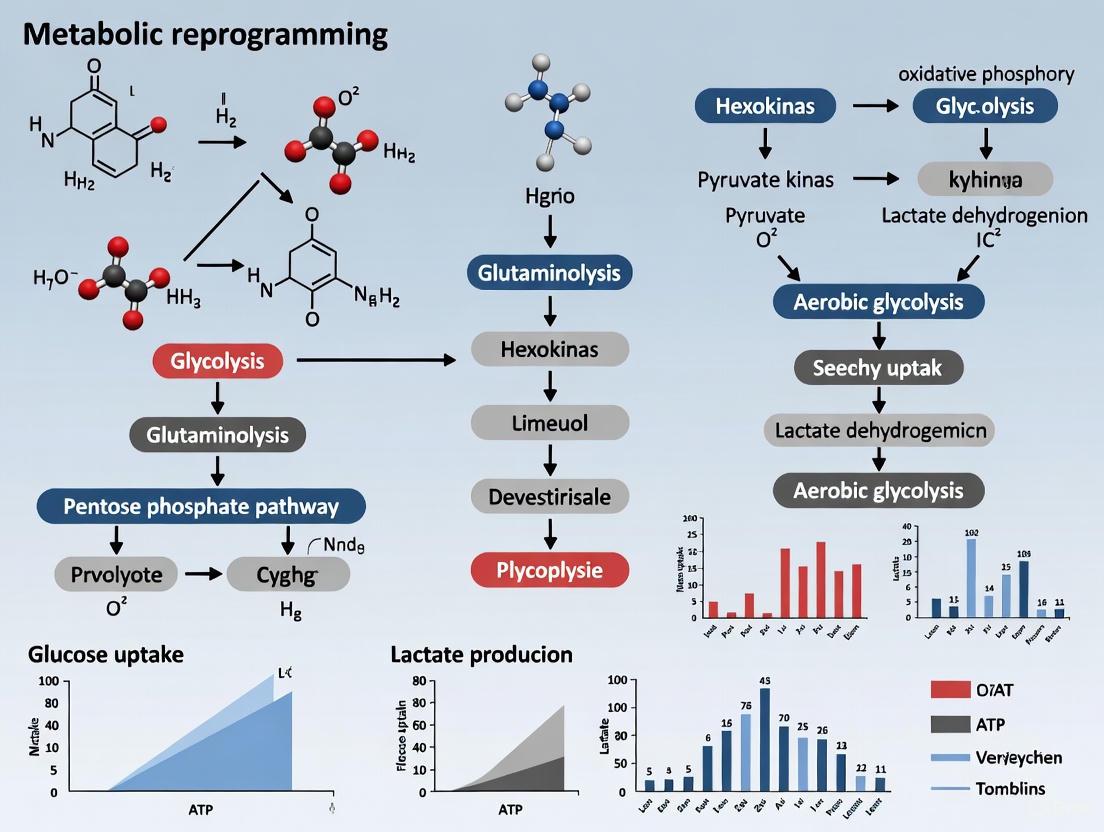
Figure 1: Cancer Metabolic Network. This diagram illustrates the core metabolic pathways in cancer cells and their regulation by key signaling nodes. The network highlights the integration of glucose, glutamine, and fatty acid metabolism supporting energy production, redox balance, and biomass generation.
Metabolic Heterogeneity and Phenotypic Classification
Computational modeling predicts that cancer cells can acquire four distinct metabolic phenotypes through different combinations of catabolic and anabolic processes [4]:
Catabolic phenotype (O): Characterized by vigorous oxidative processes, primarily mitochondrial respiration of glucose and fatty acids, with AMPK as the dominant regulator.
Anabolic phenotype (W): Defined by pronounced reductive activities, predominantly aerobic glycolysis, with HIF-1 as the key regulator.
Hybrid phenotype (W/O): Exhibits both high catabolic and high anabolic activity, utilizing multiple fuel sources simultaneously, with coordinated AMPK and HIF-1 activity.
Glutaminolytic phenotype (Q): Relies mainly on glutamine oxidation, with MYC as the dominant regulator, often associated with therapy resistance.
Strikingly, carcinoma samples exhibiting hybrid metabolic phenotypes are often associated with the worst survival outcomes relative to other metabolic phenotypes, suggesting that metabolic plasticity itself may confer aggressive characteristics [4]. This heterogeneity extends beyond inter-tumoral differences to include intra-tumoral metabolic zonation, where different regions of the same tumor exhibit distinct metabolic profiles based on proximity to vasculature, nutrient gradients, and stromal interactions [5].
Figure 2: Metabolic Phenotypes in Cancer. This diagram classifies four distinct metabolic states observed in cancer cells, their regulatory drivers, fuel preferences, and clinical associations.
The Scientist's Toolkit: Research Reagent Solutions
Table 3: Essential Research Reagents for Cancer Metabolism Studies
| Reagent Category | Specific Examples | Research Application | Key Findings Enabled |
|---|---|---|---|
| Stable Isotope Tracers | [U-13C]glucose, [U-13C]glutamine, 13C-acetate | Metabolic flux analysis, pathway utilization | Quantification of pathway activities, nutrient contributions to biomass |
| Metabolic Inhibitors | 2-deoxy-D-glucose (2-DG), Dichloroacetate (DCA), TOFA, ADI-PEG 20 | Target validation, synthetic lethality studies | Identification of metabolic dependencies, combination therapy strategies |
| Genetically Encoded Biosensors | ATeam (ATP sensor), iNAP (NAPH sensor), Laconic (lactate sensor) | Real-time monitoring of metabolite dynamics in live cells | Single-cell metabolic heterogeneity, temporal metabolic responses |
| Metabolomics Standards | SILIS (stable isotope-labeled internal standards), quality control pools | Absolute quantification in mass spectrometry | Reproducible metabolite measurement across studies and laboratories |
| Cell Culture Media | DMEM, RPMI, plasma-like medium (PLM), custom nutrient-depleted media | Microenvironment modeling, nutrient dependence studies | Context-specific metabolic dependencies, physiological relevance |
Therapeutic Implications and Future Directions
Targeting cancer metabolism represents a promising therapeutic frontier with several approved agents and many more in development. Metabolic therapies can be broadly categorized into several strategic approaches:
Direct Metabolic Inhibitors
Direct inhibitors target key enzymes in metabolic pathways that are dysregulated in cancer. Examples include 2-deoxy-D-glucose (2-DG) which targets hexokinase in glycolysis, dichloroacetate (DCA) which targets pyruvate dehydrogenase kinase to restore mitochondrial function, and CPI-613 which targets mitochondrial enzymes in the TCA cycle [2]. While monotherapies with these agents have shown limited efficacy due to metabolic plasticity, they demonstrate greater promise in rational combinations that block compensatory pathways [5].
Diet-Metabolism Interactions
Dietary interventions represent an emerging approach to modulate tumor metabolism therapeutically. Preclinical models demonstrate that modulating dietary amino acids can selectively alter glioblastoma metabolism, slow tumor growth, and augment the efficacy of standard-of-care treatments [6]. Specific dietary regimens, including ketogenic diets and specific amino acid restrictions, may create unfavorable metabolic conditions for tumor growth while potentially enhancing the therapeutic index of conventional treatments.
Metabolic Immunomodulation
The intersection of metabolism and immunotherapy represents a particularly promising area. Cancer metabolism creates an immunosuppressive tumor microenvironment through multiple mechanisms: lactate acidification impairs antitumor immune cells, nutrient depletion creates competition with immune cells, and specific metabolites directly inhibit immune function [5] [1]. Strategies to modulate tumor metabolism may therefore enhance antitumor immunity and improve responses to immune checkpoint inhibitors.
Targeting Metabolic Plasticity
Rather than targeting specific pathways, emerging approaches aim to limit metabolic plasticity itself - the ability of cancer cells to adapt their metabolism in response to therapy. This includes targeting master regulators like MYC, HIF-1, and AMPK, or downstream effectors that enable metabolic flexibility [4]. Computational models predict that simultaneously targeting complementary pathways (e.g., glycolysis and OXPHOS) may prevent adaptive resistance and yield more durable responses [4] [5].
The future of cancer metabolism research lies in developing increasingly sophisticated models that capture the complexity of metabolic networks, understanding how metabolism varies across different cancer types and individuals, and designing therapeutic strategies that account for metabolic heterogeneity and plasticity. The integration of metabolic imaging, computational modeling, and targeted interventions holds promise for personalized metabolic approaches that exploit the unique vulnerabilities of each patient's cancer.
Metabolic reprogramming is a established hallmark of cancer, enabling rapid tumor growth and survival in challenging microenvironments. This whitepaper examines three pivotal oncogenic drivers—c-MYC, KRAS, and HIF-1α—that orchestrate profound metabolic alterations in cancer cells. Through distinct mechanisms, these regulators enhance nutrient uptake, redirect glycolytic flux, stimulate lipid and nucleotide synthesis, and adapt tumor metabolism to hypoxic conditions. Understanding their intertwined signaling networks provides crucial insights for developing targeted therapeutic strategies against intractable cancers. We present a comprehensive analysis of their mechanisms, experimental approaches for investigation, and the current toolkit for researchers targeting oncogene-driven metabolic dependencies.
Cancer cells undergo fundamental metabolic transformations to support uncontrolled proliferation, biomass accumulation, and adaptation to the tumor microenvironment (TME). Metabolic reprogramming represents a core hallmark of malignancy, driven by genetic alterations in oncogenes and tumor suppressor genes [7] [8]. Among these drivers, c-MYC, KRAS, and HIF-1α emerge as master regulators that coordinate complementary metabolic programs to meet the diverse demands of growing tumors.
The Warburg effect (aerobic glycolysis) was one of the first observed metabolic alterations in cancer, but contemporary research has revealed a much broader spectrum of metabolic changes encompassing lipid metabolism, glutaminolysis, mitochondrial respiration, and biosynthetic pathway branching [7]. This whitepaper synthesizes current understanding of how c-MYC, KRAS, and HIF-1α individually and collectively reshape cellular metabolism, providing a technical foundation for researchers and drug development professionals working in cancer metabolism.
Fundamental Concepts
Normal cells carefully balance energy production and biosynthetic processes through tightly regulated metabolic pathways. In contrast, cancer cells prioritize anabolic processes to support rapid division, often at the expense of energy efficiency [7]. This metabolic transformation includes:
- Enhanced nutrient uptake (glucose, glutamine, fatty acids)
- Redirected carbon flux into biosynthesis
- Altered redox homeostasis
- Metabolic adaptation to hypoxia and nutrient scarcity
Key Altered Pathways
Table 1: Core Metabolic Pathways Altered in Cancer
| Metabolic Pathway | Normal Function | Cancer Alteration | Key Oncogenic Regulators |
|---|---|---|---|
| Glycolysis | Glucose oxidation to pyruvate for ATP production | Enhanced flux with lactate secretion (Warburg effect) | HIF-1α, KRAS, MYC |
| Glutaminolysis | Nitrogen donation; TCA cycle anaplerosis | Increased glutamine dependency for biosynthesis | MYC, KRAS |
| Lipid Metabolism | Energy storage; membrane structure | Enhanced de novo lipogenesis; lipid droplet accumulation | MYC, SREBP1 |
| Mitochondrial Respiration | Efficient ATP production via OXPHOS | Variable utilization; TCA cycle intermediate diversion | HIF-1α (suppresses) |
| Hexosamine Biosynthesis | Protein glycosylation | Increased UDP-GlcNAc production; O-GlcNAcylation | KRAS, MYC |
c-MYC-Driven Metabolic Reprogramming
Molecular Mechanisms
The MYC oncogene functions as a master transcription factor that coordinates multiple aspects of cell growth and metabolism. MYC activates expression of metabolic genes through both direct DNA binding at canonical E-box sequences and "invasion" of lower-affinity sites when overexpressed, leading to transcriptional amplification [9]. MYC's effects on metabolism include:
- Enhanced glycolytic capacity through upregulation of glycolytic enzymes
- Increased glutaminolysis by elevating glutaminase (GLS) expression
- Stimulation of mitochondrial biogenesis and respiration
- Promotion of nucleotide and amino acid synthesis
Lipid Metabolism Regulation
MYC exerts particularly profound effects on lipid metabolism, primarily through activation of sterol regulatory element-binding protein 1 (SREBP1), which controls transcription of lipogenic enzymes [9]. The MYC-lipid metabolism axis exhibits significant tissue-specific heterogeneity:
Table 2: Tissue-Specific MYC Effects on Lipid Metabolism
| Tissue/Cancer Type | MYC-Associated Metabolic Effects | Key Regulated Enzymes/Proteins |
|---|---|---|
| Lymphocytes/B-cell Lymphoma | Acetyl-CoA from glycolysis directed to palmitate synthesis; essential for survival | PCYT1A, LPCAT2 |
| Liver Cancer (HCC) | Increased fatty acid synthesis; ACSL4 regulates MYC stability | ACLY, ACC, FASN, ACSL4 |
| Pancreatic Cancer (PDAC) | Regulation of fatty acid elongation | ELOVL1, ELOVL6 |
| Breast Cancer (TNBC) | Decreased FAS, increased FAO; increased CD36 expression | CD36, CPT1A |
| Prostate Cancer | Upregulation of lipogenic enzymes; reduced arachidonic acid release | ACLY, ACC, FASN, PLA2G4F |
In hepatocellular carcinoma (HCC), MYC stability is regulated by acyl-CoA synthetase ACSL4, creating a positive feedback loop that drives lipogenesis [9]. This pathway represents a promising therapeutic target for MYC-driven liver cancers.
Experimental Approaches
Metabolic Flux Analysis (MFA) using 13C-labeled glucose or glutamine enables researchers to quantify carbon flow through pathways regulated by MYC. For lipid metabolism studies, isotopic tracing with 13C-acetate followed by mass spectrometry-based lipidomics can delineate MYC's effect on de novo lipogenesis versus fatty acid oxidation [10].
Figure 1: c-MYC Regulation of Metabolic Pathways. MYC coordinates multiple biosynthetic processes to support cell growth.
KRAS-Driven Metabolic Reprogramming
Molecular Mechanisms
KRAS mutations occur in approximately 25% of all human cancers, with particularly high prevalence in pancreatic, colorectal, and lung adenocarcinomas [11]. Oncogenic KRAS locks the protein in its active GTP-bound state, leading to constitutive signaling through downstream effectors including the MAPK/ERK and PI3K/AKT pathways [11]. KRAS reproforms metabolism through:
- Enhanced glucose uptake and glycolytic flux
- Redirected glucose carbon into branching anabolic pathways
- Increased glutamine metabolism to support TCA cycle anaplerosis
- Altered lipid metabolism to sustain membrane biosynthesis
Metabolic Pathway Specificity
KRAS exhibits isoform-specific metabolic effects, with KRAS4A directly interacting with hexokinase 1 (HK1) on the outer mitochondrial membrane to promote glycolytic flux [11]. KRAS-driven tumors also demonstrate unique metabolic dependencies:
- Redox balance maintenance through increased pentose phosphate pathway flux
- Enhanced glycosphingolipid synthesis required for KRAS signaling competence
- Nutrient scavenging through macropinocytosis and autophagy
- Microenvironment modification through acid secretion
The Warburg effect in KRAS-mutant cells is partially mediated through MYC activation, creating an interconnected oncogenic network that coordinately regulates metabolic gene expression [11]. KRAS also influences the tumor microenvironment by promoting immunosuppression through metabolic competition, limiting glucose availability for infiltrating T cells and thereby facilitating immune evasion [12].
Experimental Approaches
Seahorse Metabolic Flux Analysis provides real-time measurement of glycolysis and mitochondrial respiration in KRAS-mutant cells. For in vivo studies, KRASLSL-G12D genetically engineered mouse models enable investigation of metabolic reprogramming during tumor initiation and progression [11]. Stable isotope-resolved tracing with U-13C-glucose can delineate how KRAS redirects glucose carbon into the hexosamine biosynthesis pathway and non-oxidative pentose phosphate pathway [10] [11].
HIF-1α-Driven Metabolic Reprogramming
Molecular Mechanisms
Hypoxia-inducible factor 1α (HIF-1α) serves as the master regulator of cellular adaptation to low oxygen conditions, which are prevalent in solid tumors due to inadequate vascularization [13] [14]. Under normoxic conditions, HIF-1α undergoes prolyl hydroxylation that targets it for VHL-mediated ubiquitination and proteasomal degradation [15]. During hypoxia, HIF-1α stabilizes and translocates to the nucleus, where it heterodimerizes with HIF-1β to activate transcription of target genes containing hypoxia response elements (HREs).
Recent research has identified additional regulatory mechanisms, including the discovery that UHRF1 interacts with HIF-1α in ovarian cancer, inhibiting its hydroxylation and subsequent degradation independent of oxygen tension [15]. This expands the paradigm of HIF-1α regulation beyond traditional oxygen-sensing mechanisms.
Metabolic Consequences
HIF-1α activation promotes a comprehensive metabolic shift characterized by:
- Enhanced glycolytic flux through upregulation of glucose transporters (GLUT1) and glycolytic enzymes (HK2, LDHA)
- Suppression of mitochondrial oxidation via induction of PDK1, which inhibits pyruvate entry into the TCA cycle
- Promotion of angiogenesis through VEGF activation
- Stemness maintenance and dedifferentiation through metabolic reprogramming
This metabolic rewiring reduces oxygen consumption while maintaining ATP production, allowing tumor cells to survive and proliferate in hypoxic niches [13]. The HIF-1α-glycolysis axis also promotes cancer stem cell (CSC) properties, contributing to tumor heterogeneity, metastasis, and therapy resistance [13].
Experimental Approaches
Hypoxia chambers or chemical hypoxia mimetics (e.g., CoCl₂, DMOG) enable researchers to stabilize HIF-1α and study its metabolic effects under controlled conditions. For dynamic tracking, HIF-1α transcriptional reporters using HRE-driven fluorescent proteins permit real-time monitoring of HIF-1α activity in living cells. Metabolomic profiling of cells with HIF-1α knockdown under hypoxic versus normoxic conditions can identify specific metabolic nodes controlled by this pathway [10].
Figure 2: HIF-1α-Mediated Metabolic Adaptation to Hypoxia. HIF-1α coordinates a shift toward glycolysis while suppressing mitochondrial function.
Integrated Metabolic Network
Oncogenic Cooperation
While each oncogene can independently drive metabolic reprogramming, their coordinated action creates a powerful network that maximizes tumor growth potential. Key interactions include:
- KRAS stabilization of HIF-1α through MAPK signaling, even under normoxic conditions
- MYC amplification of HIF-1α transcriptional programs through cooperative gene activation
- Convergent regulation of glycolytic enzymes by all three oncogenes
- Compensatory pathway activation when individual oncogenes are inhibited
This network creates significant challenges for therapeutic intervention, as tumors can maintain metabolic flexibility through redundant regulatory nodes.
Therapeutic Implications
The metabolic dependencies created by c-MYC, KRAS, and HIF-1α activation represent attractive therapeutic targets. Current strategies include:
- Direct KRAS G12C inhibitors (sotorasib, adagrasib) that mitigate downstream metabolic reprogramming
- Indirect MYC inhibition through targeting of regulatory kinases or synthetic lethal partners
- HIF-1α pathway inhibitors that disrupt the hypoxia response
- Metabolic enzyme inhibitors that exploit specific vulnerabilities created by oncogenic drivers
However, metabolic plasticity and compensatory pathway activation frequently limit the efficacy of single-agent therapies, driving interest in rational combination approaches [8].
The Scientist's Toolkit
Research Reagent Solutions
Table 3: Essential Research Tools for Oncogenic Metabolism Studies
| Research Tool Category | Specific Examples | Key Applications | Considerations |
|---|---|---|---|
| Metabolic Flux Assays | Seahorse XF Analyzers; 13C-isotope tracing | Real-time mitochondrial and glycolytic function; pathway flux quantification | Requires specialized instrumentation; complex data interpretation |
| Genetically Encoded Biosensors | ATeam (ATP), iNAP (NAD+), Laconic (lactate) | Subcellular metabolite dynamics in live cells | May require viral delivery; calibration critical |
| Oncogene Expression Systems | Doxycycline-inducible vectors; CRISPRa/i systems | Controlled oncogene expression; study of early metabolic effects | Leaky expression can confound results |
| Hypoxia Modeling Systems | Hypoxia chambers; chemical inducers (DMOG) | HIF-1α pathway activation; hypoxia metabolism | Varying degrees of hypoxia induction |
| Metabolomics Platforms | LC-MS/MS; GC-MS; NMR | Comprehensive metabolite profiling; isotope tracing | Sample preparation critical; complex data analysis |
Experimental Protocols
13C-Metabolic Flux Analysis (MFA) Protocol [10]:
- Culture cells in stable isotope-labeled substrates (e.g., U-13C-glucose, 13C-glutamine)
- Extract intracellular metabolites at multiple time points using methanol:water:chloroform system
- Analyze metabolite mass isotopomer distributions via LC-MS or GC-MS
- Compute metabolic fluxes using computational modeling software (e.g., INCA, CellNetAnalyzer)
- Validate flux estimates through comparison with extracellular flux measurements
Seahorse XF Glycolytic Function Assay [10]:
- Seed cells in XF microplates at optimized density (typically 20,000-80,000 cells/well)
- Replace medium with XF assay medium (Agilent) supplemented with 2mM glutamine
- Measure basal extracellular acidification rate (ECAR)
- Sequentially inject: 10mM glucose (glycolytic capacity), 1μM oligomycin (maximal glycolysis), 50mM 2-DG (non-glycolytic acidification)
- Normalize data to protein content and calculate glycolytic parameters
Hypoxia Metabolism Profiling [15] [13]:
- Establish matched normoxic (21% O₂) and hypoxic (0.5-2% O₂) culture conditions
- Confirm HIF-1α stabilization via western blotting
- Measure nutrient consumption and metabolite secretion (glucose, lactate, glutamine)
- Perform transcriptomic analysis of metabolic gene expression
- Assess functional metabolic parameters via extracellular flux analysis
The oncogenic drivers c-MYC, KRAS, and HIF-1α represent central nodes in the metabolic reprogramming network that supports tumor growth and progression. Each factor regulates distinct yet complementary aspects of cancer metabolism, creating an integrated system that enhances nutrient capture, redirects metabolic flux, and adapts to microenvironmental challenges. Their frequent co-occurrence in human cancers creates synergistic effects that maximize metabolic flexibility and therapeutic resistance.
Future research directions should focus on understanding the dynamic interactions between these regulators throughout tumor evolution, developing sophisticated models to capture metabolic heterogeneity within tumors, and identifying critical vulnerabilities in the oncogenic metabolic network that can be therapeutically exploited. As targeting cancer metabolism moves from concept to clinic, the continued dissection of how c-MYC, KRAS, and HIF-1α reshape metabolic pathways will undoubtedly yield new strategies for combatting intractable cancers.
The metabolic reprogramming of cancer cells, a hallmark of cancer, is not merely a passive consequence of oncogenic transformation but a fundamental process actively orchestrated by the loss of tumor suppressor function. The inactivation of key tumor suppressors—p53, PTEN, and LKB1—represents a critical mechanism through which cancer cells achieve metabolic rewiring to support rapid proliferation, survival, and adaptation to hostile microenvironments. These proteins, traditionally studied for their roles in cell cycle arrest, apoptosis, and genome maintenance, have emerged as master regulators of cellular metabolism, integrating nutrient availability with energy status and biosynthetic demands. Their frequent inactivation across diverse cancer types creates a permissive environment for the establishment of oncogenic metabolic phenotypes, including the Warburg effect, glutamine addiction, and lipid metabolic dysregulation. This whitepaper examines the distinct yet interconnected mechanisms by which p53, PTEN, and LKB1 loss drives metabolic dysregulation, framing these events within the broader context of cancer metabolic reprogramming and highlighting emerging therapeutic opportunities targeting these vulnerabilities.
Metabolic Consequences of p53 Inactivation
Regulation of Central Carbon Metabolism
The p53 tumor suppressor protein, often termed the "guardian of the genome," plays an equally crucial role as a regulator of cellular metabolism. Wild-type p53 counters the metabolic reprogramming characteristic of cancer cells by promoting oxidative phosphorylation while inhibiting glycolysis and anabolic pathways, thereby protecting cells from metabolic stresses that could drive malignant transformation [16]. p53 suppresses glucose uptake by downregulating glucose transporters GLUT1, GLUT3, and GLUT4, and inhibits hexokinase 2 (HK2) through induction of miR-143 and miR-34a, reducing the initial steps of glucose utilization [16]. Through its target gene TIGAR (TP53-inducible glycolysis and apoptosis regulator), p53 lowers fructose-2,6-bisphosphate levels, suppressing glycolytic flux and reducing reactive oxygen species (ROS) [16]. p53 further disrupts lactate production by inhibiting lactate dehydrogenase A (LDHA) activity and repressing monocarboxylate transporter 1 (MCT1), preventing lactate secretion and maintaining oxidative metabolism [16].
In contrast to its suppression of glycolysis, p53 enhances mitochondrial respiration through multiple mechanisms. It upregulates cytochrome c oxidase 2 (COX2), a key component of the electron transport chain, and promotes pyruvate dehydrogenase (PDH) activity by increasing Parkin expression while reducing pyruvate dehydrogenase kinase 2 expression, thereby channeling pyruvate into the TCA cycle [16]. Additionally, p53 transcriptionally represses malic enzymes ME1 and ME2, which normally convert malate to pyruvate while generating NADPH, thus limiting substrate diversion from the TCA cycle [16]. The metabolic consequences of p53 loss are profound, driving the Warburg effect through increased glucose uptake, glycolytic flux, and lactate production, while diminishing mitochondrial oxidative capacity.
Coordination of Amino Acid and Lipid Metabolism
Beyond glucose metabolism, p53 regulates amino acid and lipid metabolic pathways to constrain tumor growth. p53 transactivates glutaminase 2 (GLS2), producing glutamate that fuels glutathione synthesis and lowers ROS levels under mild genotoxic stress [16]. This stands in contrast to the role of mutant p53, which promotes glutamine utilization through GLS1 instead of GLS2, highlighting the context-dependent nature of p53's metabolic functions. p53 also inhibits de novo serine synthesis by repressing phosphoglycerate dehydrogenase (PHGDH), the rate-limiting enzyme in this pathway, and restricts the diversion of glycolytic intermediates into the pentose phosphate pathway, though its precise regulation of this pathway appears context-dependent [16]. These coordinated actions on multiple metabolic pathways position p53 as a central integrator of carbon metabolism, with its loss creating a permissive environment for metabolic reprogramming essential for tumor progression.
Table 1: Key Metabolic Regulators Under p53 Control
| Metabolic Process | p53 Target | Regulation by p53 | Functional Consequence |
|---|---|---|---|
| Glucose Uptake | GLUT1/GLUT3/GLUT4 | Downregulation | Reduced glucose import |
| Glycolysis | HK2 | Suppression via miRNAs | Decreased glucose phosphorylation |
| Glycolytic Flux | TIGAR | Upregulation | Reduced fructose-2,6-bisphosphate, suppressed glycolysis |
| Lactate Production | LDHA | Inhibition | Decreased conversion of pyruvate to lactate |
| Lactate Export | MCT1 | Repression | Reduced lactate secretion |
| Mitochondrial Respiration | COX2 | Upregulation | Enhanced electron transport chain function |
| Pyruvate Entry to TCA | PDH | Enhanced activity | Increased acetyl-CoA production |
| Glutamine Metabolism | GLS2 | Transactivation | Enhanced glutamate production, ROS protection |
| Serine Synthesis | PHGDH | Repression | Inhibition of de novo serine production |
PTEN Loss and its Metabolic Implications
PI3K-AKT-mTOR Axis Dysregulation
PTEN (Phosphatase and Tensin Homolog) functions as a critical negative regulator of the PI3K-AKT-mTOR signaling pathway, and its loss represents one of the most common oncogenic events across human cancers. PTEN dephosphorylates phosphatidylinositol (3,4,5)-trisphosphate (PIP3), thereby antagonizing PI3K activity and suppressing downstream AKT and mTOR signaling [17]. Inactivation of PTEN leads to constitutive activation of this pathway, driving profound metabolic reprogramming that supports tumor growth. The hyperactivated AKT stimulates glucose uptake through increased cell surface localization of GLUT1, enhances glycolytic flux via phosphorylation and activation of glycolytic enzymes, and promotes protein synthesis through mTORC1 activation [17]. This PTEN-deficient metabolic state is characterized by enhanced glucose utilization, increased lipid synthesis, and resistance to metabolic stress, creating an environment conducive to rapid proliferation.
Context-Dependent Effects and Synthetic Lethality
Recent research has revealed that the metabolic consequences of PTEN inactivation are context-dependent and influenced by factors such as tissue origin and age. Interestingly, a 2025 study demonstrated that aging represses the impact of PTEN inactivation in oncogenic KRAS-driven lung tumorigenesis, with PTEN deficiency reducing signatures of aging in both cancer cells and the tumor microenvironment [17]. This age-dependent effect highlights the complex interplay between tumor suppressors and organismal physiology in shaping metabolic phenotypes. From a therapeutic perspective, PTEN loss creates metabolic vulnerabilities that can be exploited through synthetic lethal approaches. PTEN-deficient cells show heightened sensitivity to inhibitors targeting glycolysis, fatty acid synthesis, and glutamine metabolism, reflecting their dependence on these pathways to support anabolic growth under conditions of constitutive PI3K-AKT-mTOR signaling [18] [17].
LKB1-AMPK Signaling Axis in Metabolic Homeostasis
Master Regulation of Cellular Energetics
Liver Kinase B1 (LKB1, also known as STK11) functions as a master regulator of cellular metabolism and energy homeostasis, primarily through its role as an upstream kinase for AMP-activated protein kinase (AMPK) and related kinases. LKB1 forms a complex with the pseudokinase STE20-related adapter (STRAD) and the scaffolding protein MO25, which enables LKB1 to phosphorylate and activate AMPK in response to energy stress [19] [20]. Activated AMPK then orchestrates a metabolic switch from anabolic to catabolic processes, inhibiting mTORC1 signaling, inducing autophagy, and enhancing fatty acid oxidation to restore cellular ATP levels [19]. This LKB1-AMPK axis serves as a critical cellular energy sensor, constraining tumor growth under conditions of nutrient limitation and metabolic stress. Beyond AMPK, LKB1 activates a family of 14 kinases including microtubule affinity-regulating kinases (MARKs) and salt-inducible kinases (SIKs), expanding its regulatory reach to cell polarity, transcription, and additional metabolic processes [20].
Tissue-Specific Metabolic Consequences
The metabolic impact of LKB1 loss exhibits significant tissue specificity, reflecting different metabolic dependencies across tumor types. In prostate cancer, where LKB1 is frequently inactivated through non-genetic mechanisms including epigenetic silencing, LKB1 loss drives metabolic reprogramming, lineage plasticity, and treatment resistance through dysregulation of AMPK/mTOR, STAT3, and Hedgehog signaling pathways [19]. This loss enhances glycolytic capacity and promotes lipid synthesis while impairing oxidative metabolism. In hepatocellular carcinoma, LKB1-AMPK signaling maintains metabolic balance, with loss of this pathway contributing to enhanced glycolysis, suppressed fatty acid oxidation, and increased de novo lipogenesis [21]. The tissue-specific manifestations of LKB1 loss highlight the importance of context in determining metabolic outcomes, while the consistent theme across tissues is a shift toward aerobic glycolysis and biosynthetic processes that support rapid cell proliferation.
Table 2: Comparative Metabolic Profiles of Tumor Suppressor Inactivation
| Tumor Suppressor | Primary Signaling Pathway | Glucose Metabolism | Mitochondrial Function | Lipid Metabolism | Amino Acid Metabolism |
|---|---|---|---|---|---|
| p53 | p53 transcriptional network | Suppressed glycolysis, enhanced OXPHOS | Enhanced TCA cycle, respiratory chain | Context-dependent regulation | Glutaminase 2 activation, serine synthesis suppression |
| PTEN | PI3K-AKT-mTOR | Enhanced glycolysis, glucose uptake | Variable effects | Enhanced lipid synthesis | Enhanced amino acid uptake and utilization |
| LKB1 | LKB1-AMPK | Enhanced glycolysis under loss | Impaired OXPHOS under loss | Enhanced lipid synthesis under loss | Altered utilization under energy stress |
Interplay and Cooperative Inactivation in Tumor Progression
Synergistic Effects on Metabolic Rewiring
The simultaneous inactivation of multiple tumor suppressors creates synergistic effects that drive more profound metabolic reprogramming and aggressive tumor phenotypes. Combined loss of LKB1 and PTEN in prostate cancer accelerates tumor progression, enhances metastatic potential, and influences lineage plasticity through coordinated dysregulation of complementary metabolic pathways [19]. Similarly, the interplay between p53 and PTEN inactivation creates a metabolic environment permissive for extreme glycolytic dependency and resistance to metabolic stress. These cooperative interactions enable tumors to maximize nutrient uptake and utilization while avoiding the metabolic checkpoints that would normally constrain proliferation under conditions of oncogenic stress. The convergence of tumor suppressor losses creates a metabolic landscape characterized by enhanced glucose and glutamine utilization, increased nucleotide and lipid synthesis, and adaptability to fluctuating nutrient conditions within the tumor microenvironment.
Impact on Tumor Microenvironment and Immune Metabolism
The metabolic consequences of tumor suppressor inactivation extend beyond cancer cells to influence the broader tumor microenvironment and anti-tumor immunity. p53 loss leads to increased lactate production and acidification of the tumor microenvironment, which inhibits immune cell function and promotes immune evasion [16]. LKB1 deficiency in cancer cells has been shown to modulate immune cell infiltration and inflammatory cytokine production, contributing to an immunosuppressive microenvironment [19]. PTEN loss activates AKT signaling not only in tumor cells but also in associated stromal cells, promoting angiogenesis and metabolic coupling that supports tumor growth [17]. These effects on the tumor microenvironment highlight how tumor suppressor inactivation creates self-reinforcing ecosystems that support cancer progression through both cell-intrinsic and cell-extrinsic metabolic mechanisms.
Experimental Approaches and Methodologies
Genetic Engineering and Metabolic Flux Analysis
Elucidating the metabolic consequences of tumor suppressor inactivation requires sophisticated experimental approaches that quantify metabolic fluxes and dependencies. The 2025 Nature Aging study on aging and KRAS-driven lung tumorigenesis employed a barcoded lentiviral vector encoding Cre recombinase (Lenti-BC/Cre) in genetically engineered mice with KrasLSL-G12D/+ and Rosa26LSL-Tomato alleles to precisely quantify tumor initiation and growth in young versus aged mice [17]. Tumor barcoding coupled with high-throughput sequencing (Tuba-seq) enabled precise quantification of clonal tumor size and number, revealing that aging represses both tumor initiation and subsequent growth [17]. For assessing metabolic pathway utilization, stable isotope tracing with 2-13C-glucose has been employed to quantify flux through glycolysis, the TCA cycle, and the pentose phosphate pathway in p53-deficient cells, confirming suppressed oxidative PPP flux upon p53 restoration [16]. Seahorse extracellular flux analyzers provide real-time measurements of glycolytic rate and oxygen consumption rate, enabling functional assessment of the Warburg effect in tumor suppressor-deficient cells.
Transcriptomic and Proteomic Profiling
Advanced omics technologies enable comprehensive characterization of the molecular consequences of tumor suppressor inactivation. Single-cell RNA sequencing of neoplastic cells from young and aged mice in the KRAS-driven lung cancer model revealed that age-related transcriptomic changes persist through oncogenic transformation, and that PTEN inactivation reduces signatures of aging in both cancer cells and the tumor microenvironment [17]. Proteomic analysis through the Clinical Proteomic Tumor Analysis Consortium (CPTAC) has been used to validate protein expression changes in purine metabolism enzymes across multiple cancer types, connecting tumor suppressor loss with nucleotide metabolic dysregulation [22]. Integration of these multi-omics datasets provides a systems-level view of how tumor suppressor inactivation rewires cellular metabolism across transcriptional, translational, and functional levels.
Table 3: Essential Research Reagents for Investigating Tumor Suppressor Metabolic Functions
| Reagent/Category | Specific Examples | Research Application | Key Functions |
|---|---|---|---|
| Genetic Engineering Tools | Lenti-Cre vectors, CRISPR/Cas9 systems, Barcoded lentiviruses | Tumor suppressor knockout/inactivation, Lineage tracing, In vivo modeling | Precise gene editing, Clonal tracking, Multiplexed functional screening |
| Metabolic Probes and Assays | 2-13C-glucose, Seahorse XF Analyzers, LC-MS/MS | Metabolic flux analysis, Bioenergetic profiling, Metabolite quantification | Pathway flux measurement, OCR/ECAR determination, Absolute metabolite quantification |
| Animal Models | Genetically engineered mice (GEMMs), Patient-derived xenografts (PDX) | In vivo tumor studies, Therapeutic testing, Microenvironment analysis | Physiological context, Stromal interactions, Therapeutic response modeling |
| Signaling Biomarkers | Phospho-AKT, phospho-S6, phospho-AMPK antibodies | Pathway activity assessment, Treatment response monitoring | Immunoblotting, Immunohistochemistry, Flow cytometry |
| Database Resources | TCGA, CPTAC, Metabolomic databases | Pan-cancer analysis, Multi-omics integration, Biomarker discovery | Dataset mining, Correlation analysis, Validation cohorts |
Research Reagent Solutions
The investigation of tumor suppressor functions in metabolic regulation relies on specialized research reagents and tools. Genetically engineered mouse models with conditional alleles (e.g., KrasLSL-G12D/+, Rosa26LSL-Tomato) enable precise, tissue-specific tumor suppressor inactivation and lineage tracing [17]. For multiplexed functional screening, pooled lentiviral CRISPR/Cas9 systems with barcoding enable parallel assessment of multiple tumor suppressor genes and their combinatorial effects [17]. Metabolic flux analysis requires stable isotope-labeled nutrients (e.g., 2-13C-glucose, 13C-glutamine) coupled with mass spectrometry detection to quantify pathway utilization [16] [18]. For real-time bioenergetic profiling, Seahorse XF Analyzers measure oxygen consumption rate (OCR) and extracellular acidification rate (ECAR) as functional indicators of oxidative phosphorylation and glycolysis, respectively [16]. Advanced omics resources include The Cancer Genome Atlas (TCGA) for transcriptomic data across cancer types, Clinical Proteomic Tumor Analysis Consortium (CPTAC) for protein expression validation, and metabolomic databases for pathway mapping [22] [21]. Machine learning algorithms applied to these multi-omics datasets can identify prognostic signatures related to tumor suppressor pathways, such as the LKB1-AMPK signaling related gene signature (LRS) developed for hepatocellular carcinoma prognosis prediction [21].
Visualization of Signaling Pathways and Metabolic Networks
Integrated Tumor Suppressor Network in Metabolic Regulation
Metabolic Reprogramming Following Tumor Suppressor Loss
Experimental Workflow for Investigating Metabolic Dysregulation
Concluding Perspectives and Therapeutic Implications
The inactivation of p53, PTEN, and LKB1 represents a common oncogenic strategy to achieve metabolic reprogramming essential for tumor growth and progression. These tumor suppressors function as integrated nodes in a complex network that balances energy production with biosynthetic demands, and their loss creates a permissive environment for the establishment of cancer-specific metabolic phenotypes. From a therapeutic perspective, the metabolic vulnerabilities created by tumor suppressor inactivation present promising opportunities for targeted intervention. Synthetic lethal approaches that exploit the specific metabolic dependencies of p53-, PTEN-, or LKB1-deficient cells are currently being explored, with inhibitors of glycolysis, glutaminolysis, and lipid metabolism showing particular promise in preclinical models [16] [18] [23]. The integration of metabolic-targeted therapies with conventional treatments and immunotherapies represents a promising strategy to overcome resistance and improve patient outcomes. As our understanding of the metabolic functions of tumor suppressors continues to evolve, it will undoubtedly yield new insights into cancer biology and novel therapeutic approaches that exploit the metabolic Achilles' heels of cancer cells.
A fundamental shift in cellular metabolism is a recognized hallmark of cancer, enabling rapid tumor growth and proliferation [2] [24]. Cancer cells autonomously alter metabolic pathways to meet the heightened bioenergetic and biosynthetic demands of continuous division, a process known as metabolic reprogramming [25] [2]. Among the most documented alterations is the reprogramming of glucose metabolism, primarily characterized by the Warburg effect, or aerobic glycolysis, where cancer cells preferentially convert glucose to lactate even in the presence of sufficient oxygen [26] [25] [2]. This review provides an in-depth technical examination of glucose metabolic rewiring, focusing on the glycolytic pathway, the pentose phosphate pathway (PPP), and the critical regulatory enzymes HK2, PKM2, and LDHA, which collectively orchestrate this reprogramming to support tumorigenesis.
The Warburg Effect: Aerobic Glycolysis in Cancer
In the 1920s, Otto Warburg first observed that cancer cells tend to metabolize glucose to lactate even under normoxic conditions, a phenomenon now known as the Warburg effect or aerobic glycolysis [26] [25]. While normal cells typically process glucose to pyruvate via glycolysis and then rely on mitochondrial oxidative phosphorylation (OXPHOS) for efficient ATP production, cancer cells favor glycolysis followed by lactate fermentation [26] [2].
This metabolic shift provides several advantages for cancer cells:
- Rapid ATP Generation: Although less efficient per glucose molecule, glycolysis can generate ATP at a faster rate than OXPHOS when glucose is abundant, supporting rapid proliferation [26].
- Biosynthetic Precursor Supply: Glycolytic intermediates are shunted into various biosynthetic pathways, providing ribose-5-phosphate for nucleotide synthesis, carbon skeletons for non-essential amino acid production, and glycerol for lipid membrane formation [26] [25].
- Microenvironment Manipulation: Lactate secretion acidifies the tumor microenvironment (TME), promoting immune evasion by inhibiting cytotoxic T cells and natural killer cells, while supporting the function of immunosuppressive regulatory T cells (Tregs) and myeloid-derived suppressor cells (MDSCs) [26] [25].
Table 1: Key Differences Between Normal Glucose Metabolism and the Warburg Effect in Cancer Cells
| Aspect | Normal Cells | Cancer Cells (Warburg Effect) |
|---|---|---|
| Primary Metabolic Pathway | Oxidative Phosphorylation (OXPHOS) | Aerobic Glycolysis |
| ATP Yield per Glucose Molecule | High (36-38 ATP) [26] | Low (2 ATP) [26] |
| Final Electron Acceptor | Oxygen (in mitochondria) | Pyruvate (converted to lactate) |
| Lactate Production | Low (mainly under hypoxia) | High (even under normoxia) |
| Biosynthetic Output | Lower | Higher (intermediates diverted to anabolism) |
| Tumor Microenvironment | Neutral pH | Acidic (due to lactate secretion) |
Core Pathways in Glucose Metabolic Rewiring
Glycolytic Pathway
Glycolysis involves a ten-step series of reactions in the cytoplasm that convert glucose into pyruvate, generating a net yield of 2 ATP molecules and 2 NADH molecules per glucose molecule [27]. In cancer cells, this pathway is significantly enhanced through the overexpression of glucose transporters (GLUTs, especially GLUT1) and key rate-limiting enzymes [2] [27]. The intermediates of glycolysis not only lead to pyruvate but also feed into other crucial pathways, such as the PPP and serine synthesis pathway, to meet the biosynthetic demands of proliferating cells [27].
Pentose Phosphate Pathway (PPP)
The PPP is a critical branching pathway from glycolysis that serves two primary functions in cancer cells: redox homeostasis and nucleotide biosynthesis [28] [25]. It diverges from glycolysis at glucose-6-phosphate (G-6-P).
- Oxidative Phase: This phase, regulated by the rate-limiting enzyme glucose-6-phosphate dehydrogenase (G6PD), generates NADPH, a crucial reducing equivalent that helps neutralize reactive oxygen species (ROS) and supports reductive biosynthesis [25] [2]. A recent study on Malignant Peripheral Nerve Sheath Tumors (MPNST) highlighted the PPP as a critical metabolic pathway for helping cancer cells survive oxidative stress and drive tumor growth [28].
- Non-oxidative Phase: This phase produces ribose-5-phosphate (R5P), an essential precursor for the de novo synthesis of nucleotides (purines and pyrimidines) required for DNA and RNA replication in rapidly dividing cells [25] [2].
Oncogenic signaling pathways, such as those involving NRF2 and MYC, tightly regulate the PPP to ensure a steady supply of NADPH and R5P [25].
The following diagram illustrates the interconnection between glycolysis, the Pentose Phosphate Pathway (PPP), and the key regulatory enzymes HK2, PKM2, and LDHA in cancer cells:
Key Regulatory Enzymes: Molecular Mechanisms and Functions
Hexokinase 2 (HK2)
HK2 catalyzes the first committed and rate-limiting step of glycolysis, phosphorylating glucose to form glucose-6-phosphate (G-6-P), thus trapping glucose within the cell [25] [27].
- Role in Cancer: HK2 is frequently overexpressed in cancer cells and is associated with poor prognosis [25]. It serves as a key node in metabolic reprogramming, with its expression being transcriptionally activated by oncogenes like c-MYC, RAS, and HIF-1α [25]. In KRAS-driven lung cancer, HK2 is also activated by the transcription factor BACH1, linking glycolytic metabolism to metastatic spread [25].
- Non-Metabolic Functions: Beyond its glycolytic role, HK2 can localize to the mitochondria, where it binds to voltage-dependent anion channels (VDAC). This interaction helps to inhibit apoptosis and promote cell survival [27]. Recent research also implicates HK2 in histone lactylation, which can influence gene expression related to thrombosis in acute myeloid leukemia [29].
Pyruvate Kinase M2 (PKM2)
PKM2 catalyzes the final rate-limiting step of glycolysis, transferring a phosphate group from phosphoenolpyruvate (PEP) to ADP, thereby generating pyruvate and ATP [30].
- Metabolic Regulation and the Warburg Effect: PKM2 exists in a dynamic equilibrium between a highly active tetrameric form and a less active dimeric form. Cancer cells predominantly express the dimeric form (PKM2), which reduces glycolytic flux and allows for the accumulation of upstream intermediates that can be diverted into biosynthetic pathways, such as the PPP and serine synthesis [30]. This preference for the low-activity dimer is a key driver of the Warburg effect.
- Non-Metabolic (Moonlighting) Functions: PKM2 can translocate to the nucleus under stress conditions, where it functions as a protein kinase [30]. In the nucleus, it phosphorylates various targets, including histone H3, which leads to the activation of genes like c-Myc and Cyclin D1, thereby linking metabolic activity to cell proliferation [30]. PKM2 also interacts with HIF-1α to upregulate the expression of glycolytic genes, including GLUT1 and LDHA, creating a positive feedback loop that reinforces aerobic glycolysis [30] [25]. Furthermore, PKM2 modulates the immune microenvironment by upregulating PD-L1 expression through STAT3 phosphorylation, facilitating immune evasion [30].
Lactate Dehydrogenase A (LDHA)
LDHA is responsible for the final step of aerobic glycolysis, converting pyruvate into lactate while regenerating NAD⁺ from NADH. This regeneration is essential for maintaining the high flux of glycolysis [25].
- Role in Cancer: LDHA is a direct transcriptional target of the oncogene MYC and is upregulated in many cancers [25]. Its high activity ensures the continuous conversion of pyruvate to lactate, which is a hallmark of the Warburg effect. The lactate produced is exported out of the cell, acidifying the TME and promoting immunosuppression, angiogenesis, and metastasis [26] [25].
- Therapeutic Implications: Because of its critical role in sustaining glycolysis, LDHA is a prominent therapeutic target. Inhibiting LDHA can force a metabolic shift, potentially reducing lactate production and impairing tumor growth [31].
Table 2: Key Regulatory Enzymes in Glucose Metabolic Rewiring
| Enzyme | Reaction Catalyzed | Primary Function in Cancer | Regulatory Mechanisms | Non-Metabolic Functions |
|---|---|---|---|---|
| HK2 | Glucose → Glucose-6-Phosphate | First rate-limiting step; traps glucose in cell | Upregulated by c-MYC, RAS, HIF-1α [25] | Mitochondrial binding to inhibit apoptosis [27]; involvement in histone modification [29] |
| PKM2 | Phosphoenolpyruvate → Pyruvate | Final rate-limiting step; favors glycolytic intermediate accumulation | Post-translational modifications (e.g., phosphorylation, acetylation) [30] | Nuclear translocation; protein kinase activity; gene transcription regulation; immune modulation [30] |
| LDHA | Pyruvate → Lactate | Regenerates NAD⁺ to sustain glycolytic flux | Transcriptional target of MYC and HIF-1α [25] | Major contributor to acidic tumor microenvironment [26] [25] |
Experimental Approaches for Investigating Metabolic Rewiring
Studying metabolic rewiring requires a combination of genomic, metabolomic, and functional assays. Below is a detailed methodology for a comprehensive investigation, integrating key experiments cited in the literature.
In Vitro Metabolic Flux Analysis
Aim: To quantitatively measure the flux of nutrients through glycolysis and the PPP in live cancer cells.
Protocol:
- Cell Culture: Utilize cancer cell lines with genetic perturbations (e.g., HK2, PKM2, or LDHA knockdown/overexpression) and appropriate controls.
- Stable Isotope Tracing:
- Culture cells in media containing stable isotope-labeled substrates, such as U-¹³C-glucose [28].
- Allow the cells to metabolize the labeled substrate for a set period (e.g., 15 minutes to several hours).
- Metabolite Extraction and Analysis:
- Rapidly quench metabolism using cold methanol.
- Extract intracellular metabolites.
- Analyze the extracts using Liquid Chromatography-Mass Spectrometry (LC-MS) to determine the incorporation of ¹³C into glycolytic intermediates (e.g., lactate, PEP) and PPP products (e.g., ribose-5-phosphate) [28].
- Data Interpretation: The labeling patterns provide direct evidence of pathway activity. For instance, a high fraction of M+3 lactate indicates strong glycolytic flux, while specific labeling in ribose-5-phosphate reveals PPP activity.
Gene Editing and Functional Assays
Aim: To establish the necessity of specific metabolic enzymes for tumor cell survival and growth.
Protocol:
- Generation of Knockout Models:
- Use CRISPR/Cas9 gene editing to create isogenic cell lines with knockouts of target genes (e.g., G6PD, HK2) [28].
- Validate knockout efficiency via Western blotting and genomic sequencing.
- Phenotypic Assays:
- Proliferation and Viability: Measure cell growth and viability over time using assays like MTT or CellTiter-Glo.
- Clonogenic Assay: Assess the long-term reproductive potential of cells by seeding a low density and allowing colonies to form over 1-2 weeks.
- Apoptosis Assay: Use flow cytometry with Annexin V/propidium iodide staining to quantify cell death.
- In Vivo Validation:
Investigating Enzyme Localization and Protein-Protein Interactions
Aim: To elucidate the non-metabolic functions of enzymes like PKM2.
Protocol:
- Subcellular Fractionation:
- Separate nuclear and cytoplasmic protein fractions from cancer cells.
- Analyze the distribution of PKM2 in each fraction via Western blotting (using Lamin B and Tubulin as nuclear and cytoplasmic markers, respectively).
- Immunoprecipitation (IP) and Mass Spectrometry:
- Use an anti-PKM2 antibody to immunoprecipitate PKM2 and its binding partners from nuclear and cytoplasmic lysates.
- Identify co-precipitated proteins using mass spectrometry to discover novel interaction partners (e.g., transcription factors, histones) [30].
- Chromatin Immunoprecipitation (ChIP):
- For nuclear PKM2, perform ChIP with an anti-PKM2 antibody to identify specific genomic loci where PKM2 binds, such as promoters of cell cycle genes like CCND1 (Cyclin D1) [30].
The following workflow summarizes the multi-faceted experimental strategy for dissecting metabolic rewiring:
Table 3: Key Research Reagent Solutions for Investigating Metabolic Rewiring
| Reagent / Resource | Function/Application | Example Use Case |
|---|---|---|
| U-¹³C-Glucose | Stable isotope-labeled tracer for metabolic flux analysis | Tracing the fate of glucose carbons into lactate (glycolysis) or ribose-5-phosphate (PPP) via LC-MS [28] |
| 2-Deoxy-D-Glucose (2-DG) | Competitive HK2 inhibitor; glucose analog | Suppressing glycolysis to study its dependence for tumor cell viability and to probe HK2 function [25] |
| 6-Aminonicotinamide (6-AN) | Inhibitor of G6PD, the rate-limiting enzyme of the PPP | Blocking the oxidative PPP to assess its role in redox balance (NADPH production) and nucleotide synthesis [25] |
| CRISPR/Cas9 Gene Editing System | Precise genomic knockout of metabolic genes | Generating isogenic cell lines lacking HK2, PKM2, or G6PD to study essentiality and metabolic adaptations [28] |
| Anti-PKM2 (Phospho-Tyrosine) Antibody | Detection of specific post-translational modifications | Studying the regulation of PKM2 activity (e.g., phosphorylation at Y105 stabilizes the low-activity dimer) [30] |
| LDHA Inhibitors | Pharmacological blockade of lactate production | Forcing metabolic reprogramming, reducing microenvironment acidity, and assessing impact on tumor growth and immunity [31] |
The rewiring of glucose metabolism, driven by the key regulatory enzymes HK2, PKM2, and LDHA, is a cornerstone of cancer biology. The interplay between glycolysis and the PPP provides cancer cells with the energy, biosynthetic precursors, and redox balance necessary for rapid proliferation and survival in harsh microenvironments. A deep technical understanding of these pathways and their multifunctional regulators is paramount. The experimental frameworks and tools detailed in this guide provide a roadmap for researchers and drug development professionals to further dissect these complex mechanisms and translate these insights into novel therapeutic strategies that target the metabolic vulnerabilities of cancer.
Metabolic reprogramming is a established hallmark of cancer, enabling rapidly proliferating tumor cells to meet their heightened demands for energy, biosynthetic precursors, and redox homeostasis [32] [33]. While aerobic glycolysis (the Warburg effect) has long been recognized as a pivotal metabolic adaptation in cancer cells, the reprogramming of lipid metabolism has more recently emerged as an equally critical facilitator of tumor growth and survival [34] [32]. Cancer cells exhibit profound alterations in their lipid metabolism, particularly in two core processes: de novo lipogenesis (DNL) and fatty acid oxidation (FAO) [32] [35]. These pathways are co-opted to support the constant demand for membrane biogenesis, energy production, and the generation of signaling molecules [32].
Beyond their roles in bulk tumor cells, these lipid metabolic pathways are especially critical for the maintenance and function of cancer stem cells (CSCs) [34] [36]. CSCs, a subpopulation with self-renewal capacity and enhanced resistance to therapy, demonstrate a pronounced dependency on rewired lipid metabolism to sustain their stem-like properties, including self-renewal, differentiation, and metastatic potential [34]. The interplay between lipid metabolism and oncogenic signaling pathways creates a feed-forward loop that perpetuates the malignant state, making these pathways promising yet complex therapeutic targets [34] [32]. This review provides an in-depth examination of the alterations in DNL and FAO within cancer cells, their signaling roles, and the experimental approaches used to investigate them.
De Novo Lipogenesis: From Carbohydrates to Lipids
The Biochemical Pathway and Its Key Enzymes
De novo lipogenesis (DNL) is the metabolic process through which carbohydrates from the circulation are converted into fatty acids, primarily for the synthesis of triglycerides and complex lipid molecules like phospholipids [37]. This pathway becomes hyperactive in many cancers, allowing tumor cells to generate their own lipid supply regardless of extracellular availability [32] [35]. The process involves a series of tightly coordinated enzymatic reactions, as illustrated in the diagram below.
Diagram 1: The core enzymatic pathway of De Novo Lipogenesis. Key regulatory enzymes are highlighted in yellow. ACLY, ATP-citrate lyase; ACC1, Acetyl-CoA carboxylase 1; FASN, Fatty acid synthase; SCD1, Stearoyl-CoA desaturase 1; ELOVL, Fatty acid elongase.
The process begins with the conversion of glucose-derived mitochondrial citrate into cytosolic acetyl-CoA by ATP-citrate lyase (ACLY) [37] [33]. This acetyl-CoA is then carboxylated to malonyl-CoA by acetyl-CoA carboxylase 1 (ACC1), the first committed and rate-limiting step in fatty acid synthesis [35] [37]. The multi-functional enzyme complex fatty acid synthase (FASN) then catalyzes the sequential condensation of one acetyl-CoA and multiple malonyl-CoA units to produce the 16-carbon saturated fatty acid, palmitate [37]. Finally, palmitate can be elongated by enzymes like ELOVL and desaturated by stearoyl-CoA desaturase (SCD1) to generate a diverse pool of monounsaturated fatty acids (MUFAs) and other complex lipids essential for membrane fluidity and function [34] [33].
Regulatory Mechanisms and Oncogenic Drivers
The expression and activity of lipogenic enzymes are predominantly regulated at the transcriptional level. Key transcription factors include Sterol Regulatory Element-Binding Protein 1 (SREBP-1) and Carbohydrate Response Element-Binding Protein (ChREBP), which are activated by insulin and high glucose levels, respectively [37]. These factors coordinate the expression of a suite of lipogenic genes, including ACLY, ACC, and FASN.
This lipogenic program is often hyperactivated by common oncogenic signaling pathways. The PI3K-AKT-mTOR axis, a frequently dysregulated pathway in cancer, strongly promotes DNL by enhancing the nuclear translocation and activity of SREBP-1 [32]. This creates a direct molecular link between oncogenic signaling and metabolic reprogramming, fueling tumor growth.
Table 1: Key Enzymes in De Novo Lipogenesis and Their Roles in Cancer
| Enzyme | Reaction Catalyzed | Cancer Association |
|---|---|---|
| ACLY [35] [33] | Converts citrate to cytosolic acetyl-CoA | Upregulated in glioblastoma, colorectal, breast, lung, and hepatocellular carcinomas; promotes proliferation and stemness. |
| ACC1 [35] | Carboxylates acetyl-CoA to malonyl-CoA | Highly expressed in breast, gastric, liver, and prostate cancers; correlated with reduced patient survival. |
| FASN [34] [35] | Synthesizes palmitate from acetyl-CoA and malonyl-CoA | Upregulated in early-stage lung, prostate, and breast cancers; expression increases with progression. |
| SCD1 [34] [33] | Desaturates saturated fatty acids to MUFAs | Critical for maintaining membrane fluidity; inhibition increases susceptibility to lipid peroxidation and ferroptosis. |
Fatty Acid Oxidation: Lipids as an Energy Source
The FAO Process and Its Integration with Energy Metabolism
When energy is scarce, cancer cells can shift to catabolizing lipids through fatty acid oxidation (FAO), also known as β-oxidation. FAO is a critical mitochondrial process that breaks down fatty acids to generate ATP, NADPH, and metabolic intermediates, serving as a vital energy source under metabolic stress such as hypoxia or nutrient deprivation [32] [36]. The diagram below outlines the sequential steps of FAO and its integration into central energy metabolism.
Diagram 2: The pathway of Fatty Acid Uptake and Oxidation. Key transporters and the rate-limiting enzyme are highlighted in green. CD36, Cluster of Differentiation 36; FABP, Fatty Acid-Binding Protein; CPT1A, Carnitine Palmitoyltransferase 1A; TCA, Tricarboxylic Acid.
The process begins with the uptake of exogenous free fatty acids from the tumor microenvironment, a step frequently mediated by transporters such as CD36 and fatty acid-binding proteins (FABPs) [32] [35]. Once inside the cell, fatty acids are activated to acyl-CoAs. The rate-limiting step of FAO is the transport of these long-chain acyl-CoAs into the mitochondria, which is facilitated by carnitine palmitoyltransferase 1A (CPT1A) [35] [33]. Inside the mitochondrial matrix, the acyl-CoAs undergo β-oxidation, a cyclic process that sequentially cleaves two-carbon units in the form of acetyl-CoA. This acetyl-CoA then enters the tricarboxylic acid (TCA) cycle to drive the electron transport chain for ATP production [32]. Furthermore, the process generates reducing equivalents like NADPH, which helps to mitigate oxidative stress—a feature particularly important for the survival of CSCs [32] [36].
The Strategic Role of Lipid Droplets and FAO in Cancer
Cancer cells often exhibit a remarkable ability to store excess fatty acids in cytoplasmic organelles called lipid droplets (LDs) in the form of triglycerides [32]. These LDs are not merely passive storage depots; they function as dynamic energy reservoirs that can be rapidly mobilized through lipolysis to fuel FAO when needed [32] [36]. This metabolic flexibility is crucial during periods of high energy demand or environmental stress, such as the metastatic cascade. The role of FAO is particularly pronounced in CSCs of certain cancer types. For example, leukemic stem cells and a subpopulation of dormant pancreatic cancer cells have been shown to rely heavily on oxidative phosphorylation, for which FAO serves as a key substrate [34] [36].
Table 2: Key Components of Fatty Acid Uptake and Oxidation in Cancer
| Component | Function | Cancer Association |
|---|---|---|
| CD36 [32] [35] | Fatty acid translocase; facilitates exogenous FA uptake. | High expression correlated with poor prognosis in breast, ovarian, gastric, and prostate cancers; promotes metastasis. |
| FABPpm [32] | Plasma membrane fatty acid-binding protein. | Overexpressed in tumors; facilitates FA uptake. |
| CPT1A [35] [36] | Rate-limiting enzyme for mitochondrial FA import. | Essential for FAO; supports CSC survival, redox balance, and therapy resistance. |
| Lipid Droplets [32] [36] | Dynamic organelles for triglyceride storage. | Accumulation provides energy reserve for metastasis; protects against lipotoxicity and oxidative stress. |
Signaling Roles of Lipids in Cancer
Beyond their fundamental roles as membrane building blocks and energy sources, lipids and their intermediates function as potent signaling molecules that directly influence oncogenic pathways and CSC maintenance.
- Membrane Fluidity and Rafts: The shift toward monounsaturated fatty acids (MUFAs), catalyzed by SCD1, increases membrane fluidity, which facilitates processes essential for metastasis, such as membrane budding, vesicle trafficking, and cell motility [34]. Furthermore, lipids like cholesterol are critical components of lipid rafts—specialized membrane microdomains that concentrate and organize signaling receptors. Many oncogenic signaling pathways, including Hedgehog, Notch, and Wnt, are modulated through their association with these lipid rafts [34].
- Oncogenic Signaling Modulation: There is a bidirectional relationship between lipid metabolism and oncogenic signaling. The PI3K-AKT-mTOR pathway, as mentioned, drives DNL. Conversely, lipid metabolites can themselves influence signaling. For instance, phosphatidylinositol phosphates (PIPs) are essential lipid second messengers that regulate cell growth, survival, and proliferation. Cancer cells can hijack these signals, as demonstrated by recent research targeting PLEKHA proteins, which bind to PIPs to promote melanoma and bone cancer growth [38].
- Supporting the CSC Niche: CSCs rely on a distinct lipid metabolism to maintain their properties. A comparison of lipidomic profiles reveals that CSCs contain more abundant unsaturated lipids and require more MUFAs than their non-stem counterparts in cancers like ovarian cancer and glioblastoma [34]. This lipid signature not only supports membrane biosynthesis for rapidly dividing cells but also protects CSCs from oxidative damage by reducing the susceptibility of their membranes to lipid peroxidation [34] [36].
Experimental Analysis of Lipid Metabolism
Investigating lipid metabolism requires a combination of tracer methodologies, functional assays, and pharmacological inhibition to unravel the complexities of lipid synthesis, uptake, and catabolism.
Methodologies for Investigating DNL and FAO
A common approach to directly measure the rate of DNL involves the use of stable isotope tracers [37]. In this method, cells or animal models are fed deuterated water (D2O) or labeled precursors like 13C-glucose or 13C-acetate. The incorporation of the heavy isotopes (2H or 13C) into newly synthesized fatty acids is then quantified using mass spectrometry, providing a direct readout of lipogenic flux [37]. Similarly, to study FAO, labeled fatty acids (e.g., 3H- or 14C-palmitate) are administered to cells, and the production of 3H2O or 14CO2 (the breakdown products of β-oxidation) is measured.
Functional assays are equally important. The secretion of triglycerides and cholesterol esters into the culture medium can be quantified using enzymatic or colorimetric kits to assess overall lipid output. Furthermore, the formation and turnover of lipid droplets can be visualized and quantified through staining with lipophilic fluorescent dyes such as Nile Red or BODIPY, followed by flow cytometry or fluorescence microscopy [32].
Pharmacological and Genetic Intervention Strategies
A key strategy to establish the functional importance of a specific metabolic pathway is to inhibit it and observe the phenotypic consequences. The table below lists essential research reagents used to dissect lipid metabolism in pre-clinical cancer models.
Table 3: The Scientist's Toolkit: Key Reagents for Lipid Metabolism Research
| Reagent / Tool | Category | Primary Function / Target | Example Application |
|---|---|---|---|
13C-Glucose / 13C-Acetate [37] |
Stable Isotope Tracer | Substrate for tracing de novo lipogenesis. | Tracing carbon flux from glucose into newly synthesized fatty acids via GC-MS. |
3H-Palmitate [32] |
Radiolabeled Substrate | Substrate for measuring fatty acid oxidation. | Measuring the rate of β-oxidation by quantifying 3H2O release. |
| BODIPY 493/503 [32] | Fluorescent Dye | Selective staining of neutral lipids in lipid droplets. | Visualizing and quantifying lipid droplet content via flow cytometry or confocal microscopy. |
| FASN Inhibitors (e.g., TVB-3664) [35] | Small Molecule Inhibitor | Inhibits fatty acid synthase (FASN). | Assessing the impact of blocking de novo lipogenesis on cancer cell proliferation and stemness. |
| CPT1A Inhibitors (e.g., Etomoxir) [36] | Small Molecule Inhibitor | Inhibits carnitine palmitoyltransferase 1A (CPT1A). | Investigating the role of fatty acid oxidation in cancer cell survival under metabolic stress. |
| NF1/NF14 [38] | Small Molecule Inhibitor | Targets PLEKHA family PH domains, disrupting PIP signaling. | Testing the effect of blocking specific lipid-protein interactions on cancer cell apoptosis. |
| siRNA/shRNA [32] [35] | Genetic Tool | Knocks down expression of specific metabolic genes (e.g., ACLY, ACC, CD36). | Validating the specific role of a single enzyme or transporter in lipid metabolism. |
The experimental workflow typically involves treating cancer cells or patient-derived organoids with these inhibitors or genetic tools, followed by functional assays. Key readouts include cell viability, apoptosis (e.g., via caspase-3/7 activation), sphere-forming capacity (to assess CSC self-renewal), and invasion/migration [38]. For instance, the novel compound NF14, a prodrug that inhibits PLEKHA proteins, was shown to disrupt membrane localization of its target and trigger apoptosis in melanoma and bone cancer cell lines, providing a proof-of-concept for targeting lipid signaling domains [38].
The reprogramming of de novo lipogenesis and fatty acid oxidation represents a fundamental metabolic adaptation that fuels the aggressive and resilient nature of cancer cells, particularly within the CSC compartment. The interplay between these pathways, oncogenic signaling, and the tumor microenvironment creates a robust network that supports tumor initiation, progression, and therapy resistance. The nuanced understanding of these alterations, enabled by sophisticated experimental methodologies, is paving the way for novel therapeutic strategies. Targeting key nodes in lipid metabolism, such as FASN, ACLY, or CPT1A, either alone or in rational combination with chemotherapy, immunotherapy, or targeted agents, holds significant promise for disrupting the metabolic vulnerabilities of cancer and improving patient outcomes. Future research will continue to decipher the complex lipidomic signatures of different tumor subtypes and identify the most context-specific and effective therapeutic windows for intervention.
Metabolic reprogramming is a established hallmark of cancer cells, enabling them to support rapid proliferation, survival, and adaptation to stressful tumor microenvironments [39] [2]. This reprogramming encompasses profound alterations in the metabolism of glucose, amino acids, and lipids. Among these, the dependencies on specific amino acids – particularly glutamine, serine, and glycine – are especially critical. These amino acids feed into interconnected metabolic pathways that fuel bioenergetics, buffer oxidative stress, and provide essential building blocks for macromolecular synthesis [40] [41]. Glutaminolysis (the catabolism of glutamine) and the serine/glycine/one-carbon network are frequently hyperactivated in cancers, making them compelling targets for therapeutic intervention [39] [42] [41]. This whitepaper provides an in-depth technical analysis of these pathways, their interconnections, their role in nucleotide synthesis, and the associated experimental approaches for their investigation.
Glutaminolysis: A Core Metabolic Hub in Cancer
Glutamine is the most abundant amino acid in human plasma and serves as a central nutrient for many cancer cells [43] [44]. Glutaminolysis describes the process of converting glutamine into tricarboxylic acid (TCA) cycle metabolites to replenish (anaplerosis) and sustain mitochondrial function [39]. The first and rate-limiting step is the deamination of glutamine to glutamate, catalyzed by the enzyme glutaminase (GLS) [39] [43]. Two genes encode glutaminases: GLS1 (kidney-type) and GLS2 (liver-type). The GLS1 isoforms, particularly the splice variant GAC (glutaminase C), are frequently upregulated in cancers and exhibit higher enzymatic activity [39]. Glutamate is then further metabolized primarily via two routes:
- Entry into the TCA cycle: Glutamate is converted to α-ketoglutarate (α-KG) by glutamate dehydrogenase (GLUD1) or aminotransferases, thereby fueling the TCA cycle for energy production and biosynthesis [43].
- Biosynthesis of other molecules: Glutamate serves as a nitrogen donor for the synthesis of non-essential amino acids (e.g., alanine, aspartate) and is a precursor for the major antioxidant, glutathione (GSH) [39] [43].
citation:8 illustrates the process of glutamine catabolism in tumor cells, highlighting the entry through specific transporters and the key enzymatic steps leading to TCA cycle intermediates and biosynthesis.
Regulation by Oncogenic Signaling
The expression and activity of the glutaminolytic pathway are tightly controlled by major oncogenes and tumor suppressors:
- c-MYC: This master regulator promotes glutamine uptake by upregulating glutamine transporters (e.g., SLC1A5, SLC38A5) and enhances its catabolism by repressing microRNAs (miR-23a/b) that inhibit GLS1 translation [39] [43] [45].
- KRAS: Oncogenic KRAS drives glutamine metabolism by upregulating key enzymes, including glutaminase and the transaminases GOT1 and GPT2, which support a reductive carboxylation pathway for lipid synthesis [43].
- p53: The tumor suppressor p53 and its family member p73 can activate the expression of GLS2, linking it to the cellular response to metabolic stress. The role of GLS2 appears context-specific, acting as a tumor suppressor in some cancers (e.g., liver) while being associated with poor prognosis in others (e.g., triple-negative breast cancer) [39] [43].
Quantitative Data on Glutaminolysis
Table 1: Key Enzymes and Transporters in Glutaminolysis
| Component | Gene | Function | Regulation in Cancer | Therapeutic Inhibitor Examples |
|---|---|---|---|---|
| Glutaminase 1 (GAC) | GLS1 | Rate-limiting conversion of Gln to Glu | Upregulated by c-MYC, KRAS | CB-839 (Telaglenastat), BPTES |
| Glutaminase 2 | GLS2 | Conversion of Gln to Glu | Context-dependent; often repressed | Sparred by BPTES |
| Glutamate Dehydrogenase 1 | GLUD1 | Converts Glu to α-KG for TCA cycle | Overexpressed in many cancers | R162, EGCG |
| ASCT2 (Neutral AA Transporter) | SLC1A5 | Primary glutamine transporter | Highly expressed in solid tumors | V-9302, L-γ-glutamyl-p-nitroanilide |
| SNAT5 | SLC38A5 | Transporter for Gln, Ser, Gly, Met | Upregulated in cancers | Under investigation |
| LAT1 | SLC7A5 | Exchanges intracellular Gln for extracellular Leu | Highly expressed; links Gln to mTOR | JPH203, BCH |
The Serine/Glycine/One-Carbon Metabolic Network
The serine/glycine synthesis and one-carbon metabolism pathway is a crucial anabolic branch of glycolysis, providing essential precursors for nucleotides, lipids, and redox maintenance [40] [41]. A significant fraction (∼10%) of the glycolytic intermediate 3-phosphoglycerate (3-PG) is diverted into the serine synthesis pathway (SSP) [40]. The SSP involves three sequential enzymatic reactions:
- PHGDH: Phosphoglycerate dehydrogenase oxidizes 3-PG to 3-phosphohydroxypyruvate.
- PSAT1: Phosphoserine aminotransferase aminates 3-phosphohydroxypyruvate to 3-phosphoserine, using glutamate as the nitrogen donor and generating α-KG.
- PSPH: Phosphoserine phosphatase dephosphorylates 3-phosphoserine to produce serine [40] [41].
Serine can be converted to glycine by serine hydroxymethyltransferase (SHMT1/2), simultaneously generating a one-carbon unit bound to folate. These one-carbon units are then shuttled through a cyclic metabolic network (one-carbon metabolism) that includes the folate and methionine cycles. This network is critical for de novo nucleotide synthesis (providing carbons for purine rings and methyl groups for thymidylate) and for maintaining epigenetic status via S-adenosylmethionine (SAM)-dependent methylation [40] [41].
Regulation and Oncogenic Drivers
The SSP is activated under nutrient stress and by key transcription factors:
- ATF4: A central stress-response transcription factor that directly upregulates the expression of PHGDH, PSAT1, and PSPH under amino acid starvation or ER stress [41].
- c-MYC: Drives the expression of SSP enzymes, facilitating glutathione production and nucleic acid synthesis, which are essential for cell survival under nutrient deprivation [45].
- p53 & p73: Help cells cope with serine starvation by promoting cell cycle arrest and channeling serine towards glutathione synthesis, thereby maintaining redox balance [40].
- NRF2: Activates the SSP via ATF4 to support glutathione and nucleotide production, enhancing antioxidant capacity [41].
Table 2: Key Enzymes in Serine/Glycine/One-Carbon Metabolism
| Component | Gene | Function | Regulation in Cancer | Therapeutic Targeting |
|---|---|---|---|---|
| Phosphoglycerate Dehydrogenase | PHGDH | First committed step of SSP | Amplified in breast cancer, melanoma | Preclinical inhibitors (e.g., CBR-5884) |
| Phosphoserine Aminotransferase 1 | PSAT1 | Second enzyme of SSP | Upregulated in NSCLC, CRC; poor prognosis | -- |
| Phosphoserine Phosphatase | PSPH | Final enzyme of SSP | Overexpression linked to poor prognosis in HCC | -- |
| Serine Hydroxymethyltransferase 1/2 | SHMT1/2 | Converts Ser to Gly, generates 5,10-CH2-THF | Upregulated; SHMT2 often mitochondrial | -- |
| Methylene-Tetrahydrofolate Dehydrogenase | MTHFD2 | Mitochondrial 1C metabolism enzyme | Highly expressed in many cancers | Preclinical inhibitors |
Nucleotide Synthesis: The Converging Point
The glutaminolysis and serine/glycine pathways are indispensable for de novo nucleotide synthesis, supplying both carbon and nitrogen atoms required for purine and pyrimidine rings [40] [44].
- Purine Synthesis: Requires contributions from multiple amino acids.
- Pyrimidine Synthesis: Also relies heavily on these pathways.
- Glutamine provides the nitrogen for the amine group of cytidine and one nitrogen for the ring.
- Aspartate contributes the entire pyrimidine ring backbone (carbon and nitrogen atoms) [44].
- dTMP Synthesis: The one-carbon units derived from the serine/glycine pathway via SHMT and carried by folate are essential for the conversion of dUMP to dTMP (thymidylate), a critical step for DNA replication and repair [40] [41].
The high demand for nucleotides in proliferating cancer cells creates a strong dependency on these upstream amino acid pathways, making them vulnerable to metabolic disruption.
Experimental Approaches and Methodologies
Studying these metabolic pathways requires a combination of genetic, pharmacological, and analytical techniques.
Key Experimental Protocols
1. Assessing Glutamine Dependence In Vitro:
- Method: Culture cancer cells in glutamine-free media supplemented with dialyzed fetal bovine serum (FBS). Cell viability and proliferation are monitored over 72-96 hours using assays like ATP-based luminescence (CellTiter-Glo) or resazurin reduction (AlamarBlue). Apoptosis can be measured concurrently via flow cytometry for Annexin V/PI staining.
- Application: Identifies "glutamine-addicted" cell lines. This phenotype can be further validated by rescuing cell death with the cell-permeable α-KG analog, dimethyl-αKG [43].
2. Tracing Metabolic Flux with Stable Isotopes:
- Method: Cells are cultured in media containing 13C- or 15N-labeled nutrients (e.g., U-13C-Glutamine, 3-13C-Serine). After a defined incubation period, metabolites are extracted and analyzed by Liquid Chromatography-Mass Spectrometry (LC-MS). The mass isotopomer distribution (MID) of TCA cycle intermediates (from glutamine tracers) or nucleotides/GSH (from serine tracers) reveals the quantitative contribution of the nutrient to specific metabolic pools.
- Application: Determines the activity of glutaminolysis (e.g., contribution to TCA cycle anaplerosis) and the flux through the SSP into one-carbon metabolism and nucleotides [39] [40].
3. Genetic Knockdown/Knockout of Metabolic Enzymes:
- Method: Utilize siRNA, shRNA, or CRISPR/Cas9 to deplete key enzymes (e.g., GLS1, PHGDH). The functional consequences are assessed by measuring proliferation, clonogenic potential, and metabolite levels (e.g., intracellular glutamate, GSH/GSSG ratio, nucleotide triphosphates) via LC-MS.
- Application: Establishes the essentiality of a specific enzyme for a given cancer model and helps map metabolic vulnerabilities [40] [41].
4. In Vivo Targeting with Small Molecule Inhibitors:
- Method: Mouse xenograft or syngeneic models are treated with inhibitors (e.g., CB-839 for GLS1). Tumor growth is monitored, and tumors are harvested for analysis. This can include immunohistochemistry for proliferation (Ki-67) and cell death (TUNEL), as well as metabolomic profiling to confirm on-target engagement.
- Application: Evaluates the therapeutic efficacy and tolerability of targeting these pathways in a physiologically relevant context [43].
The Scientist's Toolkit: Key Research Reagents
Table 3: Essential Reagents for Investigating Amino Acid Dependency
| Reagent / Tool | Function / Application | Example Product / Assay |
|---|---|---|
| CB-839 (Telaglenastat) | Selective, allosteric inhibitor of GLS1. Used to probe glutamine dependence in vitro and in vivo. | MedChemExpress (HY-12248) |
| BPTES | Potent, selective allosteric inhibitor of GLS1; useful for in vitro studies. | Cayman Chemical (14026) |
| Stable Isotope Tracers | Enable flux analysis to map pathway utilization. | U-13C5-Glutamine; 3-13C-Serine |
| Glutamine/Gluamate Assay Kit | Colorimetric/Fluorometric measurement of glutaminolysis activity. | BioVision (K556) |
| GSH/GSSG Detection Kit | Quantifies the ratio of reduced/oxidized glutathione to assess redox state. | Cayman Chemical (703002) |
| CellTiter-Glo / MTS Assay | Measures cell viability/proliferation based on ATP content or metabolic activity. | Promega |
| siRNA/shRNA Libraries | For targeted knockdown of metabolic genes (e.g., PHGDH, PSAT1, SHMT2). | Dharmacon, Sigma-Aldrich |
Pathway Visualization
The following diagrams, generated using Graphviz DOT language, illustrate the core metabolic pathways and their interconnections.
Diagram 1: Core Pathways of Glutaminolysis and Serine Synthesis
Diagram 2: Key Experimental Workflow for Metabolic Analysis
The tumor microenvironment (TME) is an ensemble of non-tumor cells comprising fibroblasts, immune cells, and endothelial cells, alongside various secretory factors that collectively form a pro-tumorigenic cocoon around tumor cells [46]. A hallmark of this microenvironment is metabolic reprogramming, a fundamental adaptive process where both cancer and stromal cells alter their metabolic pathways to support tumor growth, survival, and evasion of therapy [2] [46]. This reprogramming fuels the rapidly proliferating cancer cells and plays a significant role in suppressing immune attacks and fostering resistance to treatments [8] [46].
The TME is characterized by harsh conditions, including dysfunctional vascularization, which leads to impaired perfusion and hypoxia (low oxygen tension) [47]. Furthermore, the high metabolic activity of cancer cells results in nutrient depletion and the accumulation of waste products like lactate, creating an acidic environment [47] [48] [49]. These conditions—hypoxia, nutrient scarcity, and acidosis—impose intense metabolic stress on all cells within the TME, driving a complex web of metabolic interactions, including competition and symbiotic exchanges, that ultimately shape the fate of the tumor [47] [50] [46].
Core Metabolic Characteristics of the TME
Hypoxia and Aerobic Glycolysis
Hypoxia is a key microenvironmental factor that influences a tumor's growth and aggressiveness [2]. Oxygen concentration influences a cell's tendency toward specific metabolic pathways, impacting its proliferation and invasiveness [2]. This hypoxic state is primarily orchestrated by the Hypoxia-Inducible Factor 1 (HIF-1), a transcriptional regulator that triggers profound metabolic shifts [8] [48].
A primary consequence of HIF-1 activation is the promotion of aerobic glycolysis, known as the Warburg effect, where cells metabolize glucose to lactate even in the presence of adequate oxygen [2] [8] [46]. This shift from efficient oxidative phosphorylation (OXPHOS) is less efficient for energy (ATP) production. However, it provides crucial advantages for a rapidly dividing cell: it quickly generates ATP and produces metabolic intermediates that support biosynthetic pathways for cellular building blocks like nucleotides, amino acids, and lipids [2] [23]. HIF-1 achieves this by upregulating glucose transporters (e.g., GLUT1) and key glycolytic enzymes (e.g., HK2, LDHA) while suppressing oxidative metabolism [8] [48] [46]. The resulting lactate production is exported out of cells, acidifying the TME and further reinforcing immunosuppression [48] [46].
Nutrient Competition and Scarcity
The TME is a nutrient-poor environment due to the heightened metabolic consumption by cancer cells and compromised vascular supply [47] [49]. This creates a fierce battle for resources between cancer cells and infiltrating immune cells, a competition that tumors are often well-adapted to win.
- Glucose Competition: Cancer cells overexpress glucose transporters (e.g., GLUT1), efficiently scavenging available glucose [2] [48]. This directly limits glucose availability for tumor-infiltrating lymphocytes (TILs), impairing their glycolytic capacity, mTOR activity, and production of the critical effector cytokine IFN-γ, thereby blunting anti-tumor immune responses [47] [48].
- Amino Acid Competition: Cancer cells and immunosuppressive cells dominate amino acid availability. They overexpress transporter molecules (e.g., SLC43A2 for methionine) and upregulate enzymes like indoleamine 2,3-dioxygenase (IDO), which converts essential tryptophan into immunosuppressive kynurenine [48]. This starves effector T cells and drives them toward dysfunction while promoting the differentiation of regulatory T cells (Tregs) [48].
- Lipid Metabolism: Tumors commonly enhance lipid uptake, synthesis (de novo lipogenesis), and fatty acid oxidation (FAO) [2] [48]. CD36-mediated lipid intake, for instance, has been shown to suppress cytotoxic T lymphocytes (CTLs) and dendritic cells (DCs) while promoting Tregs, thus favoring tumor progression [48].
Table 1: Key Metabolites and Their Roles in the TME
| Metabolite | Primary Source | Role/Impact in the TME | Citation |
|---|---|---|---|
| Lactate | Aerobic Glycolysis (Warburg Effect) | Acidifies TME, suppresses CTL & NK cell function, promotes M2 macrophage polarization. | [48] [46] |
| Kynurenine | Tryptophan metabolism via IDO | Drives T cell dysfunction and differentiation of immunosuppressive Tregs. | [48] |
| D-2HG (D-2-hydroxyglutarate) | Mutated Isocitrate Dehydrogenase (IDH) | Acts as an oncometabolite, altering epigenetic regulation and impairing immune cell function. | [51] |
| Succinate/Fumarate | TCA cycle (from genetic mutations or other sources) | Stabilizes HIF-1α, drives inflammatory responses, and remodels the TME. | [51] |
Metabolic Crosstalk and Symbiosis
Beyond simple competition, a more complex metabolic symbiosis exists between different cell populations within the TME. Cancer cells can actively reprogram the metabolism of stromal cells to secure a steady supply of nutrients.
A classic example is the lactate shuttle between cancer cells and cancer-associated fibroblasts (CAFs). CAFs undergo aerobic glycolysis and export lactate and pyruvate into the TME via monocarboxylate transporters (MCTs like MCT4) [46]. Cancer cells, which may have more oxidative capacity, can then import this lactate via other MCTs (e.g., MCT1) and use it as an oxidative fuel for the TCA cycle, a process known as metabolic coupling [46]. This symbiotic relationship allows cancer cells to conserve glucose for anabolic processes while utilizing a "waste" product from CAFs.
Similarly, lipid crosstalk is increasingly recognized. Myeloid cells, particularly macrophages, within the TME show enhanced lipid uptake and accumulation, which correlates with a pro-tumor phenotype and poor clinical outcomes [49]. These lipids can serve as alternative energy reservoirs or signaling molecules that support tumor growth and suppress anti-tumor immunity.
Experimental Methodologies for Investigating TME Metabolism
Studying the complex metabolic interactions within the TME requires a suite of advanced technologies that allow for high-resolution analysis of cellular phenotypes and metabolic fluxes.
Single-Cell RNA Sequencing (scRNA-seq)
Single-cell transcriptome profiling is instrumental in unraveling the metabolic heterogeneity of different immune and stromal cell populations within the TME [49]. The standard workflow involves:
- Tissue Dissociation: Tumors and adjacent normal tissues are dissociated into single-cell suspensions.
- Cell Barcoding and Sequencing: Individual cells are isolated, and their mRNAs are barcoded, reverse-transcribed into cDNA, and prepared for sequencing using platforms like 10x Genomics.
- Bioinformatic Analysis: Data quality checks and filtering are performed (e.g., excluding cells with <200 genes or >5% mitochondrial RNA). Tools like the R package
Seuratare used for normalization, principal component analysis (PCA), and unsupervised clustering to identify cell subtypes. - Metabolic Pathway Analysis: Metabolic activity is quantified using specialized R packages like
scMetabolism, which calculates enrichment scores for specific metabolic pathways (e.g., glycolysis, oxidative phosphorylation, fatty acid metabolism) across the different cell clusters [49].
This methodology revealed that in colorectal cancer, myeloid cells exhibit dominant metabolic activity, and tumor-infiltrating macrophages display robust lipid uptake and synthesis, which is linked to a pro-tumor phenotype [49].
Spatial Transcriptomics
Spatial transcriptomics bridges the gap between scRNA-seq and histology by mapping gene expression data directly onto tissue sections, preserving the spatial context of cellular interactions [49].
- Protocol: Fresh-frozen tumor tissue sections are placed on special slides containing thousands of barcoded spots. During permeabilization, mRNA from the tissue binds to these spatially barcoded oligonucleotides. The cDNA libraries are then constructed and sequenced.
- Data Integration: The gene-spot matrices are analyzed with
Seuratin R. After normalization and dimensionality reduction, the data is clustered, and signature scores for metabolic pathways can be visualized on the spatial map, revealing how metabolic activities are organized within the tumor architecture [49].
Functional Metabolic Assays
Functional validation of metabolic phenotypes is crucial. Key assays include:
- Glucose and Lipid Uptake Assays: Using fluorescent glucose analogs (e.g., 2-NBDG) or fatty acids (e.g., BODIPY FL C16) to measure nutrient uptake capacity in specific immune cell populations (e.g., T cells, macrophages) isolated from tumors versus normal tissue using flow cytometry [49].
- Mitochondrial Fitness Assessment: Utilizing fluorescent probes like Tetramethylrhodamine, Methyl Ester (TMRM) to measure mitochondrial membrane potential (ΔΨm) via flow cytometry. Studies using the MC38 mouse colon cancer model have shown that intratumoral CD8+ T cells exhibit mitochondrial depolarization, whereas macrophages maintain metabolic fitness [49].
- Reactive Oxygen Species (ROS) Measurement: Using probes like CM-H2DCFDA to measure oxidative stress levels, which has been found to be particularly high in tumor-infiltrating neutrophils [49].
The following diagram illustrates the logical workflow for integrating these multi-omics and functional assays to decipher metabolic reprogramming in the TME.
The Scientist's Toolkit: Key Research Reagents
Table 2: Essential Reagents for Investigating TME Metabolism
| Reagent / Tool | Category | Primary Function in Research | Example Application |
|---|---|---|---|
| 2-NBDG | Fluorescent Probe | A non-metabolizable glucose analog used to track and quantify cellular glucose uptake. | Measure glucose uptake in TILs vs. cancer cells via flow cytometry [49]. |
| BODIPY FL C16 | Fluorescent Probe | A fluorescently tagged fatty acid analog used to visualize and quantify lipid uptake. | Assess lipid accumulation in tumor-associated macrophages [49]. |
| TMRM | Fluorescent Dye | A cell-permeant dye that accumulates in active mitochondria based on membrane potential (ΔΨm). | Evaluate mitochondrial fitness and depolarization in CD8+ T cells [49]. |
| CM-H2DCFDA | Fluorescent Probe | A general oxidative stress indicator that becomes fluorescent upon oxidation by ROS. | Quantify reactive oxygen species (ROS) levels in different immune cell subsets [49]. |
| Seurat R Package | Bioinformatics Tool | A comprehensive toolkit for single-cell genomics data analysis, including QC, clustering, and visualization. | Identify distinct immune cell clusters and their metabolic gene signatures from scRNA-seq data [49]. |
| scMetabolism R Package | Bioinformatics Tool | A computational pipeline designed to easily quantify single-cell metabolic activity. | Calculate enrichment scores for metabolic pathways from scRNA-seq data [49]. |
| MC38 Murine Model | In Vivo Model | A widely used syngeneic mouse model of colorectal cancer with an immunocompetent background. | Study immunometabolic adaptations and test metabolic interventions in a functional TME [49]. |
Therapeutic Implications and Targeting Strategies
The metabolic vulnerabilities and interactions within the TME present attractive targets for novel anti-cancer therapies. The primary strategies involve inhibiting key metabolic pathways in cancer cells or disrupting the immunosuppressive metabolic landscape to re-energize anti-tumor immunity.
- Targeting Glucose Metabolism: Drugs like 2-deoxy-D-glucose (2-DG), a glucose analog that inhibits glycolysis, have been explored preclinically [2]. Similarly, inhibiting lactate production (LDHA inhibitors) or lactate transport (MCT inhibitors) can disrupt the lactate shuttle and acidification, potentially reversing immunosuppression [48] [46].
- Targeting Amino Acid Metabolism: IDO inhibitors aim to block the tryptophan-to-kynurenine pathway, preventing T cell suppression. Pegylated arginine deiminase (ADI-PEG 20) depletes arginine and has shown therapeutic potential [2]. Glutaminase inhibitors (e.g., targeting GLS1) seek to disrupt a crucial nitrogen and carbon source for cancer cells [8] [23].
- Combination with Immunotherapy: A promising approach is combining metabolic-targeting agents with immune checkpoint blockade (ICB). For instance, preclinical models show that PD-L1 blockade can correct the glycolytic deficit in TILs, and combining it with glutamine supplementation or glycolysis blockade can enhance anti-tumor immunity [48] [23]. This strategy aims to remodel the TME from immunosuppressive to immunopermissive.
- Natural Compounds as Metabolic Modulators: Compounds like curcumin, berberine, and epigallocatechin-3-gallate (EGCG) have demonstrated metabolic-modulatory effects in preclinical studies. They can inhibit glycolysis, suppress glutamine transporters (SLC1A5), and restore mitochondrial function, offering a less toxic, integrative approach to treatment [23].
The diagram below synthesizes the core metabolic pathways and therapeutic targeting strategies discussed in this whitepaper.
The tumor microenvironment is a metabolically dynamic and interconnected ecosystem where hypoxia, nutrient competition, and metabolic crosstalk converge to drive tumor progression and therapeutic resistance. The metabolic reprogramming of cancer cells, coupled with the rewiring of stromal and immune cell metabolism, creates a formidable barrier to effective treatment. Understanding these intricate interactions through advanced multi-omics and functional assays is paramount. Targeting these metabolic vulnerabilities—whether alone or, more effectively, in combination with established immunotherapies—represents a promising frontier in oncology. Future research must focus on translating this intricate knowledge of metabolic symbiosis and competition into clinically viable strategies that disrupt the tumor's metabolic support network and unleash the full potential of the anti-tumor immune response.
Cancer cells undergo profound metabolic reprogramming to support their rapid growth, survival, and adaptation to diverse microenvironmental conditions. This reprogramming extends beyond the classical Warburg effect (aerobic glycolysis) to encompass dynamic alterations in multiple metabolic pathways, including oxidative phosphorylation, glutaminolysis, and lipid metabolism [7]. Two fundamental concepts defining the adaptability of cancer cell metabolism are metabolic heterogeneity (the variation in metabolic preferences between different cancer cells within and between tumors) and metabolic plasticity (the ability of individual cancer cells to switch between different metabolic pathways in response to environmental cues or therapeutic challenges) [52].
Metabolic heterogeneity arises from both intrinsic factors (e.g., genetic mutations, epigenetic modifications, cell lineage) and extrinsic factors (e.g., oxygen availability, nutrient distribution, stromal interactions) [53] [54]. This heterogeneity contributes significantly to tumor aggressiveness, metastatic potential, and treatment resistance, making it a critical area of investigation for developing novel therapeutic strategies [53]. Metabolic plasticity, conversely, enables cancer cells to maintain growth and survival under fluctuating nutrient availability and metabolic stress, posing a major challenge for targeted therapies [52] [55].
Mechanisms Driving Metabolic Heterogeneity
Genetic and Epigenetic Regulation
Genetic alterations in oncogenes and tumor suppressor genes drive substantial metabolic heterogeneity by promoting cell-autonomous reprogramming. In lung adenocarcinoma, frequently mutated genes including TP53, KRAS, KEAP1, STK11, EGFR, NF1, and BRAF have all been reported to regulate metabolism [54]. The specific combination of mutations can create unique metabolic dependencies; for instance, non-small cell lung cancer (NSCLC) cells with concurrent mutations in KRAS and STK11 develop a distinct metabolomic signature of altered nitrogen metabolism and become addicted to the urea cycle enzyme carbamoyl-phosphate synthase-1 (CPS1) [54].
Epigenetic modifications—including DNA methylation, histone modifications, chromatin remodeling, and noncoding RNAs—serve as crucial regulators of metabolic gene expression without altering the DNA sequence itself [56]. For example, lactate, which accumulates in the tumor microenvironment, can induce histone lactylation, creating a feedback loop that further influences metabolic gene expression [56]. Additionally, hypermethylation of the asparagine synthetase (ASNS) gene promoter can increase sensitivity to L-asparaginase in certain cancer cells, illustrating how epigenetic changes create metabolic vulnerabilities [54].
Microenvironmental Influences
The tumor microenvironment imposes significant metabolic constraints and opportunities that foster heterogeneity. Key factors include:
- Oxygen Gradients: Hypoxic regions within tumors stabilize hypoxia-inducible factors (HIFs), which transcriptionally activate genes promoting glycolysis, angiogenesis, and autophagy [53] [7]. Hypoxia also induces reductive glutamine metabolism to support lipogenesis [53] and upregulates fatty acid uptake via CD36 to promote cell survival [53].
- Nutrient Availability: Spatial variations in nutrient access (glucose, glutamine, fatty acids) force regional metabolic adaptations. In lung cancer lesions, poorly perfused areas rely on glucose, while better-perfused regions utilize lactate [52]. Stromal cells further condition the nutrient environment; pancreatic stellate cells provide alanine and lysophosphatidylcholines to support pancreatic ductal adenocarcinoma (PDAC) growth [52].
- Metabolite Exchange: Metabolic symbiosis occurs between differently localized cancer subpopulations. For instance, hypoxic cells may export lactate, which is then utilized by oxidative cancer cells as a fuel source [53].
Table 1: Microenvironmental Factors Driving Metabolic Heterogeneity
| Factor | Metabolic Adaptation | Key Mediators | Functional Impact |
|---|---|---|---|
| Hypoxia | Glycolytic shift, reductive carboxylation, fatty acid uptake | HIF-1α/2α, SIAH2, CD36 | Survival under low oxygen, lipogenesis, metastasis |
| Nutrient Gradients | Regional substrate preference (glucose vs. lactate) | MCT1/2 transporters | Metabolic symbiosis, optimal resource utilization |
| Stromal Interaction | Nutrient transfer (alanine, lysophosphatidylcholines) | SLC38A2, SLC1A5 variants | Support for biosynthesis and growth signaling |
| Acidic pH | Reductive glutamine metabolism, drug tolerance | SIRT1, HIF2α | Adaptation to chronic acidosis, therapy resistance |
Metabolic Flexibility and Plasticity in Cancer Progression
Metabolic flexibility (the ability to utilize different nutrients) and plasticity (the ability to process the same nutrient in different ways) are hallmarks of progressive cancers [52]. During metastasis, cancer cells display remarkable metabolic adaptability, often losing flexibility in favor of specific nutrient dependencies that support particular stages of the metastatic cascade [52]. For example, inhibiting the lactate transporter MCT1 or the fatty acid transporter CD36 impairs metastasis formation without affecting primary tumor growth [52]. Furthermore, the preferred energy production pathway during metastatic outgrowth depends on the secondary site; breast cancer cells metastasizing to the lung utilize PGC-1α-dependent oxidative phosphorylation, while those colonizing the liver require glycolytic energy production [52].
Quantitative Assessment of Metabolic Heterogeneity
Advanced Imaging Technologies
Fluorescence lifetime imaging microscopy (FLIM) of the autofluorescent metabolic coenzyme NAD(P)H provides a label-free method to quantify metabolic heterogeneity at cellular resolution. NAD(P)H exists in free (short fluorescence lifetime) and protein-bound (long fluorescence lifetime) states, with the relative contributions indicating glycolytic (higher free fraction) versus oxidative (higher bound fraction) metabolism [57] [58].
A study quantifying heterogeneity in colorectal cancer models demonstrated that patient tumors exhibit significantly greater metabolic heterogeneity (wider, frequently bimodal distributions of NAD(P)H decay parameters) compared to cultured cells or mouse xenografts [58]. This heterogeneity was quantified using:
- Dispersion (D): Measuring the spread of the free NAD(P)H fraction (a1) around the median.
- Bimodality Index (BI): Identifying distinct metabolic subpopulations within a sample.
Table 2: Quantitative Metabolic Heterogeneity in Colorectal Cancer Models [58]
| Model Type | Specific Model | Free NAD(P)H (a1, %) Median ± Dispersion | Bimodality Index (BI-a1) | Interpretation |
|---|---|---|---|---|
| Cell Lines | CT26 | ~86% ± 1.67 | <1.1 | Homogeneous, highly glycolytic |
| HCT116 | ~84% ± 2.63 | <1.1 | Homogeneous, glycolytic | |
| HT29 | ~80% ± 2.96 | <1.1 | Homogeneous, intermediate | |
| CaCo2 | ~73% ± 3.41 | <1.1 | Homogeneous, more oxidative | |
| Mouse Xenografts | CT26 tumors | ~78% ± 4.86 | <1.1 | Moderately heterogeneous |
| HCT116 tumors | ~74% ± 5.21 | <1.1 | Moderately heterogeneous | |
| Human Tumors | Colorectal adenocarcinoma (Grade 2) | Wide distribution | >1.1 (bimodal) | Highly heterogeneous, distinct subpopulations |
| Colorectal adenocarcinoma (Grade 3) | Wider distribution | <1.1 | Highly heterogeneous, continuous distribution |
Spatial Analysis of Metabolic Heterogeneity
Spatial statistics applied to optical metabolic imaging (OMI) data can map the organization of metabolic subpopulations. Techniques include:
- Density-based clustering of NAD(P)H lifetime parameters to identify distinct metabolic cell populations [57].
- Proximity analysis to quantify the spatial distribution and mixing between metabolic subpopulations [57].
- Multivariate spatial autocorrelation to measure the similarity of metabolic phenotypes in neighboring cells [57].
These analyses reveal that metabolic subpopulations are not randomly distributed but exhibit structured spatial patterns influenced by treatment and the specific tumor model (e.g., xenograft vs. organoid) [57].
Experimental Models and Methodologies
In Vitro and In Vivo Model Systems
Different experimental models capture distinct aspects of metabolic heterogeneity:
- 2D Monolayer Cultures: Provide a homogenous, high-energy environment where cells are typically highly glycolytic and dependent on glucose and glutamine [55]. While technically simple, they lack architectural and mechanical context, limiting their physiological relevance.
- 3D Organotypic Cultures and Organoids: Recapitulate tissue-relevant architecture and cell-ECM interactions. Cells in these models exhibit lower energy states, reduced glycolysis, and greater metabolic plasticity, allowing them to maintain growth during glucose or amino acid deprivation [57] [55]. They show early treatment responses consistent with later tumor volume changes [57].
- In Vivo Mouse Models: Maintain the complete tumor microenvironment, including vascularization, immune cells, and stromal interactions. They display higher metabolic heterogeneity than in vitro models and are essential for validating therapeutic responses [57] [58].
Key Experimental Protocols
Protocol 1: Optical Metabolic Imaging (OMI) of Live Tumors
- Model Preparation: Generate tumor-bearing mouse models (e.g., FaDu xenografts in nude mice) or 3D tumor organoids embedded in Matrigel [57].
- Treatment Regimen: Administer therapeutics (e.g., cetuximab, cisplatin) over a defined course (e.g., 13 days for xenografts, 24 hours for organoids) [57].
- Image Acquisition:
- For in vivo imaging, anesthetize the mouse and expose the tumor [57].
- Use a two-photon microscope with time-correlated single photon counting.
- Excite NAD(P)H at 750 nm and FAD at 890 nm [57].
- Collect emission at 400–480 nm for NAD(P)H and 500–600 nm for FAD [57].
- Acquire fluorescence intensity and lifetime images (FLIM) [57].
- Data Analysis:
- Fit NAD(P)H decay curves to a biexponential model to extract the short (τ1, free) and long (τ2, protein-bound) lifetime components and their relative contributions (a1, a2) [58].
- Calculate the mean lifetime τm = (a1τ1 + a2τ2) / (a1 + a2) [57].
- Perform density-based clustering (e.g., DBSCAN) on NAD(P)H lifetime parameters to identify metabolic subpopulations [57].
- Apply spatial statistics (proximity analysis, spatial autocorrelation) to quantify heterogeneity patterns [57].
Protocol 2: Assessing Metabolic Plasticity in 3D Cultures
- 3D Culture Setup: Plate epithelial cancer cells (e.g., Caco-2, A549, MCF7) in basement membrane extract (BME) to form organotypic structures [55].
- Nutrient Deprivation: Culture organoids in glucose-free or glutamine-free medium versus complete medium [55].
- Growth Assessment: Quantify growth rates and morphological changes over several days [55].
- Energetic Profiling: Measure extracellular acidification rate (ECAR) and oxygen consumption rate (OCR) using a Seahorse Analyzer to assess glycolytic and mitochondrial function [55].
- Gene Expression Analysis: Perform RNA-sequencing to identify differentially expressed metabolic pathways between 2D and 3D cultures [55].
The Scientist's Toolkit: Essential Research Reagents
Table 3: Key Reagents for Studying Cancer Metabolic Heterogeneity
| Reagent / Tool | Function / Application | Example Use |
|---|---|---|
| NAD(P)H FLIM | Label-free imaging of metabolic state | Quantifying glycolytic vs. oxidative subpopulations in live tumors [57] [58] |
| MCT1 Inhibitors | Block lactate import | Testing lactate dependence in metastasizing cells [52] |
| CD36 Antibodies/Inhibitors | Block fatty acid uptake | Investigating role of fatty acid metabolism in metastasis [53] [52] |
| SLC38A2 Inhibitors | Block alanine transport | Targeting stroma-supported PDAC growth [52] |
| GLS-1 Inhibitors | Inhibit glutaminase | Exploiting glutamine dependence in SDH-mutant tumors [7] |
| WZB117 | GLUT1 glucose transporter inhibitor | Targeting glycolytic dependence in SDH-deficient tumors [7] |
| Basement Membrane Extract (BME) | 3D organotypic culture | Creating architecturally relevant models for plasticity studies [55] |
| Seahorse XF Analyzer | Real-time measurement of ECAR and OCR | Functional profiling of glycolytic and mitochondrial respiration [55] |
Metabolic Dynamics During Metastasis and Therapy Resistance
Metabolic Adaptations in the Metastatic Cascade
The metastatic cascade involves distinct metabolic phases, each with specific requirements and vulnerabilities [53] [52]:
Figure 1: Metabolic transitions during the metastatic cascade. Cancer cells lose metabolic flexibility during dissemination, adopting specific nutrient dependencies, before potentially regaining plasticity upon establishing metastases.
- Dissemination and Invasion: Cells undergoing epithelial-mesenchymal transition (EMT) upregulate antioxidant pathways to survive detachment (anoikis). This may involve reductive glutamine carboxylation [52] or activation of fructose bisphosphatase 1 (FBP1) to enhance NADPH production for ROS detoxification [52].
- Circulation and Survival: Disseminating cells show increased reliance on lactate uptake via MCT1 to support antioxidant defense [52] and fatty acid uptake via CD36 to boost metastatic potential [52].
- Colonization and Outgrowth: Metabolic programs at secondary sites are highly organ-specific. Breast cancer lung metastases require pyruvate uptake via MCT2 for collagen prolyl-4-hydroxylase (P4HA)-mediated ECM remodeling [52], while liver metastases may rely on extracellular creatine phosphorylation via secreted creatine kinase B (CKB) [52].
Metabolic Mechanisms of Therapy Resistance
Metabolic heterogeneity and plasticity contribute significantly to treatment failure through various mechanisms:
- Metabolic Symbiosis: Glycolytic and oxidative subpopulations exchange metabolites (e.g., lactate), allowing mutual survival under therapy [53].
- Therapy-Tolerant Persisters: Subpopulations of cancer cells adopt a dormant, metabolically quiescent state with reduced anabolic activity, escaping therapies that target proliferating cells [53].
- Mitochondrial Plasticity: Therapy-resistant cells often increase mitochondrial mass, oxidative phosphorylation, and fatty acid oxidation to survive [52] [7].
- Epigenetic Memory: Metabolic adaptations can be stabilized through epigenetic modifications, creating stable resistant subclones [56].
Therapeutic Targeting of Metabolic Heterogeneity
Strategic Approaches and Challenges
Targeting cancer metabolism therapeutically requires consideration of both convergent (shared) and divergent (heterogeneous) metabolic phenotypes [54]. Key strategies include:
- Synthetic Lethality: Exploiting context-specific metabolic vulnerabilities created by specific mutations. Examples include targeting heme oxygenase-1 (HO-1) in fumarate hydratase (FH)-deficient tumors [7] or glutaminase in SDH-mutant cells [7].
- Combination Therapies: Simultaneously targeting multiple metabolic pathways or combining metabolic inhibitors with conventional therapies to overcome plasticity-driven resistance [7].
- Stromal Co-Targeting: Disrupting tumor-stroma metabolic symbiosis (e.g., targeting pancreatic stellate cell-derived alanine) to impair cancer cell nutrition [52].
Major challenges include the remarkable metabolic plasticity of cancer cells, which enables rapid adaptation to single-agent therapies, and the difficulty in achieving a sufficient therapeutic index given that many metabolic pathways are also essential in normal cells [7].
Emerging Therapeutic Targets
Figure 2: Key metabolic inhibitors and their targets in cancer cells. Combination approaches targeting multiple nodes simultaneously may overcome metabolic plasticity.
Promising metabolic targets currently under investigation include:
- Glucose Metabolism: GLUT1 inhibitors (WZB117), hexokinase inhibitors, MCT1/2 inhibitors, and LDH inhibitors [7].
- Amino Acid Metabolism: Glutaminase inhibitors (e.g., CB-839), asparaginase for ASNS-low tumors, and serine/glycine pathway inhibitors [54] [7].
- Lipid Metabolism: Fatty acid synthase (FASN) inhibitors, CD36-targeting antibodies, and inhibitors of desaturases (SCD1/FADS2) [53] [7].
- Mitochondrial Metabolism: Complex I inhibitors, CPT1A inhibitors (fatty acid oxidation), and targeting of TCA cycle enzymes in mutation-specific contexts [7].
Metabolic heterogeneity and plasticity are fundamental adaptations that enable cancer progression, metastasis, and therapy resistance. Understanding the genetic, epigenetic, and microenvironmental drivers of these processes is essential for developing effective therapeutic strategies. Future research directions should focus on comprehensive spatial metabolomic characterization of human tumors, developing more physiologically relevant models that recapitulate tumor architecture and mechanics, and designing intelligent combination therapies that simultaneously target multiple metabolic pathways or exploit synthetic lethal interactions. Overcoming the challenges posed by cancer metabolic adaptability will require moving beyond static metabolic profiling to dynamic assessment of metabolic flux and plasticity in relevant microenvironments.
Investigative Approaches and Therapeutic Targeting Strategies
Metabolic reprogramming is a established hallmark of cancer cells, enabling them to support rapid proliferation, survive in harsh microenvironments, and resist therapeutic interventions. [2] This rewiring of core metabolic pathways—including glucose, amino acid, lipid, and nucleotide metabolism—distinguishes cancerous cells from their normal counterparts. [2] The foundational observation of Otto Warburg, that tumor cells preferentially undergo glycolysis even in the presence of sufficient oxygen, has evolved into a sophisticated understanding of complex metabolic adaptations that fuel tumor growth. [59] Advanced metabolic technologies are now critical for dissecting this complexity, offering unprecedented resolution to study metabolic heterogeneity, pathway fluxes, and spatial organization within tumors. These technologies, including single-cell metabolomics, metabolic flux analysis, and spatial profiling, are providing researchers and drug development professionals with the tools to identify novel biomarkers and therapeutic targets in the ongoing battle against cancer. [59]
Core Analytical Technologies and Platforms
The investigation of cancer metabolism relies on a suite of complementary analytical platforms, each with distinct strengths and applications. The table below summarizes the major technologies and their key characteristics.
Table 1: Key Analytical Platforms in Cancer Metabolomics
| Technology | Key Principle | Spatial Resolution | Key Advantages | Primary Applications in Cancer Research |
|---|---|---|---|---|
| Mass Spectrometry (MS) Imaging [59] | Ionization of molecules from tissue surfaces for mass analysis | Single-cell to multicellular | Label-free, can detect 100+ metabolites, preserves spatial information | Mapping metabolite distribution in tumor tissues [60] |
| Nuclear Magnetic Resonance (NMR) Spectroscopy [59] | Absorption of radiofrequency radiation by atomic nuclei in a magnetic field | Bulk tissue analysis | Non-destructive, highly quantitative, minimal sample preparation | Tracking metabolic changes in patient biofluids (e.g., serum, urine) [59] |
| Optical Metabolic Imaging (OMI) [61] | Detection of autofluorescence from metabolic co-enzymes (NADH, FAD) | Single-cell | Label-free, live-cell imaging, high temporal resolution | Monitoring functional metabolism of immune cells (e.g., CAR-T) in tumors [61] |
| Stable Isotope Tracing [6] | Using 13C- or 15N-labeled nutrients to track metabolic pathways | Bulk tissue to near-single-cell (with MSI) | Reveals pathway activity and flux, not just abundance | Quantifying nutrient contributions to TCA cycle, nucleotide synthesis in tumors [6] |
Single-Cell Metabolomics: Revealing Metabolic Heterogeneity
Methodologies and Workflows
Single-cell metabolomics (SCM) has emerged as a powerful tool for uncovering the profound metabolic heterogeneity between and within tumors, which is often masked in bulk analyses. [62] Advanced SCM methods like HT SpaceM combine cell preparation on custom slides with small-molecule matrix-assisted laser desorption ionization (MALDI) imaging mass spectrometry, enabling high-throughput profiling of over 140,000 cells from 132 samples. [60] This method can detect over 100 small-molecule metabolites per cell with high reproducibility. [60] An alternative approach, dynamic single-cell metabolomics, integrates stable isotope tracing with a high-throughput organic mass cytometry device. [62] This system couples cylindrical electrospray ionization mass spectrometry (CyESI-MS) to Dean flow-based single-cell dispersion, allowing for untargeted isotope tracing at the single-cell level to reveal not just metabolite concentrations but also metabolic activities and flux. [62]
The following diagram illustrates the core workflow of a dynamic single-cell metabolomics experiment:
Applications in Cancer Research
This technology has been pivotal in dissecting cell-cell interactions within the tumor microenvironment (TME). By directly co-culturing tumor cells and macrophages without separation labels, researchers have used dynamic SCM to reveal intricate metabolic alterations in both cell types and identify versatile polarization subtypes of tumor-associated macrophages (TAMs) based on their metabolic signatures. [62] This level of heterogeneity analysis is crucial for understanding how different TAM subpopulations can either support or inhibit tumor growth. Furthermore, SCM has demonstrated sensitivity in detecting delicate metabolic alterations induced by metabolic inhibitors, such as 2-deoxyglucose (2-DG), within single cells—changes that are often not reflected in concentration analyses alone. [62]
Metabolic Flux Analysis: Quantifying Pathway Activity
Stable Isotope Tracing and Infusion Protocols
Metabolic flux analysis moves beyond static metabolite measurements to quantify the dynamic flow of nutrients through metabolic pathways. This is primarily achieved through stable isotope tracing, where nutrients (e.g., glucose, glutamine) labeled with heavy isotopes (e.g., ¹³C, ¹⁵N) are administered to biological systems, and their incorporation into downstream metabolites is tracked over time. [6] In human studies, patients with high-grade gliomas undergoing surgical resection have been infused with uniformly labeled ¹³C-glucose ([U-¹³C]glucose) for the duration of the craniotomy (typically ~3 hours). [6] Arterial blood is monitored to ensure circulating [U-¹³C]glucose reaches a steady state (20-40% of total glucose). [6] In mouse models of glioblastoma, similar protocols achieve higher enrichment (~50%). [6] Tissues (tumor and adjacent cortex) are then collected and analyzed using liquid chromatography-mass spectrometry (LC-MS) to determine the labeling patterns in intermediates of glycolysis, the TCA cycle, nucleotides, and other pathways.
Key Findings in Brain Cancer Metabolism
This powerful approach has revealed profound metabolic rewiring in glioblastoma (GBM). While both the healthy human cortex and GBM take up glucose robustly, they channel it for截然不同的 purposes. [6] The cortex uses glucose carbons to fuel physiological processes, primarily TCA cycle oxidation and the synthesis of neurotransmitters (glutamate, GABA, aspartate). [6] In contrast, gliomas dramatically downregulate these pathways, instead repurposing glucose-derived carbons to generate nucleotides and other macromolecules needed for proliferation and invasion. [6] GBMs achieve this by scavenging alternative carbon sources, such as amino acids from the environment, to supplement their biomass production. [6] This metabolic plasticity also presents a therapeutic vulnerability; studies in mice have shown that dietary amino acid restriction can shift GBM metabolism, slow tumor growth, and augment the efficacy of standard-of-care treatments like temozolomide. [6]
The diagram below summarizes the divergent metabolic fates of glucose in the healthy cortex versus glioblastoma:
Spatial Profiling: Mapping the Metabolic Tumor Microenvironment
Technological Advances in Spatial Resolution
The metabolic landscape of a tumor is not uniform but varies dramatically across different spatial niches. Spatial profiling technologies bridge the gap between single-cell omics and tissue histology by preserving the geographical context of molecular data. Visium HD is a cutting-edge spatial transcriptomic technology that provides whole-transcriptome analysis at single-cell-scale resolution. [63] Its capture array consists of a continuous lawn of 2 x 2 µm barcoded oligonucleotides, a massive increase over previous 55-µm spot-based arrays. [63] For analysis, data is typically binned at 8-µm or 16-µm resolution, allowing for precise mapping of gene expression to specific morphological features in formalin-fixed paraffin-embedded (FFPE) tissue sections. [63] This high resolution, combined with computational cell type deconvolution, enables the creation of highly refined maps of the cellular composition and metabolic interactions within the TME. [63]
Dissecting the Tumor Immune Microenvironment
The application of Visium HD in colorectal cancer (CRC) has revealed the complex spatial organization of immune cells. Researchers have identified transcriptomically distinct macrophage subpopulations localized to different spatial niches, each with potential pro-tumor or anti-tumor functions mediated through specific interactions with tumor and T cells. [63] Furthermore, by analyzing the immediate periphery (within 50 µm) of the tumor, this technology can pinpoint the location of clonally expanded T cell populations and the specific macrophage-containing niches in which they reside. [63] Such insights are invaluable for developing immunotherapies, as the functional state of immune cells is often dictated by their precise location within the TME. Integrated spatial transcriptomic profiling across 23 cancers is also being used to construct pan-cancer atlases of structures like tumor-associated tertiary lymphoid structures (TA-TLSs), revealing cellular dynamics and spatial organization under different maturation states, which are linked to patient prognosis. [64]
The Scientist's Toolkit: Essential Research Reagents and Materials
Successful implementation of the described advanced metabolic technologies requires a carefully selected set of reagents, tools, and materials. The following table details key components of the research toolkit.
Table 2: Essential Research Reagent Solutions for Advanced Metabolic Studies
| Reagent/Material | Function/Description | Application Example |
|---|---|---|
| Stable Isotope Tracers (e.g., [U-¹³C]-Glucose) [6] | Nutrients with atoms replaced by heavy isotopes (¹³C, ¹⁵N) to track metabolic fate. | Infused in patients or mice to trace glucose utilization in tumors vs. normal tissue. [6] |
| Custom Glass Slides for SCM [60] | Specially treated slides for cell adherence and compatibility with imaging MS. | Used in HT SpaceM for high-throughput single-cell metabolomics across many samples. [60] |
| CytAssist Instrument [63] | Instrument that controls reagent flow to ensure accurate spatial transfer of analytes from tissue to capture array. | Critical for maintaining spatial fidelity in Visium HD spatial transcriptomics. [63] |
| Single-Cell Dispersion Device [62] | Microfluidic Dean flow-based device for high-throughput delivery of single cells to the mass spectrometer. | Enables dynamic single-cell metabolomics via organic mass cytometry. [62] |
| Metabolite Standards & Databases (e.g., HMDB) [62] | Chemical standards and curated databases used to annotate and identify metabolites from mass spectrometry data. | Essential for untargeted metabolomics and single-cell metabolite annotation. [62] |
| CRISPR CAS-9 Tools [61] | Genomic editing technology for generating genetically modified cell models (e.g., CAR T cells). | Used to engineer CAR T cells for studying metabolism in the tumor microenvironment. [61] |
Detailed Experimental Protocols
Protocol: Dynamic Single-Cell Metabolomics with Isotope Tracing
This protocol is adapted from the universal system for dynamic metabolomics. [62]
- Cell Culture and Tracer Application: Culture cells of interest (e.g., tumor cells co-cultured with macrophages). Replace the standard culture medium with a medium containing the stable isotope tracer (e.g., [U-¹³C]-glucose at a physiologically relevant concentration, typically 10-25 mM). Incubate for a predetermined time to allow for isotope incorporation.
- Single-Cell Suspension Preparation: Gently detach adherent cells using a non-enzymatic cell dissociation buffer to minimize metabolic stress. Wash the cell pellet with a cold, isotonic buffer (e.g., PBS) to remove extracellular metabolites. Resuspend the cells at an optimal density (e.g., 0.5-1 x 10⁶ cells/mL) to ensure single-cell events.
- High-Throughput Data Acquisition: Load the cell suspension into the organic mass cytometry device. This system couples a Dean flow-based single-cell dispenser to a CyESI-MS. The sheath liquid should contain an internal standard (e.g., 2-Chloro-L-phenylalanin) for signal normalization. Acquire data in full-scan mode with a high sampling rate to capture the transient signal of each single-cell pulse.
- Data Processing and Isotope Tracing Analysis:
- Single-Cell Peak Selection: Use a custom Python program to identify characteristic pulse peaks for each single cell based on total ion current (TIC) variation.
- Metabolite Annotation: Match the accurate mass of detected peaks (typically with a tolerance of < 10 ppm) to metabolite databases (e.g., HMDB) and validate with in-house LC-MS/MS standards.
- Isotopologue Extraction: Construct an isotopologue library for each annotated metabolite. Extract the intensities of all potential isotopologue peaks (M0, M+1, M+2, ...) from the single-cell data.
- Natural Abundance Correction: Apply an algorithm to correct for the natural abundance of heavy isotopes.
- Calculate Labeling Enrichment (LE): For each metabolite in every single cell, compute the LE, which represents the fraction of total metabolite pool that is labeled.
- Downstream Analysis: Perform mass isotopomer distribution (MID) analysis, plot heterogeneous LE distributions across single cells, and use pathway analysis to infer alterations in metabolic network activities.
Protocol: In Vivo Metabolic Flux Analysis in Mouse Brain Tumors
This protocol is based on studies infusing ¹³C-glucose into mouse models of glioblastoma. [6]
- Animal Model and Tracer Infusion: Establish orthotopic patient-derived GBM models in immunocompromised mice. Upon tumor establishment, cannulate the jugular vein or tail vein for infusion. After a period of recovery, infuse [U-¹³C]-glucose (e.g., a bolus followed by constant infusion) for a defined period (e.g., 30 minutes to several hours). Monitor arterial blood glucose and lactate labeling to ensure isotopic steady-state is reached.
- Tissue Collection and Processing: At the end of the infusion, rapidly euthanize the animal and extract the brain. Immediately dissect the tumor and adjacent cortical tissue. Snap-freeze the tissues in liquid nitrogen to quench all metabolic activity.
- Metabolite Extraction: Homogenize the frozen tissue in a cold methanol-water solvent system (e.g., 80% methanol) using a bead mill or rotor-stator homogenizer. Centrifuge to remove protein precipitates and collect the supernatant containing the metabolites.
- LC-MS Analysis and Flux Modeling:
- Analyze the metabolite extracts using a high-resolution LC-MS platform.
- Quantify the abundance and ¹³C-labeling patterns (isotopologues) of key metabolites from central carbon metabolism (glycolytic intermediates, TCA cycle intermediates, nucleotides, amino acids).
- Input the labeling data into a metabolic flux model (e.g., COMPLETE-MFA) to calculate absolute rates (fluxes) of metabolic reactions in vivo, comparing the tumor tissue to the healthy cortex.
The integration of single-cell metabolomics, metabolic flux analysis, and spatial profiling is ushering in a new era of precision in cancer metabolism research. These technologies are moving the field beyond bulk averages to a nuanced understanding of metabolic heterogeneity, dynamic pathway fluxes, and the spatially organized interplay between cancer cells and the tumor microenvironment. [59] [62] [6] For researchers and drug developers, these tools offer an unprecedented opportunity to identify novel metabolic vulnerabilities, discover biomarkers with high prognostic value, and develop more effective combination therapies that can overcome drug resistance. [59] [2] As these technologies continue to evolve, becoming more accessible and integrated with other omics layers, they hold the promise of transforming our fundamental understanding of cancer and paving the way for the next generation of metabolism-targeted therapeutics.
Cancer metabolism is characterized by profound alterations in metabolic pathways that distinguish cancer cells from normal cells [2]. This metabolic reprogramming supports the rapidly proliferating cells' high demands for biomolecules, including glucose, amino acids, lipids, and nucleotides, along with increased energy requirements for adenosine triphosphate (ATP) production [2]. The extensively studied Warburg effect (aerobic glycolysis) exemplifies this reprogramming, where cancer cells preferentially utilize glycolysis for energy production even in the presence of adequate oxygen [2] [65]. This metabolic shift, while less efficient for ATP generation, provides rapid energy and critical biosynthetic intermediates that sustain cancer growth, proliferation, and survival [2].
Beyond glycolysis, cancer cells exhibit modifications across multiple metabolic domains, including upregulated amino acid transport and glutaminolysis, increased lipid intake and synthesis, and enhanced nucleotide production [2]. These adaptations are driven by genetic mutations in key regulatory genes and oncogenic proteins that orchestrate a complex metabolic network [65]. The inherent plasticity of cancer metabolism enables tumors to evolve resistance to conventional therapies, presenting a significant challenge in oncology [2]. Computational modeling has emerged as a powerful approach to decipher this complexity, offering predictive frameworks to simulate disease processes, identify metabolic vulnerabilities, and inform therapeutic development [66] [4].
Computational Approaches in Cancer Metabolism
Computational oncology addresses cancer's dynamic and heterogeneous nature through modeling techniques that capture nonlinear processes across genetic, cellular, tissue, and systemic scales [66]. These approaches can be broadly categorized into mechanistic models grounded in biological principles and data-driven methods that uncover hidden patterns in complex datasets [66].
- Multiscale Modeling: Bridges molecular mechanisms with tissue-level behaviors to provide comprehensive perspectives on tumor evolution and therapeutic response [66].
- Agent-Based Models: Represent cell-cell interactions and heterogeneity, capturing spatial organization within tumors [66] [67].
- Hybrid Modeling Strategies: Combine discrete and continuous approaches to more accurately capture mechanical and biological interactions [66].
- Network-Based Models: Map intracellular signaling pathways and predict therapeutic outcomes [66].
- Digital Twins: Create computational counterparts to living systems for individualized simulations supporting diagnosis, treatment planning, and monitoring [66].
These computational frameworks enable researchers to investigate oncological phenomena at unprecedented resolution, moving the field toward more personalized and adaptive interventions [66].
Modeling Metabolic Networks and Phenotypes
Regulatory Network of Cancer Metabolism
Advanced computational models integrate the uptake, transportation, and utilization of three main metabolic ingredients: glucose, fatty acids, and glutamine [4]. These models incorporate five types of regulatory interactions: (1) competition between metabolic pathways for common resources; (2) modulation of metabolic pathways by master gene regulators (AMPK, HIF-1, MYC); (3) feedback regulation of gene regulators by metabolic intermediates; (4) interactions between gene regulators; and (5) regulation of metabolite uptake through transporter expression [4].
The minimal network model focuses on three key gene regulators and their relationships with critical metabolic pathways. AMPK (AMP-activated protein kinase) serves as a central energy sensor, HIF-1 (Hypoxia-inducible factor 1) drives glycolytic adaptation, and MYC coordinates multiple metabolic processes including glutamine metabolism [4].
Figure 1: Core Regulatory Network of Cancer Metabolism
Metabolic Phenotypes and Clinical Implications
Computational models predict that cancer cells can acquire distinct metabolic phenotypes through different combinations of catabolic and anabolic processes [4]:
- Catabolic Phenotype (O): Characterized by vigorous oxidative processes including glucose oxidation and fatty acid oxidation (FAO).
- Anabolic Phenotype (W): Dominated by pronounced reductive activities, particularly aerobic glycolysis (Warburg effect).
- Hybrid Metabolic State (W/O): Exhibits both high catabolic and high anabolic activity, enabling metabolic flexibility.
- Glutamine-Dependent Phenotype (Q): Relies primarily on glutamine oxidation to fuel metabolic demands.
Strikingly, carcinoma samples exhibiting hybrid metabolic phenotypes (W/O) are often associated with the worst survival outcomes compared to other metabolic phenotypes [4]. This underscores the clinical relevance of computational phenotype classification and its potential for prognostic stratification.
Key Metabolic Alterations in Cancer Cells
Glucose Metabolism Reprogramming
Cancer cells enhance glucose uptake through overexpression of glucose transporters (GLUTs), particularly GLUT1, which has high affinity for glucose and is crucial for tissues relying heavily on glucose for energy [2]. Modifications in glucose metabolism extend beyond glycolysis to include:
- Pentose Phosphate Pathway (PPP): Upregulation of both oxidative and non-oxidative phases supports nucleic acid synthesis and suppresses oxidative stress [2].
- Tricarboxylic Acid (TCA) Cycle: Enzymatic mutations and dysregulation occur in enzymes such as succinate dehydrogenase (SDH), fumarate hydratase (FH), and isocitrate dehydrogenase (IDH) [2] [65].
- Mitochondrial Metabolism: While often functional, mitochondrial processes are reprogrammed to support biosynthetic precursor generation rather than efficient ATP production [65].
Amino Acid, Lipid, and Nucleotide Metabolism
Beyond glucose metabolism, cancer cells exhibit profound alterations in other metabolic pathways:
- Amino Acid Metabolism: Increased expression of solute carriers (SLCs) enhances amino acid uptake, with glutamine serving as a critical nitrogen source for nucleotide synthesis and a carbon source for TCA cycle anaplerosis [2].
- Lipid Metabolism: Elevated lipid intake from the extracellular microenvironment is coupled with upregulated lipogenesis and enhanced lipid storage and mobilization from intracellular lipid droplets [2].
- Nucleotide Metabolism: Increased nucleotide demand is met through changes in both salvage and de novo synthesis pathways, with cancer cells often favoring de novo nucleotide generation [2].
Table 1: Key Metabolic Alterations in Cancer Cells
| Metabolic Pathway | Key Alterations | Regulatory Factors | Functional Consequences |
|---|---|---|---|
| Glucose Metabolism | Enhanced GLUT expression, Aerobic glycolysis, PPP upregulation | HIF-1, AMPK, PKM2, G6PD | Rapid ATP generation, Biosynthetic precursor production, Oxidative stress suppression |
| Amino Acid Metabolism | Increased SLC transporter expression, Glutaminolysis upregulation | MYC, GLUD, Transaminases | Nitrogen source for nucleotides, TCA cycle anaplerosis, Hexosamine synthesis |
| Lipid Metabolism | Increased lipid intake, Enhanced lipogenesis, Lipid storage mobilization | SREBP, ACSL4, AMACR | Membrane biosynthesis, Signaling pathway modulation, Energy storage |
| Nucleotide Metabolism | Salvage and de novo pathway modifications, Enzyme expression changes | TK1, TYMS, HPRT | DNA/RNA synthesis for proliferation, Mutation accumulation |
Multi-Omics Integration in Metabolic Modeling
Technologies for Multi-Omics Analysis
Multi-omics approaches provide complementary, multidimensional views of tumor evolution, offering a more comprehensive understanding of intratumor heterogeneity [68]. The integration of multiple omics layers enables researchers to construct detailed tumor ecosystem landscapes, facilitating more robust classification systems for precision diagnosis and treatment [68].
Table 2: Multi-Omics Technologies for Metabolic Modeling
| Technology Type | Representative Methods | Applications in Cancer Metabolism | Limitations |
|---|---|---|---|
| Genomics | Whole-exome sequencing (WES), Whole-genome sequencing (WGS) | Identification of metabolic enzyme mutations (SDH, FH, IDH), Driver mutation analysis | Limited interpretation of non-coding regions, Incomplete functional annotation |
| Transcriptomics | Bulk RNA-seq, Single-cell RNA-seq (scRNA-seq) | Pathway activity inference, Heterogeneous metabolic subpopulation identification | Loss of spatial context, Disconnect between mRNA and protein levels |
| Epigenomics | ATAC-seq, ChIP-seq, Whole-genome bisulfite sequencing | Regulation of metabolic gene expression, Chromatin accessibility mapping | High data complexity, Cell type-specific interpretation challenges |
| Proteomics | Mass spectrometry (MS), Antibody arrays | Metabolic enzyme quantification, Post-translational modification analysis | Limited sensitivity for low-abundance proteins, Quantitative accuracy issues |
| Metabolomics | LC-MS/MS, GC-MS, NMR | Direct metabolite measurement, Metabolic flux inference | Metabolite instability, Technical variability, Dynamic range limitations |
| Radiomics | CT, PET, MRI with AI algorithms | Non-invasive metabolic phenotyping (e.g., FDG-PET), Tumor heterogeneity assessment | Qualitative rather than quantitative, Indirect metabolic measurement |
Horizontal and Vertical Integration Strategies
Multi-omics integration typically employs two major strategies [68]:
- Horizontal Integration: Combines technologies within the same omics layer, such as spatial transcriptomics with single-cell RNA sequencing, to overcome the limitations of each approach when applied independently.
- Vertical Integration: Connects different biological layers (e.g., genomics with transcriptomics and metabolomics) to establish causal relationships between genetic alterations and metabolic outcomes.
The workflow for developing and validating computational models of cancer metabolism typically follows a systematic approach that integrates experimental data with computational predictions [68] [67].
Figure 2: Multi-Omics Modeling Workflow for Metabolic Vulnerability Identification
Experimental Protocols and Research Toolkit
Computational Model Development Protocol
The development of predictive computational models for cancer metabolism involves a structured methodology [4] [67]:
Network Construction and Mechanistic Modeling
- Construct comprehensive metabolic networks featuring uptake, transportation, and utilization of glucose, fatty acids, and glutamine [4].
- Formulate coarse-grained mathematical models that capture essential features of the regulatory network while maintaining computational tractability [4].
- Incorporate master gene regulators (AMPK, HIF-1, MYC) and their interactions with metabolic substrates and pathways [4].
Parameter Estimation and Model Calibration
- Utilize gene expression data from sources like The Cancer Genome Atlas (TCGA) to quantify gene and metabolic pathway activity [4].
- Develop scoring metrics based on gene expression to validate model-predicted gene-metabolic pathway associations [4].
- Calibrate model parameters using experimental measurements of metabolic flux, nutrient consumption, and growth rates [4].
Model Validation and Experimental Testing
- Compare model predictions with experimental observations across different cancer types and metabolic conditions [4].
- Use genetically engineered mouse models or patient-derived xenografts to validate predicted metabolic vulnerabilities [67].
- Test model-predicted therapeutic strategies in pre-clinical models of metastatic cancer [67].
Essential Research Reagents and Tools
Table 3: Research Reagent Solutions for Metabolic Modeling Studies
| Reagent/Tool Category | Specific Examples | Function in Metabolic Research | Application Context |
|---|---|---|---|
| Metabolic Probes | 18-fluorodeoxyglucose (18FDG), 2-deoxy-d-glucose (2-DG) | Glucose uptake measurement, Glycolytic inhibition | PET imaging, Metabolic flux studies, Therapeutic targeting |
| Enzyme Inhibitors | Glutaminase inhibitors, Fatty acid oxidation inhibitors, LDHA inhibitors | Pathway-specific metabolic blockade, Vulnerability validation | Target validation, Combination therapy development |
| Genomic Tools | CRISPR-Cas9 libraries, siRNA screens, TCGA datasets | Genetic dependency mapping, Driver mutation identification | Target discovery, Metabolic network modeling |
| Metabolomics Platforms | LC-MS/MS, GC-MS, Stable isotope tracing | Metabolic flux analysis, Pathway activity quantification | Metabolic phenotyping, Therapy response monitoring |
| Computational Frameworks | CompuCell3D, Agent-based modeling platforms, caiSC clinical AI framework | Multiscale simulation, Digital twin development, Treatment optimization | Predictive modeling, Personalized therapy design |
Therapeutic Applications and Future Directions
Computational models of cancer metabolism are increasingly influencing therapeutic development and clinical trial design [66]. Virtual patient cohorts enable in silico trials that complement traditional studies, enhancing scalability while reducing ethical and logistical constraints [66]. Evolutionary and ecological modeling approaches inform adaptive therapy strategies that aim to preemptively address resistance mechanisms [66].
The development of functional digital twins represents an important emerging direction in computational oncology [66]. These computational counterparts to living systems provide individualized simulations that support diagnosis, treatment planning, and monitoring [66]. Initial efforts, such as the digital cell twin for lung adenocarcinoma electrophysiology, demonstrate the feasibility of modeling complex cellular behaviors at high resolution [66].
Future advances in computational modeling of cancer metabolism will require continued progress in model standardization, reproducibility, clinical validation, and data integration [66]. As the field matures, a more integrated ecosystem that combines mechanistic understanding, data-driven modeling, and translational application will be critical for realizing the full potential of computational approaches in oncology [66]. By targeting the metabolic vulnerabilities identified through these sophisticated models, researchers can develop more effective therapeutic strategies that address the dynamic adaptability of cancer metabolism [2] [65] [4].
A hallmark of cancer cells is their ability to reprogram cellular metabolism to support rapid proliferation, survival, and resistance to therapy. Unlike normal cells that primarily rely on oxidative phosphorylation for energy production, cancer cells preferentially undergo aerobic glycolysis, converting glucose to lactate even in the presence of sufficient oxygen—a phenomenon known as the Warburg effect [2]. This metabolic rewiring provides not only ATP but also critical biosynthetic intermediates necessary for synthesizing nucleic acids, proteins, and lipids. Targeting key glycolytic enzymes and transporters has therefore emerged as a promising therapeutic strategy to disrupt the metabolic vulnerabilities of cancer cells [2] [69].
This technical guide provides a comprehensive overview of inhibitors targeting four central nodes in the cancer glycolytic pathway: glucose transporters (GLUTs), hexokinase 2 (HK2), pyruvate kinase M2 (PKM2), and lactate dehydrogenase A (LDHA). We summarize the current landscape of small-molecule inhibitors, detail experimental methodologies for evaluating their efficacy, and visualize key signaling pathways and screening workflows.
Key Glycolytic Targets and Their Inhibitors
Glucose Transporters (GLUTs)
Facilitative glucose transporters (GLUTs) mediate the first critical step of glycolysis: cellular glucose uptake. GLUT1 and GLUT3 are frequently overexpressed in cancers to meet heightened glycolytic demands, and their expression is often correlated with poor prognosis [69].
- BAY-876: A highly selective, potent GLUT1 inhibitor (IC~50~ ~ 0.002 μM) identified through high-throughput screening. It demonstrates strong anti-proliferative and pro-apoptotic effects in head and neck squamous cell carcinoma (HNSCC) and colorectal cancer (CRC) models. BAY-876 works by directly binding GLUT1, reducing glucose uptake, and, in HNSCC, shows synergistic effects when combined with bitter taste receptor (T2R) agonists [70] [71].
- GLUT3 Inhibitors (e.g., G3iA): Discovered via in silico screening of ~8 million compounds against inward- and outward-facing GLUT3 conformations, G3iA is a selective GLUT3 inhibitor (IC~50~ ~ 7 µM) with weaker inhibition of GLUT2 (IC~50~ ~ 29 µM) [72].
- Natural Polyphenols (e.g., Apigenin): Used as broad-spectrum GLUT inhibitors, though they lack specificity for individual GLUT isoforms [70].
Table 1: Key GLUT Inhibitors in Preclinical Development
| Inhibitor | Primary Target | Key Characteristics | Reported IC~50~/Efficacy | Cancer Models Studied |
|---|---|---|---|---|
| BAY-876 | GLUT1 | Highly selective, small molecule | ~2 nM [70] | HNSCC, Colorectal Cancer, Ovarian Cancer, Breast Cancer [70] [71] |
| G3iA | GLUT3 | Identified via in silico screening | ~7 µM [72] | Eukaryotic expression systems (Yeast) [72] |
| Apigenin | Multiple GLUTs | Natural polyphenol, broad-spectrum | Varies (non-specific) [70] | Various (broad-spectrum tool compound) |
Hexokinase 2 (HK2)
Hexokinase 2 catalyzes the first committed step of glycolysis, phosphorylating glucose to glucose-6-phosphate. HK2 is often bound to mitochondria in cancer cells, providing direct access to ATP and linking glycolysis to oxidative phosphorylation. A pan-cancer analysis of TCGA data confirms that HK2 is highly expressed in numerous tumors, including cholangiocarcinoma (CHOL), HNSCC, and kidney renal clear cell carcinoma (KIRC), and its expression is associated with poor survival in several cancer types [73].
The development of HK2 inhibitors faces challenges related to selectivity over other hexokinase isoforms and the polar nature of the target's active site. Current strategies focus on targeting unique domains of HK2, such as its N-terminal domain, to achieve selective inhibition [74].
Pyruvate Kinase M2 (PKM2)
Pyruvate kinase catalyzes the final rate-limiting step of glycolysis, transferring a phosphate group from phosphoenolpyruvate (PEP) to ADP, generating pyruvate and ATP. The PKM2 isoform is predominantly expressed in cancer cells and exists in a dynamic equilibrium between a less active dimeric form and a highly active tetrameric form. The dimeric form facilitates the accumulation of glycolytic intermediates that are shunted into biosynthetic pathways, supporting rapid cell growth [75].
- Shikonin: A natural compound from Lithospermum erythrorhizon that directly inhibits PKM2, reducing the glycolytic rate and ATP production. It has shown antitumor effects in bladder, skin, and esophageal cancers and can improve the efficacy of chemotherapeutics like Taxol and cisplatin [75].
- Metformin: While not a direct PKM2 inhibitor, the antidiabetic drug metformin downregulates PKM2 expression, contributing to its anticancer effects. It inhibits the HIF1α/PKM2 pathway in gastric cancer and reduces TGF-β1-induced epithelial-mesenchymal transition (EMT) in cervical cancer by downregulating PKM2 [75].
Table 2: Key PKM2 and LDHA Inhibitors
| Target | Inhibitor | Type / Origin | Mechanism of Action | Reported Effects in Cancer Models |
|---|---|---|---|---|
| PKM2 | Shikonin | Natural Compound | Directly inhibits PKM2 enzyme activity | Inhibits bladder, skin, and esophageal cancer progression; overcomes chemoresistance [75] |
| PKM2 | Metformin | Repurposed Drug | Downregulates PKM2 expression | Enhances sensitivity to cisplatin in osteosarcoma; inhibits gastric cancer [75] |
| LDHA | FX-11 | Small Molecule (Benzoxazole-based) | Inhibits LDHA enzyme activity | Reduces ATP levels, induces oxidative stress and apoptosis [76] [77] |
| LDHA | Quercetin, Berberine | Natural Compounds (Polyphenol, Alkaloid) | Binds to LDHA active site | Demonstrates anti-cancer, anti-microbial, and anti-inflammatory activities [76] |
Lactate Dehydrogenase A (LDHA)
Lactate dehydrogenase A is a critical enzyme that catalyzes the conversion of pyruvate to lactate, regenerating NAD+ to sustain high glycolytic flux. LDHA is overexpressed in many cancers and its activity is linked to the maintenance of an acidic tumor microenvironment, which promotes invasion, metastasis, and immune evasion [76] [77]. LDHA is also a key player in mediating resistance to chemotherapy, radiotherapy, and immunotherapy [77].
- FX-11: A benzoxazole-based small-molecule inhibitor that selectively targets LDHA. It reduces ATP levels, induces oxidative stress, and promotes apoptosis in cancer cells [76] [77].
- Natural Compounds (Quercetin, Berberine): Polyphenols and alkaloids that function as LDHA inhibitors by binding to its active site, demonstrating potential as anti-cancer agents [76].
- RNA-based Inhibitors: siRNA and shRNA constructs that target LDHA mRNA, reducing its expression and enzymatic activity [76].
Experimental Protocols for Inhibitor Validation
Protocol: In Vitro Analysis of GLUT1 Inhibition
This protocol outlines the key steps for validating the efficacy of a GLUT1 inhibitor like BAY-876 in cancer cell lines, as derived from published studies [70] [71].
Cell Culture and Treatment:
- Culture relevant cancer cell lines (e.g., HNSCC lines SCC47, FaDu; CRC lines HCT116, DLD1).
- Treat cells with a dose range of the GLUT1 inhibitor (e.g., BAY-876 from 10 nM to 100 µM) for defined periods (e.g., 24-72 hours). Include a DMSO vehicle control.
Glucose Uptake Measurement:
- Method A (Bulk Measurement): Use a colorimetric or fluorometric assay kit to measure the concentration of glucose remaining in the cell culture media after treatment. Compare to untreated controls to calculate glucose consumption [70].
- Method B (Real-Time Imaging): Use a FRET-based glucose biosensor (e.g., FLII12Pglu-700μδ6). Seed cells in an imaging chamber and treat with the inhibitor. Monitor FRET signal in real-time after adding a glucose bolus (e.g., 25 mM). A decreased rate of signal change indicates inhibited glucose uptake [70].
Viability and Apoptosis Assays:
Metabolic Phenotyping (Seahorse Analysis):
- Perform extracellular flux analysis to measure the Glycolytic Rate (glycolysis and glycolytic capacity) and Mitochondrial Respiration (basal respiration, ATP-linked respiration, maximal respiration) in inhibitor-treated cells. BAY-876 treatment in CRC cells has been shown to inhibit glycolysis and enhance mitochondrial respiration, leading to increased ROS and apoptosis [71].
In Vivo Validation:
- Establish mouse xenograft models (e.g., using HCT116 cells). Randomize mice into vehicle control and treatment groups.
- Administer the inhibitor (e.g., BAY-876) via an appropriate route (e.g., intraperitoneal injection). Monitor tumor volume and weight regularly.
- At endpoint, harvest tumors for immunohistochemical (IHC) analysis of GLUT1 expression and Ki-67 (proliferation marker), and TUNEL staining (apoptosis) [71].
Protocol: In Silico Screening for GLUT3 Inhibitors
This protocol summarizes the computational pipeline used to discover novel GLUT3 inhibitors [72].
Target Preparation:
- Obtain 3D structures of GLUT3 in both outward-facing (PDB ID: 5C65) and inward-facing (generate a homology model based on GLUT1 PDB: 4PYP) conformations.
- Define the ligand-binding pocket around the substrate binding site for each conformation.
Virtual Screening:
- Screen a large library of commercially available small molecules (e.g., ~8 million compounds from ChemNavigator) against both GLUT3 conformations using molecular docking software (e.g., FLAP - Fingerprints for Ligands and Proteins).
- Rank compounds based on docking scores and interaction profiles.
Candidate Selection and In Vitro Validation:
- Select top ~200 candidate ligands for experimental testing.
- Test selected compounds for in vivo inhibition of GLUT3 expressed in hexose transporter-deficient yeast cells engineered to express human GLUT3.
- Validate hits and determine IC~50~ values. Assess selectivity against other Class I GLUTs (GLUT1, 2, 4, 5) using analogous yeast assay systems [72].
Visualizing Pathways and Workflows
Glycolytic Pathway and Inhibitor Targets
Diagram 1: Glycolytic Pathway with Key Inhibitor Targets. This diagram illustrates the core glycolytic pathway in cancer cells, highlighting the four key nodes (GLUTs, HK2, PKM2, LDHA) targeted by pharmacological inhibitors. The Warburg effect is characterized by high flux from glucose to lactate, even in the presence of oxygen.
GLUT3 Inhibitor Discovery Workflow
Diagram 2: Workflow for GLUT3 Inhibitor Discovery. This diagram outlines the integrated computational and experimental pipeline for identifying novel GLUT3 inhibitors, as demonstrated in Scientific Reports [72].
The Scientist's Toolkit: Essential Research Reagents
Table 3: Key Reagents for Glycolysis Inhibitor Research
| Reagent / Assay | Function / Application | Specific Example / Model System |
|---|---|---|
| BAY-876 | Potent and selective GLUT1 inhibitor for in vitro and in vivo studies. Validates GLUT1 as a target. | Used in HNSCC [70] and colorectal cancer [71] cell lines and xenografts. |
| Hexose-Deficient Yeast Strains | Engineered to express a single human GLUT. Essential for validating inhibitor specificity and selectivity among GLUT isoforms. | Used to characterize GLUT3 inhibitor G3iA and profile its selectivity against GLUT1, 2, 4, and 5 [72]. |
| FLII12Pglu-700μδ6 Biosensor | FRET-based glucose sensor for real-time, live-cell imaging of dynamic glucose uptake changes upon inhibitor treatment. | Used to demonstrate BAY-876-mediated inhibition of glucose uptake in HNSCC cells [70]. |
| Extracellular Flux Analyzer (e.g., Seahorse) | Measures real-time glycolytic flux (ECAR) and mitochondrial respiration (OCR) in live cells. Critical for metabolic phenotyping. | Used to show BAY-876 induces a shift from glycolysis to mitochondrial respiration in CRC cells [71]. |
| CPTAC / TCGA Databases | Bioinformatics resources for analyzing target (e.g., HK2, GLUT1) mRNA/protein expression and correlation with survival across human cancers. | Used for pan-cancer analysis of HK2 expression and prognosis [73]. |
Targeting the glycolytic dependencies of cancer cells with inhibitors against GLUTs, HK2, PKM2, and LDHA represents a rational and evolving therapeutic strategy. Preclinical studies with agents like BAY-876 (GLUT1) and shikonin (PKM2) provide compelling evidence of their anti-tumor efficacy, both as monotherapies and in combination with other agents. However, challenges remain, including achieving sufficient selectivity to avoid on-target toxicity in normal tissues, overcoming compensatory metabolic pathways, and addressing the poor solubility and bioavailability of some natural compound-derived inhibitors.
Future work should focus on developing more selective inhibitors, particularly for HK2, and exploring rational combination therapies that simultaneously target multiple metabolic vulnerabilities or pair glycolytic inhibitors with conventional chemotherapeutics, targeted therapies, or immunotherapies. As our understanding of tumor metabolism deepens, targeting glycolysis will undoubtedly remain a cornerstone of innovative cancer drug development.
Cancer cells rewire their metabolic pathways to support rapid proliferation, continuous growth, survival, and resistance to treatments. Among these alterations, the reprogramming of lipid metabolism has emerged as a critical hallmark, with de novo lipogenesis (DNL) being a common characteristic of many cancers [78] [79]. While most normal tissues acquire lipids from circulation, cancer cells synthesize up to 90% of their lipids de novo, even in oxygen-rich (normoxic) conditions [78]. This metabolic distinction presents a promising therapeutic window.
The DNL pathway involves several key enzymes: ATP-citrate lyase (ACLY) generates acetyl-CoA in the cytosol; acetyl-CoA carboxylase (ACC) catalyzes the committed step to malonyl-CoA; and fatty acid synthase (FASN) produces palmitate, a 16-carbon saturated fatty acid [78] [33]. Subsequently, stearoyl-CoA desaturase (SCD1) introduces the first double bond into saturated fatty acids, generating monounsaturated fatty acids (MUFAs) that are essential for membrane fluidity and other cellular functions [80] [33]. This review provides an in-depth technical examination of FASN, ACC, and SCD1 as therapeutic targets, framed within the broader context of metabolic reprogramming in cancer, and equips researchers with experimental methodologies for investigating these targets.
Target Biology and Therapeutic Rationale
Fatty Acid Synthase (FASN)
FASN is a multifunctional cytosolic enzyme that catalyzes the synthesis of palmitic acid (C16:0) from acetyl-CoA and malonyl-CoA, utilizing NADPH as a co-substrate [79]. It functions as a homodimer, with each monomer containing seven distinct enzymatic activities plus an acyl carrier protein [79].
Therapeutic Rationale: FASN is overexpressed in numerous cancers—including breast, colorectal, prostate, lung, and ovarian cancers—and its expression often correlates with poor prognosis [79] [81]. FASN inhibition perturbs multiple hallmarks of cancer:
- Deregulates cellular energetics by promoting nucleotide and protein synthesis [79]
- Sustains proliferative signaling through maintaining lipid raft localization and activation of oncogenic receptors like HER2 and c-Met [79]
- Confers resistance to cell death by blocking intrinsic apoptotic pathways [79]
- Enables invasion and metastasis by facilitating epithelial-mesenchymal transition and metalloproteinase activity [79]
Acetyl-CoA Carboxylase (ACC)
ACC catalyzes the ATP-dependent carboxylation of acetyl-CoA to malonyl-CoA, the rate-limiting step in fatty acid synthesis [78]. This reaction not only provides substrate for FASN but also inhibits fatty acid oxidation by allosterically blocking carnitine palmitoyltransferase 1 (CPT1A) [78] [33].
Therapeutic Rationale: ACC is commonly upregulated in cancers and supports fatty acid synthesis for membrane biosynthesis and oncogenic signaling [78]. However, ACC inhibition presents a complex therapeutic profile, as it can paradoxically promote metastasis in breast cancer through increased acetylation and may confer cell death resistance by increasing NADPH production and reducing lipid peroxidation [78]. These dualistic effects have positioned ACC as a controversial target compared to other nodes in the pathway.
Stearoyl-CoA Desaturase (SCD1)
SCD1 is an endoplasmic reticulum-bound desaturase that introduces a cis-double bond between carbons 9 and 10 of saturated fatty acids, primarily converting palmitate (C16:0) to palmitoleate (C16:1) and stearate (C18:0) to oleate (C18:1) [80]. This iron-containing enzyme requires NADH, cytochrome b5, and cytochrome b5 reductase for catalytic activity [80].
Therapeutic Rationale: SCD1 is critical for maintaining the balance between saturated and monounsaturated fatty acids, which profoundly influences membrane fluidity, signaling platforms, and resistance to lipid peroxidation [80] [82]. Cancer cells with high lipogenic flux demonstrate particular vulnerability to SCD1 inhibition, as accumulation of saturated fatty acids induces lipotoxicity that triggers cell death through pleiotropic effects, including endoplasmic reticulum stress and impaired autophagy [82]. SCD1 expression is prognostic in acute myeloid leukemia (AML) and other malignancies, with higher expression correlating with decreased survival [82].
Table 1: Key Enzymes in Cancer Lipid Metabolism
| Enzyme | Reaction Catalyzed | Subcellular Localization | Key Regulatory Factors |
|---|---|---|---|
| ACC | Acetyl-CoA → Malonyl-CoA | Cytosol | AMPK phosphorylation, citrate levels |
| FASN | Synthesis of palmitate (C16:0) from acetyl-CoA & malonyl-CoA | Cytosol | SREBP-1c, USF-1, PI3K/Akt signaling |
| SCD1 | Palmitate (C16:0) → Palmitoleate (C16:1); Stearate (C18:0) → Oleate (C18:1) | Endoplasmic Reticulum | SREBP-1c, LXR, PGC-1α, cholesterol levels |
Therapeutic Targeting Landscape
Preclinical and Clinical Evidence
FASN Inhibitors: Multiple FASN inhibitors have demonstrated antitumor activity in preclinical models. TVB-2640, a potent FASN inhibitor, has shown promising activity in KRAS-mutant non-small cell lung cancer (NSCLC) in a Phase I trial (NCT02223247) and, combined with bevacizumab, favorable antitumor activity in glioblastoma in a Phase II trial [78]. TVB-3664 exhibits significant antitumor effects in hepatocellular carcinoma (HCC) models, particularly when combined with tyrosine kinase inhibitors [78]. The efficacy of FASN inhibition appears context-dependent, with brain metastases showing particular vulnerability due to limited lipid availability in the central nervous system [78].
ACC Inhibitors: ACC inhibitors show excellent activity in preclinical models of HCC and oncogenic KRAS-driven lung adenocarcinoma [78]. However, their development has been complicated by paradoxical tumor-promoting effects in some contexts and mechanism-based toxicities like hypertriglyceridemia observed in human trials for fatty liver disease [78].
SCD1 Inhibitors: Pharmacologic SCD1 inhibition using clinical-grade inhibitors like SSI-4 demonstrates pronounced toxicity in AML models, with sensitivity correlating with high rates of MUFA synthesis [82]. SCD1 inhibition induces lipotoxicity that can synergize with standard chemotherapy by enhancing DNA damage [82]. Other inhibitors, including A939572 and YTX-7739, show promising preclinical activity across various cancer models [80] [82].
Table 2: Selected Therapeutic Inhibitors in Development
| Inhibitor | Target | Development Stage | Key Observations | Clinical Trial Identifiers |
|---|---|---|---|---|
| TVB-2640 | FASN | Phase II/III | Activity in KRAS-mutant NSCLC & GBM; combined with bevacizumab | NCT03808558, NCT05118776 |
| TVB-3664 | FASN | Preclinical/Early Clinical | Tumor regression in HCC models with TKIs | N/A |
| SSI-4 | SCD1 | Preclinical | Toxicity in AML; synergizes with chemotherapy | N/A |
| A939572 | SCD1 | Preclinical | Induces cytotoxicity rescuable by oleate | N/A |
| Aramchol | SCD1 (partial) | Phase II for NASH | Improved fibrosis, reduced liver fat | N/A |
Mechanism of Cytotoxicity
The cytotoxicity induced by inhibition of these enzymes primarily stems from disruption of lipid homeostasis:
FASN Inhibition: Depletes palmitate and downstream fatty acids, impairing membrane biosynthesis, lipid raft formation, and protein palmitoylation [79] [83]. This leads to cell cycle arrest and apoptosis, particularly in cancer cells dependent on de novo lipogenesis.
ACC Inhibition: Reduces malonyl-CoA production, limiting fatty acid synthesis while potentially promoting fatty acid oxidation due to relief of CPT1A inhibition [78]. The resulting energy imbalance and impaired membrane biosynthesis contribute to antitumor effects.
SCD1 Inhibition: Causes accumulation of saturated fatty acids (SFAs) and depletion of monounsaturated fatty acids (MUFAs), leading to endoplasmic reticulum stress, disrupted membrane fluidity, and activation of unfolded protein response [80] [82] [83]. The cytotoxicity is uniquely rescued by exogenous oleate but not saturated fatty acids, confirming the specific requirement for MUFAs [83].
Diagram 1: Lipid Metabolism Pathway and Inhibition Effects. ACC inhibition reduces malonyl-CoA production; FASN inhibition depletes palmitate and causes malonyl-CoA accumulation; SCD1 inhibition disrupts the SFA:MUFA balance, inducing lipotoxicity. Abbreviations: SFA (saturated fatty acids), MUFA (monounsaturated fatty acids), FAO (fatty acid oxidation).
Experimental Approaches and Methodologies
Target Validation Using RNA Interference
Gene Silencing Protocol:
- Cell Preparation: Seed cancer cells (e.g., HCT116 colon carcinoma) in 96-well plates at 4000 cells/well in RPMI-1640 with 2% FBS [83].
- siRNA Transfection: Transfect with siRNA pools (50 nM) targeting ACC1, FASN, or SCD1 using Lipofectamine 2000 [83].
- Fatty Acid Rescue: 16 hours post-transfection, treat with 25 μM fatty acids (palmitate, stearate, or oleate dissolved in 10% methanol/0.9% BSA/PBS) [83].
- Viability Assessment: Measure cell viability 72 hours post-transfection using Cell Titer-Glo ATP assay [83].
Interpretation: ACC1 and FASN depletion should be rescued by palmitate, stearate, and oleate, while SCD1 depletion is specifically rescued only by oleate, confirming target-specific effects [83].
Small Molecule Inhibitor Profiling
Compound Screening Protocol:
- Cell Plating: Plate HCT116 cells at 1000 cells/well in 384-well plates [83].
- Inhibitor Treatment: Treat with reference inhibitors of ACC1 (CP640186), FASN (Merck #10v), or SCD1 (Abbott #7n) across a concentration range [83].
- Fatty Acid Complementation: Include media conditions supplemented with specific fatty acids (palmitate, stearate, oleate) [83].
- Viability Analysis: Determine viability after 72 hours and calculate IC50 values with and without fatty acid complementation [83].
Validation: The "fatty acid rescue" profile confirms on-target activity—ACC and FASN inhibitor cytotoxicity should be offset by multiple fatty acids, while SCD1 inhibitor toxicity should be specifically rescued by oleate [83].
Assessment of Lipotoxicity Mechanisms
Lipidomic Profiling Protocol:
- Sample Preparation: Culture cells with SCD1 inhibitors (e.g., SSI-4) for 24-72 hours [82].
- Lipid Extraction: Use monophasic isopropanol extraction for comprehensive lipid species analysis [82].
- Mass Spectrometry Analysis: Perform liquid chromatography-mass spectrometry (LC-MS) for lipid quantification [82].
- Data Processing: Annotate lipid species with LipiDex software and analyze with LipidSuite webtool [82].
Functional Assays:
- Lipid Peroxidation: Measure using C11-BODIPY 581/591 fluorescence probe
- ER Stress: Assess by Western blot for BiP, CHOP, and XBP1 splicing
- Apoptosis: Quantify by Annexin V/propidium iodide staining and flow cytometry
Diagram 2: Experimental Workflow for Target Validation and Inhibitor Characterization. A systematic approach combining genetic and pharmacological tools with mechanistic assays to validate lipid metabolism targets.
In Vivo Efficacy Studies
Xenograft Model Protocol:
- Animal Models: Use immunocompromised mice (e.g., NOD-scid or NSG strains) for human tumor xenografts [82].
- Compound Administration: Administer inhibitors orally (e.g., SSI-4 at 10-30 mg/kg in 10% Captisol) or via other appropriate routes [82].
- Tumor Monitoring: Measure tumor volume regularly and monitor animal weight for toxicity [82].
- Combination Therapy: Test synergy with standard chemotherapy (e.g., cytarabine + doxorubicin in AML models) [82].
- Tissue Analysis: Perform immunohistochemistry for proliferation (Ki67), apoptosis (cleaved caspase-3), and lipid metabolism markers in excised tumors.
The Scientist's Toolkit: Research Reagent Solutions
Table 3: Essential Research Reagents for Lipid Metabolism Studies
| Reagent/Category | Specific Examples | Function/Application | Key Considerations |
|---|---|---|---|
| siRNA Tools | siRNA pools targeting FASN, ACC1, SCD1 (Dharmacon) | Target validation through gene silencing | Include non-targeting controls; verify knockdown by qRT-PCR |
| Reference Inhibitors | TVB-2640 (FASN), CP640186 (ACC), SSI-4 (SCD1), A939572 (SCD1) | Pharmacological target inhibition | Use fatty acid rescue to confirm on-target activity [83] |
| Fatty Acids | Palmitate (C16:0), Stearate (C18:0), Oleate (C18:1) | Complementation/rescue experiments | Dissolve in 10% methanol/0.9% BSA/PBS as 100× stocks [83] |
| Viability Assays | Cell Titer-Glo ATP assay, Annexin V/PI apoptosis kit | Assessment of cell viability and death mechanisms | ATP assays reflect metabolic activity; combine with apoptosis markers |
| Lipidomics Tools | LC-MS systems, LipiDex software, LipidSuite webtool | Comprehensive lipid species identification and quantification | Use stable isotope-labeled tracers (e.g., U-¹³C₆-Glucose) for flux studies [82] |
| Antibodies | Anti-SCD1, anti-FASN, anti-ACC, ER stress markers (BiP, CHOP) | Protein expression analysis by Western blot, IHC | Validate specificity with knockout/knockdown controls |
Targeting lipid metabolism through FASN, ACC, and SCD1 inhibition represents a promising therapeutic strategy with distinctive advantages and challenges. The context-dependent efficacy of these approaches—influenced by tumor type, microenvironment, and genetic background—necessitates biomarker-driven patient selection. The metabolic flexibility of cancer cells suggests that combination therapies targeting multiple nodes or combining lipid metabolism inhibitors with conventional chemotherapy, immunotherapy, or targeted agents may yield superior outcomes.
Future research directions should focus on:
- Biomarker Development: Identifying predictive biomarkers of response, such as high FASN expression for FASN inhibitors or elevated MUFA synthesis rates for SCD1 inhibitors [78] [82]
- Tissue-Specific Targeting: Developing approaches to minimize mechanism-based toxicities, potentially through tissue-targeted inhibitor delivery [80]
- Immunomodulatory Effects: Exploring how lipid metabolism inhibition affects antitumor immunity, as FASN suppression can enhance T-cell-mediated antitumor responses [81]
- Dietary Manipulations: Investigating how dietary lipid composition can be strategically manipulated to enhance the efficacy of lipid metabolism inhibitors [78]
As the field advances, the integration of comprehensive lipidomic profiling with functional genetics will further elucidate the complex roles of lipid metabolism in cancer and refine therapeutic targeting strategies for clinical application.
Cancer cells undergo profound metabolic reprogramming to support their rapid proliferation, survival, and adaptation to hostile microenvironments. This reprogramming represents a fundamental hallmark of cancer, enabling tumor cells to meet their heightened demands for energy, biosynthetic precursors, and redox homeostasis [2] [84]. Two particularly critical metabolic pathways that are frequently dysregulated in cancer are glutamine metabolism and one-carbon (1C) metabolism. Glutamine addiction describes the phenomenon where many cancer cells become dependent on exogenous glutamine to fuel anabolic processes, despite glutamine being a non-essential amino acid that normal cells can synthesize endogenously [85] [84]. Simultaneously, one-carbon metabolism supports nucleotide synthesis, methylation reactions, and redox defense, making it indispensable for rapidly dividing cells [86] [87]. The targeting of these pathways presents a promising strategic approach for cancer therapy, potentially exploiting metabolic vulnerabilities that differ between malignant and normal cells.
Glutamine Metabolism and Its Therapeutic Targeting
The Role of Glutamine in Cancer
Glutamine is the most abundant amino acid in human plasma and serves as a critical nitrogen and carbon source for cancer cells [84]. Its metabolism fuels multiple anabolic pathways essential for tumor growth. After uptake primarily via the ASCT2 (SLC1A5) transporter, glutamine is converted to glutamate in the rate-limiting step catalyzed by glutaminase (GLS), and subsequently to α-ketoglutarate (α-KG), which enters the TCA cycle—a process known as anaplerosis [88] [84]. This flux provides energy, facilitates the biosynthesis of nucleotides, lipids, and other amino acids, and helps maintain cellular redox balance [89] [90]. Many cancers, including colorectal, melanoma, and renal cell carcinoma, exhibit "glutamine addiction," making this pathway a attractive therapeutic target [85] [84].
Glutaminase Blockade: Mechanisms and Agents
Pharmacological inhibition of glutaminase disrupts this crucial metabolic pathway. Several inhibitors have been developed, ranging from broad antagonists to specific enzyme blockers.
- JHU083 is a prodrug of the glutamine antagonist 6-diazo-5-oxo-L-norleucine (DON). DON broadly inhibits multiple glutamine-utilizing enzymes but previously failed clinically due to gastrointestinal toxicity. JHU083 is designed to circulate inertly and be activated specifically in the tumor microenvironment, thereby mitigating systemic toxicity [88]. In syngeneic mouse models (e.g., MC38 colon cancer, EL-4 lymphoma), JHU083 monotherapy led to marked tumor growth suppression and, in some cases, durable complete responses. It disrupted Warburg physiology by suppressing glucose flux into the TCA cycle, glycolysis, and nucleotide synthesis pathways, thereby increasing intratumoral nutrient levels and reducing hypoxia [88].
- CB-839 (Telaglenastat) is a potent, selective, and reversible inhibitor of GLS1, the kidney-type glutaminase isoform often overexpressed in tumors [89] [85]. It has progressed to numerous clinical trials. In colorectal cancer (CRC) cell lines, CB-839 exhibits variable cytotoxicity, with HT29 cells being more sensitive (CC₅₀ = 8.75 µM at 96 h) than SW480 cells (CC₅₀ = 51.41 µM at 96 h) [89]. Treatment induces metabolic rewiring, including impaired Krebs cycle function, altered amino acid pools, and a compensatory shift toward glycolytic ATP production in sensitive cells [89].
Table 1: Glutaminase Inhibitors in Cancer Therapy
| Agent | Mechanism of Action | Key Preclinical Findings | Clinical Development Status |
|---|---|---|---|
| JHU083 | Prodrug of DON; pan-glutamine antagonist | Reprograms TME; enhances CD8+ T cell function; synergizes with anti-PD-1 [88] | Preclinical (mouse models) |
| CB-839 (Telaglenastat) | Selective, reversible GLS1 inhibitor | Induces metabolic rewiring and compensatory glycolysis; cell line-dependent sensitivity [89] | Phase I/II trials (NCT02771626, NCT03428217, etc.) in multiple cancers [85] |
The following diagram illustrates the mechanism of glutaminase blockade and its divergent effects on cancer cells and immune cells, as revealed by studies with JHU083.
Impact on the Tumor Microenvironment and Immunotherapy
A pivotal finding in this field is the divergent impact of glutamine blockade on cancer cells versus immune cells. While glutamine antagonism suppresses the oxidative and glycolytic metabolism of cancer cells, it can paradoxically enhance antitumor immunity [88]. Effector T cells respond to JHU083 by upregulating oxidative metabolism and adopting a long-lived, highly activated phenotype. This metabolic reprogramming within the tumor microenvironment (TME) reduces hypoxia and nutrient depletion, effectively dismantling an immunosuppressive landscape [88]. Consequently, glutamine antagonism alone can stimulate a potent endogenous antitumor CD8+ T cell response and immunologic memory, as evidenced by tumor rejection upon rechallenge in cured mice [88]. Furthermore, combining JHU083 with anti-PD-1 checkpoint blockade synergizes, leading to nearly 100% complete response rates in MC38 tumor models [88]. This establishes glutamine blockade as a "metabolic checkpoint" for cancer immunotherapy.
One-Carbon Metabolism and Its Therapeutic Targeting
The Role of One-Carbon Metabolism in Cancer
One-carbon (1C) metabolism is a network of folate-driven biochemical reactions that donate 1C units for the de novo synthesis of purines and thymidine, the regeneration of methionine, and the maintenance of cellular redox balance via glutathione production [86] [87]. This pathway is fundamental for proliferating cells, as it provides essential building blocks for DNA and RNA. Serine and glycine are the primary sources of 1C units, which are processed by enzymes like serine hydroxymethyltransferase (SHMT) and methylenetetrahydrofolate dehydrogenase (MTHFD) in the cytoplasm and mitochondria [86] [91]. Cancer cells heavily rely on 1C metabolism to support their high proliferation rates, often upregulating key enzymes such as MTHFD2, which is normally silent in adult tissues but re-expressed in many tumors [91].
Targeting One-Carbon Metabolism: Mechanisms and Agents
Inhibition of 1C metabolism aims to starve cancer cells of the nucleotides necessary for DNA replication and repair.
- Classical Antifolates: Drugs like methotrexate and 5-fluorouracil (5-FU) have long been used in oncology. Methotrexate inhibits dihydrofolate reductase (DHFR), depleting the tetrahydrofolate (THF) pool required for 1C transfers, thereby disrupting nucleotide synthesis [86] [87].
- Novel MTHFD1/2 Inhibitors: TH9619 is a first-in-class, nanomolar-potent dual inhibitor of MTHFD1 and MTHFD2. Its mechanism involves a unique "folate trapping" strategy. Inhibition of MTHFD1/2 causes the accumulation of 10-formyl-THF, leading to depletion of nucleotide precursors, replication stress, DNA damage, and selective apoptosis in MTHFD2-expressing cancer cells [91]. This cancer specificity arises because healthy adult cells do not rely on MTHFD2, minimizing on-target toxicity.
Table 2: One-Carbon Metabolism Inhibitors in Cancer Therapy
| Agent | Mechanism of Action | Key Preclinical Findings | Clinical Development Status |
|---|---|---|---|
| Methotrexate | Inhibits DHFR, depleting THF pool | Broad antiproliferative effects; long-standing clinical use [86] | Approved for various cancers |
| TH9619 | Dual MTHFD1/2 inhibitor; induces folate trapping | Depletes dNTPs, causes DNA damage and replication stress; selective for cancer cells [91] | GLP toxicology studies (pre-Clinical Trial) [91] |
The diagram below outlines the one-carbon metabolism pathway and the mechanism of action for novel inhibitors like TH9619.
Immunomodulatory Effects of One-Carbon Metabolism Inhibition
One-carbon metabolism also plays a critical role in regulating immune cell function. Deprivation of key 1C nutrients like serine or methionine impairs the proliferation and effector functions of T cells [87]. Therefore, the timing and context of 1C inhibition are crucial for its therapeutic application. Cancer cells can outcompete immune cells for these nutrients in the TME, leading to T cell exhaustion. Strategic inhibition of 1C metabolism in tumors may, in some contexts, be designed to synergize with immunotherapy by selectively affecting malignant cells while potentially rescuing or sparing the antitumor immune response, although this balance is complex and an active area of investigation [87].
Experimental and Methodological Approaches
This section details key experimental protocols for evaluating the efficacy and mechanisms of amino acid pathway inhibitors in preclinical models.
In Vitro Assessment of Metabolic Inhibition and Cytotoxicity
Objective: To determine the direct cytotoxic effects and metabolic adaptations of cancer cells to glutaminase or 1C metabolism inhibition.
Protocol:
- Cell Culture: Maintain relevant cancer cell lines (e.g., HT29, SW480 for CRC; HCT116) in appropriate media.
- Drug Treatment: Treat cells with a concentration gradient of the inhibitor (e.g., CB-839: 0-100 µM; TH9619: at its IC₅₀) for 48-96 hours.
- Viability/Proliferation Assay:
- MTT Assay: Measure cell viability based on the reduction of MTT to formazan by metabolically active cells. Calculate CC₅₀ values [89].
- Flow Cytometry for Cell Cycle: Fix and stain cells with propidium iodide. Analyze DNA content to determine cell cycle distribution (e.g., G0/G1, S, G2/M) and sub-G0 phase (apoptosis). CB-839 treatment in sensitive HT29 cells showed S-phase accumulation and a reduction in G2/M phase [89].
- Metabolic Phenotyping:
- Seahorse XF Analyzer: Perform Real-Time ATP Rate Assays or Mitochondrial Stress Tests to quantify glycolytic and mitochondrial ATP production rates. CB-839 treatment in HT29 cells showed decreased mitochondrial ATP production and increased glycolytic ATP production [89].
- Metabolomics:
- Sample Preparation: Quench cell metabolism rapidly (e.g., liquid nitrogen), perform metabolite extraction using cold methanol/water solvents.
- Analysis: Utilize untargeted GC-MS and 1H-NMR to profile global metabolomic changes. Perform targeted GC-MS/MS for specific pathways like the Krebs cycle [89].
- Data Interpretation: Identify significantly altered metabolites (e.g., increased glutamine, decreased glutamate and TCA intermediates after CB-839) and map them onto metabolic pathways [89].
In Vivo Evaluation of Antitumor Efficacy and Immune Response
Objective: To investigate the antitumor activity of pathway inhibitors in immunocompetent animal models and their impact on the immune system.
Protocol:
- Animal Model: Implant syngeneic tumor cells (e.g., MC38 colon carcinoma, EL-4 lymphoma) subcutaneously into wild-type and Rag2⁻/⁻ (lacking adaptive immunity) mice [88].
- Drug Administration: Once tumors are palpable, randomize mice into treatment groups.
- JHU083: Administer via intraperitoneal injection at a predetermined efficacious dose (e.g., 25 mg/kg) [88].
- Control: Administer vehicle.
- Monotherapy and Combination Therapy:
- For combination studies with immunotherapy, administer JHU083 concurrently with anti-PD-1 antibodies [88].
- Monitoring:
- Measure tumor volumes regularly with calipers and monitor animal survival.
- For memory studies, rechallenge cured mice with the same tumor cell line on the opposite flank [88].
- Analysis of Tumor-Infiltrating Lymphocytes (TILs):
- Tumor Harvest: At endpoint, dissect tumors, digest them into single-cell suspensions.
- Immune Cell Staining: Stain cells with fluorescently labeled antibodies for flow cytometry analysis. Use markers like CD45 (leukocytes), CD3 (T cells), CD8 (cytotoxic T cells), CD4 (helper T cells), PD-1, LAG-3 (exhaustion), Ki-67 (proliferation), and intracellular IFN-γ and Granzyme B (effector function) [88].
- Antigen-Specific T Cells: For models expressing ovalbumin (OVA), use MHC tetramers (e.g., SIINFEKL-H2Kb) to identify OVA-specific CD8+ T cells [88].
- T Cell Depletion: To confirm the role of specific immune populations, administer depleting antibodies (e.g., anti-CD8) during JHU083 therapy [88].
Table 3: Key Research Reagents and Experimental Tools
| Reagent/Assay | Function/Application | Example Use in Context |
|---|---|---|
| CB-839 (Telaglenastat) | Selective GLS1 inhibitor | In vitro dose-response and metabolomics studies in CRC cell lines [89] |
| JHU083 | Tumor-targeted prodrug of DON | In vivo efficacy and immune profiling studies in syngeneic mouse models [88] |
| TH9619 | Dual MTHFD1/2 inhibitor | Validation of folate trapping mechanism and selective cancer cell killing [91] |
| Seahorse XF Analyzer | Real-time measurement of cellular metabolism | Quantifying glycolytic and mitochondrial ATP production rates after metabolic inhibition [89] |
| GC-MS / 1H-NMR | Metabolomic profiling | Identifying global metabolic changes in response to pathway inhibition [89] |
| Anti-PD-1 Antibody | Immune checkpoint blockade | Testing combination therapy with glutamine antagonists [88] |
| MHC Tetramers | Detection of antigen-specific T cells | Tracking tumor-specific CD8+ T cell responses in vivo [88] |
Targeting glutamine and one-carbon metabolism represents a promising frontier in cancer therapy that moves beyond conventional cytotoxics. The strategic inhibition of these pathways leverages the metabolic dependencies of cancer cells. The development of tumor-selective prodrugs like JHU083 and enzyme-specific inhibitors like CB-839 and TH9619 highlights a maturation in this field, aiming to maximize efficacy while minimizing off-target effects. A critical insight from recent research is the profound impact these metabolic interventions have on the tumor immune microenvironment. Glutamine blockade, in particular, can function as a "metabolic checkpoint," selectively impairing cancer cells while enhancing the function and longevity of antitumor T cells [88]. Future success will likely depend on patient stratification based on metabolic biomarkers (e.g., GLS1 expression, MTHFD2 status) and rational drug combinations, such as glutaminase inhibitors with immune checkpoint blockers or dual targeting of parallel metabolic pathways to overcome compensatory mechanisms and resistance [85] [90]. As our understanding of metabolic heterogeneity and plasticity deepens, so too will our ability to precisely target the metabolic vulnerabilities of cancer.
Cancer cells undergo profound metabolic reprogramming to meet the heightened demands for energy, biosynthetic precursors, and redox homeostasis required for rapid proliferation and survival. This reprogramming, a recognized hallmark of cancer, involves alterations in glucose, amino acid, and lipid metabolism that collectively sustain tumor growth and progression [2]. The tumor microenvironment (TME) further shapes and is shaped by these metabolic alterations, creating immunosuppressive conditions that limit the efficacy of conventional therapies [92] [1]. Targeting these metabolic adaptations represents a promising strategic approach to enhance the effectiveness of established cancer treatments, including chemotherapy, targeted therapy, and immunotherapy.
The conceptual framework for combination strategies rests on disrupting the metabolic dependencies of cancer cells while simultaneously attacking them with therapeutic agents that exploit these vulnerabilities. Cancer cells exhibit distinct metabolic features such as enhanced aerobic glycolysis (the Warburg effect), elevated de novo fatty acid synthesis, altered amino acid utilization with a reliance on glutamine, and dysregulated cholesterol metabolism [92]. These adaptations not only sustain tumor growth but also remodel the TME by suppressing effector T-cell function and promoting immunosuppressive populations through key metabolites like lactate and cholesterol [92]. This review examines the current landscape of metabolic drug combinations, detailing the underlying mechanisms, experimental approaches, and clinical translation of these innovative therapeutic strategies.
Metabolic Pathways and Combination Targets
Core Metabolic Pathways in Cancer
The metabolic landscape of cancer cells is characterized by distinct alterations across multiple interconnected pathways. Glucose metabolism shifts toward aerobic glycolysis, with increased glucose uptake via overexpression of glucose transporters (GLUTs, especially GLUT1) and enhanced flux through glycolytic enzymes like hexokinase 2 (HK2) and lactate dehydrogenase A (LDHA) [92] [2]. This glycolytic phenotype, known as the Warburg effect, rapidly generates ATP and provides metabolic intermediates for biosynthesis despite being less efficient than oxidative phosphorylation [2].
Lipid metabolism in cancer cells involves increased de novo fatty acid synthesis driven by enzymes including fatty acid synthase (FASN), enhanced lipid uptake from the microenvironment via transporters like CD36, and increased lipid storage and mobilization from intracellular lipid droplets [2] [93]. These adaptations provide essential components for membrane biosynthesis, post-translational modifications, and signaling molecules that support rapid proliferation.
Amino acid metabolism rewiring in cancer features upregulated transport of essential and nonessential amino acids and increased glutaminolysis—the conversion of glutamine into tricarboxylic acid (TCA) cycle intermediates [2]. Glutamine serves as a nitrogen source for asparagine and hexosamine production and for nucleotide synthesis, making it critical for cancer cell proliferation.
Table 1: Key Metabolic Pathways and Molecular Targets for Combination Therapy
| Metabolic Pathway | Key Molecular Targets | Therapeutic Agents | Combinatorial Approach |
|---|---|---|---|
| Glucose Metabolism | HK2, GLUT1, LDHA, PKM2 | 2-deoxy-D-glucose (2-DG), BrP | Chemotherapy (Temozolomide) |
| Lipid Metabolism | FASN, CD36, ACC1 | FASN inhibitors, anti-CD36 antibody (PLT012) | Chemotherapy, Immunotherapy (Anti-PD-1) |
| Amino Acid Metabolism | GLS, IDO1, ASS1 | Glutaminase inhibitors, PEGylated arginine deiminase | Targeted Therapy, Immunotherapy |
| Mitochondrial Metabolism | Complex I, CPT1A | Metformin, Etomoxir | Chemotherapy, Targeted Therapy |
Signaling Networks Integrating Metabolism and Therapy Response
Metabolic reprogramming in cancer is orchestrated by key signaling pathways that sense nutrient availability and energy status. The HIF-1α pathway activation under hypoxia promotes glycolytic gene expression and inhibits oxidative metabolism [92]. mTOR signaling integrates growth factor and nutrient signals to regulate anabolic processes including protein and lipid synthesis [92]. SREBP transcription factors control the expression of lipogenic genes, driving fatty acid and cholesterol biosynthesis in cancer cells [92]. These signaling networks not only support cancer cell intrinsic metabolism but also shape the immune landscape of tumors, influencing response to chemotherapy, targeted therapy, and immunotherapy.
Figure 1: Integration of Metabolic Targets with Therapeutic Approaches. This diagram illustrates how core metabolic pathways in cancer cells provide molecular targets for combination strategies with conventional cancer therapies.
Metabolic Drugs in Combination with Chemotherapy
Targeting Glycolytic and Mitochondrial Metabolism
Inhibiting glycolytic pathways sensitizes cancer cells to chemotherapy by reducing energy production and biosynthetic capacity. 1,3-bromopyruvate (BrP), a halogenated analogue of pyruvate, inhibits hexokinase II (HK-II), which catalyzes the first committed step of glycolysis [94]. In glioblastoma models, co-delivery of BrP with the alkylating chemotherapeutic temozolomide (TMZ) via mitochondria-targeted nanofibers demonstrated synergistic therapeutic effects [94]. The nanofiber platform was engineered with self-assembling peptides functionalized with targeting ligands for epidermal growth factor receptor (EGFR) and a cell-penetrating peptide (gH625) to facilitate blood-brain barrier penetration. A matrix metalloproteinase-9 (MMP-9)-responsive linker enabled controlled, on-demand drug release in the tumor microenvironment [94].
Fatty acid synthase (FASN) inhibitors represent another promising approach to enhance chemotherapy efficacy. In triple-negative breast cancer (TNBC) models with brain metastases, inhibition of FASN alongside chemotherapy significantly improved treatment outcomes [95]. The brain microenvironment has limited lipid availability, making cancer cells dependent on de novo lipogenesis for survival. FASN inhibition at low doses alone reduced cancer cell motility and spread, while combination with chemotherapy produced synergistic effects in patient-derived cell lines [95].
Experimental Models and Protocols for Chemotherapy Combinations
In Vitro Synergy Screening Protocol:
- Cell Culture: Establish 2D and 3D cultures of cancer cell lines (e.g., U-87 MG glioblastoma cells or patient-derived TNBC lines with brain metastasis) [94] [95].
- Drug Treatment: Treat cells with metabolic drugs (e.g., BrP, FASN inhibitors) and chemotherapeutic agents (e.g., TMZ) alone and in combination across a range of concentrations.
- Viability Assessment: Measure cell viability using MTT or ATP-based assays after 72-96 hours of treatment.
- Synergy Analysis: Calculate combination indices using the Chou-Talalay method to determine synergistic, additive, or antagonistic effects [95].
- Metabolic Profiling: Analyze metabolic changes via extracellular flux analysis (Seahorse) to measure glycolytic rates and oxidative phosphorylation.
In Vivo Evaluation in Preclinical Models:
- Animal Models: Implement patient-derived xenograft (PDX) models or genetically engineered mouse models of specific cancers.
- Drug Formulation: Prepare metabolic drugs and chemotherapeutics in vehicles suitable for in vivo administration (e.g., nanoparticles for brain-penetrant agents).
- Treatment Regimen: Administer metabolic inhibitors in combination with chemotherapy at maximum tolerated doses determined in prior toxicity studies.
- Efficacy Endpoints: Monitor tumor volume regularly, and assess endpoints including progression-free survival and overall survival.
- Tissue Analysis: Perform immunohistochemistry on harvested tumors to evaluate proliferation markers (Ki-67), apoptosis (TUNEL staining), and metabolic pathway activity.
Metabolic Drugs in Combination with Targeted Therapy
Overcoming Resistance Mechanisms
Targeted therapies against specific oncogenic drivers often face resistance due to metabolic adaptation. Combining these agents with metabolic drugs can restore sensitivity and improve durability of response. In BRAF V600E-mutated cancers, including anaplastic thyroid cancer and metastatic colorectal cancer, combining BRAF/MEK inhibitors with metabolic modulators has shown enhanced efficacy [96].
In a Phase II trial for patients with Stage IV BRAF V600E-mutated anaplastic thyroid cancer, the combination of dabrafenib (BRAF inhibitor) and trametinib (MEK inhibitor) with pembrolizumab (anti-PD-1) demonstrated significant clinical activity [96]. While this example includes immunotherapy, it highlights the importance of metabolic adaptations in targeted therapy resistance. After neoadjuvant treatment with this combination, two-thirds of patients had no residual anaplastic thyroid cancer upon surgical resection, with a two-year survival rate of 69% compared to historical averages [96].
Computational Approaches for Target Identification
Advanced computational tools are accelerating the identification of metabolic targets for combination with targeted therapies. DeepTarget, a recently developed computational tool, integrates large-scale drug and genetic knockdown viability screens with multi-omics data to determine cancer drug mechanisms of action [97]. In benchmark testing, DeepTarget outperformed existing tools in seven out of eight drug-target test pairs for predicting both primary and secondary drug targets with mutation specificity [97].
In case studies validated experimentally, DeepTarget identified that the antiparasitic agent pyrimethamine affects cellular viability by modulating mitochondrial function in the oxidative phosphorylation pathway [97]. Additionally, the tool demonstrated that EGFR T790 mutations influence response to ibrutinib in BTK-negative solid tumors, revealing unexpected connections between targeted therapies and metabolic pathways [97].
Metabolic Drugs in Combination with Immunotherapy
Reversing Immunosuppressive Microenvironments
The immunosuppressive tumor microenvironment represents a major barrier to effective immunotherapy. Metabolic reprogramming of cancer and immune cells contributes significantly to this immunosuppression through multiple mechanisms. Lactate acidification, driven by the Warburg effect, impairs anti-tumor immune cells and promotes tumor-associated macrophages (TAMs) and regulatory T cells (Tregs) [1]. Combining metabolic drugs with immune checkpoint inhibitors can reverse this immunosuppression and enhance anti-tumor immunity.
CD36, a lipid transporter expressed on immune cells within tumors, serves as a metabolic checkpoint against anti-cancer immune responses [93]. In response to the lipid-rich tumor microenvironment, CD8+ T cells increase CD36 expression, importing lipids that induce dysfunction and ferroptosis. Conversely, Tregs and myeloid-derived suppressor cells (MDSCs) thrive on imported lipids, enhancing their immunosuppressive functions [93]. A humanized antibody, PLT012, that binds and blocks CD36 activity, has been developed to dismantle this metabolic barrier.
Preclinical Evidence and Clinical Translation
In preclinical models of hepatocellular carcinoma (HCC) and liver metastases of colon cancer, PLT012 restored anti-tumor immunity and demonstrated strong synergy with checkpoint blockade immunotherapy [93]. The antibody reshapes the immune landscape of tumors by selectively reducing lipid accumulation in Tregs and MDSCs while preserving and restoring the function of effector T cells [93]. Unlike conventional immune checkpoint inhibitors, PLT012 acts upstream by modulating lipid metabolism to dismantle the immunosuppressive architecture of the tumor. This approach has proven effective even against tumor types traditionally resistant to checkpoint blockade [93].
PLT012 has received orphan drug designation from the U.S. Food and Drug Administration and is being developed for clinical evaluation. The antibody demonstrated a favorable safety profile in studies conducted in monkeys and mice, without triggering potentially toxic autoimmune reactions despite broad CD36 expression throughout the body [93].
Table 2: Clinical Evidence for Metabolic Drug Combinations with Immunotherapy
| Cancer Type | Metabolic Target | Immunotherapy | Clinical Trial Phase | Key Efficacy Findings |
|---|---|---|---|---|
| HER2-negative advanced GC/GEJC | PD-L1 (CPS ≥10) | PD-1 inhibitors + Chemotherapy | Meta-analysis of 6 Phase III RCTs | Improved OS (HR=0.79) and PFS (HR=0.75) [98] |
| Liver Cancer (HCC) | CD36 | PLT012 + Anti-PD-1 | Preclinical (Orphan Drug Designation) | Robust anti-tumor immunity in immunotherapy-resistant models [93] |
| BRAF V600E-mutated ATC | BRAF/MEK signaling | Dabrafenib + Trametinib + Pembrolizumab | Phase II | 69% 2-year OS; 67% with no residual cancer [96] |
| Multiple Solid Tumors | CLDN6 | BNT142 (mRNA-encoded bispecific antibody) | Phase I/II | Manageable safety profile and promising anti-tumor activity [96] |
The Scientist's Toolkit: Research Reagent Solutions
Table 3: Essential Research Reagents for Investigating Metabolic Drug Combinations
| Reagent/Category | Specific Examples | Research Application | Key Function |
|---|---|---|---|
| Metabolic Inhibitors | 1,3-bromopyruvate (BrP), FASN inhibitors, 2-DG, Etomoxir | In vitro and in vivo target validation | Specific inhibition of metabolic enzymes/pathways |
| Nanocarrier Systems | Mitochondria-targeted nanofibers, Lipid nanoparticles | Drug delivery optimization | Enhanced bioavailability and targeted delivery |
| Computational Tools | DeepTarget | Drug target prediction and repurposing | Identifies primary/secondary targets and mutation specificity |
| Cell Line Models | Patient-derived cell lines, 3D culture systems, Anoikis-resistant models | Preclinical efficacy testing | Recapitulates tumor microenvironment and metabolic adaptations |
| Metabolic Profiling Platforms | Extracellular flux analyzers, Mass spectrometry-based metabolomics | Mechanism of action studies | Quantifies real-time metabolic parameters and metabolite levels |
| Immune Monitoring Assays | Flow cytometry panels, Cytokine arrays, Immunohistochemistry | Tumor microenvironment analysis | Characterizes immune cell populations and functional states |
The strategic combination of metabolic drugs with established cancer therapies represents a paradigm shift in oncology, moving beyond non-selective cytotoxicity toward precision targeting of cancer-specific dependencies. The accumulating preclinical and clinical evidence demonstrates that disrupting metabolic pathways can significantly enhance the efficacy of chemotherapy, overcome resistance to targeted therapies, and reverse immunosuppression in the tumor microenvironment. As our understanding of cancer metabolism deepens, the rational design of these combination strategies will increasingly incorporate patient-specific metabolic vulnerabilities, potentially guided by tools like DeepTarget for target identification [97].
Future directions in this field will likely focus on several key areas: First, the development of more sophisticated drug delivery systems, such as the mitochondria-targeted nanofibers for glioblastoma [94], will improve the therapeutic index of metabolic drugs. Second, the integration of metabolic biomarkers into clinical trial design will enable better patient stratification; for instance, PD-L1 expression levels (CPS ≥10) identify gastric cancer patients most likely to benefit from PD-1 inhibitors combined with chemotherapy [98]. Finally, exploring the metabolic interplay between cancer cells and non-malignant cells in the tumor microenvironment will reveal new opportunities for therapeutic intervention. As these advances mature, metabolic combination therapies are poised to become integral components of precision oncology, offering new hope for patients with resistant and advanced malignancies.
Cancer cells undergo profound metabolic reprogramming to support their rapid proliferation and survival, a core hallmark of cancer known as the Warburg effect or aerobic glycolysis. This metabolic rewiring creates specific nutrient dependencies and vulnerabilities that can be therapeutically exploited. Nutritional interventions represent an emerging class of metabolic adjuvants that target these vulnerabilities by manipulating systemic nutrient availability and tumor microenvironment composition. This comprehensive review synthesizes current evidence on dietary strategies—including caloric restriction, ketogenic diets, and specific nutrient manipulations—as adjuvants to conventional cancer therapies. We examine mechanistic insights into how these interventions modulate tumor metabolism, present quantitative analyses of preclinical and clinical outcomes, detail essential experimental methodologies, and provide visualization of key signaling pathways. The integration of nutritional approaches with pharmacological agents and immunotherapies offers promising avenues for enhancing treatment efficacy while potentially reducing therapeutic resistance, representing a paradigm shift in precision oncology that warrants continued investigation through well-designed clinical trials.
The Metabolic Landscape of Cancer Cells
Cancer metabolism is characterized by unique alterations in metabolic pathways that distinguish malignant cells from their normal counterparts. The rapidly proliferating cells require high levels of molecules including glucose, amino acids, lipids, and nucleotides, along with increased energy demand (ATP), met through profound alterations in core metabolic processes [2]. This metabolic reprogramming encompasses changes in glucose uptake, glycolysis, the pentose phosphate pathway, and the tricarboxylic acid (TCA) cycle, alongside upregulated amino acid transport, glutaminolysis, increased lipid intake and lipogenesis, and enhanced nucleotide synthesis [2]. These adaptations are not merely secondary consequences of oncogenic signaling but are fundamental drivers of tumor progression and therapy resistance.
The most well-studied metabolic alteration in cancer is the Warburg effect, wherein cancer cells preferentially utilize glycolysis for energy production even in the presence of adequate oxygen, a phenomenon known as aerobic glycolysis [2] [99]. This metabolic shift from oxidative phosphorylation to glycolysis provides several advantages to cancer cells: it ensures sufficiently fast ATP production to fulfill energetic demands while fueling anabolic processes through biomass production; the excreted lactate creates an extracellular acid environment that favors metastatization; and glycolytic intermediates can be channeled into biosynthetic pathways to support cell growth and division [99].
Molecular Drivers of Metabolic Reprogramming
Metabolic reprogramming in cancer is driven by complex interactions between oncogenic signaling pathways, tumor suppressor mutations, and microenvironmental factors [1] [100]. Key regulators include:
- Hypoxia-inducible factor 1 (HIF-1): Activated in hypoxic tumor regions, HIF-1 induces transcription of genes involved in angiogenesis, glycolysis, and invasion [101].
- PI3K/AKT signaling: This frequently dysregulated pathway in cancer stimulates expression of glucose transporters and glycolytic enzymes while inhibiting mitochondrial oxidation of pyruvate [99].
- MYC oncogene: Regulates multiple metabolic genes, including those involved in glutamine metabolism, mitochondrial function, and nucleotide synthesis [99].
- p53 tumor suppressor: Modulates glycolysis and oxidative phosphorylation while maintaining mitochondrial integrity [101].
These drivers collectively rewire cellular metabolism to support uncontrolled proliferation, creating metabolic dependencies that differ from normal cells and represent therapeutic opportunities.
Core Mechanisms of Metabolic Vulnerabilities
Metabolic Inflexibility
Cancer cells often exhibit metabolic inflexibility, constraining their ability to switch between energy acquisition pathways in response to microenvironmental fluctuations [100]. This inflexibility forces heightened reliance on specific metabolic pathways or enzymes under stress conditions, creating targetable 'Achilles' heels' [100]. For instance, many tumors become dependent on glucose and glutamine as primary carbon sources, with limited capacity to utilize alternative fuels when these nutrients become restricted [23]. This vulnerability is particularly pronounced in tumors with specific oncogenic mutations, such as RAS-driven cancers that rely heavily on macropinocytosis to acquire extracellular proteins when glutamine is limited [99].
Nutrient Dependency and Auxotrophy
Some tumors develop absolute dependencies on specific nutrients they cannot synthesize—a phenomenon known as auxotrophy. While normal cells can typically synthesize nonessential amino acids, some cancers lose this capacity, creating therapeutic opportunities through targeted nutrient restriction [99]. For example, certain tumors become glutamine auxotrophs despite glutamine being classified as a nonessential amino acid, making them vulnerable to glutamine depletion strategies [99].
Synthetic Lethality in Metabolic Pathways
Synthetic lethality represents another fundamental mechanism underlying metabolic vulnerabilities, where simultaneous disruption of two metabolic pathways induces cell death, while inhibition of either alone is tolerable [100]. This concept is particularly relevant for tumors with specific mutations that create unique metabolic dependencies. For instance, tumors with defects in mitochondrial electron transport chain complexes may develop heightened sensitivity to glucose restriction or glycolysis inhibition [100].
Table 1: Key Metabolic Vulnerabilities in Cancer Cells
| Vulnerability | Molecular Basis | Therapeutic Approach |
|---|---|---|
| Glucose Dependency | Upregulation of GLUT transporters, glycolytic enzymes, and Warburg effect | Caloric restriction, ketogenic diet, 2-DG, GLUT inhibitors |
| Glutamine Addiction | Overexpression of SLC1A5 transporter, GLS enzyme, MYC activation | Glutaminase inhibitors, dietary glutamine restriction |
| Lipid Metabolism Alterations | Increased fatty acid synthesis, lipid uptake, and storage | Fatty acid synthase inhibitors, lipid metabolism modulation |
| Amino Acid Auxotrophy | Loss of nonessential amino acid synthesis capability | Targeted amino acid depletion (e.g., asparaginase) |
| Redox Homeostasis Imbalance | Increased ROS production, altered antioxidant systems | Pro-oxidant therapies, glutathione system inhibition |
Dietary Interventions as Metabolic Adjuvants
Caloric Restriction and Fasting-Mimicking Diets
Caloric restriction encompasses various dietary regimens that reduce total calorie intake without causing malnutrition, including intermittent fasting and fasting-mimicking diets (FMDs) [102]. These approaches exert broad biological effects by reducing circulating glucose and growth factors, potentially protecting normal cells while sensitizing cancer cells to cytotoxic therapies [102] [99]. Proposed mechanisms include:
- Reduction in circulating glucose and insulin-like growth factor 1 (IGF-1) levels, limiting activation of PI3K/AKT signaling in tumor cells [99].
- Enhancement of oxidative stress in cancer cells already operating at high metabolic rates [103].
- Promotion of autophagy and apoptosis in malignant cells while potentially protecting normal tissues [103].
- Modulation of the tumor microenvironment through effects on immune cells and stromal components [1].
Preclinical studies demonstrate that caloric restriction can enhance the efficacy of chemotherapy and targeted therapies while potentially reducing treatment-related toxicities [99]. However, clinical translation requires careful consideration of patient nutritional status, as cancer cachexia remains a significant concern in advanced disease.
Ketogenic Diet
The ketogenic diet (KD) is a high-fat, adequate-protein, low-carbohydrate nutritional intervention that induces a metabolic state mimicking fasting, characterized by reduced blood glucose and elevated ketone bodies (β-hydroxybutyrate, acetoacetate, acetone) [101]. The KD targets the metabolic inflexibility of many tumors by:
- Reducing glucose availability, the preferred fuel for many cancer cells [101].
- Elevating ketone bodies, which may exert direct anti-tumor effects or serve as alternative fuels for normal tissues [101].
- Modulating signaling pathways including mTOR, AMPK, and HIF-1α [101].
- Reducing angiogenesis, inflammation, and peri-tumoral edema in preclinical glioma models [101].
In vitro studies indicate that increasing ketones such as β-hydroxybutyrate in the absence of glucose reduction can inhibit cancer cell growth and potentiate the effects of chemotherapy and radiation [101]. This suggests multiple mechanisms beyond simple glucose deprivation contribute to the anti-tumor effects of KD.
Specific Nutrient Restrictions
Beyond broad caloric restriction, targeted restriction of specific nutrients represents a more precise approach to exploiting metabolic vulnerabilities:
- Protein and amino acid restriction: Low-protein diets can significantly reduce tumor growth in certain cancers by modulating immune responses and amino acid metabolism [103]. Specific amino acid restrictions (e.g., methionine, leucine, glutamine) show promise in preclinical models [99].
- Carbohydrate restriction: Diets low in refined carbohydrates reduce glucose availability and insulin signaling, potentially slowing tumor progression [99].
- Fatty acid modulation: Altering dietary fat composition, including omega-3 to omega-6 ratios, may influence inflammation and tumor progression [103].
Table 2: Dietary Interventions and Their Metabolic Targets
| Dietary Approach | Key Components | Proposed Mechanisms | Evidence Level |
|---|---|---|---|
| Caloric Restriction | Reduced calorie intake, periodic fasting | Reduced growth factors, enhanced stress resistance, metabolic switching | Preclinical strong, limited clinical |
| Ketogenic Diet | High fat, low carbohydrate, adequate protein | Glucose reduction, ketone elevation, signaling pathway modulation | Preclinical strong, emerging clinical |
| Protein-Restricted Diet | Reduced total protein or specific amino acids | mTOR inhibition, amino acid stress, immune modulation | Preclinical moderate, limited clinical |
| Mediterranean Diet | Plant-based foods, fish, olive oil, whole grains | Anti-inflammatory, antioxidant, fiber and phytonutrient effects | Epidemiological strong, intervention limited |
| Fasting-Mimicking Diet | Periodic very low calorie, low protein regimens | Mimics fasting effects while maintaining nutrition | Preclinical strong, emerging clinical |
Quantitative Analysis of Dietary Intervention Outcomes
Preclinical Evidence
Preclinical studies provide compelling evidence for the anti-tumor efficacy of various dietary interventions. In mouse models of glioma, the ketogenic diet has been shown to reduce tumor growth, angiogenesis, inflammation, peri-tumoral edema, migration, and invasion while enhancing the activity of radiation and chemotherapy [101]. Similar results have been observed in other cancer types, including breast, pancreatic, and colorectal cancer models.
Quantitative analyses reveal that dietary interventions typically produce moderate but significant reductions in tumor growth, with combination approaches showing enhanced efficacy. The magnitude of effect varies considerably based on tumor type, genetic background, and specific dietary protocol employed.
Table 3: Quantitative Outcomes of Dietary Interventions in Preclinical Models
| Intervention | Cancer Model | Tumor Growth Reduction | Survival Benefit | Synergy with Therapy |
|---|---|---|---|---|
| Ketogenic Diet | Glioma (mouse) | 30-50% | 20-30% increase | Enhanced chemo/radiation efficacy |
| Fasting-Mimicking Diet | Breast cancer (mouse) | 40-60% | 25-40% increase | Chemotherapy protection and synergy |
| Caloric Restriction | Various models | 20-45% | 15-35% increase | Variable by cancer type and agent |
| Protein Restriction | Melanoma (mouse) | 25-55% | Not reported | Enhanced checkpoint inhibitor response |
| Amino Acid Restriction | Leukemia (mouse) | 35-70% | 30-50% increase | Chemotherapy sensitization |
Clinical Evidence
Clinical evidence for dietary interventions in cancer therapy is more limited but growing. A 2025 scoping review of nutritional interventions in advanced cancer identified 35 randomized controlled trials, with studies categorized into nutraceutical and herbal interventions, ketogenic diet, nutrition advice/support, oral nutrition supplements, and other nutritional interventions [104]. While some trials reported positive outcomes for quality of life, body composition, and treatment tolerability, the evidence remains insufficient for definitive recommendations, highlighting the need for larger, well-designed clinical trials [104].
Specific clinical findings include:
- Dietary advice and oral nutritional supplements sometimes appear to enhance treatment tolerance and improve nutritional status, though impact on overall survival was inconsistent [104].
- The ketogenic diet has demonstrated feasibility and potential therapeutic benefit in glioma patients, with ongoing clinical trials investigating optimal implementation [101].
- High-dose intravenous vitamin C combined with chemoradiotherapy yielded a 44.4% pathologic complete response rate in rectal cancer in one study [23].
- Low patient compliance in clinical trials of dietary interventions remains a significant challenge [102].
Experimental Methodologies and Research Tools
In Vitro Assessment of Metabolic Responses
Glucose deprivation assays evaluate cancer cell viability and proliferation under controlled nutrient conditions. Typical protocol:
- Seed cancer cells in standard medium overnight
- Replace with glucose-free medium supplemented with dialyzed fetal bovine serum
- Assess viability at 24, 48, and 72 hours using MTT, ATP-based, or resazurin assays
- Compare IC50 values for chemotherapeutic agents with and without glucose deprivation
Metabolic flux analysis measures real-time energy metabolism using Seahorse extracellular flux analyzers:
- Seed cells in specialized microplates and culture to 70-90% confluence
- Replace medium with unbuffered assay medium supplemented with relevant nutrients
- Sequentially inject metabolic modulators (glucose, oligomycin, 2-DG, etc.)
- Calculate glycolytic rates and mitochondrial function from oxygen consumption rate (OCR) and extracellular acidification rate (ECAR) measurements
In Vivo Dietary Intervention Studies
Ketogenic diet implementation in rodent models requires careful standardization:
- Formulate nutritionally complete diets with precise macronutrient ratios (typically 90% fat, 8% protein, 2% carbohydrate for strict KD)
- Acclimate animals gradually to prevent ketoacidosis and ensure adaptation
- Monitor blood glucose and ketone bodies regularly to verify metabolic state
- Pair-feed control animals to distinguish calorie restriction effects from ketosis-specific effects
Fasting-mimicking diet protocols typically involve:
- Development of specialized low-calorie, low-protein, high-fat diets
- Cyclic implementation (e.g., 3-5 day fasting periods followed by refeeding)
- Comprehensive monitoring of animal weight, activity, and metabolic parameters
- Assessment of tumor growth, metastasis, and treatment responses
The Scientist's Toolkit: Essential Research Reagents
Table 4: Key Research Reagents for Investigating Nutritional Interventions
| Reagent/Category | Specific Examples | Research Application |
|---|---|---|
| Metabolic Inhibitors | 2-deoxy-D-glucose (2-DG), Dichloroacetate (DCA), CB-839 | Targeting glycolysis, mitochondrial metabolism, glutaminase |
| Nutrient-Restricted Media | Glucose-free, glutamine-free, dialyzed serum | Creating controlled nutrient conditions in vitro |
| Metabolic Assays | Seahorse metabolic flux kits, ATP assays, lactate kits | Quantifying metabolic parameters and pathway activities |
| Ketogenic Diet Formulations | Bio-Serv F3666, Research Diets D13010101 | Standardized rodent diets for ketosis induction |
| Biomarker Assays | Glucose/ketone meters, ELISA for metabolic hormones | Monitoring systemic metabolic responses |
| Molecular Biology Tools | qPCR primers for metabolic genes, Western antibodies | Assessing expression of metabolic regulators |
Integration with Conventional Therapies
Chemotherapy and Radiotherapy
Dietary interventions may enhance the efficacy of conventional cancer therapies through multiple mechanisms. Caloric restriction and fasting-mimicking diets have been shown to protect normal cells from chemotherapy toxicity while sensitizing cancer cells, creating a therapeutic window [99] [103]. Proposed mechanisms include:
- Differential stress resistance: Normal cells activate protective pathways during nutrient scarcity, while cancer cells with constitutive growth signaling cannot adapt appropriately [99].
- Enhanced DNA damage: Nutrient restriction may impair DNA repair capacity in cancer cells, increasing chemotherapy-induced DNA damage [103].
- Modulation of drug metabolism: Altered nutrient status may affect the pharmacokinetics and pharmacodynamics of chemotherapeutic agents [99].
Radiotherapy response is also influenced by metabolic state, as tumor oxygenation and redox status significantly impact radiation sensitivity. Ketogenic diets may improve radiotherapy efficacy by reducing peri-tumoral edema and improving tumor oxygenation [101].
Immunotherapy
The emerging field of immunometabolism reveals intricate connections between nutrient availability, immune cell function, and anti-tumor immunity [1] [103]. Dietary interventions modulate immunotherapy responses through:
- Altering tumor microenvironment nutrient composition, affecting immune cell metabolism and function [1].
- Influencing immune cell polarization, particularly macrophage M1/M2 balance [103].
- Modifying gut microbiota composition, which in turn shapes systemic immunity [103].
- Affecting T cell exhaustion and checkpoint molecule expression [103].
Low-protein diets specifically have shown promise in enhancing checkpoint inhibitor immunotherapy in preclinical models by modulating amino acid availability for T cell function [103].
Visualization of Key Mechanisms and Pathways
Metabolic Pathways in Cancer Cells and Dietary Interventions
Diagram 1: Metabolic Pathways and Dietary Interventions. This diagram illustrates core metabolic pathways in cancer cells (yellow: glucose metabolism, green: mitochondrial metabolism, red: glutamine metabolism, blue: biosynthesis) and the points of intervention for various dietary approaches (gray). Caloric restriction and ketogenic diets primarily target glucose availability, while protein restriction affects glutamine metabolism. The ketogenic diet also increases ketone bodies, which can serve as alternative fuels for normal tissues but are often poorly utilized by cancer cells.
Signaling Pathways Regulating Cancer Metabolism
Diagram 2: Signaling Pathways in Cancer Metabolism Regulation. This diagram illustrates key signaling pathways that regulate metabolic reprogramming in cancer cells and how dietary interventions can modulate these pathways. Oncogenes (MYC, RAS) and growth factor signaling activate HIF-1 and PI3K/AKT/mTOR pathways, which promote glucose metabolism while suppressing mitochondrial function. Tumor suppressors like p53 support oxidative metabolism. Dietary interventions primarily target nutrient availability and growth factor signaling, indirectly influencing these regulatory networks.
Challenges and Future Directions
Clinical Translation Challenges
The translation of dietary interventions from promising preclinical findings to routine clinical practice faces several significant challenges:
- Metabolic heterogeneity: Tumors exhibit considerable diversity in their metabolic dependencies based on tissue of origin, genetic alterations, and microenvironmental factors [102] [100].
- Patient compliance: Maintaining strict dietary regimens presents practical challenges, particularly for patients experiencing cancer-related symptoms and treatment side effects [102] [104].
- Optimal timing and duration: The appropriate implementation window, duration, and cycling of dietary interventions relative to cancer therapy remain poorly defined [102].
- Biomarker development: Reliable biomarkers to identify patients most likely to benefit from specific dietary approaches are currently lacking [100].
- Potential interactions: Dietary interventions may potentially interact with cancer therapies in ways that could reduce efficacy in some contexts [104].
Emerging Research Frontiers
Several emerging areas represent promising directions for future research:
- Artificial intelligence and multi-omics integration: AI-driven analysis of high-dimensional data from single-cell sequencing, spatial metabolomics, and other omics technologies may identify novel metabolic vulnerabilities and predictive biomarkers [100].
- Microbiome-metabolism interactions: The gut microbiome significantly influences nutrient availability and immune function, creating complex interactions with dietary interventions that warrant further investigation [103].
- Novel cell death mechanisms: Connections between dietary interventions and non-apoptotic cell death pathways such as ferroptosis and cuproptosis represent an emerging research frontier [100].
- Personalized nutrition: Moving beyond one-size-fits-all approaches to develop personalized dietary interventions based on individual tumor metabolism, host factors, and treatment regimen [104] [100].
- Combination approaches: Strategic integration of dietary interventions with metabolic drugs, targeted therapies, and immunotherapies to create synergistic anti-tumor effects [23].
Nutritional interventions represent a promising class of metabolic adjuvants that exploit the unique metabolic dependencies and vulnerabilities of cancer cells. Grounded in the fundamental principles of cancer metabolism, dietary approaches including caloric restriction, ketogenic diets, and specific nutrient manipulations target the reprogrammed energy metabolism that supports tumor growth and therapy resistance. While preclinical evidence is compelling, clinical translation requires larger, well-designed trials that address metabolic heterogeneity, optimize intervention timing, and identify predictive biomarkers. The integration of dietary strategies with conventional therapies and emerging treatments like immunotherapy offers exciting possibilities for enhancing cancer treatment efficacy while potentially reducing side effects. As research in this field advances, personalized nutritional interventions based on individual tumor metabolism and host factors may become an integral component of precision oncology approaches.
Metabolic reprogramming is a fundamental hallmark of cancer pathogenesis, enabling tumor cells to sustain increased growth and proliferation rates despite nutrient-deficient microenvironments [105] [8]. While the "Warburg effect" (aerobic glycolysis) represents the most well-known example, cancer cells acquire numerous unique metabolic traits including enhanced antioxidant capacity, upregulated lipid metabolism, and glutamine addiction [105]. This metabolic plasticity is orchestrated through a complex interplay of genetic and protein-level alterations, driven by oncogene activation, tumor suppressor inactivation, and non-coding RNA-mediated regulation [8].
The metabolome provides a functional readout of this pathophysiological state, reflecting both genetic predisposition and dynamic environmental influences [106]. Unlike static genetic information, metabolic profiles capture the net result of genetic-environmental interactions, offering unique insights into tumor biology and creating opportunities for precision medicine through non-invasive metabolic profiling for tumor detection, monitoring, and biomarker identification [105]. This technical guide examines how patient stratification based on metabolic profiles is advancing precision oncology through early detection, prognosis prediction, and therapeutic guidance.
Analytical Technologies for Metabolic Profiling
No single experimental technique can profile the entire metabolome due to the vast chemical space and diverse properties of metabolites [105]. Consequently, comprehensive metabolic profiling requires multiple complementary technologies, each with distinct strengths and limitations.
Table 1: Core Analytical Technologies for Cancer Metabolomics
| Technology | Principle | Applications | Strengths | Limitations |
|---|---|---|---|---|
| Liquid Chromatography-Mass Spectrometry (LC-MS) | Separation in liquid phase followed by mass detection | Targeted and untargeted profiling of complex metabolite mixtures | High sensitivity and specificity; broad metabolite coverage | Matrix effects; requires multiple columns for comprehensive coverage |
| Gas Chromatography-MS (GC-MS) | Separation in gas phase followed by mass detection | Analysis of volatile compounds (e.g., free fatty acids) | High precision for volatile compounds; well-established libraries | Limited to thermally stable, volatile metabolites |
| Capillary Electrophoresis-MS (CE-MS) | Separation by electrophoretic mobility followed by mass detection | Analysis of polar and charged metabolites (e.g., amino acids, nucleotides) | Excellent separation of polar compounds; minimal sample preparation | Reproducibility challenges; less established |
| Nuclear Magnetic Resonance (NMR) Spectroscopy | Measurement of nuclear spin transitions in magnetic fields | Metabolic flux analysis using 13C-labeled tracers | Non-destructive; provides structural information; quantitative | Lower sensitivity compared to MS; limited metabolite coverage |
| Mass Spectrometry Imaging (MSI) | Spatial mapping of metabolite distributions on tissue sections | In situ metabolic heterogeneity; tumor microenvironment analysis | Spatial information preservation; untargeted discovery | Quantification challenges without internal standards |
Advanced Quantitative Methodologies
Recent advances address quantification challenges in spatial metabolomics. Quantitative MSI using uniformly 13C-labeled yeast extracts as internal standards enables pixel-wise normalization, overcoming matrix effects and allowing reliable quantification of over 200 metabolic features [107]. This approach has revealed previously undetectable remote metabolic remodeling in histologically unaffected tissues after stroke, demonstrating its sensitivity [107].
For metabolic flux analysis, 13C-labeled tracers (e.g., 13C-glucose, 13C-glutamine) combined with NMR or MS track isotope incorporation through pathways, quantifying metabolic rewiring in real-time [105]. This provides dynamic insights beyond static metabolite levels.
Metabolic Biomarkers for Patient Stratification
Diagnostic Stratification
Machine learning analysis of plasma metabolomes has identified specific biomarker panels that enable highly accurate cancer detection. A recent study utilizing LC-MS-based targeted metabolomics of 702 participants developed a 10-metabolite diagnostic model (10-DM) for gastric cancer with an AUROC of 0.967 in validation sets, significantly outperforming conventional protein markers like CA19-9 and CEA [108].
Table 2: Metabolic Biomarker Panels for Patient Stratification
| Application | Biomarker Panel | Performance Metrics | Biological Interpretation |
|---|---|---|---|
| Gastric Cancer Diagnosis | 10-metabolite signature (succinate, uridine, lactate, SAM, pyroglutamate, 2-aminooctanoate, neopterin, GlcNAc6p, serotonin, NMN) | Sensitivity: 0.905; Specificity: 0.926; AUROC: 0.967 [108] | Dysregulated glutathione metabolism; altered cysteine and methionine metabolism; oxidative stress |
| Gastric Cancer Prognosis | 28-metabolite prognostic signature | Superior to traditional clinical parameters (C-index not specified) [108] | Stratifies patients into risk groups for precision interventions |
| Early Disease Detection | Integrated genomic-metabolomic abnormalities (e.g., fructose/sorbitol for fructose intolerance) | 34-fold increase in sorbitol correlated with ALDOB mutation [106] | Identifies pathogenic variants and their functional metabolic consequences |
Prognostic Stratification and Risk Assessment
Beyond diagnosis, metabolic profiles enable prognostic stratification for treatment planning. Machine learning-derived prognostic models using metabolomic data demonstrate superior performance to traditional models based on clinical parameters alone [108]. These models effectively stratify patients into different risk groups, guiding precision interventions and personalized monitoring strategies.
Longitudinal metabolic profiling enhances risk assessment by capturing dynamic fluctuations. Studies show that even in fasting individuals, metabolite concentrations (e.g., acylcarnitines) are influenced by prior meal composition and physical activity, highlighting the importance of serial measurements for robust risk assessment [106].
Experimental Protocols for Metabolic Stratification
Protocol: LC-MS-Based Targeted Metabolomics for Patient Stratification
This protocol details the methodology used in the gastric cancer diagnostic study [108], which can be adapted for similar stratification purposes.
I. Sample Collection and Preparation
- Collect plasma samples in EDTA tubes from multi-center participants following standardized protocols
- Perform immediate centrifugation at 4°C (2,500 × g for 15 minutes)
- Aliquot plasma and store at -80°C until analysis
- Maintain consistent pre-analytical conditions across all collection sites to minimize technical variability
II. Metabolite Extraction
- Thaw plasma samples on ice
- Mix 50μL plasma with 200μL cold methanol containing internal standards for protein precipitation
- Vortex vigorously for 30 seconds, then incubate at -20°C for 1 hour
- Centrifuge at 14,000 × g for 15 minutes at 4°C
- Transfer supernatant to new tubes and dry under nitrogen stream
- Reconstitute dried extracts in 100μL LC-MS compatible solvent for analysis
III. LC-MS Analysis
- Chromatography System: UHPLC system with HILIC or reverse-phase column
- Mobile Phase:
- A: Water with 0.1% formic acid
- B: Acetonitrile with 0.1% formic acid
- Gradient: Optimized for separation of 147 targeted metabolites including amino acids, organic acids, nucleotides, vitamins, and acylcarnitines
- Mass Spectrometer: High-resolution tandem mass spectrometer with electrospray ionization
- Ionization Mode: Positive and negative ion switching for comprehensive coverage
- Data Acquisition: Targeted Selected Reaction Monitoring (SRM) for quantitative accuracy
IV. Data Processing and Analysis
- Process raw data using vendor software for peak integration and quantification
- Normalize metabolite levels using internal standards
- Perform quality control with pooled quality control samples
- Apply machine learning algorithms (LASSO regression for feature selection, random forest for classification)
- Validate models in independent test sets to ensure generalizability
Protocol: Spatial Quantitative Metabolomics Using MSI with 13C-Labeled Internal Standards
This advanced protocol enables spatial mapping of metabolic remodeling in tissue contexts [107].
I. Tissue Preparation and Standard Application
- Flash-freeze fresh tissue specimens in liquid nitrogen-cooled isopentane
- Cryosection at appropriate thickness (typically 10-20μm)
- Thaw-mount onto indium tin oxide-coated glass slides
- Prepare uniformly 13C-labeled yeast extracts according to published protocols
- Homogeneously spray 13C-labeled yeast extracts onto heat-inactivated tissue surfaces using automated sprayer
- Apply matrix (NEDC for negative mode) by automated spray deposition
II. MALDI-MSI Acquisition
- Use MALDI mass spectrometer with high mass resolution (e.g., TimsTOF flex MALDI2)
- Set laser spot size and frequency appropriate for desired spatial resolution
- Acquire data in negative ion mode for broad metabolite coverage
- Include both low and high mass range acquisitions
- Maintain consistent laser energy and step size across entire tissue section
III. Data Processing and Quantification
- Coregister optical images with MSI data for anatomical reference
- Perform pixel-wise normalization using 13C-labeled internal standards
- Generate spatial segmentation using unsupervised clustering (UMAP)
- Calculate metabolite ratios (e.g., GSSG/GSH) for functional assessment
- Compare with traditional normalization methods (RMS, TIC) to validate enhancement
Research Reagent Solutions
Table 3: Essential Research Reagents for Metabolic Profiling Studies
| Reagent/Category | Specific Examples | Function/Application | Technical Notes |
|---|---|---|---|
| Internal Standards | 13C-labeled yeast extracts; class-specific isotope-labeled lipids [107] | Pixel-wise normalization in MSI; quantification accuracy | Enables detection of remote metabolic remodeling; corrects for matrix effects |
| LC-MS Columns | HILIC columns; reverse-phase C18 columns [105] | Separation of metabolite mixtures with diverse chemical properties | Complementary techniques needed for comprehensive coverage |
| Metabolic Tracers | 13C1,2-glucose; 13C-glutamine; 13C-palmitic acid [105] | Metabolic flux analysis; pathway activity assessment | Different tracers illuminate specific pathways (e.g., glutaminolysis, FAO) |
| Sample Preparation Kits | Methanol-based protein precipitation kits; solid-phase extraction | Metabolite extraction; sample cleanup | Critical for reproducibility; minimizes ion suppression |
| Reference Materials | NIST SRM 1950; pooled human plasma [106] | Inter-laboratory standardization; quality control | Enables cross-study comparisons; validates analytical performance |
Pathway Diagrams and Metabolic Workflows
Metabolic Reprogramming in Cancer and Diagnostic Translation
Diagram 1: Metabolic reprogramming pathway from drivers to diagnostic application.
Experimental Workflow for Metabolic Patient Stratification
Diagram 2: End-to-end workflow for metabolic profiling-based patient stratification.
Clinical Translation and Therapeutic Implications
Targeting Metabolic Vulnerabilities in Cancer
Metabolic reprogramming directly contributes to therapy resistance by enhancing cancer cell adaptability [8]. Specific alterations confer treatment resistance through multiple mechanisms:
- Glycolytic Upregulation: Enhances resistance to chemotherapy and radiation by maintaining energy production and reducing reactive oxygen species [8]
- Glutamine Metabolism: Supports nucleotide biosynthesis and redox balance, conferring resistance to targeted therapies [8]
- Fatty Acid Oxidation: Promotes survival during metabolic stress and chemotherapeutic challenge [8]
- Amino Acid Dependency: Altered amino acid transport and metabolism mediate evasion of therapy-induced cell death [8]
Integration with Other Omics Platforms
Multi-omics integration enhances stratification accuracy by contextualizing metabolic findings within genomic and transcriptomic frameworks. Combined genomic-metabolomic analysis can:
- Measure penetrance of mutations of known pathogenicity [106]
- Uncover potentially damaging genetic variants through their functional metabolic consequences [106]
- Detect early signs of disease onset and drug response before clinical manifestation [106]
Case studies demonstrate how metabolomic profiling integrated with other omics technologies provides better insights into tumor biology and guides treatment strategies in patients [105].
Metabolic profiling represents a powerful tool for patient stratification in precision oncology, offering functional insights beyond genetic and transcriptomic analyses. The empirical success of metabolic biomarker panels in gastric cancer diagnosis and prognosis demonstrates the clinical potential of this approach [108]. However, several challenges remain in the widespread clinical implementation of metabolic stratification.
Future developments must focus on standardized protocols for cross-study comparisons, enhanced computational frameworks for data integration, and refined biological interpretation of metabolic findings. The identification of unknown metabolites, which can constitute up to 50% of signals in nontargeted metabolomics, represents both a challenge and opportunity for discovering novel biomarkers [106].
As metabolic profiling technologies continue to advance, particularly in spatial resolution and quantitative accuracy, patient stratification based on metabolic profiles will play an increasingly central role in precision oncology, enabling earlier detection, accurate prognosis prediction, and personalized therapeutic interventions tailored to the unique metabolic vulnerabilities of each patient's cancer.
Overcoming Therapeutic Resistance and Optimization Challenges
Metabolic reprogramming, a established hallmark of cancer, is now recognized as a critical facilitator of therapeutic resistance [109] [110] [8]. Tumor cells exhibit remarkable metabolic plasticity, allowing them to adapt their energy production and biosynthetic pathways to survive the stress induced by chemotherapeutic agents, targeted therapies, and immunotherapies [111] [112]. This adaptive rewiring involves shifts in glucose, amino acid, and lipid metabolism, driven by a complex interplay of oncogenic mutations, tumor suppressor gene loss, and non-coding RNA activity [8]. These alterations are further shaped by the unique conditions of the tumor microenvironment (TME), such as hypoxia and nutrient deprivation [110] [113]. The resulting metabolic phenotype not only supports cancer cell survival and growth but also activates compensatory pathways that bypass drug-induced cell death, leading to treatment failure [111] [112]. This whitepaper delves into the core metabolic mechanisms underpinning drug resistance, framing them within the broader context of tumor metabolism research, and provides a detailed overview of the experimental methodologies and reagent tools essential for investigating this evolving field.
Core Metabolic Adaptations Driving Resistance
Glucose Metabolic Reprogramming
The Warburg effect, or aerobic glycolysis, is a foundational metabolic abnormality in cancer, but its role evolves during the development of drug resistance [2] [110] [112]. Resistant cells often enhance their glycolytic capacity to generate ATP rapidly and produce biosynthetic intermediates, even as some may concurrently shift towards other energy sources [112].
- Key Enzymes and Transporters: The upregulation of glucose transporters (e.g., GLUT1) and key glycolytic enzymes like Hexokinase 2 (HK2) and the M2 isoform of Pyruvate Kinase (PKM2) is frequently observed in resistant phenotypes [110] [112]. PKM2 is particularly important as it fine-tunes glycolytic flux, diverting glucose carbons into branching pathways such as the pentose phosphate pathway (PPP) to generate NADPH for antioxidant defense [112].
- Therapeutic Targeting and Challenges: Inhibitors targeting HK2 (e.g., 2-Deoxy-D-glucose or 2-DG) and GLUT1 have been explored to sensitize tumors to chemotherapy [110]. For instance, combining 2-DG with doxorubicin or paclitaxel reduced tumor growth in non-small cell lung cancer models [110]. However, clinical translation has been hampered by toxicity issues, including hypoglycemic reactions and neurotoxicity, and the ability of cancer cells to activate compensatory metabolic pathways [110].
Table 1: Key Alterations in Glucose Metabolism Linked to Drug Resistance
| Metabolic Target | Alteration in Resistance | Functional Consequence | Therapeutic Inhibitor Examples |
|---|---|---|---|
| GLUT1 | Upregulation | Increased glucose uptake | GLUT1 inhibitors (preclinical) |
| Hexokinase 2 (HK2) | Upregulation | Increased glycolysis, inhibition of apoptosis | 2-Deoxy-D-glucose (2-DG) |
| PKM2 | Altered activity | Diverts flux to PPP for NADPH production | PKM2 activators/inhibitors (preclinical) |
| Pentose Phosphate Pathway (PPP) | Enhanced activity | Increased NADPH for redox balance & nucleotide synthesis | G6PD inhibitors (preclinical) |
Shift to Oxidative Phosphorylation (OXPHOS)
A significant adaptation in many resistant cancers is a metabolic shift from glycolysis towards mitochondrial oxidative phosphorylation (OXPHOS) [112] [114]. This shift provides a highly efficient means of ATP generation and fuels ABC transporters that efflux drugs from the cell [112].
- Mechanisms and Signaling: Cisplatin-resistant lung cancer cells, for example, demonstrate increased mitochondrial respiration, oxygen consumption, and elevated levels of reactive oxygen species (ROS) [109] [112]. While high ROS can be damaging, resistant cells often concurrently enhance their antioxidant systems (e.g., glutathione synthesis) to maintain redox homeostasis and utilize ROS as pro-tumorigenic signaling molecules [112] [114].
- Therapeutic Implications: This OXPHOS dependency creates a metabolic vulnerability. Drugs like Elesclomol, which disrupts mitochondrial metabolism, have been tested in clinical trials. When combined with paclitaxel, Elesclomol showed promise in increasing cancer cell death and survival times [112].
The following diagram illustrates the key metabolic shifts and compensatory pathways that cancer cells utilize to develop drug resistance:
Amino Acid and Lipid Metabolic Adaptations
Beyond glucose, the metabolism of amino acids and lipids is profoundly rewired to support the resistant state.
- Glutamine Addiction: Glutamine serves as a crucial nitrogen and carbon source, replenishing TCA cycle intermediates (anaplerosis) to fuel biosynthesis and energy production [2] [112]. Resistant cells often become "addicted" to glutamine. Inhibiting glutaminase (GLS), the enzyme that converts glutamine to glutamate, with drugs like Telaglenastat is under clinical investigation to overcome resistance [112].
- Fatty Acid Oxidation (FAO): Enhanced FAO provides an alternative energy source, especially in nutrient-poor conditions or during dormancy [115] [113]. It also contributes to redox balance by generating NADPH. Inhibition of Carnitine Palmitoyltransferase I (CPT1A), the rate-limiting enzyme for FAO, with etomoxir has shown efficacy in preclinical models but faces challenges with cardiac toxicity in clinical translation [8].
Table 2: Key Alterations in Amino Acid and Lipid Metabolism in Drug Resistance
| Metabolic Pathway | Key Enzyme/Transporter | Role in Resistance | Experimental/Therapeutic Inhibitors |
|---|---|---|---|
| Glutaminolysis | Glutaminase (GLS) | TCA anaplerosis, GSH synthesis | Telaglenastat (CB-839), Riluzole |
| Cysteine Uptake | xCT transporter (SLC7A11) | Precursor for glutathione synthesis | Sulfasalazine, Erastin |
| Fatty Acid Oxidation (FAO) | CPT1A | Alternative energy, NADPH production | Etomoxir, Perhexiline |
| De Novo Lipogenesis | ATP-citrate lyase (ACLY) | Membrane biosynthesis | TOFA, Hydroxycitrate |
The Tumor Microenvironment and Metabolic Crosstalk
The tumor microenvironment (TME) is a complex ecosystem where cancer cells interact with immune cells, cancer-associated fibroblasts (CAFs), and other stromal components [110] [113]. Metabolic reprogramming within the TME is a key mechanism of immune suppression and therapy resistance.
- Nutrient Competition: Cancer cells' aggressive consumption of glucose and glutamine creates a nutrient-depleted TME, which compromises the metabolic fitness and anti-tumor functions of effector T cells, which also rely on glycolysis for activation [113].
- Immunosuppressive Metabolites: The metabolic waste products of cancer cells, notably lactate from glycolysis, acidify the TME. This acidic pH inhibits T cell and natural killer cell function while promoting the activity of immunosuppressive cells like regulatory T cells (Tregs) and M2-like tumor-associated macrophages (TAMs) [116] [113]. This metabolic crosstalk establishes a formidable barrier to immunotherapy and other treatments.
Experimental Methodologies for Investigating Metabolic Resistance
Metabolomics and Flux Analysis
Metabolomics is an indispensable tool for profiling the global metabolic changes associated with drug resistance.
Protocol: Metabolite Extraction and Profiling via Mass Spectrometry (MS)
- Cell Culture and Treatment: Establish isogenic pairs of drug-sensitive and -resistant cancer cell lines. Culture cells to 70-80% confluence in standardized conditions.
- Metabolite Quenching and Extraction: Rapidly wash cells with ice-cold saline (0.9% NaCl) to halt metabolism. Extract metabolites using a 40:40:20 mixture of methanol:acetonitrile:water (v/v) at -20°C. Scrape cells and collect the supernatant.
- Centrifugation and Storage: Centrifuge extracts at high speed (e.g., 16,000 x g, 15 min, 4°C) to remove protein/debris. Transfer the clarified supernatant to MS vials and store at -80°C until analysis.
- LC-MS Analysis: Analyze samples using Liquid Chromatography-Mass Spectrometry (LC-MS). Employ reversed-phase chromatography (e.g., C18 column) for lipid and hydrophobic metabolite separation, and HILIC chromatography for polar metabolites. Use a high-resolution mass spectrometer (e.g., Q-TOF) for accurate mass detection in both positive and negative ionization modes.
- Data Processing: Use software (e.g., XCMS, Progenesis QI) for peak picking, alignment, and normalization. Identify metabolites by matching accurate mass and retention time against authentic standards in databases (e.g., HMDB, METLIN). Perform multivariate statistical analysis (PCA, PLS-DA) to identify differentially abundant metabolites [109].
Stable Isotope Tracing for Flux Analysis
- Isotope Labeling: Culture resistant and sensitive cells in media containing stable isotope-labeled nutrients (e.g., U-¹³C-glucose, ¹³C,¹⁵N-glutamine).
- Harvesting and Analysis: After a defined period (hours to days), harvest cells and extract metabolites as above.
- Mass Spectrometry and Flux Determination: Analyze extracts by LC-MS. Determine the incorporation of heavy isotopes into metabolic intermediates (e.g., TCA cycle metabolites, nucleotides). Use this data with computational models (e.g., Metabolic Flux Analysis) to quantify metabolic flux through specific pathways, revealing how resistance alters carbon and nitrogen utilization [109] [115].
Functional Metabolic Assays
Protocol: Mitochondrial Respiration Analysis via Seahorse XF Analyzer
- Cell Seeding: Seed a defined number of sensitive and resistant cells (e.g., 20,000 cells/well) into a Seahorse XF cell culture microplate and culture overnight.
- Assay Medium Preparation: On the day of the assay, replace growth medium with Seahorse XF Base Medium supplemented with 10 mM glucose, 1 mM pyruvate, and 2 mM glutamine (pH 7.4). Incubate cells for 45-60 min in a non-CO₂ incubator.
- Port Loading with Inhibitors:
- Port A: Load with 1.5 µM Oligomycin (ATP synthase inhibitor).
- Port B: Load with 1.0 µM FCCP (mitochondrial uncoupler).
- Port C: Load with 0.5 µM Rotenone/Antimycin A (Complex I/III inhibitors).
- Real-Time Measurement: Run the Seahorse XF Cell Mito Stress Test program. The instrument automatically measures the Oxygen Consumption Rate (OCR) after each injection, providing key parameters: basal respiration, ATP-linked respiration, proton leak, maximal respiratory capacity, and spare respiratory capacity. Resistant cells often show elevated basal and maximal respiration [112] [114].
Protocol: Extracellular Acidification Rate (ECAR) as a Proxy for Glycolysis
- Cell Preparation: Seed cells as for the OCR assay.
- Assay Medium: Use unbuffered Seahorse XF Base Medium supplemented with 2 mM glutamine.
- Port Loading for Glycolytic Stress Test:
- Port A: Load with 10 mM Glucose.
- Port B: Load with 1 µM Oligomycin (to force maximum glycolysis).
- Port C: Load with 50 mM 2-Deoxy-D-glucose (2-DG, a glycolytic inhibitor).
- Measurement: The assay measures ECAR after each injection, revealing key parameters: glycolytic capacity, glycolytic reserve, and non-glycolytic acidification [110].
The Scientist's Toolkit: Key Research Reagents
Table 3: Essential Reagents for Studying Metabolic Drug Resistance
| Reagent / Assay | Specific Example(s) | Primary Function / Application |
|---|---|---|
| Metabolic Pathway Inhibitors | 2-Deoxy-D-glucose (2-DG), Etomoxir, Telaglenastat (CB-839), Oligomycin, Rotenone | Functional probing of specific pathway dependencies (glycolysis, FAO, glutaminolysis, OXPHOS). |
| Stable Isotope Tracers | U-¹³C-Glucose, ¹³C₅,¹⁵N₂-Glutamine | Tracing nutrient fate and quantifying metabolic flux through pathways. |
| Seahorse XF Analyzer Kits | XF Cell Mito Stress Test Kit, XF Glycolytic Stress Test Kit | Real-time, live-cell analysis of mitochondrial respiration (OCR) and glycolytic flux (ECAR). |
| ROS & Redox Probes | CM-H₂DCFDA (general ROS), MitoSOX (mitochondrial superoxide) | Quantifying intracellular and mitochondrial reactive oxygen species levels. |
| Antibodies for Metabolic Proteins | Anti-HK2, Anti-PKM2, Anti-GLUT1, Anti-CPT1A | Assessing protein expression changes via Western Blot or Immunohistochemistry. |
| Genome Editing Tools | CRISPR/Cas9 (e.g., for knockout of PKM2, GLS) | Validating the functional role of specific metabolic genes in resistance. |
Metabolic reprogramming is an instrumental driving force behind cancer drug resistance, enabling tumor cells to adapt, compensate, and survive under therapeutic pressure. The shift from glycolysis to OXPHOS, the reliance on glutamine and fatty acids, and the dynamic metabolic crosstalk within the TME represent both mechanisms of resistance and potential therapeutic vulnerabilities. Future research must focus on overcoming the challenges of metabolic plasticity and toxicity associated with targeting these pathways. Promising strategies include the development of more selective inhibitors, combination therapies that simultaneously target multiple metabolic vulnerabilities or pair metabolic inhibitors with conventional chemotherapy and immunotherapy, and personalized treatment approaches based on the metabolic profile of individual tumors [112] [8]. A deep and nuanced understanding of these adaptive and compensatory metabolic mechanisms is paramount for the rational design of next-generation cancer therapies capable of overcoming drug resistance.
The therapeutic targeting of cancer metabolism represents a promising frontier in oncology, yet it is fraught with the persistent challenge of off-target effects. These effects, traditionally viewed as undesirable side effects, are now being re-evaluated as potential therapeutic opportunities when properly understood and managed. Metabolic reprogramming is a established hallmark of cancer cells, enabling their rapid proliferation, survival, and adaptation to hostile microenvironments [7]. This reprogramming encompasses profound alterations in key energy pathways including glycolysis, oxidative phosphorylation (OXPHOS), glutaminolysis, and lipid metabolism [7]. However, the very plasticity of metabolic networks that cancer cells exploit for survival also creates significant challenges for therapeutic intervention. Drugs targeting specific metabolic enzymes or pathways often encounter compensatory mechanisms through which cancer cells activate alternative routes to maintain energy production and biosynthetic capacity.
The context-dependent nature of metabolic dependencies further complicates therapeutic targeting. As noted by Sanju Sinha, PhD, of Sanford Burnham Prebys Medical Discovery Institute, "Sometimes the field looks at these [small-molecule] drugs with tunnel vision in terms of them having a single target along with some side effects labeled as 'off-target effects.' Taking a more holistic view reveals that small molecules can have different targets and effects depending on the disease and cell type" [97]. This insight underscores the need for advanced tools and methodologies that can systematically map both primary and secondary drug targets across different cellular contexts. The growing recognition of metabolic synthetic lethality—where the combination of a genetic mutation and a metabolic vulnerability leads to selective cancer cell death—offers a promising framework for designing therapies with improved selectivity [7].
Computational Approaches for Target Prediction and Validation
The development of sophisticated computational tools has revolutionized our ability to predict and understand off-target effects in metabolic therapies. DeepTarget, a recently developed open-source computational tool, exemplifies this advancement by integrating large-scale drug and genetic knockdown viability screens with omics data to determine comprehensive mechanisms of action for cancer drugs [97]. This approach represents a significant departure from traditional target identification methods that often focus primarily on chemical structure-based binding predictions.
DeepTarget Methodology and Performance
DeepTarget was developed using comprehensive data for 1,450 drugs across 371 cancer cell lines from the Dependency Map (DepMap) Consortium [117]. The tool's architecture integrates multiple data types:
- Genetic dependency screens: CRISPR-based knockout data to identify essential genes
- Drug sensitivity screens: Viability measurements across cell lines after drug treatment
- Omics data: Multi-dimensional molecular characterization of cell lines
- Mutation status: Information on specific oncogenic mutations
In benchmark testing across eight datasets of high-confidence drug-target pairs, DeepTarget outperformed currently used tools such as RoseTTAFold All-Atom and Chai-1 in seven out of eight tests for predicting drug targets and their mutation specificity [97]. The tool demonstrated particular strength in predicting context-specific target interactions, successfully identifying both primary and secondary targets across diverse cancer types.
Table 1: DeepTarget Performance Comparison Against Other Computational Tools
| Tool Name | Prediction Basis | Key Strength | Performance (8-test benchmark) |
|---|---|---|---|
| DeepTarget | Genetic/drug screens + omics data | Context-specific target prediction | Outperformed in 7/8 tests |
| RoseTTAFold All-Atom | Protein structure prediction | Direct binding prediction | Lower performance |
| Chai-1 | Chemical structure analysis | Binding site identification | Lower performance |
Case Study: Ibrutinib Target Prediction
The utility of DeepTarget was experimentally validated through a case study on Ibrutinib, an FDA-approved drug for blood cancers that targets Bruton's tyrosine kinase (BTK) [117]. Prior clinical observations indicated that Ibrutinib could effectively treat certain lung cancers, despite the absence of its primary target (BTK) in lung tumors. DeepTarget analysis predicted that in solid tumors with EGFR T790 mutations, Ibrutinib's primary target shifted from BTK to the mutant EGFR protein [97].
Experimental validation confirmed that cancer cells harboring the mutant EGFR form were significantly more sensitive to Ibrutinib, demonstrating the tool's ability to identify context-specific secondary targets that underlie both efficacy and potential off-target effects [117]. This case illustrates how computational prediction of secondary targets can reveal new therapeutic applications for existing drugs while also providing insights into their off-target effect profiles.
Experimental Methodologies for Metabolic Therapy Validation
Rigorous experimental validation is essential for confirming predicted drug targets and understanding their therapeutic implications. The following section outlines key methodological approaches for evaluating metabolic therapies and their off-target effects.
Target Deconvolution for Metabolic Agents
Comprehensive target identification for metabolic therapies requires a multi-faceted experimental approach:
- Viability assays: Dose-response measurements across diverse cell line panels to establish potency and selectivity patterns. These typically employ ATP-based (CellTiter-Glo) or resazurin reduction assays with 72-96 hour incubation periods.
- Genetic dependency correlation analysis: Comparison of drug sensitivity profiles with CRISPR-based gene essentiality data to identify synthetic lethal interactions and pathway dependencies.
- Metabolomic profiling: LC-MS-based quantification of metabolite levels following drug treatment to identify pathway perturbations and compensatory mechanisms.
- Functional validation: CRISPR/Cas9-mediated knockout or RNAi knockdown of predicted targets to confirm mechanism of action through rescue or enhanced sensitivity experiments.
- Binding assays: Surface plasmon resonance (SPR) or cellular thermal shift assays (CETSA) to directly measure drug-target interactions in relevant cellular contexts.
Validation Workflow for Context-Specific Targeting
The experimental workflow for validating context-specific metabolic targets, as demonstrated in the Ibrutinib case study, involves:
- Computational prediction of primary and secondary targets using tools like DeepTarget
- Cell line selection based on molecular features (e.g., mutation status, pathway activation)
- Dose-response profiling across selected models to confirm differential sensitivity
- Target engagement validation through western blotting of pathway components or direct binding assays
- Metabolic flux analysis using stable isotope tracers (e.g., 13C-glucose, 15N-glutamine) to quantify pathway usage
- In vivo confirmation in patient-derived xenograft models with relevant genetic backgrounds
Figure 1: Experimental Workflow for Validating Context-Specific Metabolic Targets
Therapeutic Targeting Strategies and Selectivity Enhancement
Advancements in understanding cancer metabolism have revealed multiple strategic approaches for enhancing the selectivity of metabolic therapies while managing off-target effects.
Exploiting Metabolic Synthetic Lethality
The concept of metabolic synthetic lethality provides a powerful framework for targeting cancer-specific vulnerabilities while sparing normal tissues. This approach capitalizes on the unique metabolic dependencies created by specific mutations in cancer cells [7].
Table 2: Metabolic Synthetic Lethality Opportunities in Cancer
| Cancer-Associated Mutation | Metabolic Vulnerability | Potential Therapeutic Approach |
|---|---|---|
| Succinate dehydrogenase (SDH) | Increased glycolysis dependency | GLUT1 inhibitors (e.g., WZB117) [7] |
| SDH deficiency | Glutamine metabolism dependence | Glutaminase inhibitors (e.g., GLS-1) [7] |
| Fumarate hydratase (FH) | Heme synthesis upregulation | HO-1 inhibitors [7] |
| FH deficiency | Argininosuccinate synthase dependency | ASS1 inhibition [7] |
| NOTCH1 mutation (T-ALL) | MYC/PI3K-AKT driven metabolism | Pathway-specific inhibitors [118] |
Targeting Metabolic Plasticity in Drug-Resistant Cancers
Cancer cells often develop resistance to therapies through metabolic adaptations, frequently shifting from glycolysis to oxidative phosphorylation (OXPHOS) to survive treatment [112]. This metabolic plasticity represents a key challenge but also an opportunity for therapeutic intervention. Drug-resistant cancer cells, particularly in aggressive tumors like NSCLC, melanoma, and breast cancer, demonstrate increased mitochondrial activity and reliance on OXPHOS [112]. This shift creates a new metabolic vulnerability that can be targeted with OXPHOS inhibitors.
The kynurenine pathway has emerged as another important target in resistant cancers, particularly in the context of immune evasion. This pathway contributes to an immunosuppressive tumor microenvironment through multiple mechanisms, including T-cell exhaustion and upregulation of immune checkpoint molecules like PD-L1 [112]. Targeting this pathway may therefore provide dual benefits by directly affecting cancer cell metabolism while simultaneously enhancing anti-tumor immunity.
The Scientist's Toolkit: Essential Research Reagents and Platforms
Advancing research on off-target effects in metabolic therapies requires a specialized set of research tools and platforms. The following table summarizes key resources for experimental investigation in this field.
Table 3: Research Reagent Solutions for Metabolic Therapy Development
| Tool/Platform | Primary Application | Key Features | Research Utility |
|---|---|---|---|
| DeepTarget [97] | Drug target prediction | Integrates genetic/drug screens + omics data | Identifies primary/secondary targets and context specificity |
| DepMap Consortium Data [117] | Cancer dependency mapping | 1,450 drugs across 371 cell lines | Correlation analysis for mechanism of action studies |
| Stable Isotope Tracers (13C/15N) [118] | Metabolic flux analysis | Enables tracking of nutrient fate in vivo | Measures pathway activity in patients and models |
| PathVisio [119] | Pathway analysis and visualization | Biological pathway drawing and analysis | Visualizes metabolic interactions and perturbations |
| CyTOF [118] | Single-cell metabolomics | High-dimensional quantitative data | Resolves metabolic heterogeneity in tumor populations |
| Surface Plasmon Resonance | Binding affinity measurement | Direct measurement of drug-target interactions | Quantifies binding constants for on/off-target interactions |
| Cellular Thermal Shift Assay (CETSA) | Target engagement in cells | Measures drug-induced protein stability | Confirms direct target engagement in relevant cellular contexts |
Metabolic Pathway Integration and Network Analysis
Understanding off-target effects requires a systems-level perspective that considers the interconnected nature of metabolic pathways. Computational frameworks that integrate knowledge of metabolic interactions with experimental data are proving valuable for diagnosing metabolic disturbances and predicting unintended consequences of therapeutic interventions [119].
Network-Based Analysis of Metabolic Disturbances
Network-based approaches enable researchers to visualize how inhibition of a specific metabolic enzyme creates ripple effects throughout interconnected pathways. These approaches integrate:
- Literature and expert knowledge into machine-readable pathway models
- Clinical biomarker data from patient samples
- Multi-omics data integration (genomics, transcriptomics, metabolomics)
- Visualization platforms such as Cytoscape for complex network analysis [119]
The proof-of-concept framework developed for diagnosing inherited metabolic disorders demonstrates how metabolic interaction knowledge can be integrated with clinical data in visualization platforms that reveal disturbances across multiple interconnected pathways [119]. This same approach can be applied to understand the network-wide effects of metabolic therapies in cancer.
Figure 2: Integrated Metabolic Network Showing Potential Off-Target Effect Pathways
Addressing the challenges of toxicity and selectivity in metabolic therapies requires a multifaceted approach that leverages advanced computational prediction, rigorous experimental validation, and strategic therapeutic design. The recognition that off-target effects are not merely side effects but potentially valuable therapeutic features represents a paradigm shift in the field. Tools like DeepTarget that can systematically map both primary and secondary targets across cellular contexts provide unprecedented opportunities for drug repurposing and selectivity enhancement.
The future of metabolic cancer therapy lies in developing increasingly sophisticated approaches for patient stratification based on metabolic vulnerabilities, designing combination therapies that anticipate and counter resistance mechanisms, and employing systems-level analyses to understand network-wide effects of metabolic interventions. As noted by Sinha, "Improving treatment options for cancer and for related and even more complex conditions like aging will depend on us improving both our ways to understand the biology as well as ways to modulate it with therapies" [97]. By embracing a more holistic view of drug targets and their context-dependent functions, researchers can transform the challenge of off-target effects into opportunities for therapeutic innovation.
Metabolic plasticity, the ability of cancer cells to dynamically reprogram their metabolic pathways, has emerged as a critical hallmark of cancer and a significant contributor to therapy resistance. This whitepaper examines the molecular mechanisms that enable cancer cells to switch between diverse fuel sources such as glucose, glutamine, fatty acids, and lactate, allowing them to survive and proliferate despite therapeutic challenges. We explore how oncogenic signaling, tumor microenvironmental stresses, and mitochondrial adaptability drive this metabolic flexibility, facilitating immune evasion and drug resistance. Furthermore, we detail current experimental methodologies for investigating metabolic plasticity and discuss emerging therapeutic strategies that target these adaptive mechanisms. Understanding and targeting metabolic plasticity provides promising avenues for overcoming treatment resistance in multiple cancer types.
Cancer cells exhibit profound alterations in their metabolic processes to support rapid growth, survival, and adaptation to hostile microenvironments. Metabolic plasticity defines the capacity of cancer cells to reprogram a plethora of metabolic pathways to meet unique energetic and biosynthetic needs during disease progression [120]. This flexibility enables cancer cells to switch between different carbon sources and metabolic pathways depending on substrate availability, environmental conditions, and therapeutic pressures.
The foundational observation of altered cancer metabolism dates back to Otto Warburg's discovery that tumor cells preferentially utilize glycolysis for energy production even in the presence of adequate oxygen - a phenomenon known as the Warburg effect or aerobic glycolysis [2] [7]. While this metabolic adaptation is less efficient in terms of ATP yield per glucose molecule, it supports rapid cell proliferation by providing both ATP and metabolic intermediates for biosynthetic processes, such as nucleotide and lipid synthesis [7]. Subsequent research has revealed that metabolic reprogramming in cancer extends far beyond glycolysis to encompass alterations in oxidative phosphorylation, glutaminolysis, lipid metabolism, and amino acid utilization [7].
Metabolic plasticity plays a particularly crucial role in enabling cancer cells to overcome progression hurdles, including tumor initiation, expansive growth, therapy resistance, metastasis, colonization, and relapse [120]. Cell state transitions - such as the acquisition of stem-like properties, activation of epithelial-mesenchymal transition (EMT), and development of drug resistance - require appropriate and timely reprogramming of cellular metabolism to support associated phenotypic changes [120].
Molecular Mechanisms of Metabolic Plasticity
Cancer cells demonstrate remarkable flexibility in utilizing various fuel sources to meet their energetic and biosynthetic demands:
Table 1: Primary Fuel Sources Utilized by Cancer Cells
| Fuel Source | Major Pathways | Primary Functions | Context of Preference |
|---|---|---|---|
| Glucose | Glycolysis, Pentose Phosphate Pathway | ATP production, nucleotide synthesis, redox balance | Aerobic and hypoxic conditions; Warburg effect |
| Glutamine | Glutaminolysis, TCA cycle anaplerosis | Nitrogen donation, TCA intermediate replenishment | Nutrient deprivation; "glutamine addiction" |
| Fatty Acids | β-oxidation, Lipogenesis | Membrane biosynthesis, energy storage, signaling | Starvation conditions; cancer stem cell maintenance |
| Lactate | Lactate shuttle, Oxidative phosphorylation | Secondary fuel source, intercellular signaling | Acidic tumor microenvironment; metabolic symbiosis |
| Ketone Bodies | Ketolysis, TCA cycle | Alternative carbon source | Low glucose availability |
Glucose Metabolism and the Warburg Effect
Enhanced glucose uptake and metabolism to lactate, even in the presence of adequate oxygen levels ("Warburg effect" or "aerobic glycolysis"), remains a widely recognized characteristic of cancer cells [2]. This preference for aerobic glycolysis is executed through the upregulation of glucose transporters (particularly GLUT1) and glycolytic enzymes, which allow cancer cells to quickly produce energy and metabolic intermediates that support growth and proliferation [2]. The Akt/mTOR/β-catenin stem cell pathway and hypoxia-inducible factor 1α (HIF1α) promote the synthesis of glycolytic enzymes and proteins, further enhancing glycolytic flux [120].
Glutamine Addiction
Many cancer cells develop dependence on glutamine, a condition termed "glutamine addiction" [112]. Glutamine serves as a critical substrate for replenishing the tricarboxylic acid (TCA) cycle (anaplerosis) and generating biosynthetic precursors needed for cell growth and survival [112] [7]. It provides nitrogen for nucleotide and amino acid biosynthesis and carbon skeletons for various metabolic pathways. Glutaminolysis - the conversion of glutamine into TCA cycle intermediates - is elevated in many cancer types, with enzymes such as glutaminase (GLS) frequently upregulated [7].
Lipid Metabolic Reprogramming
Alterations in lipid metabolism include enhanced de novo lipogenesis, increased lipid intake from the extracellular microenvironment, and enhanced lipid storage and mobilization from intracellular lipid droplets [2]. Cancer stem cells (CSCs) in breast cancer and leukemia-initiating cells appear to possess enhanced fatty acid oxidation (FAO) compared to non-CSCs for maintenance of stemness [120]. Lipid droplets are gaining prominence as metabolic adaptation organelles for CSCs, with higher levels correlated with increased tumorigenic potential in colorectal, breast, and ovarian cancers [120].
Beyond the primary nutrients, cancer cells can utilize various alternative carbon sources, including lactate, acetate, and ketone bodies [120] [121]. Monocarboxylate transporters (MCTs), particularly MCT1, facilitate the uptake of ketone bodies and lactate, supporting CSC-like breast cancer cells [120]. Inhibition of MCT-1 or treatment with mitoketoscins (which disrupt mitochondrial function) leads to tumor shrinkage and loss of stemness, highlighting the therapeutic potential of targeting alternative fuel utilization [120].
Regulatory Networks and Signaling Pathways
Multiple interconnected signaling pathways and regulatory networks control metabolic plasticity in cancer cells:
Figure 1: Regulatory Networks Controlling Metabolic Plasticity in Cancer Cells
The PI3K/AKT/mTOR pathway integrates signals from growth factors and nutrients to promote glucose uptake, glycolysis, and lipid synthesis [7]. MYC activation enhances the expression of glycolytic enzymes and glutaminolytic genes, supporting both glucose and glutamine metabolism [7]. HIF1α, stabilized under hypoxic conditions commonly found in tumors, increases the expression of glycolytic enzymes and glucose transporters, reinforcing the Warburg effect [120] [7]. AMPK acts as a cellular energy sensor, activating catabolic processes such as oxidative phosphorylation during energy stress [7].
Mutations in key metabolic enzymes also contribute to metabolic reprogramming. Mutations in isocitrate dehydrogenase (IDH), succinate dehydrogenase (SDH), and fumarate hydratase (FH) result in the accumulation of oncometabolites that alter cellular signaling and create unique metabolic dependencies [7]. For example, IDH mutations lead to production of the oncometabolite 2-hydroxyglutarate (2-HG), which inhibits DNA and histone demethylases, resulting in epigenetic alterations that promote tumorigenesis [7].
Metabolic Plasticity in Therapy Resistance
Drug-resistant cancer cells undergo significant metabolic reprogramming that allows them to survive chemotherapy, targeted therapies, and immunotherapies. This adaptation represents a major clinical challenge in oncology.
Metabolic Shifts in Drug-Resistant Cells
The metabolic phenotype of drug-resistant cells often differs markedly from their treatment-naïve counterparts:
Table 2: Metabolic Characteristics of Drug-Resistant Cancer Cells
| Therapy Challenge | Metabolic Adaptation | Molecular Mechanisms | Potential Targeting Strategies |
|---|---|---|---|
| Chemotherapy Resistance | Shift from glycolysis to OXPHOS | Increased mitochondrial activity, PGC1α activation, enhanced ETC function | Elesclomol (mitochondrial metabolism disruptor), Metformin (ETC complex I inhibitor) |
| Targeted Therapy Resistance | Enhanced glutamine metabolism | Upregulated glutaminase, increased glutamine transporter expression | Telaglenastat (GLS inhibitor), Riluzole (glutamate release inhibitor) |
| Immunotherapy Resistance | Tryptophan depletion, kynurenine production | IDO1/TDO upregulation, adenosine accumulation, lactate-mediated immunosuppression | Epacadostat (IDO1 inhibitor), MCT inhibitors |
| Radiation Resistance | Enhanced antioxidant capacity | Increased PPP flux, NADPH production, glutathione synthesis | PPP inhibitors, ROS-inducing agents |
We and others have reported that resistant non-small cell lung cancer (NSCLC) cells exhibit reduced glycolytic activity but show increased mitochondrial respiration, making them less sensitive to glycolysis-targeting therapies and more vulnerable to agents that disrupt mitochondrial function [112]. The shift toward oxidative metabolism (OXMET) is particularly evident in cisplatin-resistant lung cancer cells, where increased mitochondrial activity leads to elevated levels of reactive oxygen species (ROS) [112].
Cancer stem cells (CSCs), which contribute significantly to tumor relapse and therapeutic resistance, display distinct metabolic signatures. While some CSCs appear more glycolytic than bulk tumor cells, others preferentially rely on mitochondrial-powered oxidative phosphorylation (OXPHOS) [120]. Reconciling this paradox, recent evidence suggests that CSCs may display signatures of both glycolysis and OXPHOS, creating a hybrid metabolic phenotype that provides flexibility to adapt to varying microenvironmental conditions [120].
Role of the Tumor Microenvironment
The tumor microenvironment (TME) plays a crucial role in shaping metabolic plasticity and therapy resistance. Nutrient and oxygen deprivation within the TME, resulting from heightened nutrient consumption and compromised tumor vascular supply, creates metabolic stresses including acidosis, hypoxia, and nutrient competition [49].
Metabolic coupling between cancer cells and stromal cells further enhances metabolic adaptability. For instance, cancer-associated fibroblasts (CAFs) can undergo aerobic glycolysis and secrete lactate, which can then be taken up by adjacent cancer cells and used as a fuel source for oxidative metabolism - a phenomenon known as the "reverse Warburg effect" [116]. This metabolic symbiosis allows cancer cells to optimize their energy production by effectively "outsourcing" glycolysis to stromal cells [116].
The acidic microenvironment resulting from lactate accumulation fosters tumor progression while inhibiting the activity of T cells and natural killer cells, facilitating immune evasion [116]. Additionally, the aggressive uptake of glutamine by tumor cells limits its availability to immune cells, thereby suppressing antitumor immune responses [116].
Experimental Approaches for Studying Metabolic Plasticity
Methodologies for Metabolic Analysis
Investigating metabolic plasticity requires a combination of techniques to capture the dynamic nature of cancer cell metabolism:
Bulk Metabolomics
Bulk metabolomics involves the detection and quantification of all metabolites from samples such as in vitro cultured cells, tissues, and biofluids [122]. Analytical platforms include nuclear magnetic resonance (NMR) and various mass spectrometry approaches (GC-MS, LC-MS, CE-MS). These platforms produce spectra or chromatograms consisting of thousands of peaks, each corresponding to one or more unique compounds. Spectral deconvolution matches these peaks to specific chemical compounds using reference databases [122].
Protocol: LC-MS-Based Metabolomics for Cancer Cells
- Cell Quenching: Rapidly cool cells to -80°C to arrest metabolic activity
- Metabolite Extraction: Use 80% methanol/water at -20°C for intracellular metabolite extraction
- Sample Analysis: Employ reversed-phase or HILIC chromatography coupled to high-resolution mass spectrometry
- Data Processing: Utilize software such as XCMS or Progenesis QI for peak picking, alignment, and normalization
- Statistical Analysis: Apply multivariate statistics (PCA, PLS-DA) to identify differentially abundant metabolites
- Pathway Analysis: Map alterations to metabolic pathways using databases like KEGG or MetaboAnalyst
Single-Cell Metabolomics
Single-cell metabolomics techniques address tumor heterogeneity by measuring metabolic profiles at the individual cell level. Reported techniques include secondary ion mass spectrometry (SIMS), matrix-assisted laser desorption/ionization mass spectrometry (MALDI-MS), and live-single-cell video mass spectrometry [122]. These approaches have been used to detect significant cell-to-cell metabolic differences, identify metabolic distinctions between CSCs and non-CSCs, and discriminate between breast cancer subtypes [122].
Spatial Metabolomics
Spatial metabolomics enables the quantitative, qualitative, and localization analysis of metabolites within tissue samples using mass spectrometry imaging (MSI) techniques [122]. This approach preserves spatial information about metabolite distribution, revealing metabolic heterogeneity within tumors and the distribution of small molecules in relation to histological features.
Protocol: MALDI-MSI for Tumor Tissue Sections
- Tissue Preparation: Flash-freeze fresh tissue specimens in liquid N₂ and cryosection at 5-20μm thickness
- Matrix Application: Apply matrix solution (e.g., DHB for lipids, CHCA for metabolites) uniformly using a sprayer
- Data Acquisition: Use a MALDI-TOF/TOF or Orbitrap mass spectrometer with spatial resolution of 10-100μm
- Image Processing: Reconstruct ion images for specific m/z values using specialized software
- Integration with Histology: Correlate metabolic images with H&E-stained consecutive sections
Metabolic Flux Analysis
Metabolic flux analysis measures the rates of metabolic reactions through pathways, providing dynamic information about pathway utilization.
Protocol: Seahorse XF Analyzer for Real-Time Metabolic Measurements
- Cell Seeding: Plate cells in specialized XF microplates at optimized density
- Assay Medium Preparation: Use unbuffered DMEM supplemented with relevant nutrients (glucose, glutamine, pyruvate)
- Inhibitor Preparation: Load port A with oligomycin (ATP synthase inhibitor), port B with FCCP (mitochondrial uncoupler), and port C with rotenone/antimycin A (ETC inhibitors)
- Measurement: Run the XF Cell Mito Stress Test program with mixing, waiting, and measuring cycles
- Data Analysis: Calculate key parameters: basal respiration, ATP-linked respiration, maximal respiration, and spare respiratory capacity
The Scientist's Toolkit: Essential Research Reagents
Table 3: Key Reagents for Investigating Cancer Metabolic Plasticity
| Reagent/Category | Function/Application | Example Specific Agents |
|---|---|---|
| Metabolic Inhibitors | Target specific metabolic pathways to assess dependency | 2-DG (glycolysis), Elesclomol (OXPHOS), Telaglenastat (glutaminolysis), WZB117 (GLUT1 inhibitor) |
| Isotopic Tracers | Track nutrient utilization through metabolic pathways | ¹³C-Glucose, ¹³C-Glutamine, ¹⁵N-Glutamine for LC-MS-based flux analysis |
| Fluorescent Metabolic Probes | Visualize nutrient uptake and mitochondrial function | 2-NBDG (glucose analog), TMRM (mitochondrial membrane potential), BODIPY dyes (lipid droplets) |
| Genomic Tools | Modulate expression of metabolic genes | CRISPR/Cas9 systems for gene knockout, siRNA/shRNA for gene silencing, ORFs for overexpression |
| Biosensors | Real-time monitoring of metabolic parameters | FRET-based ATP/NADH biosensors, lactate biosensors, pH-sensitive fluorescent proteins |
| Cell Culture Models | Recapitulate tumor microenvironment | 3D organotypic cultures, co-culture systems, hypoxia chambers, nutrient-deprived media |
Therapeutic Targeting of Metabolic Plasticity
The dependence of cancer cells on specific metabolic pathways presents therapeutic opportunities that can be exploited. However, the inherent plasticity of cancer metabolism necessitates strategic approaches to overcome adaptive resistance.
Current Metabolic Targeting Strategies
Several metabolic inhibitors are currently in clinical development or approved for cancer therapy:
Glycolysis Inhibitors: 2-deoxy-D-glucose (2-DG) competes with glucose for hexokinase, the first enzyme in glycolysis [121]. Though showing promise preclinically, its efficacy as a single agent has been limited, likely due to metabolic adaptability [7].
Glutaminolysis Inhibitors: Telaglenastat (CB-839) is an oral glutaminase inhibitor that has shown activity in combination with standard therapies in clinical trials for renal cell carcinoma and other solid tumors [112].
Mitochondrial Inhibitors: Elesclomol disrupts mitochondrial metabolism by inducing oxidative stress and has shown increased cancer cell death and improved survival when used with paclitaxel in clinical trials [112]. Metformin, an electron transport chain complex I inhibitor, demonstrates anti-cancer activity in preclinical models and epidemiological studies [112].
Lipid Metabolism Modulators: Statins (HMG-CoA reductase inhibitors) and fatty acid synthase (FASN) inhibitors target lipid metabolism, disrupting membrane biosynthesis and energy production in cancer cells [7].
Overcoming Resistance Through Combination Approaches
The metabolic plasticity of cancer cells means that targeting a single pathway often leads to adaptive resistance through compensatory mechanisms. Combination strategies that simultaneously target multiple metabolic dependencies or pair metabolic inhibitors with conventional therapies show greater promise:
Vertical Inhibition: Combining inhibitors targeting different steps within the same pathway (e.g., glucose transport + hexokinase inhibition) to prevent compensatory flux through the targeted pathway.
Parallel Pathway Inhibition: Simultaneously targeting complementary metabolic pathways (e.g., glycolysis + glutaminolysis) to cut off alternative fuel sources [7].
Metabolic-Immunotherapy Combinations: Pairing metabolic inhibitors with immune checkpoint blockade to address both metabolic and immune evasion mechanisms [112] [49]. For example, IDO1 inhibitors have been tested in combination with anti-PD-1/PD-L1 therapies, though with mixed clinical results to date [112].
Synthetic Lethal Approaches: Exploiting specific genetic mutations that create unique metabolic vulnerabilities. For instance, tumors with mutations in TCA cycle enzymes such as SDH or FH display increased sensitivity to inhibition of specific pathways such as glycolysis or glutaminolysis [7].
Metabolic plasticity represents a fundamental adaptive mechanism that enables cancer cells to survive therapeutic challenges and propagate in demanding microenvironmental conditions. The dynamic nature of cancer metabolism - with flexible fuel source switching, pathway redundancies, and complex regulatory networks - poses significant challenges for successful therapeutic intervention. However, advances in our understanding of the molecular mechanisms governing metabolic plasticity, coupled with innovative experimental approaches for studying tumor metabolism, are revealing new vulnerabilities that can be therapeutically exploited.
Future research directions should focus on deciphering the temporal dynamics of metabolic adaptation, developing predictive biomarkers to identify metabolic dependencies in individual tumors, and designing intelligent combination therapies that preemptively block common resistance pathways. The integration of spatial metabolomics with other omics technologies will further enhance our understanding of metabolic heterogeneity within tumors and its relationship to treatment response. Ultimately, targeting metabolic plasticity represents a promising strategy for overcoming therapeutic resistance and improving outcomes for cancer patients.
Metabolic reprogramming is a established hallmark of cancer, enabling tumor cells to fulfill the augmented energy and building block requirements for their rapid proliferation and survival [123] [124]. However, this reprogramming extends beyond the autonomous adaptation of cancer cells; it actively sculpts the tumor microenvironment (TME) to foster immunosuppression [8]. The altered metabolic activity of tumors leads to nutrient depletion and the accumulation of specific metabolites, which can severely impair the function of infiltrating immune cells [125] [126]. Among these metabolites, lactate, prostaglandin E2 (PGE2), and kynurenine have emerged as key mediators of therapy failure, creating a formidable barrier to the success of both conventional treatments and modern immunotherapies [8] [127]. This whitepaper delves into the mechanisms by which these metabolites drive immunosuppression and provides a detailed guide for researchers aiming to investigate these pathways.
Metabolic Reprogramming and the Immunosuppressive Niche
The TME is often characterized by nutrient deprivation, hypoxia, and acidity [8]. Tumor cells adapt to these conditions by shifting their metabolic pathways, a process controlled by cancer driver mutations and environmental nutrient availability [123]. A pivotal metabolic alteration is the "Warburg effect" or aerobic glycolysis, where cancer cells preferentially utilize glycolysis for energy production even in the presence of oxygen [125] [23]. This shift, while less efficient for energy production per glucose molecule, allows for rapid ATP generation and provides intermediate metabolites for biosynthetic pathways that support uncontrolled growth [124].
This metabolic rewiring creates a hostile niche for immune cells. The competition for essential nutrients like glucose and glutamine between tumor and immune cells can limit the resources available for effector T cell functions [125] [8]. Furthermore, the metabolic byproducts of tumor cells, particularly lactate, PGE2, and kynurenine, accumulate in the TME and directly suppress anti-tumor immunity [8] [126]. These metabolites act through distinct yet interconnected mechanisms to inhibit immune effector cells while promoting the activity and differentiation of immunosuppressive cells, such as regulatory T cells (Tregs) and myeloid-derived suppressor cells (MDSCs) [125] [127]. The resulting immunosuppressive microenvironment facilitates tumor immune evasion and confers resistance to a wide range of therapies [8].
Key Immunosuppressive Metabolites: Mechanisms and Experimental Analysis
Lactate
Lactate, once considered a mere waste product of glycolysis, is now recognized as a key immunosuppressive metabolite and signaling molecule in the TME. Its production is a direct consequence of the Warburg effect [125] [127].
Mechanism of Action: Lactate is exported from tumor cells via monocarboxylate transporters (MCTs), such as MCT4, leading to its accumulation and acidification of the TME [128]. This acidic environment directly impairs the cytolytic function of effector cells like Natural Killer (NK) cells and cytotoxic T cells [125]. Lactate inhibits NF-κB signaling in NK cells, reducing their interferon (IFN)-γ production and granzyme B secretion, which are critical for target cell killing [125]. In CD8+ T cells, lactate suppresses mTOR signaling, leading to decreased proliferation and effector function [125]. Furthermore, lactate induces the differentiation of tumor-associated macrophages (TAMs) towards an M2-like, pro-tumorigenic phenotype and enhances the immunosuppressive capacity of Tregs [125]. A novel mechanism involves lactylation, a post-translational modification where lactate-derived lactyl groups are added to lysine residues on histones and other proteins [127]. In pancreatic cancer, for example, elevated glycolytic flux leads to histone H3 lysine 18 lactylation (H3K18la), which promotes the expression of genes involved in tumor progression [127].
Experimental Protocols:
- Measuring Lactate in TME: Lactate concentrations in cell culture supernatants or tumor interstitial fluid can be quantified using a commercial lactate assay kit (colorimetric or fluorometric). For in vivo measurement, microdialysis probes can be implanted into tumors in live animals to sample the extracellular fluid.
- Assessing T cell Function: Isolate CD8+ T cells from mouse spleen or human PBMCs. Activate T cells with anti-CD3/CD28 beads in the presence of a physiological range of sodium lactate (e.g., 10-20 mM). After 72 hours, assess proliferation via CFSE dilution or EdU assay, and measure IFN-γ production by intracellular cytokine staining followed by flow cytometry.
- Investigating Lactylation: To detect protein lactylation, use specific anti-lactyl-lysine antibodies for western blotting or immunofluorescence. For histone lactylation, perform chromatin immunoprecipitation (ChIP) with an anti-H3K18la antibody, followed by qPCR to identify bound DNA sequences.
Kynurenine
Kynurenine is a major catabolite of the essential amino acid tryptophan, generated through the activity of indoleamine 2,3-dioxygenase 1 (IDO1) or tryptophan 2,3-dioxygenase (TDO) [124].
Mechanism of Action: Kynurenine mediates immunosuppression through two primary mechanisms: tryptophan depletion and direct signaling via the aryl hydrocarbon receptor (AhR). Tryptophan starvation activates the integrated stress response in T cells, leading to cell cycle arrest and anergy [124]. Kynurenine itself acts as an endogenous ligand for AhR. AhR activation in CD4+ T cells promotes their differentiation into FoxP3+ Tregs while suppressing the development of pro-inflammatory Th17 and Th1 cells [124]. This creates a positive feedback loop that reinforces immune tolerance. IDO1 expression in dendritic cells is a key source of kynurenine in the TME, and its activity has been shown to facilitate colitis-associated tumorigenesis in mouse models [124].
Experimental Protocols:
- In vitro IDO1 Activity Assay: Treat human dendritic cells or tumor cell lines with IFN-γ (100 ng/mL for 24-48 hours) to induce IDO1 expression. Collect culture supernatants and measure kynurenine concentration using HPLC or a commercial kynurenine ELISA kit.
- T cell Suppression Assay: Differentiate naive CD4+ T cells into Tregs by activating them with anti-CD3/CD28 in the presence of TGF-β and kynurenine (e.g., 50-100 µM) for 5 days. Analyze FoxP3 expression by flow cytometry. To test functional suppression, co-culture these kynurenine-induced Tregs with CFSE-labeled effector T cells and assess the suppression of effector T cell proliferation.
- AhR Signaling Studies: Transfert a luciferase reporter construct under the control of AhR-responsive elements (e.g., DRE/XRE) into T cells or a reporter cell line. Treat cells with kynurenine and measure luciferase activity to quantify AhR pathway activation.
Prostaglandin E2 (PGE2)
PGE2 is a lipid mediator synthesized from arachidonic acid by the sequential actions of cyclooxygenase-2 (COX-2) and prostaglandin E synthases [8].
Mechanism of Action: PGE2 exerts its effects by binding to four G-protein-coupled receptors (EP1-EP4), with EP2 and EP4 being primarily responsible for immunomodulation. PGE2 signaling through these receptors activates adenylate cyclase, increasing intracellular cAMP levels. In T cells, elevated cAMP inhibits TCR signaling, proliferation, and cytokine production (e.g., IL-2, IFN-γ, TNF-α) [8]. PGE2 also promotes the expansion and functional activity of MDSCs and drives the polarization of macrophages towards an M2-like, immunosuppressive state [8]. Furthermore, PGE2 can enhance the expression of PD-L1 on tumor and myeloid cells, further contributing to T cell exhaustion and resistance to immune checkpoint blockade therapy [8].
Experimental Protocols:
- PGE2 Measurement: Quantify PGE2 levels in cell culture supernatants or tumor homogenates using a commercial PGE2 ELISA kit. Sample preparation often requires solid-phase extraction to purify and concentrate the analyte.
- T cell cAMP Assay: Isolate human or mouse T cells and stimulate them with anti-CD3 in the presence of PGE2 (e.g., 1 µM) for 1-2 hours. Use a commercial cAMP ELISA or a FRET-based biosensor to measure intracellular cAMP levels.
- MDSC Functional Assay: Differentiate MDSCs from mouse bone marrow progenitors using GM-CSF and IL-6. During differentiation, add PGE2 (1 µM). After 4-5 days, harvest the cells and co-culture them with activated T cells. Use a flow cytometry-based suppression assay to measure the inhibition of T cell proliferation (CFSE dilution) and IFN-γ production.
Table 1: Summary of Key Immunosuppressive Metabolites
| Metabolite | Producing Enzyme/Pathway | Primary Immune Targets | Key Immunosuppressive Mechanisms | Associated Therapy Resistance |
|---|---|---|---|---|
| Lactate | Lactate Dehydrogenase A (LDHA) / Aerobic Glycolysis | CD8+ T cells, NK cells, Macrophages | - Acidification of TME [125]- Impaired cytolytic function & cytokine production [125]- Induction of M2 macrophage polarization [125]- Histone lactylation (e.g., H3K18la) [127] | Chemotherapy, Radiotherapy, Immunotherapy [8] |
| Kynurenine | Indoleamine 2,3-dioxygenase 1 (IDO1) / Tryptophan Catabolism | CD4+ T cells, CD8+ T cells | - Tryptophan depletion & T cell anergy [124]- Activation of Aryl Hydrocarbon Receptor (AhR) [124]- Promotion of Treg differentiation [124] | Immunotherapy (ICI), Chemotherapy [124] |
| Prostaglandin E2 (PGE2) | Cyclooxygenase-2 (COX-2) / Arachidonic Acid Metabolism | T cells, MDSCs, Dendritic Cells | - Elevated cAMP levels inhibiting T cell function [8]- Expansion & activation of MDSCs [8]- Induction of M2 macrophage polarization [8]- Upregulation of PD-L1 [8] | Chemotherapy, Targeted Therapy, Immunotherapy [8] |
Table 2: Quantitative Data on Metabolite Concentrations and Effects
| Metabolite | Reported Concentration in TME | Experimental Concentrations for In Vitro Studies | Key Readouts & Effect Size |
|---|---|---|---|
| Lactate | 10-30 mM (tumor interstitial fluid) [125] | 10-20 mM (sodium lactate) | - ~60-80% reduction in IFN-γ from NK cells [125]- ~50% reduction in T cell proliferation [125] |
| Kynurenine | Varies widely; µM to high µM range [124] | 50-100 µM | - ~2-3 fold increase in Treg differentiation [124]- ~40-60% reduction in T cell proliferation |
| PGE2 | ng/mg protein range in tumor lysates [8] | 0.1 - 1.0 µM | - ~5-10 fold increase in cAMP in T cells [8]- ~2 fold enhancement of MDSC suppressive capacity [8] |
Visualizing the Immunosuppressive Metabolic Network
The following diagram illustrates the interconnected metabolic pathways through which lactate, kynurenine, and PGE2 are produced by tumor cells and subsequently impair immune cell function in the TME.
The Scientist's Toolkit: Research Reagent Solutions
Table 3: Essential Reagents for Investigating Immunosuppressive Metabolites
| Reagent / Tool | Category | Example Product ID / Model | Primary Function in Research |
|---|---|---|---|
| Lactate Assay Kit | Biochemical Assay | Sigma-Aldrich MAK064 / Abcam ab65331 | Colorimetric/Fluorometric quantification of lactate in cell culture supernatants or biological fluids. |
| Anti-H3K18la Antibody | Antibody | PTM Biolabs PTM-1406RM | Detection of histone lactylation marks via Western Blot, Immunofluorescence, or ChIP-seq. |
| Recombinant IDO1 Protein | Enzyme | R&D Systems 6058-ID | In vitro enzymatic activity assays to screen for IDO1 inhibitors. |
| Kynurenine ELISA Kit | Immunoassay | Immundiagnostik AG KSYE1100 / Cloud-Clone Corp CEA458Ge | Sensitive and specific quantification of kynurenine levels in complex samples. |
| AhR Reporter Kit | Cell-based Assay | Indigo Biosciences IB00101 | Luciferase-based reporter system to measure AhR pathway activation by kynurenine. |
| PGE2 ELISA Kit | Immunoassay | Cayman Chemical 514531 / R&D Systems KGE004B | Quantification of PGE2 concentration in cell culture media and tissue homogenates. |
| EP2/EP4 Receptor Antagonists | Small Molecule Inhibitor | Cayman Chemical 10004989 (EP2); 10006864 (EP4) | Pharmacological tools to dissect the specific roles of PGE2 receptors EP2 and EP4. |
| cAMP ELISA Kit | Immunoassay | Enzo Life Sciences ADI-900-066 | Direct measurement of intracellular cAMP levels in immune cells upon PGE2 stimulation. |
| FX500 Pro System | Instrumentation (LC-MS/MS) | SCIEX | Gold-standard for targeted, multiplexed quantification of metabolites (lactate, kynurenine, etc.) in complex samples. |
The metabolites lactate, PGE2, and kynurenine are not merely byproducts of tumor metabolism but are active drivers of an immunosuppressive TME that leads to therapy failure. Understanding their production, mechanisms of action, and interplay is crucial for developing novel therapeutic strategies. Targeting these pathways—through inhibitors of lactate production or export, IDO1 inhibitors, or COX-2/PGE2 signaling blockers—holds significant promise for overcoming resistance to chemotherapy and immunotherapy. Future research should focus on elucidating the complex crosstalk between these metabolic pathways and on developing effective combination therapies that simultaneously disrupt multiple immunosuppressive axes to restore anti-tumor immunity.
Cancer cells undergo profound metabolic reprogramming to support their rapid growth, survival, and adaptation to hostile microenvironments. This reprogramming encompasses characteristic alterations including enhanced glucose uptake with lactate production even under aerobic conditions (the Warburg effect), increased glutaminolysis to fuel biosynthetic pathways, and dysregulated lipid and nucleotide metabolism [2] [7]. These adaptations are not merely collateral effects but are driven by oncogenes, tumor suppressor genes, and microenvironmental factors, establishing metabolic pathways as promising therapeutic targets [124] [7]. However, the inherent metabolic plasticity of cancer cells often enables resistance to single-agent therapies, leading to treatment failure [2] [7]. This reality necessitates sophisticated combination approaches that strategically consider timing, sequencing, and dosing to outmaneuver adaptive resistance mechanisms and achieve durable therapeutic efficacy.
The development of effective combination regimens requires a deep understanding of the dynamic interactions between targeted agents, chemotherapeutics, and immunotherapies within the context of the tumor microenvironment (TME). The TME is characterized by nutrient competition, hypoxia, and metabolic crosstalk between tumor cells and stromal components, all of which influence treatment response [116] [124]. Rational combination design must therefore account for these complexities, targeting multiple metabolic vulnerabilities simultaneously or sequentially to induce synthetic lethality and prevent compensatory pathway activation [129] [7]. This technical guide provides a comprehensive framework for designing and optimizing combination schedules, integrating current research insights and experimental methodologies to advance therapeutic strategies against metabolically reprogrammed cancers.
Key Metabolic Pathways and Combination Targets
Central Metabolic Pathways in Cancer
Cancer cells exploit multiple interconnected metabolic pathways to meet their bioenergetic and biosynthetic demands. The most prominent alterations occur in glucose, glutamine, and lipid metabolism, each offering distinct targeting opportunities.
Glucose Metabolism (Warburg Effect): Characterized by upregulated glucose transporters (e.g., GLUT1) and glycolytic enzymes (e.g., HK2, PKM2, LDHA) even in oxygen-rich conditions. This provides rapid ATP generation and glycolytic intermediates for biosynthesis while acidifying the TME to promote immune evasion [2] [124] [7]. Key targets include GLUT inhibitors (e.g., WZB117), HK2 inhibitors, and LDHA inhibitors.
Glutamine Metabolism: Many cancers become glutamine-addicted, relying on glutaminolysis to generate TCA cycle intermediates (anaplerosis), produce nucleotides, and maintain redox balance. Key enzymes like glutaminase (GLS) are frequently upregulated [23] [7]. Therapeutic strategies include GLS inhibitors (e.g., CB-839) and SLC1A5 (glutamine transporter) blockade.
Mitochondrial Metabolism: Despite the Warburg effect, many cancers maintain functional mitochondrial respiration, with some becoming reliant on oxidative phosphorylation (OXPHOS) and fatty acid oxidation (FAO). Key targets include mitochondrial complex I inhibitors (e.g., metformin) and CPT1A inhibitors to block FAO [7] [130].
Lipid Metabolism: Enhanced de novo lipogenesis and lipid storage support membrane biosynthesis and signaling pathways. Key regulators include ACAT1 and sterol regulatory element-binding proteins (SREBPs) [2] [124].
Table 1: Key Metabolic Pathways and Their Therapeutic Targets in Cancer
| Metabolic Pathway | Key Molecular Features | Example Therapeutic Targets | Inhibitor Examples |
|---|---|---|---|
| Glucose Metabolism | ↑ GLUT1, HK2, PKM2, LDHA; Lactate production | GLUT1, HK2, PKM2, LDH | WZB117, 2-Deoxy-D-glucose, FX11 [124] [7] |
| Glutamine Metabolism | ↑ GLS, SLC1A5; TCA cycle anaplerosis | Glutaminase (GLS), SLC1A5 | CB-839, V-9302 [23] [7] |
| Mitochondrial Metabolism | Altered OXPHOS; ↑ Fatty Acid Oxidation | Complex I, CPT1A | Metformin, Perhexiline [7] [130] |
| Lipid Metabolism | ↑ De novo lipogenesis; Lipid storage | ACAT1, FASN, SREBP | Avasimibe, Orlistat [2] [124] |
Rationale for Metabolic Combination Therapies
Combination therapies targeting cancer metabolism aim to overcome several fundamental challenges inherent to monotherapy approaches. A primary rationale is to induce synthetic lethality by simultaneously targeting multiple pathways that cancer cells depend on for survival. For instance, MYC-driven cancers upregulate both glycolysis and mitochondrial metabolism, making them vulnerable to combinations like MYC inhibitors plus mitochondrial complex I inhibitors [130]. This simultaneous targeting prevents the cancer cells from switching to an alternative energy source when one pathway is blocked, a common resistance mechanism known as metabolic plasticity [2] [7].
Another strategic rationale involves modulating the tumor microenvironment (TME) to enhance the efficacy of other therapeutic modalities, particularly immunotherapy. The acidic, nutrient-depleted TME created by tumor cell metabolism actively suppresses anti-tumor immune responses. Targeting metabolic pathways can "unmask" the tumor to the immune system by normalizing the TME. For example, inhibiting lactate production or export can alleviate TME acidosis, potentially reversing the suppression of cytotoxic T cells and natural killer cells [116] [129]. Furthermore, combinations of metabolic inhibitors with immune checkpoint inhibitors (ICIs) can reverse T cell exhaustion and promote sustained anti-tumor immunity, turning "cold" tumors "hot" [131] [124].
Strategic Frameworks for Combination Scheduling
Sequencing and Timing Principles
The temporal arrangement of combination therapy components is critical for achieving maximal therapeutic synergy. Evidence suggests that pre-conditioning the TME with metabolic inhibitors can enhance the subsequent efficacy of immunotherapies and targeted agents. The emerging Combination, Timing, and Sequencing (CTS) framework provides a systematic approach for "unmasking" tumors to immunotherapy [129]. This strategy often involves initial vascular normalization and metabolic reprogramming phases to reverse immunosuppression, followed by targeted immunotherapy to eliminate sensitized tumor cells.
Research on MYC inhibition provides a specific paradigm for optimized sequencing. A Northwestern Medicine study demonstrated that treatment with the MYC inhibitor MYCi975 triggers an adaptive upregulation of mitochondrial complex I genes in cancer cells as a compensatory survival mechanism. Administering the complex I inhibitor metformin after this adaptive response has emerged results in profound metabolic collapse and synergistic cell death [130]. This supports a "prime-and-hit" sequencing model, where the first agent induces a predictable metabolic vulnerability that is subsequently exploited by the second agent.
Table 2: Experimentally Validated Combination Schedules and Their Outcomes
| Combination Strategy | Proposed Sequence | Key Findings / Rationale | Experimental Model |
|---|---|---|---|
| MYCi975 + Metformin | 1. MYCi9752. Metformin (24h later) | MYCi975 upregulates mitochondrial complex I; Metformin then inhibits this adaptive response, causing synthetic lethality [130] | MYC-driven prostate cancer cell lines, xenograft models |
| HSP90 Inhibitor + Targeted Therapy/Chemotherapy | Concurrent or sequential (order context-dependent) | HSP90 inhibition depletes multiple oncogenic client proteins, preventing resistance to co-administered targeted agents or chemotherapy [132] | Various cancer cell lines, clinical trials |
| Metabolic Inhibitor + Immune Checkpoint Inhibitor | 1. Metabolic Inhibitor (e.g., LDHA inhibitor)2. Anti-PD-1/PD-L1 | Pre-conditioning with metabolic inhibitor normalizes TME (reduces lactate, improves T cell function), enhancing subsequent ICI efficacy [131] [124] | Preclinical tumor models (e.g., melanoma, NSCLC) |
Dosing Considerations for Therapeutic Synergy
Appropriate dosing is paramount to achieving synergistic efficacy while minimizing overlapping toxicities. The therapeutic window for metabolic agents can be narrow, as many pathways are also active in normal tissues. For combination therapies, the optimal dose of each agent may be lower than its monotherapy maximum tolerated dose (MTD). Preclinical models should aim to establish the minimum effective combination dose that delivers robust anti-tumor effects with manageable toxicity.
Pharmacodynamic (PD) biomarkers are essential tools for guiding dosing decisions. When targeting glycolysis, monitoring tumor lactate levels via magnetic resonance spectroscopy (MRS) or assessing phosphorylation of glycolytic enzymes in serial biopsies can provide evidence of target engagement [7]. For glutamine metabolism inhibitors, circulating levels of glutamine and glutamate, or tumor expression of GLS, can inform dosing adequacy [23] [7]. The integration of real-time PD biomarker assessment allows for dynamic dose adjustment to maintain effective pathway suppression throughout the treatment course, which is crucial for preventing adaptive resistance.
Experimental Protocols for Evaluating Combination Schedules
In Vitro Assessment of Metabolic Synthetic Lethality
Objective: To identify synergistic drug combinations and determine optimal sequencing by measuring cell viability and metabolic function in cancer cell lines.
Materials & Reagents:
- Cancer cell lines with defined genetic backgrounds (e.g., MYC-amplified, SDH-deficient)
- MYC inhibitors (e.g., MYCi975 [130])
- Metabolic inhibitors (e.g., Metformin [130], GLS inhibitor CB-839 [7], GLUT1 inhibitor WZB117 [7])
- Cell viability assay kit (e.g., MTT, CellTiter-Glo)
- Seahorse XF Analyzer cartridges and media
- Glucose, glutamine, and lactate assay kits
- Annexin V/PI apoptosis detection kit
Methodology:
- Cell Seeding and Drug Treatment:
- Seed cells in 96-well plates (for viability) or Seahorse microplates (for metabolic analysis) and allow to adhere.
- Apply treatment sequences (e.g., Monotherapy A, Monotherapy B, A→B, B→A, concurrent A+B). Include vehicle controls.
- For sequential treatment, wash out the first drug before adding the second.
Viability and Synergy Analysis:
- After 72-96 hours of treatment, measure cell viability using CellTiter-Glo to assess ATP levels as a proxy for cell number.
- Calculate combination indices (CI) using the Chou-Talalay method to quantify synergy (CI < 1), additivity (CI = 1), or antagonism (CI > 1).
Metabolic Phenotyping:
- Using the Seahorse XF Analyzer, perform a MitoStress Test (measuring OCR) and a Glycolysis Stress Test (measuring ECAR) on treated cells to assess real-time effects on oxidative phosphorylation and glycolysis, respectively [130].
Apoptosis and Metabolite Analysis:
- Quantify apoptosis via flow cytometry using Annexin V/PI staining.
- Collect conditioned media for extracellular lactate, glucose, and glutamine measurement. Lyse cells for intracellular metabolite analysis (e.g., ATP, succinate, fumarate).
Diagram 1: In vitro combination screening workflow for assessing synthetic lethality.
In Vivo Validation of Timing and Dosing Schedules
Objective: To evaluate the anti-tumor efficacy and toxicity of optimized drug combinations and sequences in animal models.
Materials & Reagents:
- Immunodeficient (e.g., NSG) or humanized mouse models
- Cancer cell lines or patient-derived xenografts (PDXs)
- MYCi975: 5 mg/kg, administered intraperitoneally (IP) [130]
- Metformin: 200-250 mg/kg, administered IP or orally [130]
- Caliper for tumor measurement
- In vivo imaging system (e.g., IVIS) for luciferase-expressing tumors
- Microdialysis catheters for continuous TME metabolite sampling (optional)
Methodology:
- Tumor Implantation and Cohort Allocation:
- Implant tumor cells subcutaneously into flanks of mice.
- Randomize mice into treatment cohorts when tumors reach ~100-150 mm³. Include vehicle, monotherapy, and combination/sequence groups.
Treatment Administration:
- Administer treatments according to predefined schedules. For MYCi975 and metformin: MYCi975 (5 mg/kg IP) followed 24 hours later by metformin (250 mg/kg IP), repeating in cycles [130].
- Monitor body weight and general health 2-3 times weekly for toxicity assessment.
Tumor Growth and Metabolic Imaging:
- Measure tumor dimensions with calipers 2-3 times per week. Calculate volume using the formula: (Length × Width²)/2.
- For metabolic imaging, perform ¹⁸F-FDG PET/CT scans pre- and post-treatment to assess changes in tumor glucose uptake.
Endpoint Analysis:
- At study endpoint, harvest tumors and weigh them. Process for IHC/IF staining (e.g., Ki67 for proliferation, TUNEL for apoptosis, CD3/CD8 for T cell infiltration).
- Analyze intratumoral metabolite levels (e.g., lactate, ATP, glutamine) via mass spectrometry.
- Collect plasma for pharmacokinetic (PK) and pharmacodynamic (PD) biomarker analysis.
The Scientist's Toolkit: Essential Research Reagents
Table 3: Key Research Reagent Solutions for Metabolic Combination Studies
| Reagent / Assay | Function / Utility | Example Application |
|---|---|---|
| Seahorse XF Analyzer | Real-time measurement of OCR (mitochondrial respiration) and ECAR (glycolysis) in live cells. | Profiling metabolic adaptations after MYC inhibition [130]. |
| CRISPR/Cas9 Screening Libraries | Genome-wide or pathway-focused gene knockout to identify synthetic lethal partners with metabolic drugs. | Identifying mitochondrial complex I genes as enhancers of MYCi975 sensitivity [130]. |
| Liquid Chromatography-Mass Spectrometry (LC-MS) | Quantitative analysis of intracellular and extracellular metabolite levels (e.g., lactate, succinate, TCA intermediates). | Monitoring on-target effects of metabolic inhibitors and identifying compensatory pathway fluxes [7]. |
| ¹⁸F-FDG PET/CT Imaging | Non-invasive, quantitative assessment of tumor glucose uptake in vivo. | Evaluating the efficacy of glycolytic inhibitors in preclinical models and patients [7]. |
| Multiplex Immunofluorescence (mIF) | Simultaneous spatial profiling of multiple cell types (tumor, immune) and functional markers in the TME. | Assessing changes in immune cell infiltration and activity after metabolic/immunotherapy combinations [131] [124]. |
Optimizing the timing, sequencing, and dosing of combination therapies that target cancer metabolism represents a frontier in oncology research. The evidence strongly supports a shift from empirical combination testing to rationally designed schedules based on a deep understanding of dynamic metabolic adaptations and TME modulation. The CTS (Combination, Timing, and Sequencing) framework provides a strategic roadmap for "unmasking" tumors and enhancing the efficacy of subsequent treatments, particularly immunotherapy [129].
Future progress will depend on the development of sophisticated biomarker-driven strategies to guide patient stratification and schedule personalization. Technologies such as single-cell RNA sequencing and spatial metabolomics will be crucial for deciphering intratumoral heterogeneity and understanding metabolic crosstalk within the TME [116] [129]. Furthermore, the integration of artificial intelligence and computational modeling to predict optimal drug sequences based on tumor genetic and metabolic profiles holds immense promise for translating these complex strategies into clinical practice. By systematically targeting the metabolic vulnerabilities of cancer through intelligently scheduled combinations, the oncology research community can move closer to overcoming therapeutic resistance and achieving durable remissions for cancer patients.
The tumor microenvironment (TME) represents a metabolic battlefield where cancer cells outcompire immune cells for limited nutrients, establishing immunosuppressive conditions that facilitate tumor progression and undermine therapeutic efficacy. This whitepaper synthesizes current research on the mechanisms of metabolic competition and explores innovative strategies to manipulate the nutrient microenvironment. By examining nutrient scavenging pathways, cooperative behaviors among cancer cells, and metabolic crosstalk between tumor and immune cells, we identify targetable vulnerabilities and provide detailed experimental frameworks for developing interventions that restore antitumor immunity through metabolic reprogramming.
The tumor microenvironment is characterized by profound metabolic derangement, creating nutrient-depleted, hypoxic, and acidic conditions that shape tumor progression and treatment response. Cancer cells undergo metabolic reprogramming to support their rapid proliferation, primarily through aerobic glycolysis (the Warburg effect) even in oxygen-rich conditions [133] [2]. This metabolic adaptation not only fuels cancer growth but actively shapes the immune landscape through nutrient competition and accumulation of immunosuppressive metabolites [133] [48].
The metabolic interplay between tumor cells and immune populations represents a crucial determinant of antitumor immunity. Effector immune cells, particularly CD8+ T cells and natural killer (NK) cells, require substantial metabolic resources for activation and effector functions, making them vulnerable to nutrient deprivation within the TME [134] [48]. Meanwhile, cancer cells exploit metabolic pathways to reinforce immunosuppressive networks that protect the tumor from immune surveillance [133] [8]. Understanding and targeting these metabolic interactions provides promising avenues for overcoming resistance to current immunotherapies and improving patient outcomes.
Mechanisms of Metabolic Competition in the TME
Nutrient Competition: Glucose, Amino Acids, and Lipids
Cancer cells and immune cells compete for essential nutrients within the TME, creating metabolic restrictions that differentially impact various cell populations based on their metabolic requirements and flexibility.
Table 1: Key Nutrients Subject to Competition in the TME
| Nutrient | Cancer Cell Utilization | Immune Cell Impact | Competitive Mechanisms |
|---|---|---|---|
| Glucose | Enhanced uptake via GLUT1-4; Aerobic glycolysis [2] | Impaired IFN-γ production & cytotoxicity in CD8+ T cells [48] | Tumor cells overexpress GLUT transporters; TAMs show superior glucose uptake capacity [133] |
| Glutamine | Primary carbon/nitrogen source; Glutaminolysis [133] [2] | Limited T cell activation & proliferation [134] | Tumor cells upregulate SLC1A5, GLS; CAFs produce glutamine via GS [135] |
| Methionine | DNA/RNA/protein methylation; Polyamine synthesis [133] | Reduced T cell differentiation & function [133] | Tumor SLC43A2 overexpression; Consumption for SAM production [48] |
| Tryptophan | Kynurenine pathway activation [134] | T cell dysfunction & Treg differentiation [48] | IDO/TDO overexpression in tumor cells and TAMs [134] |
| Lipids | Membrane biosynthesis; Energy via FAO [2] [8] | Impaired DC function; Enhanced Treg suppression [48] | CD36-mediated uptake; Enhanced lipogenesis via FASN [48] |
Metabolic Symbiosis and Cooperative Behaviors
Beyond competition, tumors exhibit cooperative behaviors that enhance their survival under nutrient stress. Recent research has identified a cooperative mechanism where cancer cells collectively digest extracellular oligopeptides through secreted aminopeptidases, with the resulting free amino acids benefiting both enzyme-secreting cells and neighboring cells [136] [137]. This process exhibits a clear Allee effect, where cancer cell viability drops below a critical cell density threshold [136].
The enzyme CNDP2 has been identified as crucial for hydrolyzing glutamine-containing oligopeptides extracellularly [136] [137]. Loss of CNDP2 prevents tumor growth both in vitro and in vivo, revealing a targetable vulnerability [137]. This cooperative nutrient scavenging represents an evolutionary advantage for tumors operating in amino acid-deprived conditions [136].
Additionally, metabolic symbiosis occurs between different cell types within the TME. Cancer-associated fibroblasts (CAFs) can be reprogrammed by cancer-derived factors (palmitic acid) to increase glutamine synthetase (GS) expression and glutamine production through an IL-6-mediated inflammatory pathway [135]. This metabolic crosstalk establishes a feed-forward loop that supports tumor growth and suppresses antitumor immunity by promoting immunosuppressive macrophage phenotypes [135].
Figure 1: Metabolic Symbiosis and Cooperative Nutrient Scavenging in the TME. The diagram illustrates two key mechanisms: (1) tumor cell reprogramming of CAFs via palmitic acid to produce glutamine, which promotes immunosuppressive TAMs; and (2) cooperative oligopeptide hydrolysis via CNDP2 secretion, creating amino acids as a "public good" that benefits tumor cells at sufficient densities.
Therapeutic Strategies for Nutrient Microenvironment Manipulation
Targeting Nutrient Transport and Utilization
Table 2: Therapeutic Approaches to Counteract Metabolic Competition
| Therapeutic Target | Mechanism of Action | Experimental Evidence | Challenges |
|---|---|---|---|
| GLUT1 Inhibition | Reduces glucose uptake in tumor cells and TAMs [133] | LysMcre-mediated GLUT1 depletion in TAMs improved NK/CD8+ T cell activity and inhibited tumor growth in PDAC models [133] | Systemic toxicity due to essential glucose requirements in normal tissues |
| Glutaminase (GLS) Inhibitors | Blocks conversion of glutamine to glutamate [8] | Preclinical models show reduced tumor growth; Combination with PD-1 blockade enhances efficacy [8] | Compensatory glutamine production by CAFs; Potential normal tissue effects [135] |
| CNDP2 Inhibition | Disrupts cooperative oligopeptide scavenging [136] [137] | Bestatin (CNDP2 inhibitor) substantially reduced tumors in mice; Genetic deletion prevented tumor formation [137] | May require combination with dietary interventions to reduce circulating amino acids |
| IDO/TDO Inhibitors | Prevents tryptophan depletion and kynurenine production [134] | Reverses T cell dysfunction and suppresses Treg differentiation [48] | Limited efficacy as monotherapy; Resistance mechanisms |
| CD36 Blockade | Inhibits fatty acid uptake [48] | Restores CTL and DC function; Reduces Treg-mediated suppression [48] | Metabolic plasticity enables alternative lipid sources |
Metabolic Reprogramming of Immune Cells
Enhancing the metabolic fitness of antitumor immune cells represents a promising strategy to overcome microenvironmental restrictions. Approaches include:
- Ex vivo metabolic preconditioning: Activating T cells in media with optimized nutrient composition (high glucose, glutamine, and specific amino acids) prior to adoptive cell transfer [48].
- Metabolic checkpoint modulation: Inhibiting pathways that constrain T cell function (e.g., adenosine signaling) while promoting mitochondrial biogenesis and oxidative capacity [48].
- Combination with immunotherapy: PD-1 blockade has been shown to correct glycolytic restriction in tumor-infiltrating lymphocytes, enhancing their metabolic capacity and effector functions [48].
Recent studies demonstrate that glutamine supplementation combined with glycolysis blockade can enhance PD-1 blockade efficacy and improve transferred CD8+ T cell antitumor immunity in preclinical models [48]. This approach leverages the metabolic plasticity of T cells while restricting the rigid glycolytic metabolism of cancer cells.
Experimental Protocols for Investigating Metabolic Competition
Assessing Nutrient Competition In Vitro
Protocol: Co-culture System for Glucose Competition Analysis
Cell Preparation:
- Isolate primary CD8+ T cells from mouse spleen or human PBMCs using magnetic-activated cell sorting (CD8+ microbeads).
- Culture tumor cell lines of interest in appropriate medium.
- Activate T cells with anti-CD3/CD28 beads (1:1 ratio) in RPMI-1640 with 10% FBS for 48 hours.
Metabolic Labeling:
- Label activated T cells with 5μM CellTrace Violet in PBS for 20 minutes at 37°C.
- Quench with complete medium, wash twice, and resuspend in glucose-free medium.
Competition Assay:
- Seed tumor cells in XF96 microplates (10,000 cells/well) and allow adherence.
- Add activated T cells at varying ratios (1:1 to 1:10 tumor:T cells) in low-glucose (2mM) medium.
- Measure real-time glucose consumption and glycolytic rates using Seahorse XF Glycolysis Stress Test.
- Parallel plates for flow cytometry analysis of T cell proliferation (CellTrace dilution) and activation markers (CD25, CD69) after 72 hours.
Intervention Testing:
- Include conditions with GLUT1 inhibitors (e.g., BAY-876, 100nM) or metabolic modulators.
- Assess T cell function via IFN-γ ELISA after PMA/ionomycin stimulation.
In Vivo Modeling of Cooperative Scavenging
Protocol: Targeting CNDP2-Mediated Oligopeptide Utilization
Animal Model:
- Use 6-8 week old immunocompetent mice (C57BL/6 for syngeneic models).
- Implant 1×10^6 Lewis Lung Carcinoma (LLC) cells subcutaneously.
Dietary and Pharmacological Intervention:
- Randomize mice into four groups (n=8-10/group):
- Group 1: Control diet + vehicle treatment
- Group 2: Control diet + bestatin (10mg/kg, i.p. daily)
- Group 3: Amino acid-restricted diet + vehicle
- Group 4: Amino acid-restricted diet + bestatin
- The amino acid-restricted diet should contain 50% less total amino acids than control.
- Randomize mice into four groups (n=8-10/group):
Tumor Monitoring and Analysis:
- Measure tumor dimensions every 2-3 days using calipers.
- Harvest tumors at 500mm³ volume for:
- Immunohistochemistry for CNDP2 expression and localization
- LC-MS metabolomics for amino acid and oligopeptide quantification
- Flow cytometry analysis of immune infiltration (CD8+ T cells, TAMs, NK cells)
Metabolic Flux Assessment:
- Isolate tumor cells from harvested tumors and analyze ex vivo oligopeptide utilization capacity using ¹⁴C-labeled Ala-Gln dipeptide.
- Measure extracellular acidification rate (ECAR) and oxygen consumption rate (OCR) in response to dipeptide supplementation.
Figure 2: Experimental Workflows for Investigating Metabolic Competition. The diagram outlines parallel in vitro and in vivo approaches to study nutrient competition and cooperative scavenging mechanisms.
The Scientist's Toolkit: Essential Research Reagents
Table 3: Key Research Reagents for Investigating Nutrient Microenvironment Manipulation
| Reagent/Category | Specific Examples | Research Application | Functional Role |
|---|---|---|---|
| Metabolic Inhibitors | BAY-876 (GLUT1 inhibitor), CB-839 (GLS inhibitor), Etomoxir (CPT1A inhibitor) [8] | Target nutrient transport and utilization pathways | Reduce tumor cell nutrient consumption; Shift metabolic balance |
| Tracer Compounds | ¹⁴C-glucose, ¹³C₅-glutamine, ²H₇-glucose [2] | Metabolic flux analysis | Track nutrient utilization pathways; Quantify metabolic fluxes |
| Extracellular Flux Assays | Seahorse XF Glycolysis Stress Test, Mito Stress Test [136] | Real-time metabolic profiling | Measure glycolytic capacity and mitochondrial function in live cells |
| Cytokine/Amino Acid Assays | IL-6 ELISA, Glutamine colorimetric assay, LC-MS metabolomics [135] | Microenvironment characterization | Quantify nutrient and signaling molecule levels |
| Genetic Tools | CRISPR/Cas9 for CNDP2 knockout, shRNA for GLUT1 knockdown [136] [137] | Target validation | Establish causal relationships; Identify essential genes |
| Animal Models | Syngeneic tumor models, PDX models with human immune system [137] | In vivo therapeutic testing | Evaluate interventions in physiologically relevant context |
Manipulation of the nutrient microenvironment represents a promising frontier in cancer therapy, with potential to overcome the immunosuppressive barriers that limit current treatments. The complex metabolic interplay within the TME—encompassing nutrient competition, metabolic symbiosis, and cooperative scavenging—provides multiple leverage points for therapeutic intervention.
Future research directions should focus on: (1) developing tissue-specific metabolic inhibitors that minimize systemic toxicity; (2) designing combination therapies that simultaneously target complementary metabolic pathways; (3) exploring dietary interventions as adjuvants to metabolic therapy; and (4) advancing personalized approaches based on the metabolic profile of individual tumors.
The discovery of cooperative behaviors among cancer cells, particularly the CNDP2-mediated oligopeptide scavenging pathway, reveals both a vulnerability and the remarkable adaptability of tumors under nutrient stress [136] [137]. Targeting these cooperative mechanisms, while simultaneously enhancing the metabolic fitness of antitumor immune cells, provides a strategic approach to counteract metabolic competition and restore effective immune surveillance within the tumor microenvironment.
Tumor metabolic heterogeneity represents a critical frontier in oncology, presenting both a fundamental challenge and a therapeutic opportunity. This technical guide explores the spatiotemporal dynamics of metabolic subpopulations within tumors, dissecting the molecular mechanisms that drive heterogeneity and their profound implications for therapeutic resistance. We examine how cutting-edge technologies like single-cell sequencing and spatial omics are revealing intricate metabolic symbiosis and plasticity. Furthermore, we detail experimental frameworks for investigating these dependencies and discuss emerging therapeutic strategies that target metabolic vulnerabilities across subpopulations. The insights provided aim to equip researchers and drug development professionals with the conceptual and methodological tools necessary to develop next-generation interventions that overcome resistance rooted in metabolic diversity.
The conceptual understanding of cancer metabolism has evolved dramatically from Otto Warburg's initial observations of aerobic glycolysis to the contemporary recognition of metabolic reprogramming as a defining hallmark of cancer [138]. Where early research treated tumors as metabolically uniform entities, it is now clear that intratumoral heterogeneity creates a complex landscape of distinct cellular subpopulations with unique metabolic dependencies. This heterogeneity is not random but exhibits precise spatiotemporal organization driven by microenvironmental constraints such as oxygen and nutrient gradients [139].
The clinical significance of this metabolic diversity cannot be overstated. Metabolic heterogeneity fosters therapy resistance by enabling tumors to adapt under selective pressures, including chemotherapy, radiation, and targeted therapies [139]. Subpopulations reliant on oxidative phosphorylation (OXPHOS) may survive glycolytic inhibitors, while hypoxic, glycolytic cells can withstand anti-angiogenic therapies. This dynamic adaptation capacity necessitates therapeutic strategies that simultaneously address multiple metabolic pathways and their regulatory networks.
Understanding and targeting this metabolic complexity requires a multidisciplinary approach integrating single-cell technologies, computational modeling, and metabolic imaging. This guide provides a comprehensive framework for dissecting tumor metabolic heterogeneity and developing interventions that account for the diverse dependencies of cellular subpopulations within the tumor ecosystem.
Molecular Mechanisms Driving Metabolic Heterogeneity
Spatial Organization of Metabolic Pathways
Tumors establish spatially structured metabolic networks shaped by oxygen and nutrient gradients, creating distinct metabolic zones with specialized functions. The metabolic zonation within tumors follows predictable patterns based on proximity to vascular supply, with profound implications for therapeutic targeting.
Table 1: Spatial Metabolic Zonation Across Tumor Types
| Tumor Type | Core Region Characteristics | Marginal Zone Characteristics | Key Molecular Mediators | Therapeutic Implications |
|---|---|---|---|---|
| Glioblastoma | Enhanced glycolysis; Hypoxia-induced HIF-1α [139] | OXPHOS activity; More normal-like metabolism [139] | LDHA, MCT4, VEGFA [139] | Hypoxic regions resistant to radiotherapy; Combined glycolysis/OXPHOS inhibition [139] |
| Oral Squamous Cell Carcinoma (OSCC) | Aerobic glycolysis; Lactate accumulation [139] | Lactate consumption by TME cells [139] | HIF-1α, CXCL12, TGF-β [139] | MCT inhibitors may enhance checkpoint immunotherapy [139] |
| Breast Cancer | High glucose; Glycolytic metabolism [139] | Preference for mitochondrial metabolism [139] | PI3K, GLUT1 [139] | Combined PI3K/bromodomain inhibition reduces heterogeneity [139] |
| Pancreatic Neuroendocrine Tumors (PanNETs) | Homogeneous glycolysis (mTOR-VEGF axis) [139] | Lactate shuttling to stromal fibroblasts [139] | mTOR, VEGF, MCT4 [139] | mTOR inhibitors reduce glycolytic flux but may increase metastasis risk [139] |
| Osteosarcoma | Glycolytic dominance; Nucleotide/amino acid pathway amplification [139] | FAO-enhanced invasion; Acetyl-CoA production [139] | HIF-2α, PRODH, CPT1A [139] | PRODH inhibitors sensitize to hypoxia-targeted therapy [139] |
The hypoxic core regions typically exhibit glycolytic dominance with elevated lactate/pyruvate ratios mediated by HIF-1α stabilization and LDHA-driven pyruvate diversion [139]. In contrast, oxygen-rich peripheral regions utilize OXPHOS with accumulated TCA cycle intermediates and GLS1-dependent glutamine catabolism to meet biosynthetic needs and support invasive capacity [139]. This spatial division creates therapeutic challenges, as regions exhibit differential sensitivity to metabolic interventions.
Figure 1: Spatial Metabolic Organization in Solid Tumors. Vascular regions show high glucose transporter and glycolytic enzyme expression; hypoxic cores upregulate HIF-1α, LDHA, and lactate exporters; intermediate zones facilitate metabolic symbiosis via lactate shuttling.
Metabolic Symbiosis and Subpopulation Crosstalk
Beyond zonation, tumors employ sophisticated metabolic symbiosis networks where distinct cellular subpopulations exchange metabolites to mutual benefit. The most characterized symbiosis involves lactate shuttling: hypoxic cells export glycolysis-derived lactate via MCT4, while oxygen-rich cells import it via MCT1 for mitochondrial OXPHOS in a reverse Warburg effect [139]. This creates a pro-tumorigenic niche through lactate-driven VEGF-mediated angiogenesis and microenvironment acidification.
Cancer stem cells (CSCs) further contribute to metabolic heterogeneity by maintaining distinct energy programs. CSCs typically display OXPHOS-dominant phenotypes with low glycolytic activity to preserve stem-like properties and enhance therapy resistance [140]. Single-cell metabolomics has identified therapy-resistant, FAO-dependent clones coexisting with glycolytic proliferative populations in breast and esophageal cancers [139]. This metabolic specialization enables population-level resilience under therapeutic stress.
Metabolic crosstalk extends beyond tumor cells to include stromal components. Cancer-associated fibroblasts (CAFs) and tumor-associated macrophages provide alternative metabolic substrates (glutamine, ketone bodies) while competitively consuming glucose and arginine to impair immune function [139]. This complex network of metabolic relationships creates a robust ecosystem capable of adapting to diverse therapeutic challenges.
Signaling Pathways and Metabolite Sensing
Metabolic heterogeneity is governed by sophisticated sensing mechanisms that translate metabolite fluctuations into adaptive responses. Metabolite sensing enables cells to detect environmental changes and reorganize their metabolic networks accordingly [141]. Three primary sensing mechanisms have been identified:
- Sensor-mediated signaling: Biological macromolecules (proteins, RNAs, DNAs) directly bind metabolites, triggering downstream signaling cascades
- Metabolic sensing modules: Integrated circuits that detect metabolic status through multiple coordinated components
- Conjugate sensing: Detection of metabolite-derived modifications on cellular components
G-protein coupled receptors (GPCRs) function as crucial metabolite sensors in cancer. GPR31 recognizes citric acid cycle intermediates and is activated by lactic acid and pyruvate, potentially enhancing immune responses in the tumor microenvironment [141]. SUCNR1 (GP91) is activated by succinate and promotes cancer metastasis via PI3K-Akt-HIF-1α pathway activation, driving epithelial-mesenchymal transition and angiogenesis [141]. In gastric cancer, succinate activates the SUCNR1-ERK1/2-STAT3-VEGF pathway, promoting vascularization [141].
These sensing mechanisms are complemented by epigenetic regulation driven by metabolic changes. Metabolites provide substrates for epigenetic enzymes and act as allosteric regulators, creating direct links between metabolic state and gene expression patterns [141]. For instance, extracellular succinate inhibits histone demethylase activity, while acetate absorbed from the environment can drive histone acetylation [141]. This metabolite-epigenetic axis establishes reinforcing loops that stabilize metabolic states across cellular subpopulations.
Methodological Approaches for Investigating Metabolic Heterogeneity
Advanced Analytical Technologies
Dissecting metabolic heterogeneity requires technologies capable of resolving molecular features at single-cell resolution across spatial contexts. The integration of multi-omics approaches provides complementary insights into the regulation and functional consequences of metabolic diversity.
Table 2: Core Methodologies for Metabolic Heterogeneity Research
| Technology | Key Applications | Resolution | Insights Generated | Limitations |
|---|---|---|---|---|
| Single-Cell RNA Sequencing | Transcriptomic profiling of metabolic enzymes and regulators [139] | Single-cell | Cell-to-cell variability in metabolic gene expression; Identification of metabolic subpopulations [139] | Does not directly measure metabolite levels; Potential dissociation artifacts |
| Spatial Transcriptomics | Mapping gene expression within tissue architecture [139] | 10-100 cells (depending on platform) | Localization of metabolic zones; Correlation with histological features [139] | Lower resolution than single-cell; Higher cost per sample |
| Metabolic Imaging (e.g., PET, hyperpolarized MRI) | Non-invasive assessment of metabolic activity [139] | 1-10 mm (clinical); 10-100 µm (preclinical) | Spatial distribution of glucose uptake, lactate production, pH [139] | Limited metabolite specificity; Radiation exposure (PET) |
| Mass Spectrometry-Based Metabolomics | Comprehensive quantification of metabolite abundances [142] | Bulk tissue or ~10-100 cells (with special preparation) | Direct measurement of metabolic pathway activity; Metabolic flux analysis [142] | Requires tissue destruction; Challenging for rare cell populations |
| Selected Reaction Monitoring (SRM) Proteomics | Targeted protein quantification of metabolic enzymes [142] | Bulk tissue | Precise measurement of metabolic enzyme expression levels; Response to perturbations [142] | Limited multiplexing capacity; Requires antibody development |
The Selected Reaction Monitoring (SRM) proteomics approach deserves particular emphasis for targeted metabolic studies. This method enables accurate quantification of protein expression in glycolysis/gluconeogenesis, TCA cycle, and pentose phosphate pathways with high reproducibility [142]. The workflow involves mass spectrometry-compatible acid-labile detergent-based protein preparation, multiplexed SRM assay development for metabolic enzymes, and computational analysis of pathway alterations [142]. This approach provides a powerful tool for hypothesis-driven studies of mammalian cells and can greatly complement experimental methods in systems biology and metabolic engineering.
Experimental Models and Perturbation Strategies
Faithfully modeling metabolic heterogeneity requires experimental systems that recapitulate the tumor microenvironment's spatial and biochemical complexity. Patient-derived organoids (PDOs) have emerged as valuable tools for maintaining the metabolic heterogeneity of original tumors while enabling experimental manipulation [143]. When coupled with spatial transcriptomics and proteomics, PDOs facilitate the stratification of metabolic vulnerabilities and inform individualized therapies [143].
Controlled perturbation experiments are essential for establishing causal relationships in metabolic regulation. Key perturbation models include:
- Hypoxia exposure: Mimics the oxygen gradients found in tumors and reveals HIF-mediated metabolic adaptations [142]
- Nutrient deprivation: Identifies compensatory metabolic pathways and plasticity mechanisms [142]
- Metabolic inhibitor treatment: Tests specific pathway dependencies and synthetic lethal interactions
- Genetic manipulation: CRISPR-based modification of metabolic enzymes or regulators to establish functional requirements
For example, quantitative proteomic analysis of MCF-7 breast cancer cells under hypoxia revealed elevated expression of most glycolytic enzymes, while cancer cells (as opposed to near-normal MCF-10A cells) showed significantly increased expression of key energy metabolic pathway enzymes (FBP1, IDH2, and G6PD) that redirect carbon flux through the pentose phosphate pathway [142]. These controlled perturbations uncover how metabolic networks reorganize under stress conditions relevant to the tumor microenvironment.
The Scientist's Toolkit: Essential Research Reagents
Table 3: Key Research Reagents for Metabolic Heterogeneity Studies
| Reagent Category | Specific Examples | Primary Research Application | Functional Role |
|---|---|---|---|
| Metabolic Inhibitors | 2-deoxyglucose, MCT1 inhibitors, GLS1 inhibitors [139] [138] | Target validation; Metabolic vulnerability assessment | Selective inhibition of specific metabolic pathways to test dependency |
| Isotope Tracers | ^13^C-glucose, ^15^N-glutamine, ^2^H-glutamate | Metabolic flux analysis | Tracking nutrient utilization through metabolic networks |
| Cell Surface Markers | CD44, CD133, CD34 [140] | Isolation of metabolic subpopulations | Identification and purification of CSCs and other subpopulations |
| Cytokine/Antibody Panels | HIF-1α antibodies, MCT4 inhibitors, CAF markers [139] | Microenvironment modulation | Manipulation of stromal-tumor interactions |
| Sensing Pathway Reporters | GFP-based lactate sensors, FRET metabolite biosensors [141] | Real-time metabolite monitoring | Dynamic tracking of metabolic changes in live cells |
| Epigenetic Modulators | HDAC inhibitors, BET inhibitors, DNMT inhibitors [141] | Metabolic-epigenetic axis investigation | Testing links between metabolism and gene regulation |
Therapeutic Targeting of Metabolic Heterogeneity
Strategic Framework for Combination Therapies
Effective targeting of metabolically heterogeneous tumors requires moving beyond single-agent approaches to comprehensive strategies that address multiple dependencies simultaneously. The spatiotemporal targeting framework recognizes that distinct tumor regions exhibit different metabolic phenotypes and must be therapeutically addressed in a compartment-specific manner [139].
For example, in glioblastoma, a multimodal approach might combine glycolysis inhibitors + radiotherapy for hypoxic core regions with OXPHOS inhibitors + immunotherapy for oxygen-rich marginal zones [139]. This recognizes that hypoxic regions are typically radioresistant due to HIF-1α-mediated survival pathways, while better-oxygenated regions may be more susceptible to immunotherapeutic approaches if metabolic suppression can enhance immune cell function.
Therapeutic success requires understanding and targeting metabolic plasticity - the ability of cancer cells to switch between energy sources when specific pathways are inhibited. CRC cells exhibit pronounced metabolic plasticity, enabling dynamic switching between glycolysis and mitochondrial OXPHOS in response to fluctuations in oxygen, glucose, and other metabolic substrates [143]. This plasticity enhances survival under extreme conditions and provides a foundation for therapeutic evasion. Combining glycolytic and mitochondrial inhibitors can address this plasticity by simultaneously targeting both major energy production systems.
Emerging Therapeutic Targets and Agents
Several promising therapeutic targets have emerged from research into metabolic heterogeneity:
Monocarboxylate Transporters (MCTs): MCT1 and MCT4 facilitate lactate shuttling between metabolic subpopulations. MCT4 is highly expressed in glycolytic, hypoxic cells, while MCT1 is prevalent in oxidative cells that import lactate [139]. Dual inhibition disrupts metabolic symbiosis and acidifies the glycolytic compartment.
Hypoxia-Inducible Factors (HIFs): HIF-1α drives glycolytic adaptation in hypoxic regions, while HIF-2α activates distinct metabolic programs in certain cancers (e.g., PRODH-dependent proline metabolism in osteosarcoma) [139]. Selective HIF inhibitors can compromise adaptation to hypoxia.
Metabolite Sensing Receptors: SUCNR1 inhibition blocks succinate-mediated promotion of metastasis and angiogenesis across multiple cancer types [141]. Similarly, GPR31 antagonists may modulate immune-metabolic crosstalk in the tumor microenvironment.
Mitochondrial Plasticity Pathways: Targeting the metabolic flexibility of CSCs through dual inhibition of glycolysis and OXPHOS shows promise for eliminating this therapy-resistant population [140]. Compounds that disrupt the MYC/PGC-1α balance can modulate the metabolic phenotype and plasticity of pancreatic CSCs [144].
Figure 2: Comprehensive Targeting Strategy for Metabolic Heterogeneity. Different metabolic subpopulations require specific inhibitory approaches, with combination therapies necessary to address plasticity and prevent adaptive resistance.
Clinical Translation Challenges and Solutions
Translating metabolic heterogeneity research into clinical practice faces several significant challenges. Biomarker development remains critical for identifying patients most likely to benefit from metabolism-targeted therapies. Potential biomarkers include PET-based assessment of glycolytic activity, circulating metabolite levels, and spatial analysis of metabolic enzyme expression in biopsy specimens.
Therapeutic resistance to metabolic interventions emerges through multiple mechanisms. CRC cells activate antioxidant defense networks, including the Keap1-Nrf2 pathway, GSH, thioredoxin, and peroxiredoxins, to counteract therapy-induced oxidative stress [143]. Redox homeostasis is tightly coupled with metabolic reprogramming, with cancer cells modulating NADPH and GSH levels through PPP, FAO, and glutamine metabolism to maintain a metabolic-redox feedback loop [143]. Targeting these adaptive mechanisms simultaneously with primary metabolic interventions may enhance efficacy.
The development of response assessment criteria specific to metabolic therapies represents another translational challenge. Traditional radiological response criteria may not adequately capture the biological effects of metabolic interventions. Advanced functional imaging techniques, including hyperpolarized MRI with ^13^C-labeled metabolites, offer promising alternatives for monitoring early metabolic response to targeted therapies.
Addressing tumor metabolic heterogeneity requires a paradigm shift from targeting single pathways to developing integrated approaches that account for spatiotemporal dynamics, subpopulation interactions, and plastic adaptations. The future of metabolic cancer therapy lies in personalized combination strategies informed by sophisticated metabolic imaging, spatial omics, and computational modeling.
Emerging technologies will continue to transform this field. AI-driven multi-omics analysis is paving the way for precision-targeted therapies by decoding complex metabolic networks [140]. Synthetic biology-based interventions and advanced immune-based approaches that recognize metabolic subpopulations offer promise for overcoming CSC-mediated therapy resistance [140]. The integration of 3D organoid models with high-resolution metabolomics will enhance our ability to model human-specific metabolic heterogeneity in preclinical testing [143].
Ultimately, overcoming metabolic heterogeneity will require acknowledging tumors as complex ecological systems where subpopplications with distinct metabolic dependencies coexist and collaborate. Therapeutic success will depend on simultaneously targeting multiple metabolic vulnerabilities while limiting adaptive responses through strategic combination approaches. As our understanding of metabolic heterogeneity deepens, so too will our ability to develop interventions that address the full complexity of the tumor metabolic ecosystem.
Cancer cells undergo profound metabolic reprogramming to support their rapid proliferation and survival, a hallmark of cancer that presents novel therapeutic opportunities [2]. Unlike normal cells, which primarily rely on oxidative phosphorylation for energy production, cancer cells exhibit increased uptake of glucose and metabolism to lactate even in the presence of adequate oxygen - a phenomenon known as the "Warburg effect" or aerobic glycolysis [2]. These metabolic alterations extend beyond glucose metabolism to include changes in amino acid transport, lipid metabolism, and nucleotide synthesis pathways [2]. The recognition that these metabolic dependencies represent targetable vulnerabilities has spurred the development of metabolism-targeting therapies. However, patient responses to these therapies vary significantly, creating an urgent need for biomarker-driven approaches to identify patients most likely to benefit from specific metabolic interventions. This whitepaper provides a comprehensive technical guide for researchers and drug development professionals seeking to implement biomarker strategies for patient selection in metabolic therapy trials.
Metabolic Dependencies in Cancer: Pathways and Biomarker Opportunities
Key Reprogrammed Metabolic Pathways
Cancer cells rewire multiple metabolic pathways to meet their increased demands for energy, biosynthetic precursors, and redox homeostasis. The table below summarizes the major altered metabolic pathways in cancer cells and their potential as biomarker sources.
Table 1: Key Reprogrammed Metabolic Pathways in Cancer and Associated Biomarker Opportunities
| Metabolic Pathway | Key Alterations in Cancer | Potential Biomarker Readouts | Therapeutic Targeting Examples |
|---|---|---|---|
| Glucose Metabolism | ↑ Glucose uptake via GLUTs; ↑ Glycolysis; ↑ PPP; Altered TCA cycle [2] | GLUT1 expression; FDG-PET uptake; Lactate dehydrogenase (LDH) levels; PKM2 expression [2] | 2-deoxy-d-glucose (2-DG); LDHA inhibitors; PFKFB3 inhibitors [2] |
| Amino Acid Metabolism | ↑ Glutaminolysis; ↑ Amino acid transport via SLCs; ↑ Asparagine synthesis [2] | Glutamine levels; SLC transporter expression; PHGDH expression [2] | Pegylated arginine deiminase (ADI-PEG 20); Glutaminase inhibitors [2] |
| Lipid Metabolism | ↑ Lipid intake; ↑ Lipogenesis; ↑ Lipid storage [2] | Lipid droplet accumulation; FASN expression; SREBP activity [2] | 5-(tetradecyloxy)-2-furoic acid (TOFA); Statins [2] |
| Nucleotide Metabolism | Preference for de novo nucleotide generation; ↑ Salvage pathway enzymes [2] | TK1 expression; TYMS activity; IMP dehydrogenase levels [2] | Methotrexate; Mycophenolic acid [2] |
Metabolic Heterogeneity and Tumor Microenvironment Influence
The metabolic landscape of tumors is remarkably heterogeneous, influenced by genetic alterations, tissue of origin, and microenvironmental constraints such as hypoxia and nutrient availability [1]. This heterogeneity extends beyond cancer cells to include various cell types within the tumor microenvironment (TME), including endothelial cells, fibroblasts, and immune cells, all competing for limited nutrients [1]. This complex metabolic ecosystem creates both challenges and opportunities for biomarker development, necessitating approaches that can capture this complexity through spatial profiling and single-cell analyses.
Biomarker Classification and Validation Framework
Categories of Biomarkers in Therapy Development
Biomarkers serve distinct purposes throughout the drug development continuum, from early target validation to clinical implementation. The following table classifies biomarker types based on their application in therapeutic development.
Table 2: Biomarker Classification and Applications in Therapeutic Development
| Biomarker Type | Definition | Measurement Timing | Primary Application | Examples in Metabolic Therapies |
|---|---|---|---|---|
| Prognostic | Indicates likelihood of clinical event, recurrence, or progression independent of treatment [145] | Baseline | Identify patients with more aggressive disease natural history | Total CD8+ T-cell count in tumor [145] |
| Predictive | Identifies patients more likely to experience favorable/unfavorable effect from specific treatment [145] [146] | Baseline | Select patients who will benefit from a specific therapy | PD-L1 expression for CPI [145] |
| Pharmacodynamic | Demonstrates biological activity of a drug [145] | Baseline and on-treatment | Establish proof of mechanism; dose optimization | Changes in metabolite levels post-treatment |
| Safety | Indicates likelihood, presence, or extent of toxicity [145] | Baseline and on-treatment | Predict and mitigate adverse effects | IL6 for cytokine release syndrome [145] |
Statistical Considerations for Biomarker Validation
Robust statistical approaches are essential for establishing the clinical utility of biomarkers. For prognostic biomarkers, the focus is on demonstrating a significant association with clinical outcomes in untreated patients or those receiving standard care [145]. For predictive biomarkers, the critical requirement is establishing a treatment-by-biomarker interaction, where the treatment effect differs significantly between biomarker-positive and biomarker-negative subgroups [146]. This often requires specialized clinical trial designs, such as enrichment designs that restrict enrollment to biomarker-positive patients, or stratified designs that prospectively randomize within biomarker-defined subgroups [145]. Additional methodological considerations include:
- Appropriate data transformation for non-normal biomarker distributions [145]
- Handling of high-dimensional biomarker data through dimension reduction techniques [145]
- Accounting for multiple testing to control false discovery rates [145]
- Use of joint modeling approaches for longitudinal biomarker and time-to-event data [145]
Methodological Approaches for Biomarker Development
Analytical Techniques for Metabolic Biomarker Discovery
The development of biomarkers for metabolic therapies relies on advanced analytical platforms that can capture the dynamic nature of cancer metabolism.
Table 3: Core Methodologies for Metabolic Biomarker Discovery and Validation
| Technology Platform | Key Measured Parameters | Applications in Metabolic Biomarker Development | Considerations |
|---|---|---|---|
| Metabolomics (LC-MS, GC-MS) | Concentration of metabolites in pathways of interest (e.g., TCA intermediates, nucleotides) | Identification of metabolic signatures predictive of therapy response; Pharmacodynamic monitoring | Rapid metabolite turnover; Sample stabilization critical |
| Stable Isotope Tracing (13C-glucose, 15N-glutamine) | Metabolic flux through specific pathways; Pathway activity | Functional assessment of metabolic dependencies; Target engagement | Technically challenging; Requires specialized expertise |
| Functional Imaging (FDG-PET, Hyperpolarized MRI) | In vivo assessment of metabolic processes (e.g., glucose uptake, lactate production) | Non-invasive monitoring of therapy response; Patient stratification | Quantitative standardization needed across centers [147] |
| Genomic/Transcriptomic Profiling (RNA-seq, NanoString) | Expression of metabolic enzymes and transporters (e.g., GLUTs, LDHA) | Identification of molecular subtypes with specific metabolic dependencies | May not reflect functional metabolic state |
Experimental Workflow for Biomarker Validation
The following diagram illustrates a comprehensive workflow for developing and validating biomarkers for metabolic therapies:
The Scientist's Toolkit: Essential Research Reagents
The following table details key reagents and their applications in metabolic biomarker research:
Table 4: Essential Research Reagents for Metabolic Biomarker Investigations
| Reagent Category | Specific Examples | Primary Research Applications | Technical Considerations |
|---|---|---|---|
| Stable Isotope Tracers | 13C-glucose; 15N-glutamine; 2H2O | Metabolic flux analysis; Pathway activity assessment | Purity critical; Specialized MS instrumentation required |
| Metabolic Inhibitors | 2-DG (glycolysis); BPTES (glutaminase); TOFA (lipogenesis) | Functional validation of metabolic dependencies; Combination therapy studies | Off-target effects common; Dose optimization needed |
| Metabolite Standards | Isotopically-labeled internal standards for LC-MS/MS | Absolute quantification of metabolites; Method calibration | Stable isotope effect considerations; Storage conditions critical |
| Enzyme Activity Assays | LDHA activity kits; G6PDH activity assays | Functional assessment of metabolic enzyme activity | Sample preparation critical; Linear range validation required |
| Metabolic Probes | Fluorescent glucose analogs (2-NBDG); ROS sensors | Real-time monitoring of metabolic processes in live cells | Potential perturbation of native metabolism; Calibration needed |
Biomarker-Driven Clinical Trial Design
Integration of Biomarkers in Early Clinical Development
Biomarkers play increasingly critical roles in early clinical trials of metabolic therapies, serving multiple functions from target engagement demonstration to patient enrichment [148] [145]. Phase I trials provide an arena for early hypothesis testing, examining not only safety and toxicity but also target engagement, biologically effective dosages, and the appropriate patient population [148]. The integration of biomarker development into early testing of novel metabolic agents can provide clinically relevant therapeutic opportunities for patients with advanced-stage cancer and accelerate the drug approval process [148]. Key applications include:
- Demonstration of mechanism of action by analyzing pharmacodynamic effects on metabolic pathways [145]
- Dose finding and optimization based on target engagement rather than solely maximum tolerated dose [145]
- Patient enrichment and indication prioritization based on metabolic dependencies [145]
- Mitigation and prevention of adverse reactions through safety biomarkers [145]
Biomarker Classification Framework for Regulatory Consideration
A systematic framework for classifying biomarker-drug pairs facilitates regulatory decision-making and supports drug development with respect to biomarker-related subgrouping [146]. The proposed classification spans five categories with increasing evidence on the predictive nature of the biomarker in relation to a specific drug [146]:
Technical Protocols for Key Methodologies
Stable Isotope Resolved Metabolomics (SIRM) for Flux Analysis
Purpose: To quantify metabolic flux through specific pathways in response to metabolic therapies [2].
Workflow:
- Cell/Tissue Preparation: Culture cells or tissue slices in media containing stable isotope-labeled nutrients (e.g., 13C-glucose, 15N-glutamine)
- Metabolite Extraction: Use methanol:water:chloroform (4:4:2) extraction at specified time points
- LC-MS Analysis: Separate metabolites using HILIC or reverse-phase chromatography coupled to high-resolution mass spectrometry
- Data Processing: Extract isotopologue distributions using specialized software (e.g., XCMS, Maven)
- Flux Calculation: Apply metabolic flux analysis algorithms to infer pathway activities
Key Parameters:
- Isotope incorporation time course (typically 0-24 hours)
- Mass isotopomer distributions for key metabolites
- Fractional enrichment calculations
Quantitative Imaging Biomarker Validation
Purpose: To establish technical performance of quantitative imaging biomarkers (QIBs) for metabolic assessment [147].
Workflow:
- Phantom Studies: Image physical phantoms with known metabolite concentrations to establish accuracy and precision [147]
- Test-Retest Studies: Acquire repeated scans in stable subjects to measure repeatability [147]
- Multi-center Studies: Evaluate reproducibility across different imaging platforms and sites [147]
- Clinical Correlation: Associate imaging biomarkers with tissue-based metabolic measurements
Statistical Considerations:
- Bias assessment: Difference between measured and true values [147]
- Precision evaluation: Closeness of agreement between repeated measurements [147]
- Agreement statistics: Concordance correlation coefficients, Bland-Altman analysis [147]
Biomarker-driven patient selection represents a paradigm shift in the development of metabolic therapies, moving from empirical treatment approaches to precisely targeted interventions based on individual tumor metabolic dependencies. The successful implementation of this strategy requires interdisciplinary collaboration between cancer biologists, metabolomics specialists, imaging experts, clinical trialists, and regulatory scientists. Future directions in the field include the development of multi-parametric biomarker signatures that capture the complexity and plasticity of cancer metabolism, integrated pharmacokinetic-pharmacodynamic models that incorporate metabolic biomarkers, and novel clinical trial designs that adapt patient selection based on emerging biomarker data. As our understanding of cancer metabolism continues to evolve, so too will our ability to precisely match metabolic therapies with the patients most likely to derive meaningful clinical benefit.
Preclinical to Clinical Translation and Comparative Efficacy Analysis
A profound translational gap persists in oncology drug development, where a staggering less than 1% of published cancer biomarkers successfully transition from preclinical discovery to clinical practice [149]. This failure is particularly pronounced in the realm of metabolic therapy, where the complex, dynamic, and heterogeneous nature of tumor metabolism creates significant roadblocks. Metabolic reprogramming is a established hallmark of cancer, enabling rapid proliferation, survival, and resistance to therapeutic stress [2] [8]. Cancer cells rewire their metabolic pathways to favor aerobic glycolysis (the Warburg effect), increase glutaminolysis, and enhance lipid synthesis, creating potential therapeutic vulnerabilities [2] [23]. However, the very adaptability and plasticity of these pathways often underlie the failure of metabolic-targeted therapies in clinical trials.
The central challenge lies in the poor predictive validity of traditional preclinical models. Over-reliance on animal models with inherent biological differences from humans, coupled with a lack of robust, functionally validated biomarker frameworks, often yields promising in vitro data that fails to correlate with clinical outcomes [149]. Furthermore, controlled preclinical conditions cannot fully replicate the nutrient-deprived, hypoxic, and acidic tumor microenvironment (TME) that shapes metabolic adaptations and therapy response [8]. This whitepaper provides a technical guide for researchers and drug development professionals, outlining advanced model systems and rigorous experimental protocols designed to bridge this critical translational gap for metabolic therapies.
A Hierarchy of Preclinical Models for Metabolic Studies
Selecting the appropriate model hierarchy is critical for de-risking the development of metabolic therapies. The following section details available models, their applications, and their limitations.
In Vitro Model Systems
Table 1: In Vitro Models for Metabolic Therapy Validation
| Model Type | Key Characteristics | Advantages for Metabolic Studies | Limitations |
|---|---|---|---|
| 2D Cell Cultures | Monolayers of finite or continuous cell lines [150]. | - Affordable, easy, and high-throughput.- Suitable for initial affinity, uptake, and efficacy studies [150].- Easily genetically modified (e.g., to overexpress a metabolic enzyme) [150]. | - Poor replication of the 3D TME and nutrient gradients [150].- Genetic drift during long-term culture affects metabolic profiles [150].- Genetically modified lines may have non-physiological target expression levels [150]. |
| Spheroids | 3D aggregates of cells that mimic some aspects of tumor architecture. | - Recapitulate nutrient, oxygen, and pH gradients [149].- Can model penetration and effects of metabolic inhibitors in a more realistic context. | - Often lack the stromal and immune components of the TME.- Can exhibit high core necrosis. |
| Patient-Derived Organoids (PDOs) | 3D structures derived from patient tumor cells that recapitulate the originating tissue [149]. | - Retain patient-specific genetic, metabolic, and phenotypic heterogeneity [149] [151].- Powerful for biobanking and co-clinical trials.- Useful for identifying prognostic/diagnostic metabolic biomarkers and guiding personalized treatment [149]. | - Can lose components of the native TME over time (e.g., immune cells).- Technically challenging and costly to establish and maintain. |
| Organ-on-a-Chip | Microfluidic systems co-culturing human cells to emulate organ-level physiology and tissue-tissue interfaces [151]. | - Model systemic organ crosstalk (e.g., liver metabolism of a drug affecting tumor cells) [151].- Incorporate mechanical forces (e.g., fluid shear stress).- Enable real-time analysis of metabolic interactions and immune cell trafficking [151]. | - Technically complex and low-throughput.- Still under development; may not capture full body system complexity. |
| Tissue Slice Cultures | Thin, precision-cut slices of intact tumor tissue maintaining original tissue architecture and cellular diversity [150]. | - Preserves the native TME, including stromal and immune cells [150].- Ideal for studying patient-specific metabolic responses ex vivo. | - Very short viable lifespan (days).- Limited availability of fresh tumor tissue. |
In Vivo Model Systems
Table 2: In Vivo Models for Metabolic Therapy Validation
| Model Type | Key Characteristics | Advantages for Metabolic Studies | Limitations |
|---|---|---|---|
| Cell Line-Derived Xenografts (CDX) | Human cancer cell lines implanted in immunodeficient mice [150]. | - Rapid, reproducible, and low-cost for in vivo studies.- Suitable for initial efficacy and biodistribution studies. | - Cell lines adapt to in vitro culture, losing original tumor heterogeneity [150].- Lack a functional immune system, ignoring a critical component of the TME and immunotherapy response. |
| Patient-Derived Xenografts (PDX) | Fragments of patient tumors directly implanted into immunodeficient mice [149]. | - Better preserve the genetic, phenotypic, and metabolic heterogeneity of the original tumor [149].- Have demonstrated superior accuracy for biomarker validation (e.g., KRAS, HER2) [149]. | - Lack a human immune system.- Murine stroma gradually replaces human stroma.- Costly and time-consuming to establish. |
| Humanized Mouse Models | Immunodeficient mice engrafted with human hematopoietic stem cells or immune cell populations [150]. | - Contain a functional human immune system, allowing study of immunometabolism and immunotherapy efficacy [49].- Enable investigation of metabolic competition between tumor and immune cells. | - Can develop graft-versus-host disease.- High cost and variability in human immune system reconstitution. |
| Genetically Engineered Mouse Models (GEMMs) | Mice with genetically engineered oncogenes or tumor suppressors that drive spontaneous tumorigenesis [8]. | - Tumors arise in an immunocompetent mouse and authentic TME.- Ideal for studying the role of specific genetic drivers (e.g., KRAS, MYC) in metabolic reprogramming [8]. | - Often long latency and variable tumor development.- Can be expensive to generate and maintain. |
Integrated Experimental Workflow
The following diagram illustrates a proposed integrated workflow that leverages the strengths of both in vitro and in vivo models to enhance translational predictability.
Integrated Therapeutic Development Workflow
Metabolic Pathways and Therapeutic Targets: Experimental Protocols
A deep understanding of core reprogrammed pathways is essential for designing validation experiments.
Key Reprogrammed Metabolic Pathways in Cancer
The diagram below summarizes the major metabolic pathways that are altered in cancer cells and serve as key targets for therapeutic intervention.
Core Altered Metabolic Pathways in Cancer
Detailed Experimental Protocols for Metabolic Validation
Protocol: Functional Validation of Glycolytic Inhibition
Aim: To assess the efficacy and mechanism of action of a glycolytic inhibitor (e.g., 2-Deoxy-D-glucose, HK2 inhibitor) in patient-derived organoids.
Materials:
- Patient-Derived Organoids: Cultured from relevant cancer type.
- Seahorse XF Analyzer: For real-time measurement of extracellular acidification rate (ECAR) and oxygen consumption rate (OCR).
- LC-MS/MS System: For targeted metabolomics.
- Glycolytic Inhibitor: Compound of interest.
- Assay Kits: ATP assay kit, Lactate assay kit.
Method:
- Treatment: Seed organoids in 96-well plates. Treat with a dose range of the glycolytic inhibitor for 24-72 hours. Include a DMSO vehicle control.
- Metabolic Phenotyping (Seahorse XF Glycolysis Stress Test):
- Pre-warm XF assay media.
- Measure basal ECAR/OCR.
- Inject 10 mM Glucose and monitor glycolytic response.
- Inject 1.5 µM Oligomycin (ATP synthase inhibitor) to induce maximum glycolytic capacity.
- Inject 50 mM 2-DG to confirm glycolytic flux inhibition.
- Metabolomic Profiling:
- Post-treatment, lyse organoids in 80% methanol (-80°C).
- Perform targeted LC-MS/MS to quantify levels of glycolytic intermediates (e.g., Glucose-6-P, Fructose-1,6-BP, PEP, Pyruvate, Lactate).
- Functional Readouts:
- Measure intracellular ATP and lactate levels using commercial kits.
- Assess viability via CellTiter-Glo 3D assay.
- Analyze apoptosis (Caspase-3/7 activation) and proliferation (Ki67 staining).
Data Analysis: Calculate glycolytic parameters from Seahorse data: Glycolysis, Glycolytic Capacity, and Glycolytic Reserve. Correlate metabolite level changes with viability and cell death endpoints.
Protocol: Targeting Glutamine Metabolism In Vivo
Aim: To evaluate the anti-tumor efficacy and mechanism of a glutaminase (GLS1) inhibitor in a PDX model.
Materials:
- PDX Model: Selected based on high GLS1 expression or glutamine dependence.
- GLS1 Inhibitor: e.g., CB-839 (Telaglenastat).
- Small Animal PET/CT Imager: For metabolic imaging.
- ¹⁸F-FDG & ¹⁸F-FSPG: Radiotracers for glucose and glutamine metabolism imaging.
- Immunodeficient Mice: NSG or similar strain.
Method:
- Study Design: Implant PDX fragments subcutaneously. Randomize mice into vehicle and treatment groups once tumors reach ~150 mm³.
- Treatment: Administer GLS1 inhibitor or vehicle via oral gavage daily for 21-28 days.
- Longitudinal Metabolic Imaging:
- Perform baseline and endpoint small animal PET/CT with ¹⁸F-FDG (glucose uptake) and ¹⁸F-FSPG (cystine/glutamate transporter activity, a surrogate for glutamine metabolism).
- Quantify tracer uptake as Standardized Uptake Value (SUV).
- Terminal Analysis:
- Collect tumors and weigh them for endpoint efficacy.
- Snap-freeze sections for metabolomics (LC-MS/MS to measure TCA cycle intermediates, glutathione).
- Fix sections for IHC staining of proliferation (Ki67), apoptosis (cleaved Caspase-3), and GLS1 expression.
Data Analysis: Compare tumor growth curves, final tumor weights, and changes in PET tracer uptake between groups. Integrate metabolomic and IHC data to confirm on-target mechanism and identify potential resistance mechanisms.
The Scientist's Toolkit: Key Research Reagents and Platforms
Table 3: Essential Reagents and Platforms for Metabolic Therapy Validation
| Category / Item | Specific Example(s) | Function / Application |
|---|---|---|
| Advanced Model Systems | Patient-Derived Organoids (PDOs), Patient-Derived Xenografts (PDX), Organ-on-a-Chip [149] [151] [150]. | Provide human-relevant, pathophysiologically accurate platforms for studying metabolic dependencies and therapy response. |
| Metabolic Phenotyping | Seahorse XF Analyzer [8]. | Measures real-time extracellular acidification rate (ECAR) and oxygen consumption rate (OCR) to profile glycolysis and mitochondrial respiration. |
| Metabolomics | Liquid Chromatography-Mass Spectrometry (LC-MS/MS) [8]. | Quantifies global or targeted changes in metabolite levels (e.g., TCA intermediates, nucleotides, amino acids) in response to therapy. |
| Metabolic Imaging | ¹⁸F-FDG-PET, ¹⁸F-FSPG-PET [150]. | Non-invasive, longitudinal monitoring of glucose and glutamine metabolism in vivo, enabling tracking of tumor response and metabolic adaptation. |
| Natural Compounds (Metabolic Modulators) | Curcumin, Berberine, EGCG, High-Dose Vitamin C [23]. | Tool compounds that inhibit glycolysis, suppress glutamine transporters (SLC1A5/SLC7A11), or target mitochondrial function for proof-of-concept studies. |
| Single-Cell Transcriptomics | 10x Genomics, scMetabolism R Package [49]. | Deconvolutes metabolic heterogeneity within the TME by quantifying metabolic gene expression in individual immune and tumor cell populations. |
Overcoming the translational gap in metabolic therapy requires a paradigm shift from traditional, siloed models to an integrated, human-relevant approach. By strategically employing a hierarchy of models—from patient-derived organoids for initial high-throughput screening to humanized PDX models for final validation—researchers can build a more robust and predictive dataset. This strategy, underpinned by longitudinal functional assays, multi-omics profiling, and advanced imaging, is critical for de-risking the clinical translation of therapies targeting the metabolic vulnerabilities of cancer.
Abstract Metabolic reprogramming is a established hallmark of cancer, enabling tumor cells to support rapid proliferation, survival, and resistance to therapy. However, the specific metabolic vulnerabilities and adaptations vary significantly across different cancer types. This whitepaper provides a comparative analysis of metabolic reprogramming in four distinct malignancies: Non-Small Cell Lung Cancer (NSCLC), Thyroid Cancer, Breast Cancer, and Glioblastoma (GBM). We synthesize the latest research to delineate cancer-specific alterations in glucose, lipid, and amino acid metabolism, and explore their implications for diagnosis and treatment. The review integrates detailed experimental protocols for studying these pathways, proposes key visualizations of core metabolic networks, and provides a toolkit of essential research reagents. This analysis aims to guide researchers and drug development professionals in identifying and exploiting context-dependent metabolic vulnerabilities for novel therapeutic strategies.
Metabolic reprogramming in cancer encompasses a series of adaptive changes that allow tumor cells to meet their augmented energy and biosynthetic demands while managing oxidative stress [1]. These alterations are controlled by cancer driver mutations, environmental nutrient availability, and complex interactions within the tumor microenvironment (TME) [1]. The core reprogrammed pathways include glucose metabolism (e.g., the Warburg effect), lipid metabolism (e.g., de novo lipogenesis), and amino acid metabolism (e.g., glutaminolysis) [152]. Beyond fueling growth, metabolic reprogramming contributes to metastasis formation, chemoresistance, and immune evasion [1]. This review delves into the unique manifestations of these pathways in NSCLC, Thyroid, Breast, and Glioblastoma cancers, providing a foundation for comparative analysis and targeted therapeutic development.
Comparative Analysis of Core Metabolic Pathways
The metabolic dependencies of cancer cells are not uniform. The following section and table provide a side-by-side comparison of key metabolic targets across the four cancer types.
Table 1: Key Metabolic Alterations and Targets Across Cancer Types
| Cancer Type | Key Glucose Metabolism Targets | Key Lipid Metabolism Targets | Key Amino Acid & Other Targets | Notable TME Interactions |
|---|---|---|---|---|
| Non-Small Cell Lung Cancer (NSCLC) | HK2, PKM2, GLUT1, LDHA [153]. Metabolic flexibility between glycolysis and OXPHOS is common [153]. | FASN, SCD1, ACC; Enhanced de novo lipogenesis [153]. | Reliance on glutaminolysis; OXPHOS remains active and critical [153]. | CAFs fuel tumor growth with metabolic intermediates; hypoxia drives HIF stabilization [153]. |
| Thyroid Cancer (TC) | GLUT1, GLUT3, GLUT4; HK2, PKM2; LDHB, MCT4 [154] [155]. BRAF mutation upregulates PKM2 [154]. | FASN, ACC, ACLY; Overexpressed in PTC and ATC [154]. | Glutamine metabolism significantly enhanced to provide energy and biosynthetic precursors [154]. | Exosomes mediate metabolic reprogramming and immune escape [154]. |
| Breast Cancer | Heightened glycolysis; Increased glucose uptake and lactate production [156] [157]. | Lipids serve as energy source and signaling molecules; escalated demand for lipids [156] [157]. | Escalated demand for glutamine met via synthesis, uptake, or enzyme upregulation [156]. | Metabolic alterations create an immunosuppressive microenvironment [1]. |
| Glioblastoma (GBM) | Pronounced Warburg effect; Glycolysis fuels proliferation [158]. | Rewiring of lipid metabolism supports growth and therapy resistance [158]. | Nucleotide and iron metabolism rewiring contributes to radio- and chemo-resistance [158]. | Extreme heterogeneity leads to subtype-specific metabolic alterations (e.g., proneural vs. mesenchymal) [158]. |
Cancer-Specific Metabolic Nuances
- NSCLC exhibits significant metabolic plasticity, readily switching between glycolysis and mitochondrial OXPHOS to evade therapeutic pressure. Oncogenic drivers like KRAS mutations enhance mitochondrial biogenesis and OXPHOS activity [153].
- Thyroid Cancer shows a strong correlation between metabolic enzyme expression and differentiation status. For instance, poorly differentiated anaplastic TC (ATC) highly expresses GLUT1, while well-differentiated forms show stronger GLUT3 and GLUT4 expression [155].
- Breast Cancer metabolism is influenced by hormone receptor status, with distinct metabolic dependencies across subtypes. The interplay between lipid metabolism and intercellular signaling is a key area of interest [156].
- Glioblastoma leverages metabolic reprogramming not only for growth but also for robust therapy resistance. Targeting metabolic pathways like glycolysis can sensitize GBM cells to radiotherapy and chemotherapy [158].
Experimental Protocols for Metabolic Dysregulation Analysis
To investigate the metabolic vulnerabilities outlined above, robust and reproducible experimental methodologies are required. Below is a detailed protocol for assessing central carbon metabolism, a pathway frequently dysregulated across cancers.
Protocol 1: Targeting Glucose Metabolism via Seahorse Glycolytic Rate Assay Objective: To measure real-time glycolytic flux and capacity in live cancer cells in response to pharmacological inhibition. Application: This assay is ideal for validating the functional consequence of targeting glycolytic enzymes like HK2 or PKM2 in any of the four cancer types.
Materials & Reagents:
- Seahorse XF Glycolytic Rate Assay Kit: Contains modulators and standards for real-time measurement of proton efflux rate (PER), a direct indicator of glycolysis.
- Seahorse XF Analyzer: Instrument platform for performing the live-cell assay.
- Cell Culture Microplates: Specialized 96-well plates for the assay.
- 2-Deoxy-D-Glucose (2-DG): A glucose analog and hexokinase inhibitor used to confirm glycolytic dependency.
- Rotenone & Antimycin A: Complex I and III inhibitors used to shut down mitochondrial respiration, isolating the glycolytic PER.
- Candidate Inhibitor: e.g., a small-molecule inhibitor of PKM2 or GLUT1.
Methodology:
- Cell Seeding & Preparation: Seed cells (e.g., NSCLC, GBM) in a Seahorse microplate at an optimized density and allow them to adhere overnight in standard culture medium.
- Assay Medium Replacement: Prior to the assay, replace the growth medium with unbuffered, substrate-supplemented XF assay medium (pH 7.4) and incubate the cells for 1 hour in a non-CO₂ incubator.
- Inhibitor Treatment: Introduce the candidate metabolic inhibitor (e.g., a PKM2 inhibitor) at this stage to pre-treat the cells.
- Assay Run on Seahorse Analyzer: The analyzer sequentially injects the following compounds while measuring the Oxygen Consumption Rate (OCR) and Proton Efflux Rate (PER) in real-time:
- Injection 1: Rotenone & Antimycin A - This combination inhibits mitochondrial electron transport, collapsing mitochondrial contribution to PER and allowing measurement of glycolysis-derived PER.
- Injection 2: 2-Deoxy-D-Glucose (2-DG) - This inhibits glycolysis by competing with glucose, serving as a negative control to confirm that the measured PER is glycolytic. A sharp drop in PER after 2-DG injection validates the assay.
- Data Analysis: Calculate key parameters from the PER trace:
- Basal Glycolysis: PER rate before any injections.
- Glycolytic Capacity: The maximum PER rate achieved after Rotenone/Antimycin A injection.
- Glycolytic Reserve: The difference between Glycolytic Capacity and Basal Glycolysis, indicating the cell's ability to upregulate glycolysis under stress. Compare these parameters between treated and untreated cells to quantify inhibitor efficacy.
Visualization of Core Metabolic Signaling Network
The following diagram, generated using Graphviz DOT language, illustrates the integrated and interconnected signaling pathways that drive metabolic reprogramming across these cancer types, highlighting common nodes and cancer-specific nuances.
Diagram 1: Integrated Signaling in Cancer Metabolism. This network shows how oncogenic signals converge on key pathways to drive diverse metabolic processes that fuel tumor progression.
The Scientist's Toolkit: Essential Research Reagents
Targeting metabolic reprogramming requires a specific set of research tools. The following table details key reagents for investigating the pathways discussed.
Table 2: Key Research Reagent Solutions for Cancer Metabolism Studies
| Reagent / Tool | Function / Application | Example Use-Case |
|---|---|---|
| Seahorse XF Analyzer | Measures real-time cellular metabolic fluxes (Glycolysis, OXPHOS) in live cells. | Profiling the glycolytic capacity of GBM cells versus normal astrocytes [158]. |
| Small-Molecule Inhibitors | Pharmacologically targets specific metabolic enzymes to assess functional importance. | Using IACS-010759 (OXPHOS inhibitor) to target OXPHOS-dependent NSCLC subsets [153]. |
| Stable Isotope Tracers (e.g., ¹³C-Glucose) | Tracks nutrient fate through metabolic pathways via GC/MS or LC/MS. | Mapping the flux of glucose into the TCA cycle or serine biosynthesis pathway in Breast Cancer cells. |
| CRISPR-Cas9 Screening | Enables genome-wide or pathway-specific gene knockout to identify metabolic vulnerabilities. | Identifying essential lipid metabolism genes in Thyroid Cancer stem cells [154]. |
| Single-Cell & Spatial Metabolomics | Resolves metabolic heterogeneity within tumors and different TME cell populations. | Correlating lactate levels in specific TME regions with immune cell exclusion in NSCLC [153]. |
Discussion and Therapeutic Perspectives
The comparative analysis reveals that while overarching themes like the Warburg effect are widespread, the specific metabolic dependencies and their clinical implications are highly context-dependent. NSCLC's metabolic plasticity necessitates combination therapies targeting both glycolysis and OXPHOS [153]. In Thyroid Cancer, the role of exosomes in metabolic reprogramming presents a novel avenue for diagnostic and therapeutic intervention [154]. For Breast Cancer, the interplay between lipid metabolism and signaling networks offers promising targets [156]. In Glioblastoma, overcoming therapy resistance requires targeting metabolic pathways like nucleotide synthesis in conjunction with standard care [158].
Future research must leverage advanced technologies like single-cell metabolomics and spatial metabolomics to fully decipher intra-tumoral metabolic heterogeneity [153]. Furthermore, the integration of metabolic inhibitors with immunotherapy represents a promising frontier, as the metabolic state of the TME is a critical determinant of anti-tumor immune response [1]. The continued elucidation of these complex metabolic networks will be instrumental in designing the next generation of personalized cancer therapies.
Cancer cells undergo profound metabolic reprogramming to support their rapid growth, proliferation, and survival in harsh microenvironments. This phenomenon, recognized as a core hallmark of cancer, involves significant alterations in energy production pathways including glycolysis, oxidative phosphorylation, glutaminolysis, and lipid metabolism [138] [7]. The foundational discovery by Otto Warburg in the 1930s revealed that cancer cells preferentially utilize glycolysis for energy production even in the presence of abundant oxygen - a phenomenon known as the Warburg effect or aerobic glycolysis [138] [7]. This metabolic rewiring is driven by oncogenes (e.g., MYC, RAS), tumor suppressor genes (e.g., TP53), and hypoxia-inducible factors (HIFs), which collectively enhance glucose uptake, increase glycolytic enzyme expression, and alter mitochondrial function [138] [7]. Beyond glycolysis, tumors also exhibit increased dependence on glutaminolysis to fuel the tricarboxylic acid (TCA) cycle and generate biosynthetic precursors [138]. The recognition of these metabolic dependencies has opened promising therapeutic avenues for targeting cancer metabolism, leading to a rapidly expanding clinical trial landscape for metabolic inhibitors in oncology.
Key Metabolic Pathways and Molecular Targets
Glycolytic Pathway
The glycolytic pathway represents the most prominently altered metabolic pathway in cancer cells. Compared to normal cells, cancer cells demonstrate dramatically elevated glucose uptake and lactate production despite adequate oxygen availability [138] [7]. This aerobic glycolysis is mediated by the upregulation of glucose transporters (especially GLUT1, GLUT3, and GLUT4) and key glycolytic enzymes including hexokinase 2 (HK2), lactate dehydrogenase A (LDHA), and pyruvate kinase M2 (PKM2) [138] [92]. Major oncogenes such as Ras, Myc, and HIF-1α function as master inducers of cancer glycolysis, while insufficient p53-mediated control further promotes glycolytic flux [138]. The glycolytic pathway provides cancer cells with not only energy but also necessary precursors for biosynthesis through branching pathways such as the pentose phosphate pathway, which generates nucleotides and NADPH [138].
Mitochondrial Metabolism
Despite the prominence of the Warburg effect, many cancer cells maintain functional mitochondrial metabolism and continue to rely on oxidative phosphorylation (OXPHOS) for energy production and biosynthetic precursor generation [159] [7]. Mitochondria in cancer cells undergo significant adaptations, including alterations in the TCA cycle, electron transport chain activity, and metabolic byproduct handling. Mutations in TCA cycle enzymes such as succinate dehydrogenase (SDH), fumarate hydratase (FH), and isocitrate dehydrogenase (IDH) create unique metabolic vulnerabilities in certain cancers [7]. Furthermore, cancer cells exhibit enhanced glutaminolysis, catabolizing glutamine into glutamate and α-ketoglutarate to replenish TCA cycle intermediates—a process largely regulated by the oncogene c-Myc [138]. This metabolic flexibility allows tumors to adapt to fluctuating nutrient availability and microenvironments.
Lipid Metabolism
Cancer cells significantly alter their lipid metabolism to support membrane biogenesis, signaling molecules, and energy production. These alterations include enhanced de novo lipogenesis, increased fatty acid uptake, and altered fatty acid oxidation [7] [92]. Key enzymes in lipid synthesis such as ATP-citrate lyase (ACLY), fatty acid synthase (FASN), and stearoyl-CoA desaturase-1 (SCD1) are frequently upregulated in tumors [92]. The sterol regulatory element-binding protein (SREBP) transcription factors serve as master regulators of lipid metabolism in cancer cells, promoting the expression of lipogenic genes [92]. Additionally, fatty acid oxidation is often enhanced in certain cancer types, providing an alternative energy source particularly under metabolic stress.
Tumor Microenvironment and Metabolic Crosstalk
The tumor microenvironment (TME) plays a crucial role in shaping and maintaining cancer metabolic reprogramming. Metabolic interactions between cancer cells and various stromal components (including cancer-associated fibroblasts, immune cells, and endothelial cells) create metabolic compartmentalization within tumors [92] [116]. For instance, lactate produced by glycolytic cancer cells can be utilized by oxidative cancer cells or stromal cells as an energy source, establishing a metabolic symbiosis [138]. Additionally, cancer cells can extract nutrients from the TME, such as amino acids from extracellular protein degradation, and metabolites from neighboring adipocytes [159]. The acidic and nutrient-depleted TME resulting from tumor metabolism also impairs anti-tumor immune responses by suppressing T cell function and promoting immunosuppressive cell populations [92] [116].
Figure 1: Key Metabolic Pathways in Cancer and Therapeutic Targets. Cancer cells rewire multiple metabolic pathways including glycolysis, mitochondrial metabolism, glutaminolysis, and lipid metabolism. These pathways are regulated by oncogenes, tumor suppressors, HIF, and microenvironmental factors. Therapeutic inhibitors target key nodes across these pathways.
Clinical Trial Landscape: Approved Metabolic Inhibitors
The clinical development of metabolic inhibitors has gained substantial momentum, with several agents receiving recent regulatory approval and many others in advanced clinical testing. The following table summarizes key recently approved metabolic inhibitors in oncology:
Table 1: Recently FDA-Approved Metabolic Inhibitors in Oncology (July-September 2025)
| Therapeutic Agent | Molecular Target | Cancer Indication | Key Trial Results | Approval Type |
|---|---|---|---|---|
| Dordaviprone (Modeyso) | D2/3 dopamine receptor, mitochondrial ClpP | H3 K27M-mutated diffuse midline glioma | Accelerated approval based on response rate after prior therapy | Accelerated Approval |
| (R)-GNE-140 | LDHA/B | Under investigation in multiple solid tumors | Preferential suppression of ovarian cancer cell proliferation in combination [159] | Clinical Testing |
| BMS-986205 (Linrodostat) | IDO1, Complex I (off-target) | Under investigation in multiple solid tumors | Synergistic activity with LDHA/B inhibitors; induces tumor cell senescence [159] | Clinical Testing |
Recent FDA approvals between July and September 2025 introduced five new molecular entities, including the first-in-class therapy dordaviprone for H3 K27M-mutated diffuse midline glioma [160]. This agent employs a dual mechanism targeting dopamine signaling and mitochondrial metabolism, representing a novel approach to targeting cancer metabolism [160]. Additionally, the approval of alternative delivery methods for existing drugs like gemcitabine intravesical system for bladder cancer and new formulations of selumetinib for pediatric neurofibromatosis type 1 demonstrate ongoing innovation in metabolic targeting strategies [160].
Beyond single-agent approaches, combination therapies targeting multiple metabolic pathways simultaneously represent a promising strategy to overcome metabolic plasticity and compensatory mechanisms. A recent synthetic lethality screen identified synergistic anti-tumor activity when combining the LDHA/B inhibitor (R)-GNE-140 with the IDO1 inhibitor BMS-986205, which was subsequently found to have an off-target inhibition of mitochondrial complex I [159]. This combination preferentially halted proliferation of ovarian cancer cells by simultaneously disrupting glycolysis and oxidative phosphorylation, causing energetic catastrophe that resulted in either cell death or senescence [159]. Such combination approaches are increasingly moving into clinical testing.
Emerging Metabolic Targets and Investigational Agents
Lactate Dehydrogenase (LDH) Inhibition
Lactate dehydrogenase A (LDHA), which catalyzes the conversion of pyruvate to lactate, represents a promising therapeutic target in cancer metabolism. LDHA is frequently overexpressed in tumors and plays a crucial role in maintaining glycolytic flux, NAD+ regeneration, and intracellular pH homeostasis [138] [159]. The investigational agent (R)-GNE-140 is a potent inhibitor of both LDHA and LDHB isoforms. Preclinical studies demonstrate that (R)-GNE-140 effectively suppresses glycolytic flux and reduces lactate production in cancer cells [159]. However, monotherapy with LDHA/B inhibitors often shows limited efficacy due to cancer cells' ability to compensate through alternative pathways, particularly oxidative phosphorylation [159]. This limitation has prompted the development of combination strategies simultaneously targeting multiple metabolic pathways.
Mitochondrial Complex I Inhibition
Unexpected discoveries have revealed that certain investigational agents originally developed for other targets possess off-target activity against mitochondrial complex I. BMS-986205 (Linrodostat), initially developed as an IDO1 inhibitor for cancer immunotherapy, was subsequently found to inhibit the ubiquinone reduction site of respiratory complex I, thereby compromising mitochondrial ATP production [159]. This discovery emerged from observations of synergistic activity when BMS-986205 was combined with LDHA/B inhibitors, as simultaneous disruption of glycolysis and oxidative phosphorylation created an "energetic catastrophe" for cancer cells [159]. This combination approach demonstrated highly synergistic activity in approximately one-third of tested tumor cell lines and patient-derived cancer organoids, with response correlating with alterations in genes involved in metabolic regulation [159].
Glutaminase Inhibition
Glutaminase (GLS) catalyzes the first step in glutaminolysis, converting glutamine to glutamate, and represents another promising metabolic target. Many cancers, particularly those with c-Myc activation, develop dependence on glutamine to fuel the TCA cycle and support biosynthesis of nucleotides and amino acids [138] [7]. Preclinical studies demonstrate that GLS1 inhibition selectively impairs the growth of SDH-deficient tumors, which exhibit heightened sensitivity to glutaminase inhibition due to their specific metabolic vulnerabilities [7]. Several glutaminase inhibitors have entered clinical development, though their efficacy as monotherapy has been limited by adaptive resistance mechanisms, prompting investigation of combination approaches.
Glucose Transporter Inhibition
The elevated glucose uptake characteristic of cancer cells is mediated by overexpression of glucose transporters, particularly GLUT1. Investigational agents such as WZB117, which inhibits GLUT1 function, have demonstrated promising preclinical activity [7]. In SDH-deficient tumors, which rely heavily on glycolysis due to TCA cycle impairment, GLUT1 inhibition effectively reduces glucose uptake, decreases intracellular ATP, downregulates glycolytic enzymes, and inhibits tumor growth [7]. These findings support the therapeutic potential of targeting glucose transporters, particularly in tumors with specific metabolic dependencies.
Table 2: Select Investigational Metabolic Inhibitors in Clinical Development
| Therapeutic Agent | Molecular Target | Development Stage | Key Cancer Types | Notable Features |
|---|---|---|---|---|
| Cemsidomide | IKZF1/3 degrader | Phase 1/2 | Multiple myeloma, NHL | Oral degrader; ORR 36% in MM, 38% in NHL [161] |
| CFT1946 | BRAF V600 degrader | Phase 1/2 | BRAF V600 solid tumors | Brain-penetrant; monotherapy dose escalation completion 1H 2025 [161] |
| CFT8919 | EGFR L858R degrader | Phase 1 | NSCLC with EGFR L858R | Oral degrader; Phase 1 data expected 2025 [161] |
| WZB117 | GLUT1 inhibitor | Preclinical | SDH-deficient tumors | Reduces glucose uptake and intracellular ATP [7] |
Experimental Models and Methodologies
Preclinical Models for Metabolic Studies
The evaluation of metabolic inhibitors relies on specialized experimental models that recapitulate the metabolic features of human tumors. Genetically engineered cell lines with defined oncogenic transformations (e.g., fallopian tube secretory epithelial cells expressing KRASG12V and MYC) enable direct comparison of metabolic dependencies between non-transformed and transformed cells [159]. Three-dimensional culture systems, including cancer spheroids and patient-derived organoids, better mimic the metabolic heterogeneity and microenvironmental constraints of human tumors compared to traditional 2D cultures [159]. These models demonstrate that metabolic inhibitor efficacy is influenced by spatial organization, nutrient gradients, and stromal interactions present in 3D contexts.
Metabolic Flux Analysis
Seahorse extracellular flux analyzers represent a cornerstone technology for evaluating metabolic inhibitor effects in real-time. This methodology simultaneously measures the extracellular acidification rate (ECAR, primarily reflecting glycolytic lactate production) and oxygen consumption rate (OCR, reflecting mitochondrial respiration) in live cells [159]. The experimental protocol involves baseline measurement followed by sequential injection of specific metabolic modulators: oligomycin (ATP synthase inhibitor) to assess ATP-linked respiration, FCCP (mitochondrial uncoupler) to measure maximal respiratory capacity, and rotenone/antimycin A (complex I and III inhibitors) to determine non-mitochondrial oxygen consumption [159]. This approach enables researchers to dissect the specific effects of metabolic inhibitors on various aspects of mitochondrial function and glycolytic metabolism.
Synthetic Lethality Screening
Synthetic lethal screening approaches have proven valuable for identifying effective combinations of metabolic inhibitors. A typical screening protocol involves treating paired non-transformed and oncogenically transformed cells with sublethal concentrations of individual metabolic inhibitors, followed by pairwise combinations across different target classes [159]. Cell viability is assessed using validated methods such as CellTiter-Glo ATP assays, which provide a direct measurement of metabolic activity. Hit combinations demonstrating selective toxicity toward transformed cells are advanced for mechanistic validation. This approach successfully identified the synergistic combination of (R)-GNE-140 (LDHA/B inhibitor) and BMS-986205 (complex I inhibitor), which preferentially targeted oncogene-transformed cells through simultaneous disruption of glycolysis and oxidative phosphorylation [159].
Figure 2: Experimental Workflow for Metabolic Inhibitor Development. The screening process begins with establishing appropriate cell models, followed by dose-finding studies and combination screening. Hit combinations undergo rigorous validation using increasingly complex models from 2D cultures to patient-derived organoids.
Research Reagent Solutions
Table 3: Essential Research Tools for Cancer Metabolism Studies
| Reagent/Category | Specific Examples | Research Application | Key Features |
|---|---|---|---|
| Viability Assays | CellTiter-Glo ATP Assay | High-throughput screening | Luminescent detection of cellular ATP levels |
| Metabolic Flux Kits | Seahorse XF Glycolysis Stress Test Kit | Real-time glycolytic flux | Measures ECAR after glucose, oligomycin, 2-DG |
| Metabolic Flux Kits | Seahorse XF Mito Stress Test Kit | Mitochondrial function | Measures OCR after oligomycin, FCCP, rotenone/antimycin |
| Metabolic Inhibitors | (R)-GNE-140 | LDHA/B inhibition research | Potent dual LDHA/B inhibitor; IC50 ~2-3 nM [159] |
| Metabolic Inhibitors | BMS-986205 (Linrodostat) | Complex I/IDO1 inhibition | Off-target complex I inhibition at clinical concentrations [159] |
| Metabolic Inhibitors | WZB117 | GLUT1 inhibition studies | Reduces glucose uptake; enhances chemo-sensitivity [7] |
| Cell Line Models | Immortalized FTSECs with KRASG12V/MYC | Transformation studies | Defined oncogenic transformation; metabolic comparison [159] |
| 3D Culture Systems | Patient-derived organoids | Clinical relevance testing | Preserves tumor heterogeneity and microenvironment |
| Metabolomics | LC-MS/MS platforms | Comprehensive metabolite profiling | Quantifies 100+ polar and lipid metabolites |
Challenges and Future Directions
The clinical development of metabolic inhibitors faces several significant challenges. Metabolic plasticity enables cancer cells to develop resistance to single-agent metabolic inhibitors by upregulating compensatory pathways [7]. For example, inhibition of glycolysis often leads to increased dependence on oxidative phosphorylation, while disruption of mitochondrial metabolism may enhance glycolytic flux [159]. This adaptability necessitates combination approaches that simultaneously target multiple metabolic dependencies. Additionally, patient stratification represents a critical challenge, as predictive biomarkers for metabolic inhibitor response remain limited. Current research efforts focus on identifying genetic (e.g., mutations in metabolic enzymes), metabolic (e.g., imaging features from FDG-PET), and functional biomarkers to select patients most likely to benefit from metabolic targeting strategies [7] [92].
Emerging research directions include the development of novel drug modalities such as targeted protein degraders (PROTACs) for metabolic enzymes. These agents offer potential advantages over traditional inhibitors, including complete elimination of target proteins, ability to target non-enzymatic scaffolding functions, and potential to overcome adaptive resistance [161]. Clinical-stage degraders such as cemsidomide (IKZF1/3), CFT1946 (BRAF V600), and CFT8919 (EGFR L858R) represent the vanguard of this approach [161]. Additionally, the integration of artificial intelligence and computational prediction tools is accelerating metabolic target discovery and drug development. The DeepTarget algorithm, which integrates large-scale drug and genetic knockdown viability screens with multi-omics data, has demonstrated superior performance in predicting both primary and secondary drug targets, potentially accelerating the identification of novel metabolic inhibitor combinations [97].
The interplay between cancer metabolism and the tumor immune microenvironment represents another frontier for therapeutic development. Metabolic competition between cancer cells and immune cells in the TME contributes to immune suppression and resistance to immunotherapy [92]. Cancer cells' high glucose consumption creates local glucose deprivation that impairs T cell function, while lactate accumulation acidifies the TME and suppresses cytotoxic activity [92] [116]. Consequently, metabolic modulators are increasingly being investigated in combination with immune checkpoint inhibitors to enhance anti-tumor immunity. Preclinical studies demonstrate that metabolic inhibitors can reprogram the immunosuppressive TME and sensitize tumors to immunotherapy, suggesting promising combinatorial approaches [92].
In conclusion, the clinical trial landscape for metabolic inhibitors in oncology is rapidly evolving, driven by deepening understanding of cancer metabolic dependencies and innovative therapeutic strategies. While challenges remain regarding patient selection, combination strategies, and resistance mechanisms, metabolic targeting represents a promising approach for overcoming therapeutic resistance and improving outcomes for cancer patients. The continued integration of basic metabolic science, advanced preclinical models, and clinical translation will likely yield increasingly effective metabolic targeting strategies in the coming years.
Cancer cells are well-documented to rewire their metabolism and energy production networks to support and enable rapid proliferation, continuous growth, survival in harsh conditions, invasion, metastasis, and resistance to cancer treatments [138]. This metabolic reprogramming, recognized as one of the hallmarks of cancer, includes striking alterations such as elevated glycolysis, increased glutaminolytic flux, upregulation of amino acid and lipid metabolism, and enhancement of mitochondrial biogenesis [138]. Since Otto Warburg's seminal discovery in the 1930s that tumor cells preferentially metabolize glucose into lactate even in the presence of oxygen (a phenomenon known as aerobic glycolysis or the Warburg effect), researchers have increasingly recognized the fundamental importance of metabolic dysregulation in cancer pathogenesis [138] [162].
The metabolic alterations in cancer cells create dependencies on specific metabolic pathways, producing abnormal metabolites that can serve as powerful biomarkers for cancer detection, diagnosis, prognosis, and treatment monitoring [162]. This whitepaper provides an in-depth technical guide to two key approaches for leveraging cancer metabolism in clinical and research settings: metabolic imaging using 18F-Fluorodeoxyglucose Positron Emission Tomography (FDG-PET) and circulating metabolite profiling. We examine the validation frameworks, technical requirements, experimental protocols, and clinical applications of these metabolic biomarkers, with particular emphasis on their importance in anticancer drug development for researchers, scientists, and drug development professionals.
Metabolic Imaging Biomarkers: FDG-PET
Biological Basis and Technical Principles
FDG-PET imaging leverages the fundamental metabolic alteration in most cancer cells: their increased glucose metabolism. The technique utilizes a radiolabeled glucose analog, 18F-fluorodeoxyglucose (FDG), which is transported into cells via glucose transporters (primarily GLUT1, GLUT3, and GLUT4) and phosphorylated by hexokinase 2 (HK2) to FDG-6-phosphate [163] [138]. Unlike glucose-6-phosphate, FDG-6-phosphate cannot undergo further glycolysis and becomes metabolically trapped intracellularly, accumulating in tumor cells in proportion to their glycolytic rate [163].
The molecular basis for this increased glycolysis in cancer cells involves several interconnected mechanisms. Tumor cells activate specific metabolic pathways due to significant gradients of critical factors for cell growth, such as oxygen, glucose, and nutrients [163]. Hypoxia, widespread in solid tumors, stabilizes hypoxia-inducible factor-1α (HIF-1α), which dimerizes with HIF-1β to form an active transcription factor that upregulates glycolytic enzymes and vascular endothelial growth factor (VEGF) [163]. Additionally, cancer cells maintain a high glycolytic rate even under aerobic conditions (the Warburg effect) through activation of oncogenes such as AKT, MYC, and RAS, or loss of tumor suppressors including p53 [163] [138].
Table 1: Key Radiotracers for Metabolic PET Imaging in Oncology
| Radiotracer | Metabolic Target | Isotope Half-Life | Primary Applications | Advantages/Limitations |
|---|---|---|---|---|
| 18F-FDG | Glucose metabolism | 110 minutes | Most cancers (lung, colorectal, lymphoma, etc.) [163] | Widely available; limited specificity in inflammation |
| 11C-Choline | Lipid metabolism (membrane synthesis) | 20 minutes | Prostate cancer, brain tumors [163] | More specific for tumors; short half-life requires on-site cyclotron |
| 11C-Methionine | Amino acid transport | 20 minutes | Brain tumors, prostate cancer [163] | Low background in normal brain; short half-life |
| 18F-Fluoroethyltyrosine (FET) | Amino acid transport | 110 minutes | Brain tumors | Longer half-life than 11C-labeled analogs |
| 18F-Fluorocholine | Lipid metabolism (membrane synthesis) | 110 minutes | Prostate cancer, hepatocellular carcinoma | Longer half-life than 11C-choline |
FDG-PET Biomarker Validation Framework
The validation of FDG-PET as an imaging biomarker requires demonstration of both technical reliability and clinical utility. From a technical perspective, FDG-PET must demonstrate excellent reproducibility, sensitivity, and specificity for detecting malignant lesions [163]. Clinically, FDG-PET has been validated for diagnosis, staging, restaging, and assessment of treatment response in multiple cancer types [163].
A critical application of FDG-PET is as an early interim imaging biomarker for evaluating response to chemotherapy. A prospective study in patients with pancreatic ductal adenocarcinoma (PDAC) demonstrated that metabolic response assessment by FDG-PET at approximately 4 weeks after starting first-line chemotherapy could predict overall survival [164]. The study applied modified PERCIST (Positron Emission Tomography Response Criteria in Solid Tumors) criteria, defining metabolic responders as those with ≥30% decrease in tumor SUVmax (maximum standardized uptake value) [164]. The results showed that early metabolic responders (26% of patients) had significantly longer median overall survival (36.2 months) compared to non-responders, with a hazard ratio of 2.0 [164].
Table 2: FDG-PET Response Criteria and Thresholds for Treatment Response Assessment
| Response Category | PERCIST Criteria | Modified PERCIST (Pancreatic Cancer Study) | RECIST 1.1 (Anatomic) |
|---|---|---|---|
| Complete Metabolic Response | Complete resolution of FDG uptake | Complete resolution of FDG uptake | Disappearance of all lesions |
| Partial Metabolic Response | ≥30% decrease in SULpeak | ≥30% decrease in SUVmax | ≥30% decrease in sum of diameters |
| Stable Metabolic Disease | Not CMR, PMR, or PMD | Not CMR, PMR, or PMD | Not CR, PR, or PD |
| Progressive Metabolic Disease | ≥30% increase in SULpeak or new lesions | ≥30% increase in SUVmax or new lesions | ≥20% increase in sum of diameters |
The Centers for Medicare and Medicaid Services (CMS) covers FDG-PET applications for initial and subsequent treatment strategies in most common cancers, including colorectal, esophageal, head and neck, lymphoma, non-small cell lung, and breast cancer [163]. This coverage reflects the validated clinical utility of FDG-PET in oncology practice.
Diagram 1: FDG-PET Imaging Workflow
Experimental Protocol: FDG-PET for Treatment Response Assessment
Purpose: To evaluate early metabolic response to first-line chemotherapy in patients with pancreatic ductal adenocarcinoma using FDG-PET/CT.
Materials and Equipment:
- PET/CT scanner (e.g., Siemens Biograph series)
- 18F-FDG radiopharmaceutical
- Serum glucose monitoring system
- Intravenous and oral contrast media
- Workstation with image processing software (e.g., Siemens e-soft, version 4.0)
Patient Preparation:
- Patients fast for a minimum of 6 hours before scanning
- Verify capillary blood glucose level (<8 mmol/L required for scanning)
- Administer intravenous hydration if clinically appropriate
FDG Administration and Image Acquisition:
- Administer 7.77 MBq (0.21 mCi)/kg of 18F-FDG intravenously
- Maintain uptake period of 60 minutes in a quiet, dimly lit room
- Acquire low-dose CT scan for attenuation correction and anatomical localization
- Perform PET acquisition from mid-thigh to vertex (whole-body)
- Reconstruct images using iterative algorithm (ordered-subset expectation maximization)
Image Analysis:
- Three independent readers quantify 18F-FDG uptake by placing volume of interest on primary pancreatic tumor
- Record SUVmax (maximum standardized uptake value) for each lesion
- Calculate percentage change in SUVmax between baseline and interim scans
- Classify metabolic response according to predefined criteria:
- Complete metabolic response: complete resolution of FDG uptake
- Partial metabolic response: ≥30% decrease in SUVmax
- Stable metabolic disease: neither response nor progression criteria met
- Progressive metabolic disease: ≥30% increase in SUVmax or new lesions
Statistical Analysis:
- Perform receiver-operating-characteristic (ROC) analysis to determine optimal SUVmax cutoff for predicting overall survival
- Generate Kaplan-Meier survival curves stratified by metabolic response
- Calculate hazard ratios using Cox proportional hazards model [164]
Circulating Metabolite Biomarkers
Analytical Platforms and Technologies
Circulating metabolites provide a window into the real-time metabolic activity of tumors and can be sampled through minimally invasive liquid biopsies. The primary analytical platforms for metabolite profiling include liquid chromatography-tandem mass spectrometry (LC-MS/MS), Meso Scale Discovery (MSD) electrochemiluminescence assays, and traditional enzyme-linked immunosorbent assays (ELISA) [165].
LC-MS/MS has emerged as a powerful tool for metabolomic studies, offering high sensitivity, specificity, and the ability to analyze hundreds to thousands of metabolites in a single run [166] [165]. This platform is particularly valuable for discovering novel metabolite biomarkers and conducting untargeted metabolomic profiling. MSD technology, utilizing electrochemiluminescence detection, provides up to 100 times greater sensitivity than traditional ELISA and enables multiplexed analysis of multiple biomarkers simultaneously within a single sample [165]. This multiplexing capability is especially advantageous when sample volume is limited or when analyzing complex metabolic pathways.
The selection of appropriate analytical technology should follow a "fit-for-purpose" validation approach, where the level of validation is tailored to the intended clinical use of the biomarker [165]. For exploratory discovery studies, high-resolution MS platforms may be preferred, while validated immunoassays might be more appropriate for high-throughput clinical application.
Major Classes of Cancer-Related Metabolites
Cancer metabolism research has identified several key classes of circulating metabolites that serve as promising biomarkers for cancer detection and monitoring:
Oncometabolites: Metabolites that accumulate due to cancer-associated mutations in metabolic enzymes and drive tumorigenesis through inhibition of epigenetic enzymes and suppression of DNA repair [162]. Key oncometabolites include:
- 2-hydroxyglutarate (2-HG): Accumulates in IDH-mutant gliomas and acute myeloid leukemia
- Succinate: Accumulates in tumors with succinate dehydrogenase (SDH) mutations
- Fumarate: Accumulates in hereditary leiomyomatosis and renal cell cancer with fumarate hydratase (FH) mutations
Amino acids and derivatives: Tumor cells require adequate supplies of amino acids to support proliferation and biosynthesis. Altered levels of specific amino acids have been associated with various cancers:
- Branched-chain amino acids (leucine, isoleucine, valine): Activate mTORC1 signaling and serve as carbon sources for energy production [162]
- Glutamine: The most studied amino acid in cancer metabolism, highly expressed in cancer cells and associated with overall survival and drug resistance [162]
- Tryptophan and kynurenine: Enhanced tryptophan metabolism reported in multiple tumor types [162]
Lipid metabolites: Reprogrammed lipid metabolism is a hallmark of many cancers, with specific lipid species serving as potential biomarkers:
- Polyunsaturated fatty acids (e.g., arachidonic acid, linoleic acid): Show great sensitivity and specificity for early cancer detection [162]
- Phospholipids: Differential phospholipid profiles distinguish cancer patients from healthy controls
- Cholesterol and oxysterols: Regulate tumor microenvironment and immune cell function [162]
Table 3: Key Circulating Metabolite Biomarkers in Cancer
| Metabolite Class | Specific Metabolites | Associated Cancers | Biological Significance |
|---|---|---|---|
| Oncometabolites | 2-hydroxyglutarate | Glioma, AML [162] | Inhibits DNA repair enzymes; promotes tumorigenesis |
| Oncometabolites | Succinate | Paraganglioma, pheochromocytoma [162] | Stabilizes HIF-1α; promotes angiogenesis |
| Oncometabolites | Fumarate | Hereditary leiomyomatosis, RCC [162] | Inhibits HIF prolyl hydroxylase |
| Amino Acids | Branched-chain amino acids | Pancreatic, gastric [162] | Activates mTORC1 signaling |
| Amino Acids | Glutamine | Multiple cancer types [162] | Supports nitrogen and carbon metabolism |
| Amino Acids | Serine/Glycine | Breast, colorectal [162] | Supports one-carbon metabolism |
| Lipid Metabolites | Polyunsaturated fatty acids | Lung, breast [162] | Precursors for signaling molecules |
| Lipid Metabolites | Lysophosphatidylcholines | Ovarian, prostate [162] | Membrane phospholipid derivatives |
| Glycolytic Metabolites | Lactate | Multiple cancer types [162] | Product of aerobic glycolysis; acidifies TME |
Experimental Protocol: LC-MS/MS-Based Metabolite Profiling
Purpose: To identify and validate circulating metabolite biomarkers for cancer detection and risk stratification using liquid chromatography-tandem mass spectrometry.
Materials and Equipment:
- High-performance liquid chromatography system coupled to tandem mass spectrometer
- Appropriate analytical columns (e.g., C18 for reversed-phase chromatography)
- Solvent reservoirs and mobile phase components
- Certified metabolite standards for calibration
- Quality control materials (pooled plasma samples)
- Sample preparation equipment (centrifuge, vortex mixer, pipettes)
Sample Collection and Preparation:
- Collect plasma samples from patients and matched controls after overnight fasting
- Process samples within 30 minutes of collection by centrifugation at 4°C
- Aliquot and store plasma at -80°C until analysis
- Thaw samples on ice and precipitate proteins with cold methanol or acetonitrile
- Centrifuge to remove precipitated proteins and collect supernatant
- Evaporate supernatant under nitrogen and reconstitute in appropriate mobile phase
LC-MS/MS Analysis:
- Inject samples onto LC column equilibrated with initial mobile phase conditions
- Perform chromatographic separation using gradient elution
- Interface LC eluent with mass spectrometer via electrospray ionization source
- Acquire data in appropriate mode (multiple reaction monitoring for targeted analysis, full scan for untargeted analysis)
- Include quality control samples throughout analytical batch to monitor system performance
Data Processing and Analysis:
- Integrate chromatographic peaks for target metabolites
- Normalize peak areas using internal standards
- Create calibration curves using certified standards
- Perform statistical analysis to identify differentially abundant metabolites:
- Multivariate analysis (principal component analysis, partial least squares-discriminant analysis)
- Univariate analysis (t-tests, fold-change calculations)
- Correction for multiple testing (false discovery rate)
- Construct metabolite risk scores using machine learning approaches (LASSO regression, random forests)
Validation:
- Analytical validation: Assess precision, accuracy, sensitivity, specificity, and reproducibility
- Biological validation: Confirm findings in independent patient cohort
- Clinical validation: Evaluate association with clinical endpoints (diagnosis, prognosis, treatment response) [167]
Diagram 2: Metabolite Biomarker Development Workflow
Regulatory and Validation Considerations
Biomarker Validation Framework
The successful translation of metabolic biomarkers from discovery to clinical application requires rigorous validation following established regulatory frameworks. The US National Institutes of Health (NIH) Biomarkers Definitions Working Group defines a biomarker as "a characteristic that is objectively measured and evaluated as an indicator of normal biological processes, pathogenic processes, or pharmacologic responses to a therapeutic agent" [168].
Biomarker validation should be performed in stages on a "fit-for-purpose" basis, avoiding unnecessarily dogmatic adherence to rigid guidelines but with careful monitoring of progress at the end of each stage [168]. The validation process encompasses several key components:
Analytical validation: Demonstration that the biomarker assay performance characteristics (accuracy, precision, sensitivity, specificity, reproducibility) are acceptable for its intended use [168] [165]. This includes assessment of:
- Selectivity and specificity
- Sensitivity (limit of detection, limit of quantification)
- Accuracy and precision
- Analytical range
- Stability under storage conditions
Clinical validation: Establishment that the biomarker has consistent correlation with clinical outcomes [165]. This requires:
- Demonstration of association with relevant clinical endpoints
- Confirmation in independent patient cohorts
- Evidence of clinical utility
Regulatory qualification: The evidentiary process of proving a linkage between the biomarker and clinical endpoint, resulting in regulatory acceptance for a specific context of use [168].
The European Medicines Agency (EMA) and US Food and Drug Administration (FDA) have introduced formal biomarker qualification processes that provide a regulatory stamp of approval, validating the biomarker's suitability for use in drug development [165]. A review of the EMA biomarker qualification procedure revealed that 77% of biomarker challenges were linked to assay validity, with frequent issues including problems with specificity, sensitivity, detection thresholds, and reproducibility [165].
The Scientist's Toolkit: Essential Research Reagents and Platforms
Table 4: Key Research Reagent Solutions for Metabolic Biomarker Studies
| Tool Category | Specific Tools/Platforms | Function | Key Features |
|---|---|---|---|
| Imaging Platforms | PET/CT scanners (e.g., Siemens Biograph) | Metabolic imaging | Combined anatomical and functional imaging |
| Radiotracers | 18F-FDG, 11C-choline, 18F-fluoroethyltyrosine | Target specific metabolic pathways | Varying half-lives and metabolic targets |
| Mass Spectrometry | LC-MS/MS systems | Metabolite identification and quantification | High sensitivity and specificity |
| Immunoassays | MSD U-PLEX platform | Multiplexed biomarker analysis | Simultaneous measurement of multiple analytes |
| Separation Technology | HPLC/UPLC systems | Chromatographic separation of metabolites | High resolution and reproducibility |
| Bioinformatics | Metabolomic data processing software | Data analysis and interpretation | Multivariate statistical analysis capabilities |
| Reference Materials | Certified metabolite standards | Assay calibration and validation | Traceable to reference methods |
Metabolic biomarkers, including those derived from FDG-PET imaging and circulating metabolite profiling, offer powerful tools for cancer detection, prognosis, and treatment response assessment. The validation of these biomarkers requires a systematic, fit-for-purpose approach that addresses both analytical and clinical considerations. As our understanding of cancer metabolism continues to evolve, these metabolic biomarkers will play an increasingly important role in precision oncology, enabling more personalized and effective cancer therapies.
The integration of artificial intelligence and machine learning with metabolic biomarker data holds particular promise for extracting deeper insights from complex metabolomic datasets and developing more accurate predictive models [169]. Furthermore, the application of metabolic biomarkers is expanding beyond oncology into central nervous system disorders, autoimmune diseases, and metabolic conditions, following a trajectory similar to the early development of precision oncology [169].
For researchers and drug development professionals, successful implementation of metabolic biomarker strategies requires careful consideration of regulatory requirements, appropriate validation methodologies, and selection of technological platforms that balance analytical performance with practical considerations. By leveraging the insights from cancer metabolic reprogramming, these biomarkers provide a window into the functional state of tumors and offer unprecedented opportunities for improving cancer diagnosis and treatment.
Metabolic reprogramming is a established hallmark of cancer, enabling tumor cells to sustain rapid proliferation, survive in hostile microenvironments, and evade therapeutic pressure. While targeting cancer metabolism represents a promising therapeutic strategy, the efficacy of metabolic inhibitors is invariably limited by diverse and adaptive resistance mechanisms. This technical review systematically compares the cellular adaptations to inhibitors of glycolysis, oxidative phosphorylation, glutamine metabolism, and lipid synthesis. We synthesize findings from recent preclinical and clinical studies to delineate how cancer cells deploy metabolic plasticity, activate compensatory pathways, and rewire their energetic networks to withstand metabolic targeting. The analysis provides a framework for developing combination therapies that preemptively counter resistance by simultaneously targeting multiple nodal points in cancer metabolic networks.
The rewiring of cellular metabolism is a fundamental adaptation that supports tumor growth and progression. Cancer cells exhibit distinct metabolic features including enhanced aerobic glycolysis (the Warburg effect), elevated de novo fatty acid synthesis, increased glutamine utilization, and dysregulated mitochondrial metabolism [92] [112]. These adaptations not only supply energy and biosynthetic precursors but also create dependencies that can be therapeutically exploited.
The targeting of metabolic enzymes and pathways has emerged as a promising anticancer strategy. However, like conventional therapies, metabolic inhibitors face the challenge of resistance development. Cancer cells demonstrate remarkable metabolic plasticity—the ability to dynamically switch between fuel sources and biochemical pathways—which represents a primary mechanism of escape [143]. Understanding the specific resistance mechanisms activated in response to different metabolic inhibitors is crucial for designing more durable treatment strategies.
This review contrasts the adaptive responses to four major classes of metabolic inhibitors, examining the molecular pathways, compensatory mechanisms, and experimental approaches for investigating these resistance programs. The analysis is situated within the broader context of targeting metabolic reprogramming to suppress tumor growth and overcome therapeutic resistance.
Core Metabolic Pathways and Their Inhibitors
Major Metabolic Dependencies in Cancer Cells
Cancer cells develop distinct metabolic dependencies that support their biosynthetic and energetic demands:
- Aerobic Glycolysis: Preferential use of glycolysis over oxidative phosphorylation for glucose metabolism, even under oxygen-sufficient conditions [112] [170].
- Glutaminolysis: Dependence on glutamine as a carbon source for the tricarboxylic acid (TCA) cycle, nitrogen donor for biosynthesis, and regulator of redox homeostasis [112].
- Mitochondrial Metabolism: Enhanced oxidative phosphorylation (OXPHOS) and fatty acid oxidation (FAO), particularly in therapy-resistant cells [112] [143].
- Lipid Synthesis: Increased de novo fatty acid and cholesterol production to support membrane biogenesis and signaling [92] [171].
Established Metabolic Inhibitors
Table 1: Classes of Metabolic Inhibitors and Their Primary Targets
| Metabolic Pathway | Representative Inhibitors | Primary Molecular Target | Therapeutic Context |
|---|---|---|---|
| Glycolysis | 2-Deoxy-D-Glucose, Lonidamine | HK2, GLUT1 | NSCLC, preclinical models |
| OXPHOS | Metformin, IACS-010759 | ETC Complex I | Breast, lung cancers |
| Glutamine Metabolism | Telaglenastat, CB-839 | GLS | Renal cell carcinoma, clinical trials |
| Fatty Acid Synthesis | TVB-2640, Orlistat | FASN | HCC, CRC, clinical trials |
| Aldo-Keto Reductases | Epalrestat | AKR1B1 | HCC, preclinical models |
Resistance Mechanisms to Specific Metabolic Inhibitors
Glycolysis Inhibition
Cancer cells initially dependent on glycolysis employ multiple adaptive mechanisms to survive glycolytic inhibition:
Metabolic Shift to Oxidative Metabolism: Upon glycolytic inhibition, cells enhance mitochondrial OXPHOS to maintain energy production. This adaptation is particularly evident in cisplatin-resistant lung cancer cells, which demonstrate reduced glycolytic activity but increased mitochondrial respiration and oxygen consumption [112]. This shift is mediated through upregulation of PGC-1α and activation of transcription factors that promote mitochondrial biogenesis.
Compensatory Nutrient Utilization: When glucose utilization is impaired, cancer cells increase reliance on alternative carbon sources, particularly glutamine. Glutamine serves as anaplerotic substrate for the TCA cycle, enabling continued ATP production through mitochondrial metabolism [112]. This metabolic flexibility is regulated by oncogenic signaling pathways including MYC and HIF-1α.
Redox Homeostasis Remodeling: Glycolysis inhibition disrupts NAD+ regeneration and pentose phosphate pathway flux, potentially increasing oxidative stress. Resistant cells counteract this by enhancing glutathione synthesis and increasing NADPH production through mitochondrial pathways [143].
OXPHOS Targeting
Inhibition of mitochondrial metabolism triggers following resistance pathways:
Glycolytic Reactivation: Cancer cells treated with OXPHOS inhibitors rapidly increase glucose uptake and glycolytic flux to compensate for ATP deficits [112]. This adaptation involves activation of AMPK signaling, which promotes glucose transporter translocation and enhances glycolytic enzyme activity.
Fatty Acid Oxidation Dependency: In colorectal cancer models, OXPHOS inhibition leads to compensatory activation of fatty acid oxidation as an alternative energy source [143]. This transition is mediated by PPAR-α signaling and upregulation of CPT1A, the rate-limiting enzyme in mitochondrial fatty acid uptake.
Metabolic Synthase Upregulation: Hepatocellular carcinoma cells resistant to OXPHOS inhibitors demonstrate increased expression of AKR1B1, an aldo-keto reductase that regulates the polyol pathway and supports redox balance under metabolic stress [171].
Glutamine Metabolism Blockade
The inhibition of glutaminase, the first enzyme in glutaminolysis, induces several adaptive responses:
Macropinocytosis Induction: Nutrient-starved cells internalize extracellular proteins via macropinocytosis, providing alternative substrates for the TCA cycle [112]. This process is regulated by growth factor signaling and cytoskeletal rearrangements.
Amino Acid Substrate Rewiring: Upon glutaminase inhibition, cells increase utilization of other amino acids including serine, glycine, and branched-chain amino acids to sustain central carbon metabolism [112].
ASCT2 Transporter Upregulation: Some cancer cells increase expression of the glutamine transporter ASCT2 (SLC1A5) to enhance glutamine uptake, potentially compensating for reduced intracellular glutamine utilization efficiency [112].
Lipid Synthesis Inhibition
Targeting fatty acid synthesis evokes distinct resistance mechanisms:
Scavenging Pathways Activation: When de novo lipogenesis is inhibited, cancer cells enhance exogenous fatty acid uptake through upregulation of fatty acid transporters including CD36 and fatty acid binding proteins (FABPs) [171].
Storage Metabolism Remodeling: Resistant hepatocellular carcinoma cells shift lipid flux toward storage pathways, accumulating lipid droplets that can be mobilized during metabolic stress [171].
AKR1B1-Mediated Resistance: Multi-drug resistant HCC cells demonstrate AKR1B1 overexpression, which regulates glucose-lipid metabolic pathways and enhances stress tolerance through unclear mechanisms [171].
Table 2: Comparative Analysis of Resistance Mechanisms Across Metabolic Inhibitor Classes
| Inhibitor Class | Primary Resistance Mechanisms | Key Regulatory Factors | Compensatory Pathways |
|---|---|---|---|
| Glycolysis Inhibitors | OXPHOS enhancement, Glutamine dependency, Antioxidant upregulation | PGC-1α, MYC, NRF2 | Mitochondrial metabolism, Glutaminolysis |
| OXPHOS Inhibitors | Glycolytic flux increase, FAO activation, AKR1B1 upregulation | HIF-1α, AMPK, PPAR-α | Glycolysis, Fatty acid oxidation |
| Glutaminase Inhibitors | Macropinocytosis, Amino acid switching, Transporter upregulation | RTK signaling, ATF4 | Protein scavenging, Alternate amino acid metabolism |
| Lipogenesis Inhibitors | Fatty acid uptake enhancement, Lipid storage, AKR1B1 overexpression | SREBP, AKR1B1 signaling | Exogenous lipid uptake, Storage metabolism |
Experimental Approaches for Investigating Resistance Mechanisms
Metabolomic and Flux Analysis
Stable Isotope Tracing: Utilizing 13C-labeled or deuterated metabolites (e.g., 13C-glucose, 13C-glutamine) to track metabolic flux through pathways under inhibitor treatment [170]. This approach enables quantification of pathway contributions and identification of compensatory nutrient utilization.
LC-MS/MS Metabolomics: Liquid chromatography coupled with tandem mass spectrometry provides comprehensive profiling of intracellular metabolites, revealing metabolic adaptations to inhibitor treatment [171].
Transcriptomic and Proteomic Profiling
Single-Cell RNA Sequencing: Resolves heterogeneity in metabolic adaptations within tumor cell populations and identifies rare resistant subpopulations [171].
Multi-Omics Integration: Combined analysis of transcriptomic, proteomic, and metabolomic data constructs comprehensive networks of metabolic reprogramming in resistant cells [171] [143].
Functional Validation
CRISPR Screening: Genome-wide or metabolic gene-focused CRISPR screens identify genetic modifiers of inhibitor sensitivity and resistance mechanisms [171].
Metabolic Inhibitor Combinations: Testing sequential versus concurrent administration of metabolic inhibitors to prevent or overcome resistance [112] [143].
Figure 1: Sequential Activation of Resistance Programs Following Metabolic Inhibition. Metabolic inhibitors trigger immediate adaptive responses that evolve into established resistance mechanisms through multiple interconnected pathways.
The Scientist's Toolkit: Essential Research Reagents
Table 3: Key Research Reagents for Investigating Metabolic Resistance Mechanisms
| Reagent/Category | Specific Examples | Research Application | Experimental Context |
|---|---|---|---|
| Stable Isotope Tracers | U-13C-glucose, 13C-glutamine | Metabolic flux analysis | Tracking nutrient utilization shifts in resistant cells |
| Metabolic Inhibitors | Telaglenastat (GLSi), IACS-010759 (OXPHOSi) | Target validation, Combination studies | Preclinical models of therapeutic resistance |
| Antibody Panels | Anti-GLUT1, Anti-CD36, Anti-AKR1B1 | Protein expression analysis | IHC, Western blot for transporter/enzyme upregulation |
| Genomic Tools | CRISPR libraries, siRNA pools | Functional screening | Identification of resistance modifiers |
| Cell Culture Models | Patient-derived organoids (PDOs), 3D spheroids | Physiologic drug testing | Assessment of resistance in microenvironment context |
| Analytical Platforms | Seahorse Analyzer, LC-MS/MS | Metabolic phenotyping | Bioenergetics profiling, metabolomics |
Methodologies for Key Experiments
Establishing Resistant Cell Lines
Long-Term Drug Escalation Method:
- Begin with parental cells (e.g., Huh-7 for HCC) at low passage number.
- Culture cells in gradually increasing concentrations of metabolic inhibitor (e.g., starting at IC10, increasing by 10-20% each passage).
- Maintain cells at each concentration until proliferation normalizes (typically 3-5 population doublings).
- Continue escalation until target resistance level achieved (e.g., 2-5x IC50 of parental line).
- Validate resistance stability through drug-free passage for 10+ generations [171].
Characterization Assays:
- Dose-response curves (IC50 determination)
- Cross-resistance profiling to unrelated agents
- Growth kinetics comparison
- Metabolic phenotyping (Seahorse extracellular flux analysis)
Metabolic Flux Analysis with Stable Isotopes
Experimental Workflow:
- Culture resistant and control cells in standard medium until 70-80% confluence.
- Replace medium with isotope-labeled substrate (e.g., 10mM U-13C-glucose in DMEM without glucose).
- Incubate for predetermined time points (e.g., 0, 15min, 30min, 1h, 4h, 24h).
- Quench metabolism with cold methanol:acetonitrile:water (40:40:20 v/v) at -20°C.
- Extract intracellular metabolites, analyze by LC-MS/MS.
- Calculate isotopologue distributions and metabolic fluxes using computational modeling [170].
Single-Cell Transcriptomics of Resistant Populations
Protocol Overview:
- Generate single-cell suspensions from resistant and control models.
- Partition cells into nanoliter-scale droplets with barcoded beads (10X Genomics platform).
- Reverse transcribe mRNA within droplets to preserve cell-of-origin information.
- Prepare sequencing libraries emphasizing 3' transcript ends.
- Sequence to depth of 50,000 reads/cell minimum.
- Analyze data to identify metabolic subpopulations and resistance signatures [171].
Figure 2: Integrated Experimental Workflow for Deciphering Metabolic Resistance Mechanisms. A three-phase approach spanning model development, multi-omics mechanistic analysis, and functional validation provides comprehensive insights into resistance pathways.
Discussion and Therapeutic Implications
The systematic comparison of resistance mechanisms across different classes of metabolic inhibitors reveals both shared and distinct adaptive programs. A fundamental pattern emerges wherein cancer cells deploy their inherent metabolic plasticity to bypass targeted pathway inhibition, typically by activating compensatory fuel utilization pathways. This analysis yields several strategic implications for therapeutic development:
Combination Therapies: Simultaneous targeting of primary metabolic dependencies and compensatory pathways may prevent resistance development. For example, combining glycolytic inhibitors with OXPHOS suppression or glutaminase inhibitors with autophagy blockers creates synthetic lethality in resistant cells [112] [143].
Sequential Treatment Strategies: Knowledge of predictable resistance trajectories enables design of sequential treatment regimens that proactively target emerging dependencies.
Biomarker-Driven Approaches: Identification of early indicators of resistance adaptation (e.g., AKR1B1 elevation, metabolic imaging changes) permits timely intervention before full resistance emerges [171].
Targeting Metabolic Plasticity Regulators: Rather than individual pathways, targeting master regulators of metabolic plasticity (e.g., AMPK, mTOR, HIF-1α) may prevent the adaptive rewiring that underlies resistance [143].
The continued development of sophisticated experimental models—including patient-derived organoids, engineered microenvironment systems, and AI-assisted multi-omics integration—will enhance our understanding of resistance mechanisms in physiologically relevant contexts. Ultimately, overcoming resistance to metabolic inhibitors will require dynamic therapeutic approaches that evolve alongside the adapting tumor metabolism.
This systematic comparison of resistance mechanisms to different metabolic inhibitor classes reveals that cancer cells deploy characteristic adaptive programs based on the specific metabolic vulnerability being targeted. While the particular pathways differ, a universal theme emerges: cancer cells exploit their metabolic plasticity to activate compensatory fueling routes when confronted with metabolic inhibition. Understanding these predictable resistance trajectories provides a rational basis for designing combination therapies that preemptively block escape routes. Future advances will require sophisticated experimental models that capture the dynamic nature of metabolic adaptation and its intersection with tumor microenvironmental factors. The strategic targeting of cancer metabolism remains a promising approach, but its ultimate success depends on anticipating and countering the resilient adaptability of tumor cell metabolism.
The therapeutic index represents a critical pharmacological measure that balances the efficacy of a drug against its toxicity. In cancer treatment, this balance is particularly precarious, as clinicians must administer sufficient drug concentrations to effectively kill tumor cells while minimizing harm to a patient's healthy cells [172]. For pediatric patients, this challenge is even more pronounced, as the difference between effective and toxic concentrations—the therapeutic index—is often dangerously small [172]. The concept of therapeutic index assessment has evolved significantly with advances in pharmacogenomics, which examines how genetic differences influence individual responses to drugs, enabling more personalized treatment approaches that maximize efficacy while minimizing adverse effects [172].
Within the context of cancer metabolic reprogramming, therapeutic index assessment becomes increasingly complex. Cancer cells undergo profound metabolic alterations to support their rapid proliferation and survival, rewiring glucose, amino acid, lipid, and nucleotide metabolic pathways [2] [1]. These adaptations create potential therapeutic vulnerabilities, but targeting them presents unique challenges due to the essential nature of these pathways in normal cells. The tumor microenvironment (TME), characterized by nutrient deprivation, hypoxia, and acidity, further shapes metabolic adaptations and influences drug responses [8]. This technical guide examines the assessment of therapeutic indices across different metabolic target classes, providing researchers and drug development professionals with frameworks for evaluating the efficacy-toxicity balance in this promising therapeutic arena.
Metabolic Reprogramming in Cancer: Foundations for Targeting
The Metabolic Landscape of Cancer Cells
Metabolic reprogramming represents a fundamental hallmark of cancer, enabling tumor cells to meet the heightened demands for energy, biosynthetic precursors, and redox balance required for rapid proliferation [2] [1]. Unlike normal cells, which primarily rely on oxidative phosphorylation for energy production, cancer cells preferentially utilize aerobic glycolysis (the Warburg effect) even in oxygen-sufficient conditions [2] [8]. This metabolic shift, while less efficient for ATP production per glucose molecule, provides strategic advantages by generating intermediate metabolites that feed various biosynthetic pathways and support biomass accumulation [8].
The orchestration of metabolic reprogramming involves a complex interplay of genetic alterations, signaling pathways, and environmental cues within the TME. Key oncogenes such as c-MYC, KRAS, and AKT drive metabolic rewiring to support biosynthetic demands, while tumor suppressors like p53, PTEN, and LKB1 normally restrain these alterations [8]. Additionally, non-coding RNAs have emerged as significant regulators of cancer metabolism, with long non-coding RNAs and microRNAs fine-tuning the expression and activity of metabolic enzymes and pathways [8]. Various growth factors and hypoxia-inducible factors (HIFs) within the TME further shape the metabolic profile of cancer cells, creating a dynamic adaptive system that promotes survival and progression [8].
Metabolic Pathways as Therapeutic Targets
The metabolic dependencies of cancer cells present attractive therapeutic opportunities. Key targetable pathways include:
- Glucose metabolism: Encompassing enhanced glucose uptake via overexpression of glucose transporters (GLUTs), elevated glycolytic flux, pentose phosphate pathway activation, and tricarboxylic acid (TCA) cycle alterations [2].
- Amino acid metabolism: Particularly glutamine metabolism (glutaminolysis), which provides nitrogen for biosynthetic processes and TCA cycle intermediates [2].
- Lipid metabolism: Including increased lipid uptake, de novo lipogenesis, and lipid storage mobilization to support membrane biosynthesis and signaling pathways [2].
- Nucleotide metabolism: Featuring alterations in both salvage and de novo synthesis pathways to meet the heightened demands for DNA and RNA production [2].
Each of these pathways presents unique challenges for therapeutic targeting based on their essentiality in normal cells, the degree of differential dependency between cancerous and normal tissues, and the adaptive capacity of cancer cells to rewire their metabolic networks—all factors that fundamentally influence the achievable therapeutic index [8].
Methodologies for Therapeutic Index Assessment
Pharmacogenomic Approaches
Pharmacogenomics has revolutionized therapeutic index assessment by enabling personalized dosing based on genetic profiles. This approach examines how interindividual genetic variations influence drug handling and response, allowing for therapy individualization to maximize efficacy and minimize toxicity [172]. The discovery of variants in genes such as TPMT and NUDT15 exemplifies successful clinical implementation of pharmacogenomics. These genes significantly impact tolerance to mercaptopurine, a chemotherapeutic essential for treating acute lymphoblastic leukemia (ALL) [172]. Patients with specific variants in these genes experience heightened toxicity due to altered drug metabolism, necessitating dose reductions to maintain an appropriate therapeutic index [172].
Advanced methodologies in pharmacogenomics now extend beyond coding regions to explore noncoding DNA elements, which regulate cellular responses to treatment through changes in gene expression [172]. Techniques such as high-throughput massively parallel reporter screens and 3D mapping tools have identified over 500 functional variants within noncoding DNA elements related to chemotherapy resistance in ALL [172]. These regulatory elements can influence distant genes through DNA looping structures, as demonstrated by a noncoding variant that affects EIF3A expression and vincristine resistance despite genomic distance [172]. For metabolic targets, similar approaches can identify genetic modifiers of therapeutic response, enabling more precise therapeutic index calculations across patient populations.
Pharmacokinetic Assessment
Pharmacokinetic studies form another cornerstone of therapeutic index assessment, examining how the body processes a drug through absorption, distribution, metabolism, and excretion [172]. For metabolic-targeted therapies, understanding pharmacokinetic behavior is essential, as insufficient drug concentrations at target sites render treatments ineffective, while excessive concentrations or prolonged exposure leads to toxicity [172].
Preclinical pharmacokinetic profiling helps triage drug candidates based on their likelihood of achieving favorable therapeutic indices. A prime example comes from brain tumor drug development, where candidates must adequately cross the blood-brain barrier to reach their targets [172]. Pharmacokinetic assessment of the drug mirdametinib demonstrated sufficient brain penetration and an acceptable profile, supporting its advancement to clinical trials for pediatric brain tumors (SJ901) [172]. Additionally, pharmacokinetic studies are crucial when repurposing adult cancer drugs for pediatric populations, as children exhibit distinct physiological responses to drugs, including differences in enzyme maturation, drug metabolism, and body composition [172].
Table 1: Core Methodologies for Therapeutic Index Assessment in Metabolic-Targeted Therapies
| Methodology | Key Components | Applications in Metabolic Targeting | Considerations |
|---|---|---|---|
| Pharmacogenomics | Genetic variant identification, Expression quantitative trait loci (eQTL) mapping, 3D chromatin structure analysis | Predicting toxicity risk from nucleotide analogs, Identifying synthetic lethal interactions with metabolic mutations | Population-specific allele frequencies, Integration of rare variants, Epigenetic regulation |
| Pharmacokinetics | Absorption/bioavailability studies, Tissue distribution analysis, Metabolism and excretion profiling | Blood-brain barrier penetration for brain tumor metabolism drugs, Tissue-specific exposure for organ-specific toxicities | Pediatric vs. adult metabolic differences, Drug-drug interactions at metabolic enzymes |
| Toxicity Profiling | Organ-specific toxicity assessment, Time-to-onset analysis, Dose-limiting toxicity identification | Class-specific toxicities (e.g., hepatotoxicity with glutamine inhibitors), Delayed toxicities from metabolite accumulation | Cumulative toxicity with chronic administration, Interaction with comorbid conditions |
| Efficacy Metrics | Target engagement measures, Biomarker modulation, Tumor growth inhibition, Overall survival | PET imaging with 18FDG for glycolytic inhibitors, Metabolomic profiling of pathway modulation, Adaptive response monitoring | Compensatory pathway activation, Tumor heterogeneity in metabolic dependencies |
Experimental Protocols for Metabolic Therapeutic Index Assessment
In Vitro Assessment Protocol
Objective: Evaluate baseline efficacy and mechanism-based toxicity of metabolic-targeting compounds in physiologically relevant models.
Procedure:
- Establish co-culture systems containing cancer cells and non-malignant cell types (e.g., fibroblasts, immune cells) to model on-target off-tumor toxicity
- Dose-response assessment across physiological glucose (5 mM) and low glucose (1 mM) conditions to model nutrient stress
- Metabolomic profiling at multiple time points (6, 24, 72 hours) to measure target engagement and adaptive metabolic rewiring
- Viability assessment using multiplexed assays that distinguish cancer cell killing versus non-malignant cell toxicity
- Rescue experiments through supplementation with pathway metabolites to confirm on-target effects
Key Readouts: IC50 values for cancer versus normal cells, metabolic flux changes, compensatory pathway activation, biomarker modulation (e.g., metabolite levels).
In Vivo Therapeutic Index Determination Protocol
Objective: Quantify therapeutic index in physiologically intact systems with tumor microenvironment context.
Procedure:
- Implement patient-derived xenograft models with preserved metabolic heterogeneity
- Conduct pharmacokinetic-pharmacodynamic studies with timed tissue collection for drug levels and target modulation assessment
- Comprehensive toxicity monitoring including body weight, organ function (liver enzymes, renal function), and histopathological examination
- Metabolic imaging (e.g., 18F-FDG PET) to monitor tumor response and normal tissue exposure
- Dose-ranging studies with multiple dose levels to establish steepness of efficacy versus toxicity curves
Key Readouts: Maximum tolerated dose (MTD), efficacious dose (ED), therapeutic index (MTD/ED), target-associated toxicity biomarkers, metabolic adaptation evidence.
Therapeutic Index Across Metabolic Target Classes
Glucose Metabolism Targets
Targeting the Warburg effect and associated glycolytic dependencies represents a cornerstone of metabolic cancer therapy development. The heightened glycolytic flux in cancer cells creates potential vulnerabilities, but the universal requirement for glucose metabolism in normal tissues—particularly the brain and erythrocytes—poses significant therapeutic index challenges [2] [8].
GLUT inhibitors and glycolytic enzyme blockers have demonstrated efficacy in preclinical models but often narrow therapeutic indices in clinical translation. For instance, 2-deoxy-D-glucose (2-DG), a glucose analog that inhibits hexokinase, showed promising antitumor activity but dose-limiting toxicities including cardiotoxicity and neurotoxicity [8]. Similar challenges have emerged with lactate dehydrogenase A (LDHA) inhibitors, which can cause lactic acidosis—a toxicity directly related to their mechanism of action [8].
Combination approaches may improve therapeutic indices by exploiting synthetic lethal interactions. Pancreatic cancers with KRAS mutations display enhanced glucose uptake and dependency, potentially widening the therapeutic index for glycolytic inhibitors in this genetic context [8]. Similarly, pairing glycolytic inhibitors with drugs that block compensatory metabolic pathways may enhance efficacy without proportionally increasing toxicity [2].
Amino Acid Metabolism Targets
Amino acid deprivation strategies and metabolic enzyme inhibition represent promising approaches with variable therapeutic indices across different amino acid pathways. Glutamine metabolism targeting has garnered significant attention, with glutaminase inhibitors such as CB-839 demonstrating clinical activity in certain cancer subtypes [2] [8].
The therapeutic index of glutamine-targeting agents appears context-dependent. Renal cell carcinomas and hematopoietic malignancies with transcriptional amplification of glutaminase show heightened sensitivity, potentially widening the therapeutic window [8]. However, toxicity to glutamine-dependent normal cells—particularly immune cells and hepatocytes—can limit dosing [8]. Additionally, resistance frequently emerges through adaptive upregulation of alternative amino acid salvage pathways or increased macropinocytosis to scavenge extracellular proteins [8].
Asparagine depletion via L-asparaginase represents a success story with a favorable therapeutic index in specific malignancies. This agent exploits the differential dependency of ALL cells on extracellular asparagine, as they possess limited asparagine synthetase expression [2]. Normal cells with robust asparagine synthesis capacity are relatively spared, creating a wide therapeutic window that has made asparaginase a cornerstone of ALL therapy [2].
Table 2: Therapeutic Index Profiles Across Metabolic Target Classes
| Metabolic Target Class | Representative Agents | Efficacy Metrics (ORR, PFS) | Dose-Limiting Toxicities | Therapeutic Index Challenges |
|---|---|---|---|---|
| Glycolytic Inhibitors | 2-DG, Lonidamine, FX11 | Limited single-agent activity (ORR <10%), Disease stabilization in subsets | Neurotoxicity, Cardiotoxicity, Lactic acidosis | Universal glucose requirement in normal tissues, Metabolic flexibility |
| Glutamine Metabolism Inhibitors | CB-839, V-9302, DON | ORR 15-30% in biomarker-selected populations, PFS extension 2-4 months | Hepatotoxicity, Gastrointestinal toxicity, Hematological toxicity | Immune cell suppression, Compensatory anaplerosis |
| Fatty Acid Synthesis Inhibitors | TVB-2640, FASN inhibitors | Disease control rate 40-60%, Delayed progression in breast cancers | Dermatological toxicity, Weight loss, Metabolic syndrome | Lipotoxicity to normal tissues, Lipid scavenging adaptation |
| Mitochondrial Metabolism Inhibitors | IACS-010759, ME-344 | Tumor regression in preclinical models, Limited clinical efficacy | Peripheral neuropathy, Cardiac arrhythmias, Fatigue | OXPHOS essential for high-energy normal tissues |
| De Novo Nucleotide Synthesis Inhibitors | Methotrexate, Pemetrexed | ORR 20-50% in responsive tumors, Established combination efficacy | Myelosuppression, Mucositis, Hepatotoxicity | Rapidly dividing normal tissues (gut, bone marrow) |
Lipid Metabolism Targets
Targeting lipid metabolic reprogramming in cancer presents both opportunities and challenges for therapeutic index optimization. Cancer cells exhibit enhanced lipogenesis, increased lipid storage, and modified fatty acid oxidation to support membrane production, energy storage, and signaling pathways [2] [8].
Fatty acid synthase (FASN) inhibitors such as TVB-2640 have demonstrated antitumor activity in clinical trials, particularly in breast cancer and other lipogenically active malignancies [8]. The therapeutic index for these agents may be favorable because many normal cells preferentially utilize circulating lipids rather than relying heavily on de novo lipogenesis [8]. However, dose-limiting toxicities including dermatological effects and metabolic perturbations have been observed, likely reflecting the importance of lipogenesis in specific normal tissues [8].
Inhibitors of fatty acid oxidation, such as etomoxir (a CPT1A inhibitor), have demonstrated preclinical efficacy but face therapeutic index challenges due to cardiac toxicity—a consequence of the heart's heavy reliance on fatty acid oxidation for energy production [8]. This has prompted searches for tumor-specific isoforms or contextual vulnerabilities that might widen the therapeutic window.
Nucleotide Metabolism Targets
Nucleotide metabolism represents one of the oldest targets in cancer therapy, with a well-established but often narrow therapeutic index. Antimetabolites such as methotrexate, 5-fluorouracil, and mercaptopurine inhibit key enzymes in de novo nucleotide synthesis, exploiting the heightened nucleotide demands of rapidly proliferating cancer cells [2].
The therapeutic index of these agents is constrained by their effects on normal proliferating tissues, particularly bone marrow and gastrointestinal mucosa [172] [2]. Pharmacogenomic advances have significantly improved therapeutic index optimization for this class, with TPMT and NUDT15 genotyping now guiding mercaptopurine dosing to avoid severe myelosuppression while maintaining efficacy [172]. This represents a paradigm for personalized therapeutic index management that could extend to newer metabolic targets.
Visualization of Therapeutic Index Assessment Framework
Diagram 1: Therapeutic Index Assessment Workflow for Metabolic Targets. This framework integrates efficacy and toxicity evaluation across the drug development continuum, from target identification to personalized dosing strategies.
Research Reagent Solutions for Metabolic Therapeutic Index Studies
Table 3: Essential Research Reagents for Metabolic Therapeutic Index Assessment
| Reagent Category | Specific Examples | Research Applications | Therapeutic Index Relevance |
|---|---|---|---|
| Metabolic Profiling Kits | Seahorse XF Glycolysis Stress Test Kits, LC-MS metabolomics kits, Stable isotope tracer compounds | Real-time metabolic flux analysis, Pathway utilization mapping, Compensatory pathway identification | Quantifying on-target effects, Identifying mechanism-based toxicities, Adaptive response monitoring |
| Genetic Assessment Tools | CRISPR/Cas9 metabolic gene libraries, TPMT/NUDT15 genotyping assays, SNP arrays for pharmacogenomics | Synthetic lethal interaction screening, Toxicity susceptibility prediction, Personalized dosing guidance | Identifying patient subgroups with improved therapeutic indices, Predicting dose-limiting toxicities |
| Cell-Based Model Systems | Co-culture systems (cancer/stromal/immune cells), 3D organoid cultures, Patient-derived organoids | Tissue-relevant toxicity assessment, Microenvironmental influence evaluation, Patient-specific response modeling | Modeling on-target off-tumor toxicity, Assessing tissue-specific toxicities |
| Animal Models | Patient-derived xenografts, Genetically engineered models, Humanized immune system models | In vivo efficacy assessment, Toxicokinetic studies, Maximum tolerated dose determination | Establishing therapeutic index (MTD/ED50), Evaluating organ-specific toxicity patterns |
| Biomarker Assays | Circulating metabolite panels, Imaging biomarkers (18F-FDG PET), Pharmacodynamic markers | Target engagement verification, Early efficacy signals, Toxicity biomarker monitoring | Bridging efficacy and toxicity measures, Providing early therapeutic index predictions |
Therapeutic index assessment for metabolic targets in cancer therapy requires sophisticated, integrated approaches that balance potent antitumor effects against mechanism-based toxicities. The future of metabolic cancer therapeutics lies in developing strategies to widen the therapeutic window through several key approaches:
First, predictive biomarker development will enable better patient selection, identifying those tumors with specific metabolic dependencies that create larger therapeutic indices [172] [8]. Second, rational combination therapies that target compensatory pathways may enhance efficacy without proportionally increasing toxicity [2] [8]. Third, tissue-specific targeting approaches such as antibody-drug conjugates directed against metabolic enzymes or transporters could limit off-tumor effects [173].
The field must also address the challenge of metabolic plasticity, wherein cancer cells adapt to targeted interventions by rewiring their metabolic networks [8]. This adaptation not limits therapeutic efficacy but may also inadvertently shift toxicity patterns. Advanced functional imaging and liquid biopsy approaches that monitor metabolic adaptation in real time will be crucial for dynamic therapeutic index assessment [8].
Finally, the integration of pharmacogenomic insights with metabolic targeting holds exceptional promise for personalized therapeutic index optimization [172]. As demonstrated by the successful implementation of TPMT and NUDT15 genotyping for mercaptopurine dosing, understanding individual genetic factors that influence both drug efficacy and toxicity enables truly personalized therapeutic index management [172]. Extending this approach to newer metabolic targets will require comprehensive preclinical models and innovative clinical trial designs that prioritize therapeutic index assessment alongside traditional efficacy endpoints.
Cancer cells undergo profound metabolic reprogramming to support their rapid proliferation, survival, and resistance to treatment. This metabolic rewiring, a recognized hallmark of cancer, primarily features enhanced glycolysis (the Warburg effect), increased glutaminolysis, and heightened mitochondrial biogenesis [138]. These adaptations do not merely fuel tumor growth but also create an immunosuppressive tumor microenvironment (TME) that cripples effective anti-tumor immunity. The TME is often characterized by nutrient depletion, accumulation of waste products like lactate, and low pH, which collectively inhibit the function of cytotoxic T cells and natural killer (NK) cells while promoting regulatory T cells (Tregs) and M2-like macrophages [174]. This intricate link between tumor metabolism and immune evasion forms the rational basis for combining metabolic drugs with emerging immunotherapies. By disrupting the metabolic dependencies of cancer cells, we can potentially reverse immunosuppression and sensitize tumors to immunotherapeutic attack, offering a promising synergistic approach for oncology drug development.
Core Mechanisms of Metabolic-Immunotherapeutic Synergy
The synergy between metabolic drugs and immunotherapies operates through several interconnected biological mechanisms. Disrupting cancer metabolism can directly enhance immune cell function and counteract the immunosuppressive signals within the TME.
- Glycolysis Inhibition and TME Normalization: Cancer cells' high glycolytic flux leads to lactate accumulation in the TME. Lactate lowers the extracellular pH and directly hinders cytokine production and cytolytic activity of T cells [174]. Inhibitors of glycolytic enzymes, such as 1,3-bromopyruvate (BrP), an hexokinase II (HK-II) inhibitor, can disrupt this cycle. BrP not only blocks glycolysis but also induces oxidative stress and autophagy in cancer cells, thereby compromising their viability and potentially reversing lactate-driven immunosuppression [94].
- Mitochondrial Targeting for Enhanced Apoptosis: Mitochondria are critical hubs for energy production and apoptosis regulation. Targeting mitochondrial metabolism with agents like BrP conjugated to a triphenylphosphonium (TPP+) cation, which facilitates mitochondrial accumulation, can disrupt energy homeostasis and increase reactive oxygen species (ROS) production, pushing cancer cells toward death [94].
- Checkpoint Inhibitor Re-sensitization via Metabolic Modulation: The immunosuppressive TME can render tumors resistant to immune checkpoint inhibitors (ICIs). Metabolic drugs can reverse this resistance. For instance, the targeted therapy zanzalintinib inhibits VEGFR, MET, and TAM kinases. This not only blocks tumor growth pathways but also counteracts immune suppression, making the TME more permissive for ICIs like atezolizumab (anti-PD-L1). This combination has demonstrated improved survival in metastatic colorectal cancer [175].
- Gut Microbiota Modulation: The gut microbiome bidirectionally regulates systemic immune homeostasis and ICI efficacy. Specific beneficial bacteria (e.g., Akkermansia, Lactobacillus) and their metabolites, such as short-chain fatty acids (SCFAs), can enhance anti-tumor immunity by activating dendritic cells (DCs) and cytotoxic T lymphocytes (CTLs) [176]. Nanotechnology-based delivery systems can be engineered to precisely target and modulate these gut microbiota, thereby creating a favorable systemic environment for immunotherapy.
Table 1: Key Metabolic Targets and Their Immunotherapeutic Synergy
| Metabolic Target | Therapeutic Agent | Mechanism of Action | Synergistic Immunotherapy | Observed Outcome |
|---|---|---|---|---|
| Glycolysis / HK-II | 1,3-bromopyruvate (BrP) | Inhibits first step of glycolysis; induces ROS [94] | Temozolomide (alkylating agent) [94] | Enhanced cytotoxicity in glioblastoma models |
| Multiple Kinases (VEGFR, MET, TAM) | Zanzalintinib | Anti-angiogenic & reverses immunosuppressive TME [175] | Atezolizumab (anti-PD-L1) [175] | Improved overall survival in metastatic colorectal cancer |
| Mitochondrial Metabolism | BrP-TPP+ Conjugate | Targets mitochondria, disrupts energy production [94] | Not Specified | Inhibition of mitochondrial respiration; increased cancer cell death |
| Gut Microbiota | Probiotics (e.g., Lactobacillus) | Modulates systemic immunity; enhances CTL activity [176] | Immune Checkpoint Inhibitors [176] | Increased sensitivity to ICIs; improved treatment response |
Quantitative Data and Preclinical Evidence
Recent studies provide compelling quantitative data supporting the synergistic potential of metabolic-immunotherapy combinations. These findings span from sophisticated in vitro models to pivotal clinical trials, highlighting the translational promise of this approach.
In a groundbreaking study for metastatic colorectal cancer, the Phase 3 STELLAR-303 trial evaluated zanzalintinib plus atezolizumab versus the standard regorafenib. After 18 months of follow-up, the combination therapy demonstrated a significant survival benefit. The median overall survival was 10.9 months for the combination group compared to 9.4 months for the control group, representing a 20% reduction in the risk of death. Furthermore, the two-year survival rate doubled from 10% with regorafenib to 20% with the combination therapy. The combination also delayed cancer progression, with a median progression-free survival of 3.7 months versus 2.0 months [175].
In preclinical research, a mitochondria-targeted nanofiber was engineered for the co-delivery of BrP and temozolomide (TMZ) for glioblastoma treatment. This platform was functionalized with the cell-penetrating peptide gH625 to facilitate blood-brain barrier (BBB) transport and the targeting peptide falGea for specificity towards EGFRvIII-overexpressing glioblastoma cells. The therapeutic efficacy was rigorously evaluated in U-87 MG glioblastoma cells cultured in both 2D and 3D systems. The results confirmed the nanofiber's ability to cross the BBB and its targeted cytotoxicity. The synergistic effect of BrP (metabolic inhibitor) and TMZ (chemotherapy) was evident, with the combination resulting in significantly enhanced cancer cell death compared to either agent alone [94].
Table 2: Summary of Key Experimental Models and Outcomes
| Therapeutic Combination | Experimental Model | Key Quantitative Findings | Significance |
|---|---|---|---|
| Zanzalintinib + Atezolizumab [175] | Phase 3 Trial (STELLAR-303) in metastatic colorectal cancer (N=901) | Median OS: 10.9 mo vs 9.4 mo (control); 2-yr OS: 20% vs 10% [175] | First immunotherapy-based regimen to show survival benefit in most metastatic colorectal cancer patients |
| Mitochondrial Nanofiber (BrP + TMZ) [94] | In vitro 2D/3D U-87 MG glioblastoma cultures; isolated rat brain mitochondria | Significant viability loss in cancer cells; disruption of mitochondrial respiration [94] | Proof-of-concept for targeted, synergistic metabolic therapy in aggressive brain cancer |
| Longitudinal Multi-omics Analysis [177] | Phase 2 Trial in metastatic breast cancer; single-cell RNA/TCR sequencing of 334,183 cells | Responders showed distinct immune cell shifts; non-responders showed Treg activation and effector cell depletion [177] | Provides rich data on how TME changes correlate with treatment response |
Detailed Experimental Protocols and Methodologies
To ensure reproducibility and facilitate further research, this section outlines detailed protocols for key experiments cited in this review.
Protocol: Evaluating Mitochondrial-Targeted Nanofibers in Glioblastoma Models
This protocol is adapted from studies developing self-assembling peptide nanofibers for the co-delivery of BrP and TMZ [94].
1. Synthesis and Functionalization of Nanofibers:
- Peptide Amphiphile (PA) Synthesis: Synthesize PAs using standard solid-phase peptide synthesis. The PA sequence should include a hydrophobic alkyl tail and a hydrophilic peptide headgroup to enable self-assembly.
- Drug Conjugation: Covalently conjugate BrP to a TPP+ moiety via a matrix metalloproteinase-9 (MMP-9)-responsive peptide linker (e.g., GPQG↓IWGQ). Conjugate TMZ using a similar MMP-9-responsive strategy.
- Surface Functionalization: Co-assemble PAs with peptides functionalized with gH625 (cell-penetrating peptide) and falGea (EGFRvIII-targeting peptide) to create multifunctional nanofibers.
- Characterization: Characterize the resulting nanofibers using transmission electron microscopy (TEM) for morphology, circular dichroism (CD) for secondary structure, and dynamic light scattering (DLS) for size and stability.
2. In Vitro BBB Permeability Assay:
- Use a dynamic 3D in vitro BBB model.
- Treat the BBB model with fluorescently labeled nanofibers with and without the gH625 peptide.
- Measure the flux of nanofibers across the endothelial barrier over time using fluorescence spectroscopy or confocal microscopy. Compare the transport efficiency to validate the role of gH625.
3. Evaluation on Isolated Mitochondria:
- Isulate mitochondria from rat brain tissue via differential centrifugation.
- Incubate mitochondria with nanofibers carrying BrP-TPP+.
- Monitor mitochondrial oxygen consumption rate (OCR) using a Seahorse Analyzer or similar instrument to assess inhibition of respiration.
- Directly monitor ROS production using electron paramagnetic resonance (EPR) spectroscopy.
4. 2D and 3D Cell Culture Efficacy:
- Culture U-87 MG glioblastoma cells in 2D monolayers and as 3D spheroids.
- Treat cells with: (i) blank nanofibers, (ii) BrP-nanofibers, (iii) TMZ-nanofibers, (iv) combination BrP/TMZ-nanofibers, and (v) free drugs.
- Assess cell viability after 72 hours using a CellTiter-Glo assay for 3D spheroids and an MTT assay for 2D cultures.
- Analyze apoptosis induction via flow cytometry using Annexin V/propidium iodide staining.
Protocol: Longitudinal Multi-omics Analysis of Tumor Microenvironment
This protocol is based on a phase 2 trial that integrated longitudinal biopsies with multi-omics analysis to understand treatment response [177].
1. Patient Cohort and Longitudinal Biopsy:
- Enroll patients with treatment-resistant metastatic breast cancer in a clinical trial.
- Obtain core needle biopsies from site-matched metastatic tumors at baseline (pre-treatment) and at a defined on-treatment time point (e.g., after one or two cycles of combination immunotherapy/targeted therapy).
2. Single-Cell Sequencing and Analysis:
- Immediately process biopsy tissues to create single-cell suspensions.
- Perform single-cell RNA sequencing (scRNA-seq) and T-cell receptor sequencing (TCR-seq) on the isolated cells using a platform such as the 10x Genomics Chromium.
- Sequence libraries and align reads to the human reference genome.
- Use bioinformatic tools (e.g., Seurat, CellRanger) for quality control, normalization, clustering, and cell type annotation based on canonical markers.
- For T cells, perform trajectory analysis and clonotype tracking using the paired TCR-seq data to visualize shifts in T cell phenotypes and clonal expansion.
3. Data Integration and Correlation with Clinical Response:
- Integrate scRNA-seq data with patient clinical outcomes (responders vs. non-responders).
- Quantify and compare the proportions of immune cell populations (e.g., effector T cells, Tregs, NK cells, dendritic cells) between baseline and on-treatment samples within each response group.
- Identify differentially expressed genes and pathways that are uniquely modulated in responders. This analysis can reveal mechanisms of therapy resistance and sensitivity.
The Scientist's Toolkit: Essential Research Reagents
Table 3: Key Reagents for Metabolic-Immunotherapy Research
| Reagent / Material | Function/Application | Specific Example |
|---|---|---|
| 1,3-Bromopyruvate (BrP) | Glycolysis inhibitor; targets Hexokinase II to disrupt tumor metabolism and induce oxidative stress [94]. | Used in mitochondrial-targeted nanofibers for glioblastoma therapy [94]. |
| Triphenylphosphonium (TPP+) | Lipophilic cation; acts as a mitochondrial targeting moiety due to the negative mitochondrial membrane potential [94]. | Conjugated to BrP to enhance its delivery into mitochondria [94]. |
| MMP-9 Responsive Linker | Peptide sequence cleaved by matrix metalloproteinase-9; enables tumor-specific, on-demand drug release in the TME [94]. | Linker sequence (e.g., GPQG↓IWGQ) used to tether BrP-TPP+ to nanofibers [94]. |
| gH625 Peptide | Cell-penetrating peptide (CPP); facilitates transport across biological barriers, including the blood-brain barrier [94]. | Functionalized on the surface of nanofibers for enhanced brain delivery [94]. |
| falGea Peptide | Targeting peptide; binds specifically to EGFRvIII, commonly overexpressed in tumor cells like glioblastoma [94]. | Used on nanofiber surface for active targeting of cancer cells [94]. |
| Zanzalintinib | Small molecule targeted therapy; inhibits VEGFR, MET, and TAM kinases to block tumor growth and reverse immunosuppression [175]. | Combined with atezolizumab in the STELLAR-303 trial for metastatic colorectal cancer [175]. |
| scRNA-seq/TCR-seq Kits | For high-throughput profiling of gene expression and T-cell receptor repertoires at single-cell resolution. | Used for longitudinal TME analysis to track immune cell changes during therapy [177]. |
| 3D In Vitro BBB Model | Dynamic model of the blood-brain barrier; used to evaluate the permeability of therapeutic nanocarriers [94]. | Critical for pre-clinical testing of drugs intended for brain cancers like glioblastoma [94]. |
Visualizing Signaling Pathways and Workflows
Metabolic-Immunotherapy Synergy Mechanism
Targeted Nanofiber Drug Delivery Workflow
Conclusion
Metabolic reprogramming represents a critical vulnerability in cancer that extends far beyond the Warburg effect to encompass complex alterations in lipid, amino acid, and nucleotide metabolism driven by oncogenic signaling and tumor microenvironmental pressures. The integration of foundational knowledge with advanced methodological approaches has identified numerous therapeutic targets, though significant challenges remain in overcoming resistance mechanisms and metabolic plasticity. Future directions should focus on developing sophisticated combination therapies that simultaneously target multiple metabolic dependencies while accounting for tumor heterogeneity, advancing personalized approaches through metabolic biomarker development, and leveraging computational models to predict treatment responses. The continued translation of metabolic insights into clinical practice holds immense promise for improving outcomes across multiple cancer types, particularly when integrated with immunotherapy and targeted therapy approaches to address the dynamic nature of cancer metabolism.
References
- 1. Editorial: Metabolic reprogramming in cancer [https://www.frontiersin.org/journals/pharmacology/articles/10.3389/fphar.2025.1583986/full]
- 2. Metabolic Reprogramming of Cancer Cells and Therapeutics ... [https://pmc.ncbi.nlm.nih.gov/articles/PMC12439291/]
- 3. Cancer statistics, 2025 - PMC - PubMed Central - NIH [https://pmc.ncbi.nlm.nih.gov/articles/PMC11745215/]
- 4. Computational modeling of cancer cell metabolism along ... [https://www.nature.com/articles/s41540-025-00525-x]
- 5. Metabolic reprogramming in colorectal cancer: a review of ... [https://www.nature.com/articles/s41420-025-02623-5]
- 6. Rewiring of cortical glucose metabolism fuels human brain ... [https://www.nature.com/articles/s41586-025-09460-7]
- 7. Altered metabolism in cancer: insights into energy pathways ... [https://molecular-cancer.biomedcentral.com/articles/10.1186/s12943-024-02119-3]
- 8. The driving force behind cancer drug resistance [https://www.sciencedirect.com/science/article/abs/pii/S0093775425000843]
- 9. Fueling the fire–a pan-cancer analysis of MYC-regulated lipid ... [https://pmc.ncbi.nlm.nih.gov/articles/PMC12504247/]
- 10. Methods and Guidelines for Metabolism Studies - PubMed - NIH [https://pubmed.ncbi.nlm.nih.gov/40943388/]
- 11. The roles of KRAS in cancer metabolism, tumor ... [https://molecular-cancer.biomedcentral.com/articles/10.1186/s12943-024-02218-1]
- 12. Oncogenic KRAS mutations drive immune suppression ... [https://pubmed.ncbi.nlm.nih.gov/41184283/]
- 13. Advances in the mechanisms of HIF-1α-enhanced tumor ... [https://www.sciencedirect.com/science/article/pii/S0079610725000240]
- 14. Hypoxia-driven angiogenesis and metabolic ... [https://www.frontiersin.org/journals/cell-and-developmental-biology/articles/10.3389/fcell.2025.1572909/full]
- 15. UHRF1-mediated HIF-1α stabilization promotes ovarian ... [https://pmc.ncbi.nlm.nih.gov/articles/PMC12552473/]
- 16. Metabolic regulation by p53: Implications for cancer therapy [https://pmc.ncbi.nlm.nih.gov/articles/PMC11925517/]
- 17. Aging represses oncogenic KRAS-driven lung ... [https://www.nature.com/articles/s43587-025-00986-z]
- 18. Altered metabolism in cancer: insights into energy pathways ... [https://pmc.ncbi.nlm.nih.gov/articles/PMC11409553/]
- 19. The role of LKB1 in prostate cancer: implications for tumor ... [https://www.frontiersin.org/journals/cell-and-developmental-biology/articles/10.3389/fcell.2025.1629844/full]
- 20. The role of LKB1 in prostate cancer: implications for tumor ... [https://pmc.ncbi.nlm.nih.gov/articles/PMC12378237/]
- 21. Machine learning developed LKB1-AMPK signaling related ... [https://www.nature.com/articles/s41598-025-08583-1]
- 22. Purine metabolism: a pan-cancer metabolic dysregulation ... [https://molecular-cancer.biomedcentral.com/articles/10.1186/s12943-025-02482-9]
- 23. Metabolic Reprogramming as a Therapeutic Target in Cancer [https://www.mdpi.com/2673-7523/5/3/43]
- 24. The Evolving Landscape of Cancer Metabolism [https://www.frontiersin.org/journals/molecular-biosciences/articles/10.3389/fmolb.2025.1685924/abstract]
- 25. Glucose metabolism and its direct action in cancer and ... [https://jbiomedsci.biomedcentral.com/articles/10.1186/s12929-025-01167-1]
- 26. Targeting Glucose Metabolism Enzymes in Cancer Treatment [https://pmc.ncbi.nlm.nih.gov/articles/PMC9559313/]
- 27. Metabolic reprogramming of glucose [https://pmc.ncbi.nlm.nih.gov/articles/PMC11839411/]
- 28. UI research identifies promising new target for treating rare ... [https://physiology.medicine.uiowa.edu/news/2025/08/ui-research-identifies-promising-new-target-treating-rare-aggressive-childhood-cancer]
- 29. Cancer metabolism - Latest research and news [https://www.nature.com/subjects/cancer-metabolism]
- 30. PKM2-driven metabolic reprogramming in digestive system ... [https://pmc.ncbi.nlm.nih.gov/articles/PMC12364686/]
- 31. Targeting cancer metabolism in the era of precision ... [https://www.nature.com/articles/s41573-021-00339-6]
- 32. Reprogramming of fatty acid metabolism in cancer [https://www.nature.com/articles/s41416-019-0650-z]
- 33. Lipid Metabolism Reprogramming in Cancer: Insights into ... [https://www.mdpi.com/2227-9059/13/8/1895]
- 34. Lipid metabolism alteration contributes to and maintains ... [https://pmc.ncbi.nlm.nih.gov/articles/PMC7330842/]
- 35. Bidirectional regulation of lipid metabolism and the tumor ... [https://www.frontiersin.org/journals/immunology/articles/10.3389/fimmu.2025.1696102/full]
- 36. Lipid metabolism in cancer stem cells: reprogramming, ... [https://link.springer.com/article/10.1007/s13402-025-01081-6]
- 37. Regulation and Metabolic Significance of De Novo ... [https://pmc.ncbi.nlm.nih.gov/articles/PMC6213738/]
- 38. Cornell team finds new way to cut cancer's lipid lifeline [https://news.cornell.edu/stories/2025/10/cornell-team-finds-new-way-cut-cancers-lipid-lifeline]
- 39. Targeting Glutaminolysis: New Perspectives to Understand ... [https://pmc.ncbi.nlm.nih.gov/articles/PMC7649373/]
- 40. Serine and glycine metabolism in cancer - PubMed Central [https://pmc.ncbi.nlm.nih.gov/articles/PMC3989988/]
- 41. Serine, glycine and one‑carbon metabolism in cancer ... [https://www.spandidos-publications.com/10.3892/ijo.2020.5158]
- 42. SLC6A14 and SLC38A5 Drive the Glutaminolysis and Serine ... [https://pmc.ncbi.nlm.nih.gov/articles/PMC8000594/]
- 43. Targeting glutamine metabolism as a therapeutic strategy ... [https://www.nature.com/articles/s12276-023-00971-9]
- 44. Targeting amino acid in tumor therapy [https://www.frontiersin.org/journals/oncology/articles/10.3389/fonc.2025.1582116/full]
- 45. cMyc-mediated activation of serine biosynthesis pathway is ... [https://www.nature.com/articles/cr201533]
- 46. Metabolic Cooperation and Competition in the Tumor ... [https://www.frontiersin.org/journals/oncology/articles/10.3389/fonc.2017.00068/full]
- 47. Metabolism in the tumor microenvironment - PubMed Central [https://pmc.ncbi.nlm.nih.gov/articles/PMC12605492/]
- 48. Metabolic checkpoints in immune cell reprogramming [https://molecular-cancer.biomedcentral.com/articles/10.1186/s12943-025-02407-6]
- 49. Deciphering metabolic reprogramming of immune cells within ... [https://translational-medicine.biomedcentral.com/articles/10.1186/s12967-025-07069-y]
- 50. Metabolic reprogramming and functional crosstalk within ... [https://pubmed.ncbi.nlm.nih.gov/40705181/]
- 51. Metabolic Crosstalk in the Tumor Microenvironment [https://www.mdpi.com/journal/metabolites/special_issues/PQS1D7ZEL4]
- 52. Targeting metabolic plasticity and flexibility dynamics for ... [https://pmc.ncbi.nlm.nih.gov/articles/PMC7710573/]
- 53. Metabolic heterogeneity in cancer [https://www.nature.com/articles/s42255-023-00963-z]
- 54. Mechanisms and implications of metabolic heterogeneity in ... [https://pmc.ncbi.nlm.nih.gov/articles/PMC6730674/]
- 55. Architectural control of metabolic plasticity in epithelial ... [https://www.nature.com/articles/s42003-021-01899-4]
- 56. Metabolic reprogramming and epigenetic modifications in ... [https://pmc.ncbi.nlm.nih.gov/articles/PMC10394076/]
- 57. Quantitative Spatial Analysis of Metabolic Heterogeneity ... [https://pmc.ncbi.nlm.nih.gov/articles/PMC6839277/]
- 58. Insights into metabolic heterogeneity of colorectal cancer ... [https://elifesciences.org/articles/94438]
- 59. Metabolomics and metabolites in cancer diagnosis and ... [https://pmc.ncbi.nlm.nih.gov/articles/PMC12618785/]
- 60. HT SpaceM: A high-throughput and reproducible method ... [https://www.sciencedirect.com/science/article/pii/S0092867425009298]
- 61. Researchers look to advanced metabolic imaging to improve ... [https://engineering.wisc.edu/news/researchers-look-to-advanced-metabolic-imaging-to-improve-cancer-immunotherapy/]
- 62. Dynamic single-cell metabolomics reveals ... [https://www.nature.com/articles/s41467-025-59878-w]
- 63. High-definition spatial transcriptomic profiling of immune ... [https://www.nature.com/articles/s41588-025-02193-3]
- 64. Integrated spatial transcriptomic profiling to dissect the ... [https://pubmed.ncbi.nlm.nih.gov/40934085/]
- 65. Insights into Metabolic Reprogramming in Tumor Evolution ... [https://pmc.ncbi.nlm.nih.gov/articles/PMC11506062/]
- 66. Computational modeling and simulation in oncology - PMC [https://pmc.ncbi.nlm.nih.gov/articles/PMC12411925/]
- 67. New NIH Project to Model Breast Tumors for Better ... [https://viterbischool.usc.edu/news/2025/10/new-nih-project-to-model-breast-tumors-for-better-immunotherapy/]
- 68. Harnessing multi-omics approaches to decipher tumor ... [https://pmc.ncbi.nlm.nih.gov/articles/PMC12590604/]
- 69. Glucose Transporters as a Target for Anticancer Therapy - PMC [https://pmc.ncbi.nlm.nih.gov/articles/PMC8394807/]
- 70. GLUT1 inhibitor BAY-876 induces apoptosis and enhances ... [https://www.nature.com/articles/s41420-024-02106-z]
- 71. GLUT1 inhibition by BAY-876 induces metabolic changes ... [https://pubmed.ncbi.nlm.nih.gov/40247224/]
- 72. GLUT3 inhibitor discovery through in silico ligand ... - Nature [https://www.nature.com/articles/s41598-022-05383-9]
- 73. A pan-cancer analysis of the role of hexokinase II (HK2) in ... [https://www.nature.com/articles/s41598-022-23598-8]
- 74. The development of small-molecule inhibitors targeting ... [https://pubmed.ncbi.nlm.nih.gov/35609742/]
- 75. The role of pyruvate kinase M2 in anticancer therapeutic ... [https://pmc.ncbi.nlm.nih.gov/articles/PMC6865080/]
- 76. Natural compounds as lactate dehydrogenase inhibitors [https://pmc.ncbi.nlm.nih.gov/articles/PMC10616500/]
- 77. Lactate dehydrogenase A: a potential new target for tumor ... [https://translational-medicine.biomedcentral.com/articles/10.1186/s12967-025-06773-z]
- 78. Emerging targets in lipid metabolism for cancer therapy - PMC [https://pmc.ncbi.nlm.nih.gov/articles/PMC11162322/]
- 79. Involvement of the pro-oncogenic enzyme fatty acid ... [https://www.nature.com/articles/s41389-023-00460-8]
- 80. An insight into advances and challenges in the development ... [https://pmc.ncbi.nlm.nih.gov/articles/PMC11421311/]
- 81. Fatty Acid Synthase Inhibitor - an overview [https://www.sciencedirect.com/topics/pharmacology-toxicology-and-pharmaceutical-science/fatty-acid-synthase-inhibitor]
- 82. Stearoyl-CoA desaturase inhibition is toxic to acute ... [https://www.nature.com/articles/s41375-024-02390-9]
- 83. SCD1 Inhibition Causes Cancer Cell Death by Depleting ... [https://journals.plos.org/plosone/article?id=10.1371/journal.pone.0033823]
- 84. Targeting glutamine metabolism as a potential target for ... [https://pmc.ncbi.nlm.nih.gov/articles/PMC12210561/]
- 85. Enhancing the efficacy of glutamine metabolism inhibitors in ... [https://pmc.ncbi.nlm.nih.gov/articles/PMC9064286/]
- 86. One-carbon metabolism in cancer | British Journal of Cancer [https://www.nature.com/articles/bjc2017118]
- 87. Targeting one‐carbon metabolism for cancer immunotherapy [https://pmc.ncbi.nlm.nih.gov/articles/PMC10819114/]
- 88. Glutamine blockade induces divergent metabolic programs to ... [https://pmc.ncbi.nlm.nih.gov/articles/PMC7023461/]
- 89. Glutaminase inhibitor CB-839 causes metabolic ... [https://www.nature.com/articles/s41598-025-20528-2]
- 90. Glutaminase I and Glutamine Transaminase–ω-Amidase ... [https://www.sciencedirect.com/science/article/abs/pii/S0003269725002283]
- 91. Trick or trap: cancer's demise via one-carbon targeting [https://www.nature.com/articles/d43747-023-00079-z]
- 92. Metabolic Reprogramming in Lung Cancer - PubMed Central [https://pmc.ncbi.nlm.nih.gov/articles/PMC12571976/]
- 93. A candidate drug dismantles a metabolic barrier to anti- ... [https://www.ludwigcancerresearch.org/news-releases/a-drug-dismantles-a-metabolic-barrier-to-anti-tumor-immunity/]
- 94. Synergistic Cancer Metabolic Therapy via Co-Delivery of 3 ... [https://pmc.ncbi.nlm.nih.gov/articles/PMC12598698/]
- 95. Drug-chemo combo increases cancer treatment efficacy [https://ecancer.org/en/news/25095-drug-chemo-combo-increases-cancer-treatment-efficacy]
- 96. 5 emerging therapies presented at ASCO 2025 [https://www.mdanderson.org/cancerwise/5-emerging-therapies-presented-at-asco-2025.h00-159776445.html]
- 97. New Computational Tool Shows Strong Accuracy in ... [https://ascopost.com/news/november-2025/new-computational-tool-shows-strong-accuracy-in-predicting-cancer-drug-targets/]
- 98. Efficacy and safety of PD-1 inhibitors in combination with ... [https://pubmed.ncbi.nlm.nih.gov/40826733/]
- 99. Targeting cancer metabolism: dietary and pharmacological ... [https://pmc.ncbi.nlm.nih.gov/articles/PMC5140697/]
- 100. Exploiting metabolic vulnerabilities in cancer [https://www.sciencedirect.com/science/article/abs/pii/S0304383525006391]
- 101. Tumor Metabolism, the Ketogenic Diet and β ... [https://www.frontiersin.org/journals/molecular-neuroscience/articles/10.3389/fnmol.2016.00122/full]
- 102. Dietary approaches for exploiting metabolic vulnerabilities ... [https://www.sciencedirect.com/science/article/pii/S0304419X23002111]
- 103. Dietary factors and their influence on immunotherapy ... [https://www.nature.com/articles/s41419-024-06641-6]
- 104. Nutritional Interventions in Advanced Cancer: Scoping ... [https://pubmed.ncbi.nlm.nih.gov/40275738/]
- 105. Harnessing the Power of Metabolomics for Precision Oncology: Current Advances and Future Directions [https://www.mdpi.com/2073-4409/14/6/402]
- 106. Can Metabolic Profiles Be Used as a Phenotypic Readout of the Genome to Enhance Precision Medicine? - PMC [https://pmc.ncbi.nlm.nih.gov/articles/PMC4851585/]
- 107. Spatial quantitative metabolomics enables identification of ... [https://www.nature.com/articles/s42255-025-01340-8]
- 108. Metabolomic machine learning predictor for diagnosis and prognosis of gastric cancer | Nature Communications [https://www.nature.com/articles/s41467-024-46043-y]
- 109. Metabolic Reprogramming of Chemoresistant Cancer Cells ... [https://pmc.ncbi.nlm.nih.gov/articles/PMC7408410/]
- 110. Metabolic reprogramming and therapeutic resistance in ... [https://molecular-cancer.biomedcentral.com/articles/10.1186/s12943-024-02165-x]
- 111. Overcoming Compensatory Mechanisms toward Chronic Drug ... [https://pmc.ncbi.nlm.nih.gov/articles/PMC7341037/]
- 112. Targeting Metabolic Vulnerabilities to Combat Drug ... [https://pmc.ncbi.nlm.nih.gov/articles/PMC11856717/]
- 113. Metabolic crossroads: unravelling immune cell dynamics in ... [https://www.oaepublish.com/articles/cdr.2024.164]
- 114. Mitochondrial metabolism and cancer therapeutic innovation [https://www.nature.com/articles/s41392-025-02311-x]
- 115. Cancer Dormancy and Metabolism: From Molecular ... [https://www.sciencedirect.com/science/article/abs/pii/S030438352500669X]
- 116. Frontiers and hot topics in tumor metabolic reprogramming [https://www.frontiersin.org/journals/oncology/articles/10.3389/fonc.2025.1570532/full]
- 117. DeepTarget tool uncovers primary and secondary drug ... [https://www.news-medical.net/news/20251118/DeepTarget-tool-uncovers-primary-and-secondary-drug-targets-across-cancer-types.aspx]
- 118. Unleashing the Full Potential of Metabolic Interventions in T-ALL [https://pmc.ncbi.nlm.nih.gov/articles/PMC12050939/]
- 119. Extending inherited metabolic disorder diagnostics with ... [https://pmc.ncbi.nlm.nih.gov/articles/PMC10131334/]
- 120. Shifting the Gears of Metabolic Plasticity to Drive Cell State ... [https://pmc.ncbi.nlm.nih.gov/articles/PMC7999312/]
- 121. Review Metabolic tricks of cancer cells [https://www.sciencedirect.com/science/article/abs/pii/S0304419X22000300]
- 122. When cancer drug resistance meets metabolomics (bulk, ... [https://www.frontiersin.org/journals/oncology/articles/10.3389/fonc.2022.1054233/full]
- 123. Editorial: Metabolic reprogramming in cancer - PMC [https://pmc.ncbi.nlm.nih.gov/articles/PMC11933011/]
- 124. Tumor metabolic regulators: key drivers of ... - Molecular Cancer [https://molecular-cancer.biomedcentral.com/articles/10.1186/s12943-024-02205-6]
- 125. Immunometabolism: crosstalk with tumor metabolism and ... [https://pmc.ncbi.nlm.nih.gov/articles/PMC12505609/]
- 126. Metabolic regulation of immunity in the tumor ... [https://www.sciencedirect.com/science/article/pii/S2211124725012343]
- 127. Crosstalk between the tumor immune microenvironment ... [https://www.frontiersin.org/journals/immunology/articles/10.3389/fimmu.2025.1564603/full]
- 128. Exosome-mediated metabolic reprogramming: effects on ... [https://molecular-cancer.biomedcentral.com/articles/10.1186/s12943-025-02470-z]
- 129. Combination, Timing, and Sequencing (CTS) Therapy ... [https://www.preprints.org/manuscript/202411.1830/v2]
- 130. Combination Approach May Improve Cancer Treatment Efficacy [https://news.feinberg.northwestern.edu/2025/07/31/combination-approach-may-improve-cancer-treatment-efficacy/]
- 131. Reprogramming cancer immunity with next-generation ... [https://www.frontiersin.org/journals/cell-and-developmental-biology/articles/10.3389/fcell.2025.1652047/full]
- 132. Combination Strategies with HSP90 Inhibitors in Cancer ... [https://www.mdpi.com/1424-8247/18/8/1083]
- 133. Metabolic Dialogue Shapes Immune Response in the Tumor ... [https://pmc.ncbi.nlm.nih.gov/articles/PMC11995254/]
- 134. Competition for nutrients and its role in controlling immune ... [https://www.nature.com/articles/s41467-019-10015-4]
- 135. How metabolic chatter between cells undermines anti- ... [https://www.ludwigcancerresearch.org/news-releases/how-metabolic-chatter-between-cells-undermines-anti-tumor-immunity/]
- 136. Cooperative nutrient scavenging is an evolutionary ... [https://www.nature.com/articles/s41586-025-08588-w]
- 137. Cancer cells can cooperate to grow [https://www.nih.gov/news-events/nih-research-matters/cancer-cells-can-cooperate-grow]
- 138. Cancer metabolic reprogramming: importance, main features ... [https://pmc.ncbi.nlm.nih.gov/articles/PMC3969803/]
- 139. Spatiotemporal Heterogeneity of Tumor Glucose Metabolism ... [https://pmc.ncbi.nlm.nih.gov/articles/PMC12295594/]
- 140. Cancer stem cells: landscape, challenges and emerging ... [https://www.nature.com/articles/s41392-025-02360-2]
- 141. Signaling pathways in cancer metabolism - Nature [https://www.nature.com/articles/s41392-023-01442-3]
- 142. Quantitative analysis of energy metabolic pathways in MCF ... [https://pubmed.ncbi.nlm.nih.gov/22535206/]
- 143. Mitochondrial metabolic reprogramming in colorectal cancer [https://pmc.ncbi.nlm.nih.gov/articles/PMC12335542/]
- 144. Mechanisms governing lineage plasticity and metabolic ... [https://www.sciencedirect.com/science/article/abs/pii/S2405803324001687]
- 145. An overview of statistical methods for biomarkers relevant ... [https://pmc.ncbi.nlm.nih.gov/articles/PMC11371698/]
- 146. A New Framework for Biomarker-Driven Patient Selection [https://link.springer.com/article/10.1007/s43441-021-00352-2]
- 147. Quantitative Imaging Biomarkers: A Review of Statistical ... [https://pmc.ncbi.nlm.nih.gov/articles/PMC4263694/]
- 148. Biomarker-driven patient selection for early clinical trials [https://pubmed.ncbi.nlm.nih.gov/23493192/]
- 149. Bridging the Gap: Translating Preclinical Biomarkers to ... [https://blog.crownbio.com/bridging-the-gap-translating-preclinical-biomarkers-to-clinical-success]
- 150. Exploring the landscape of current in vitro and in vivo ... [https://link.springer.com/article/10.1007/s00259-025-07123-3]
- 151. Can patient-derived in vitro models improve clinical ... [https://pmc.ncbi.nlm.nih.gov/articles/PMC12528567/]
- 152. Metabolic Reprogramming of Cancer Cells and ... [https://pubmed.ncbi.nlm.nih.gov/40956032/]
- 153. Metabolic reprogramming and therapeutic targeting in non- ... [https://www.frontiersin.org/journals/oncology/articles/10.3389/fonc.2025.1564226/full]
- 154. Exosome-mediated metabolic reprogramming - PubMed Central [https://pmc.ncbi.nlm.nih.gov/articles/PMC12505858/]
- 155. Reprogramming of Thyroid Cancer Metabolism [https://molecular-cancer.biomedcentral.com/articles/10.1186/s12943-025-02263-4]
- 156. Landscape of metabolic alterations and treatment ... [https://pubmed.ncbi.nlm.nih.gov/40548063/]
- 157. Landscape of metabolic alterations and treatment ... [https://www.sciencedirect.com/science/article/pii/S2352304225000108]
- 158. Targeting metabolic reprogramming in glioblastoma as a ... [https://pubmed.ncbi.nlm.nih.gov/40078366/]
- 159. Synergistic targeting of cancer cells through simultaneous ... [https://www.nature.com/articles/s41418-025-01532-5]
- 160. FDA Approvals in Oncology: July-September 2025 | Blog [https://www.aacr.org/blog/2025/10/02/fda-approvals-in-oncology-july-september-2025/]
- 161. C4 Therapeutics Announces 2025 Milestones Across ... [https://ir.c4therapeutics.com/news-releases/news-release-details/c4-therapeutics-announces-2025-milestones-across-clinical]
- 162. Cancer metabolites: promising biomarkers for cancer liquid ... [https://biomarkerres.biomedcentral.com/articles/10.1186/s40364-023-00507-3]
- 163. Metabolic PET Imaging in Cancer Detection and Therapy ... [https://pmc.ncbi.nlm.nih.gov/articles/PMC3075495/]
- 164. 18F-FDG PET/CT Imaging Biomarkers for Early and Late ... [https://jnm.snmjournals.org/content/63/2/199]
- 165. Beyond ELISA: the future of biomarker validation [https://www.drugtargetreview.com/article/154316/beyond-elisa-the-future-of-biomarker-validation/]
- 166. Amino acid metabolites as potential circulating biomarkers ... [https://www.nature.com/articles/s41598-025-24223-0]
- 167. Circulating Metabolite Profiles and Risk of Coronary Heart ... [https://pmc.ncbi.nlm.nih.gov/articles/PMC11335450/]
- 168. Biomarker method validation in anticancer drug development [https://pmc.ncbi.nlm.nih.gov/articles/PMC2259203/]
- 169. How AI & Biomarkers Are Reshaping the Next Frontier in ... [https://www.precisionformedicine.com/blog/how-ai-biomarkers-are-reshaping-the-next-frontier-in-drug-development]
- 170. Metabolic Adaptations in Cancer Progression: Optimization ... [https://www.mdpi.com/2072-6694/17/14/2341]
- 171. Targeting AKR1B1 inhibits metabolic reprogramming to ... [https://www.nature.com/articles/s41392-025-02321-9]
- 172. Finding the balance between efficacy and toxicity in ... [https://www.stjude.org/research/progress/2025/finding-balance-between-efficacy-and-toxicity-in-pediatric-cancer-treatment.html]
- 173. Toxicity and efficacy of antibody–drug conjugates in ... [https://pmc.ncbi.nlm.nih.gov/articles/PMC12447991/]
- 174. Drug delivery for metabolism targeted cancer immunotherapy [https://www.sciencedirect.com/science/article/abs/pii/S0169409X22001326]
- 175. ESMO 2025: Combination of immunotherapy and targeted ... [https://ecancer.org/en/news/27160-esmo-2025-combination-of-immunotherapy-and-targeted-therapy-improves-survival-for-patients-with-advanced-colorectal-cancer]
- 176. Nanotechnology–Microbiota Synergy in Cancer ... [https://www.sciencedirect.com/science/article/abs/pii/S1040842825004068]
- 177. Longitudinal tissue analysis reveals microenvironmental ... [https://pubmed.ncbi.nlm.nih.gov/41052881/?utm_source=FeedFetcher&utm_medium=rss&utm_campaign=None&utm_content=1TM-0vYJyo-QrYofpsvVk-Svk801Mah7ONDSZyYNZ0AdcB49XP&fc=None&ff=20251111015514&v=2.18.0.post22+67771e2]