Optimizing Audit and Feedback Systems to Improve Cancer Screening Follow-Up: A Comprehensive Guide for Researchers and Clinicians
This article provides a comprehensive analysis of audit and feedback (A&F) systems as a critical strategy for improving follow-up after cancer screening, a key challenge in achieving early cancer detection...
Optimizing Audit and Feedback Systems to Improve Cancer Screening Follow-Up: A Comprehensive Guide for Researchers and Clinicians
Abstract
This article provides a comprehensive analysis of audit and feedback (A&F) systems as a critical strategy for improving follow-up after cancer screening, a key challenge in achieving early cancer detection and reducing mortality. Tailored for researchers, scientists, and drug development professionals, it synthesizes foundational evidence, explores methodological frameworks for implementation, and addresses common optimization challenges. The content further examines validation strategies and compares the effectiveness of A&F against other interventions, drawing on recent studies and real-world implementation data. The goal is to equip biomedical professionals with the knowledge to design, evaluate, and refine A&F systems that enhance the entire cancer screening continuum, from initial participation to diagnostic resolution.
The Critical Role of Audit and Feedback in the Cancer Screening Continuum
Defining Audit and Feedback in the Context of Cancer Screening Follow-Up
Audit and Feedback (A&F) is a systematic implementation strategy designed to improve professional practice and healthcare quality by measuring clinical performance against explicit standards and communicating this information back to healthcare providers [1]. In the specific context of cancer screening follow-up, A&F functions as a critical quality improvement mechanism to identify gaps in care and encourage adherence to evidence-based screening guidelines [2] [3]. The underlying theoretical premise is that highly motivated health professionals, when presented with information showing discrepancies between their actual practice and desired performance standards, will shift attention to areas requiring improvement [1].
The A&F process operates as a cyclical quality improvement process involving five core stages: (1) preparation for audit, (2) selection of criteria based on evidence-based guidelines, (3) measurement of performance, (4) implementation of improvements, and (5) sustaining improvements through repeated cycles [1]. For cancer screening programs, this typically focuses on identifying patients overdue for screening or those with abnormal results requiring follow-up, then feeding this information back to primary care providers in a structured, actionable format [3] [4].
Key Components and Implementation Protocols
Core Components of A&F Systems
Effective A&F interventions for cancer screening follow-up comprise several essential components, which can be systematically implemented using standardized protocols. The table below outlines the core components and their implementation specifications.
Table 1: Core Components of Audit and Feedback Systems for Cancer Screening
| Component | Description | Implementation Protocol |
|---|---|---|
| Audit Data Collection | Systematic review of performance based on explicit criteria [1] | Extract data from EHRs, administrative databases, or medical registries; use standardized data extraction tools [3] [5] |
| Performance Comparison | Benchmarking against standards or peers [1] | Compare individual/provider performance to evidence-based guidelines (e.g., ACS, USPSTF) or group averages [6] [4] |
| Feedback Delivery | Structured communication of performance data [1] | Utilize emails, portals, or dashboards; employ behavior change techniques in messaging [4] |
| Actionable Recommendations | Specific guidance for quality improvement [3] | Include clear follow-up actions, identify specific overdue patients, provide resource navigation [7] [3] |
Experimental Protocols for A&F Implementation
Based on recent randomized controlled trials, the following protocols detail methodologies for implementing A&F systems in cancer screening contexts.
Protocol 1: Clinical Decision Support System for Abnormal Results Follow-Up Adapted from Atlas et al. (2025) - Comparing CDSS for abnormal cervical cancer screening [3]
- Objective: Improve follow-up completion for patients with abnormal cervical cancer screening results.
- Design: Cluster randomized controlled trial with primary care clinics as unit of randomization.
- Intervention Groups:
- Usual care
- CDSS alone
- CDSS with patient outreach (± navigation)
- CDSS Implementation:
- System A: Uses natural language processing to evaluate extracted data outside EHR
- System B: Uses commercial EHR functionality with LOINC-defined result fields
- Outcome Measurement: Completion of recommended follow-up at 120 days post-enrollment
- Data Analysis: Manual chart review to assess CDSS accuracy (true positive rate)
Protocol 2: Physician Communication and Engagement Strategy Adapted from Price-Haywood et al. (2014) and Cancer Care Ontario (2018) [2] [4]
- Objective: Increase primary care physician engagement with cancer screening audit reports.
- Design: Factorial randomized experiment (2×2×2) testing email components.
- Participants: Primary care physicians registered for screening activity reports.
- Intervention Components:
- Anticipated Regret: Induce awareness of future regret about not accessing reports (e.g., "How would you feel if a patient had a poor outcome because you missed an abnormal result?")
- Material Incentive: Link report use to available monetary bonuses for achieving screening targets
- Problem Solving: Provide strategies to overcome barriers (e.g., delegate registration, schedule time)
- Outcome Measurement: Email open rates, link click-through rates, report access logs
- Process Evaluation: Semi-structured interviews to understand mechanisms of effect
Quantitative Evidence and Effectiveness Data
Recent studies provide quantitative evidence supporting the effectiveness of A&F strategies for improving cancer screening follow-up. The data below summarize key findings from clinical trials and implementation studies.
Table 2: Effectiveness of Audit and Feedback Interventions in Cancer Screening
| Study/Implementation | Screening Type | Intervention Components | Key Quantitative Findings |
|---|---|---|---|
| Atlas et al. (2025) [3] | Cervical cancer | CDSS with patient outreach ± navigation | Follow-up rates: 23.5% (usual care) vs. 38.2% (CDSS + outreach) (p<0.001); CDSS true positive rate: 61.3-70.4% |
| Price-Haywood et al. (2014) [2] | Colorectal, breast, cervical | Communication training + audit/feedback | Improved patient-centered counseling behaviors; no significant between-group differences in screening rates except mammography |
| Colour-Coding Navigation (2020) [7] | Breast cancer chemotherapy | Triage system (green/yellow/red) + navigation | 80% of non-compliant (Code Red) patients eventually accepted treatment; stratification: 64.8% Green, 27.0% Yellow, 8.2% Red |
| Cancer Care Ontario (2018) [4] | Colorectal, breast, cervical | Monthly email prompts + online audit reports | Baseline: <7% of email recipients clicked link to access reports; association between report use and higher screening rates |
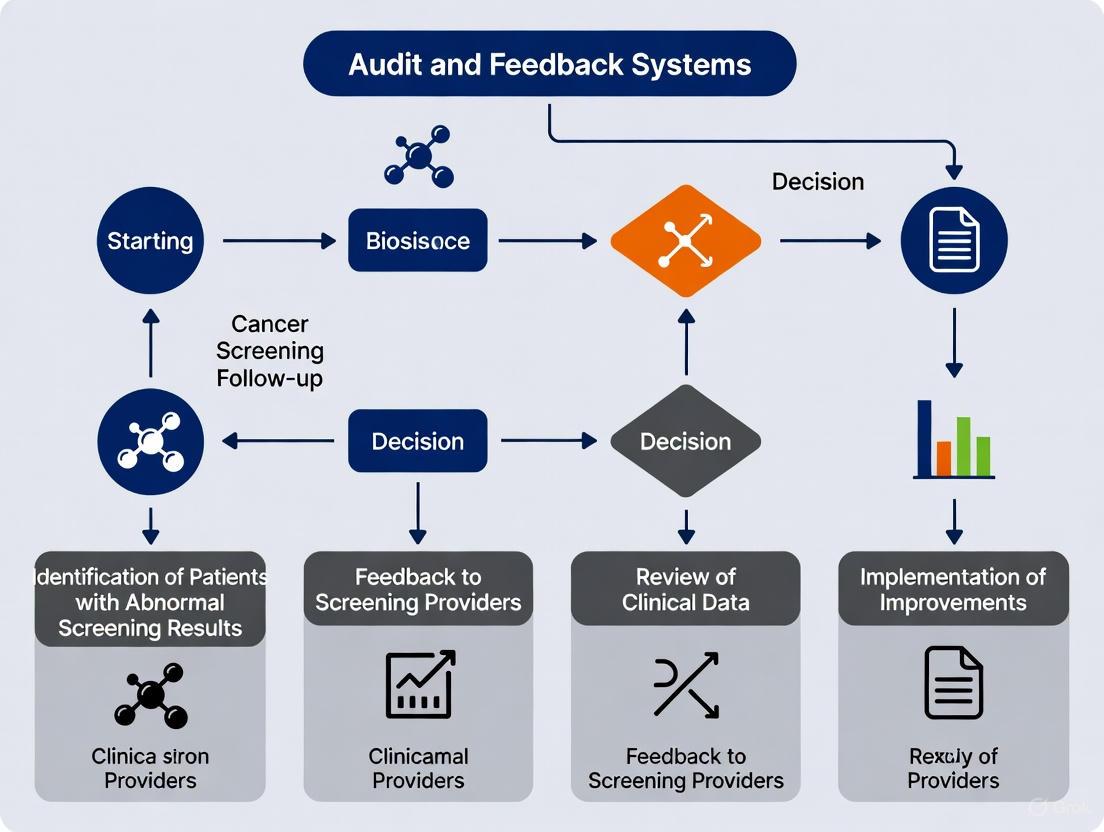
Visualization and Workflow Diagrams
The following diagrams illustrate the theoretical framework and implementation workflows for A&F systems in cancer screening follow-up.
The Scientist's Toolkit: Research Reagent Solutions
Table 3: Essential Research Materials and Methods for A&F Implementation
| Tool/Resource | Function/Application | Implementation Example |
|---|---|---|
| Electronic Health Records (EHR) | Data source for identifying overdue screening and abnormal results [3] [5] | Extract structured data using LOINC codes or NLP for unstructured data [3] |
| Clinical Decision Support Systems (CDSS) | Automated identification of patients needing follow-up care [3] | Implement systems with rule-based algorithms for screening guidelines [3] |
| Behavior Change Technique (BCT) Taxonomy | Framework for designing persuasive communication [4] | Apply techniques: anticipated regret, material incentives, problem-solving [4] |
| Data Visualization Platforms | Present performance data in cognitively accessible formats [8] | Create simplified reports with high contrast colors, clear labels, and comparative benchmarks [8] |
| Patient Navigation Systems | Address barriers to care completion [7] [3] | Implement color-coded triage (green/yellow/red) with tailored support [7] |
| Health Information Technology Usability Evaluation Scale (Health-ITUES) | Measure usability of A&F interfaces and reports [8] | Customize 20-item scale with Likert responses for specific A&F context [8] |
Cancer screening represents a foundational public health strategy for reducing cancer-related morbidity and mortality through early detection. However, the effectiveness of any screening program is contingent not just on initial participation but on the complete continuum of care, culminating in timely follow-up for abnormal results. Failures in this follow-up phase substantially increase the likelihood of preventable morbidity and mortality, particularly among vulnerable populations where barriers to care include provider shortages and low health insurance coverage [9]. This application note frames this challenge within the critical context of audit and feedback systems, presenting data, protocols, and implementation frameworks to strengthen this lifesaving intervention.
Research consistently demonstrates that follow-up care after abnormal cancer screening remains suboptimal across multiple cancer types [9] [10]. For example, while over 96% of abnormal breast screens receive timely diagnostic follow-up, rates fall to approximately 76% for both cervical and colorectal cancer screening [10]. This gap represents a critical systems failure and a significant opportunity for quality improvement through structured audit and feedback mechanisms, which the Community Preventive Services Task Force (CPSTF) recommends based on sufficient evidence of effectiveness [11].
Quantitative Landscape: Screening and Follow-Up Metrics
Systematic measurement is the foundation of effective audit and feedback. The following tables present key performance indicators across the cancer screening continuum, derived from population-based research, to enable benchmarking and gap identification.
Table 1: Population-Based Cancer Screening Metrics (2013 Data) [10]
| Metric | Breast Cancer | Cervical Cancer | Colorectal Cancer |
|---|---|---|---|
| Screening-eligible Population | 305,568 | 3,160,128 | 2,363,922 |
| Up-to-Date on Testing | 63.5% | 84.6% | 77.5% |
| Abnormal Screening Rate | 10.7% | 4.4% | 4.5% |
| Timely Diagnostic Follow-Up | 96.8% | 76.2% | 76.3% |
| Cancer Detection (per 1000 screens) | 5.66 | 0.17 | 1.46 |
Table 2: Evidence-Based Interventions to Improve Screening Participation and Follow-Up [11]
| Intervention | Breast Cancer | Cervical Cancer | Colorectal Cancer |
|---|---|---|---|
| Patient Navigation Services | Recommended (Strong) | Recommended (Sufficient) | Recommended (Strong) |
| Provider Assessment & Feedback | Recommended (Sufficient) | Recommended (Sufficient) | Recommended (Sufficient) |
| Provider Reminder & Recall Systems | Recommended (Strong) | Recommended (Strong) | Recommended (Strong) |
| Client Reminders | Recommended (Strong) | Recommended (Strong) | Recommended (Strong) |
| Multicomponent Interventions | Recommended (Strong) | Recommended (Strong) | Recommended (Strong) |
Experimental Protocol: Implementing an Audit and Feedback System for Screening Follow-Up
This protocol provides a detailed methodology for establishing an audit and feedback system to monitor and improve timely follow-up after abnormal cancer screening results, adaptable to various healthcare settings.
Objectives and Scope
- Primary Objective: To increase the proportion of patients receiving guideline-concordant timely follow-up after an abnormal breast, cervical, or colorectal cancer screening result.
- Defined Scope: The system should track the screening continuum from abnormal result identification through diagnostic resolution for the target cancers within a defined patient population.
- Population Identification:
- Data Sources: Extract data from Electronic Health Records (EHR), regional cancer screening registries (e.g., New Mexico HPV Pap Registry [10]), and pathology reporting systems.
- Eligibility: Include all screen-eligible individuals per USPSTF guidelines within the defined calendar year.
- Key Variable Abstraction:
- Patient demographics (age, gender, race/ethnicity, insurance status)
- Screening test type and date
- Screening result and date of result communication
- Date of recommended follow-up procedure
- Date of completed follow-up procedure (or documentation of refusal/cancellation)
- Final diagnostic finding (e.g., normal, precancerous lesion, cancer)
- Operational Definitions for Metrics: Utilize standardized definitions to ensure consistency, as exemplified in Table 1. For instance:
Data Analysis and Feedback Reporting
- Calculate Core Metrics: For each cancer type and relevant sub-populations (e.g., by clinic, provider, demographic group), calculate:
- Proportion of abnormal screens receiving timely diagnostic evaluation.
- Median/mean time from abnormal result to diagnostic resolution.
- Cancer detection rates per 1,000 screens.
- Generate Feedback Reports: Create comparative reports for clinical teams and leadership. These should benchmark performance against internal goals, external benchmarks from sources like the PROSPR consortium [10], and prior performance periods.
- Dissemination Schedule: Distribute feedback reports on a quarterly basis to maintain engagement and monitor progress. Supplement with annual comprehensive reports.
The Scientist's Toolkit: Research Reagent Solutions
Table 3: Essential Resources for Screening Follow-Up Research and Implementation
| Item | Function/Application |
|---|---|
| PROSPR Common Data Elements | Standardized definitions and metrics for harmonized data collection across breast, cervical, and colorectal cancer screening processes, enabling multi-site research and benchmarking [10]. |
| CPSTF Recommended Intervention Guide | Evidence-based repository of effective strategies (e.g., patient navigation, provider reminders) to inform the design of quality improvement initiatives aimed at boosting follow-up rates [11]. |
| Health Information System (HIS) Data | Data extracted from EHRs, claims, and registries used to passively identify cohorts, track outcomes, and automate aspects of the audit and feedback process [10] [12]. |
| Structured Interview Guides | Qualitative data collection tools to understand patient and provider perspectives on barriers and facilitators to follow-up care, essential for tailoring interventions [9]. |
| WCAG Contrast Checker Tool | Accessibility resource to ensure all patient-facing materials (letters, portals) and data visualization dashboards meet contrast standards for readability and inclusivity [13]. |
Integrated Discussion: Synergizing Audit and Feedback with System-Level Interventions
Audit and feedback alone is a necessary but insufficient component for achieving optimal follow-up rates. Its power is maximized when integrated within a suite of evidence-based strategies. Recent research on self-sampling modalities underscores that high patient satisfaction (mean satisfaction scores of 4.0/4.0) and preference for self-sampling (60% in one study) do not automatically translate to complete follow-up, highlighting the need for proactive system support [9]. This is particularly critical for underserved patients, where baseline knowledge is not a prerequisite for accessing follow-up care if robust systems are in place [9].
The organizational determinants of successful screening programs, as identified in a recent systematic review, include centralized coordination, active invitation systems, and integrated quality assurance mechanisms [12]. These features align perfectly with a comprehensive audit and feedback framework. Furthermore, combining this framework with patient navigation services—which the CPSTF strongly recommends for all three cancers—addresses patient-level barriers that audits alone cannot [11]. Digital tools, such as reinforcement learning-based reminders, further enhance this ecosystem when fully integrated [12]. The ultimate goal is a learning health system where continuous audit informs targeted feedback, which in turn activates multi-component interventions (e.g., navigation + reminders + reduced structural barriers), creating a virtuous cycle that closes the follow-up gap and fulfills the public health imperative of cancer screening.
Audit and feedback (A&F) systems represent a cornerstone implementation strategy for improving healthcare quality, including within the critical domain of cancer screening follow-up. The Clinical Performance Feedback Intervention Theory (CP-FIT) provides a theoretical framework for A&F, proposing that it operates through a cyclical feedback process that optimizes individual patient care and modifies organizational care delivery [14]. In cancer screening, where the benefits of early detection can be undermined by failures in the diagnostic cascade after an abnormal result, A&F systems offer a mechanism to ensure completion of the screening process. This application note synthesizes the current evidence base, provides structured experimental protocols, and details essential resources for implementing A&F systems in cancer screening follow-up research, directly supporting the broader thesis that systematically applied A&F significantly improves compliance with recommended pathways.
Quantitative Evidence Base for Audit and Feedback
Robust quantitative evidence supports the efficacy of A&F in clinical settings. A systematic review of A&F involving over 140 randomized trials demonstrates a small to moderate effect (median 4.3% improvement) on professional compliance with desired clinical practice, though the effect size varies widely (from -9% to +70%) depending on design and context [1]. The specific application of A&F within cancer screening systems shows considerable promise. A recent systematic review (2025) on organizational determinants of cancer screening participation found that A&F mechanisms modestly improved adherence, particularly when aligned with quality improvement initiatives [15]. Furthermore, the CanScreen5 global cancer screening repository, encompassing data from 84 countries, underscores the critical importance of robust information systems for tracking performance—a foundational element for effective A&F [16].
Table 1: Documented Efficacy of Audit and Feedback in Healthcare and Cancer Screening
| Context/Study | Reported Effect Size or Outcome | Key Determinants of Success |
|---|---|---|
| General Healthcare (Cochrane Review) | Median 4.3% improvement in compliance; range: -9% to +70% [1] | Focus on poorly performing providers; clear targets and action plans [1] |
| Cancer Screening Programs | Modest improvement in adherence [15] | Alignment with quality improvement initiatives; integration within broader organizational ecosystems [15] |
| Acute Stroke Treatment (tPA) | Development of 5 additional implementation strategies post-feedback (e.g., education, protocol folders, increased access) [14] | Enablement, training, and environmental restructuring as mechanisms of action [14] |
| State-wide Value-Based Healthcare | Operated through 8 mechanistic processes (e.g., ownership, sensemaking, social influence) [17] | Engagement between auditors/clinicians; meaningful indicators; clear improvement plans [17] |
Experimental Protocols for A&F Research
Protocol 1: Multilevel Intervention for Abnormal Cancer Screening Follow-up (mFOCUS)
The multilevel Follow-up of Cancer Screening (mFOCUS) trial provides a rigorous, pragmatic protocol for evaluating A&F in a real-world setting [18].
- Objective: To evaluate the effectiveness of a multilevel intervention on improving the follow-up of abnormal breast, cervical, colorectal, and lung cancer screening results.
- Study Design: A 4-arm, cluster randomized controlled trial (RCT) with primary care sites as the unit of randomization.
- Arms and Interventions:
- Standard Care: Usual follow-up processes without systematic intervention.
- Visit-Based Reminders: EHR-based reminders visible to both patients and providers when the record is accessed.
- Population Health Outreach: Visit-based reminders plus proactive outreach (e.g., letters, calls) from a population health team.
- Patient Navigation: All of the above, plus patient navigation with systematic screening for and referral to address social barriers to care (e.g., transportation, cost).
- Population: Adults overdue for follow-up of an abnormal screening test for breast, cervical, colorectal, or lung cancer, as defined by specific, guideline-based timeframes (e.g., 6 months overdue for a high-risk cervical abnormality requiring colposcopy) [18].
- Primary Outcome: Completion of appropriate follow-up, specific to the abnormal finding, within 120 days of trial eligibility.
- Implementation Notes: The trial operates as a "fail-safe" system, supplementing rather than replacing standard care. It leverages a single Epic EHR across participating sites and obtained a waiver of informed consent, enhancing its pragmatic nature [18].
Protocol 2: Qualitative Investigation of A&F Mechanisms
Understanding how A&F works requires qualitative methodologies to uncover underlying mechanisms [14] [17].
- Objective: To identify the implementation strategies generated by clinical teams in response to A&F and to specify their mechanisms of action.
- Study Design: Qualitative study using semi-structured interviews, analyzed retroductively using a context-mechanism-outcome framework.
- Setting and Participants: Purposive sampling of healthcare providers and administrative staff involved in the clinical area targeted by the A&F intervention (e.g., emergency department staff for acute stroke care).
- Data Collection: Conduct semi-structured interviews grounded in implementation frameworks like the COM-B model or Theoretical Domains Framework. Interviews should continue until thematic saturation is achieved (e.g., 10 interviews) [14].
- Analysis:
- Transcribe interviews verbatim.
- Code transcripts to identify emergent implementation strategies developed internally by staff in response to feedback.
- Analyze the coded strategies to specify the mechanisms of action (e.g., enablement, training, environmental restructuring) through which they are believed to effect change [14].
- Outcome: A refined program theory detailing the causal pathways through which A&F leads to practice improvement in a specific context.
Mechanistic Workflow of Audit and Feedback
The following diagram illustrates the theorized cyclical workflow of an effective audit and feedback intervention, synthesizing elements from CP-FIT and empirical research [1] [14] [17].
A&F Cyclical Workflow
The Scientist's Toolkit: Research Reagent Solutions
Table 2: Essential Materials and Resources for A&F Cancer Screening Research
| Item/Resource | Function/Application in A&F Research | Exemplars/Specifications |
|---|---|---|
| Electronic Health Record (EHR) System | Primary data source for audit; platform for embedding visit-based reminders. | Epic or similar integrated systems enabling data extraction and clinical decision support [18]. |
| Clinical Data Registry | Centralized repository for tracking screening participants across the entire care continuum (identification, invitation, result, follow-up). | CanScreen5 platform; EU national screening registries [16]. |
| Performance Indicator Set | Standardized metrics for audit, allowing for benchmarking and quality assessment. | 23 priority indicators from CanScreen-ECIS (e.g., detection rate, examination coverage, interval cancer rate) [19]. |
| Feedback Report Template | Structured format for delivering performance data to clinicians and teams. | Incorporates CP-FIT variables: defined goals, peer comparison, clear visualizations (e.g., bar/line graphs), action plan [14]. |
| Qualitative Interview Guides | Tool for investigating the mechanisms of action and contextual factors influencing A&F success. | Guides grounded in COM-B, TDF, or other implementation frameworks [14] [17]. |
| Stakeholder Engagement Framework | Methodology for ensuring clinician buy-in and co-design of the A&F intervention. | APEASE criteria (Affordable, Practical, Effective, Acceptable, Safe, Equitable) for strategy selection [14]. |
Audit and Feedback (A&F) systems represent a critical methodology for improving healthcare quality by closing gaps in the cancer screening continuum. This process involves systematically measuring current practices against benchmarks and delivering structured data to providers to prompt performance improvement. The fragmentation of outpatient care makes timely follow-up of abnormal diagnostic findings a persistent challenge, even with advanced electronic medical record (EMR) systems [20]. Research indicates that critical imaging results may not receive timely follow-up actions in 7.7% of cases, even when providers receive and read results in an integrated EMR system [20]. This Application Note provides a detailed framework for implementing A&F systems that map to each step of the cancer screening pathway, from abnormal result to diagnostic resolution, with specific protocols for researchers studying quality improvement in cancer screening follow-up.
Quantitative Foundations of the Screening Pathway
Effective A&F systems require robust baseline metrics to identify gaps and measure improvement. Population-based research provides critical benchmarks for each phase of the screening continuum.
Table 1: Population-Based Cancer Screening Metrics Across the Care Continuum
| Screening Metric | Breast Cancer | Cervical Cancer | Colorectal Cancer |
|---|---|---|---|
| Screening Participation | 63.5% | 84.6% | 77.5% |
| Percent Abnormal Screens | 10.7% | 4.4% | 4.5% |
| Timely Diagnostic Follow-up | 96.8% | 76.2% | 76.3% |
| Cancer Detection Rate (per 1000 screens) | 5.66 | 0.17 | 1.46 |
Source: PROSPR Consortium, 2013 data [10]
The screening process encompasses multiple vulnerable points where breakdowns can occur. For abnormal imaging results, studies show that 18.1% of critical alerts remain unacknowledged by providers, with trainees having significantly higher risk of non-acknowledgment (OR, 5.58; 95% CI, 2.86-10.89) [20]. Dual communication (alerting multiple providers) paradoxically increases the risk of lack of timely follow-up (OR, 1.99; 95% CI, 1.06-3.48), potentially due to diffusion of responsibility [20]. These quantitative foundations enable researchers to identify specific leakage points in the screening pathway and target A&F interventions accordingly.
Experimental Protocols for A&F System Implementation
Protocol 1: Tracking Critical Result Follow-up
Objective: To quantify and improve follow-up rates for abnormal cancer screening results.
Materials: EMR with alert tracking capability, standardized reporting codes for abnormal findings, audit tracking software.
Methodology:
- Identify Abnormal Results: Utilize predefined standardized codes for abnormal imaging requiring action [20].
- Transmission Protocol: Configure EMR to transmit electronic alerts to View Alert window of ordering providers [20].
- Acknowledgement Tracking: Implement tracking software to determine whether alerts were acknowledged (provider opened message) within two weeks of transmission [20].
- Follow-up Assessment: Review medical records 4 weeks post-transmission for documented follow-up actions (additional testing, consultations, patient notifications) [20].
- Provider Verification: Contact providers directly when documentation is absent to confirm follow-up status [20].
Key Measurements:
- Alert acknowledgement rate within 14 days
- Timely follow-up action rate within 28 days
- Rate of undocumented follow-up actions
Protocol 2: Implementing Multimodal Communication Interventions
Objective: To evaluate the impact of supplemental communication strategies on follow-up rates.
Background: Electronic alerts alone demonstrate significant failure rates, with nearly 10% of unacknowledged alerts lacking timely follow-up [20].
Intervention Components:
- Verceral Communication: Radiologist initiates additional verbal communication for critical findings [20].
- Structured Documentation: Implement standardized fields for documenting follow-up plans in EMR.
- Dual Provider Identification: Designate primary responsibility when multiple providers receive alerts.
Experimental Groups:
- Control: Standard electronic alert system only
- Intervention 1: Electronic alert + verbal communication
- Intervention 2: Electronic alert + structured documentation + clear responsibility assignment
Outcome Measures: Compare rates of timely follow-up across groups using multivariable logistic regression models accounting for clustering effect by providers [20].
Visualization of A&F System Implementation
The following workflow diagram maps the complete A&F system implementation pathway from abnormal result identification to diagnostic resolution and system refinement:
Research Reagent Solutions
Table 2: Essential Research Materials for A&F System Implementation
| Research Component | Function | Implementation Example |
|---|---|---|
| EMR Alert System | Transmits critical result notifications | VA CPRS View Alert system [20] |
| Alert Tracking Software | Monitors provider acknowledgment | Vista alert-management-tracking program [20] |
| Standardized Coding System | Classifies abnormal findings requiring action | Radiology predefined alert codes [20] |
| Audit Protocol | Validates data collection methodology | HEDIS Compliance Audit framework [21] |
| Common Data Elements | Ensures consistent metric definition | PROSPR screening continuum metrics [10] |
Regulatory and Accreditation Context
A&F systems must align with evolving regulatory requirements. For 2025 reporting, key updates include lowered screening age for breast cancer (from 52 to 42 years) and transition of Childhood Immunization Status to ECDS reporting [21]. The Commission on Cancer (CoC) has updated Standard 4.8 for 2025, clarifying that survivorship services must address needs of patients who have completed their first course of treatment and cannot be single events [22]. HEDIS Compliance Audits require standardized methodology providing independent assessment of information systems, data management processes, and final HEDIS rates [21]. Researchers must incorporate these evolving standards into A&F system design to ensure real-world applicability.
Mapping effective A&F systems to the cancer screening pathway requires meticulous attention to quantitative benchmarks, implementation protocols, and regulatory frameworks. The protocols and visualizations presented herein provide researchers with structured approaches to address the critical gap between abnormal result identification and diagnostic resolution. By implementing the structured protocols and utilizing the essential research tools outlined, investigators can develop robust A&F systems that significantly improve timely follow-up rates and ultimately reduce diagnostic delays in cancer care. Future research should focus on optimizing communication systems in increasingly fragmented healthcare environments and exploring the impact of emerging technologies on reducing follow-up gaps.
Audit and feedback (A/F) systems are integral to improving the quality of cancer screening programs. These tools provide healthcare providers with summaries of their clinical performance over a specified period, aiming to bridge the gap between actual and desired practice. Framed within a broader thesis on A/F systems for cancer screening follow-up research, this application note details key quantitative outcomes, experimental protocols, and essential research tools for evaluating the impact of these systems on follow-up rates and cancer mortality. The insights are critical for researchers, scientists, and drug development professionals working to optimize cancer care pathways and validate the effectiveness of quality improvement interventions.
Key Quantitative Outcomes from Audit and Feedback Systems
Empirical evidence demonstrates that A/F systems can positively influence screening participation, a critical step in the early detection of cancer. Key outcomes from a large-scale evaluation of the Primary Care Screening Activity Report (PCSAR) in Ontario, Canada, are summarized in the table below [23].
Table 1: Impact of Physician Engagement with PCSAR on Cancer Screening Participation
| Cancer Screening Program | Adjusted Odds Ratio (AOR) associated with Physician Registration | Adjusted Odds Ratio (AOR) associated with Physician Log-in |
|---|---|---|
| Colorectal Cancer | 1.06 [1.04; 1.09] | 1.07 [1.03; 1.12] |
| Breast Cancer | 1.15 [1.12; 1.19] | 1.18 [1.14; 1.22] |
| Cervical Cancer | 1.10 [1.08; 1.12] | 1.16 [1.13; 1.19] |
This study found that simply having a physician registered to receive the PCSAR was associated with a statistically significant, though modest, increase in the odds of screening participation across all three cancer types [23]. The effect was more pronounced when physicians actively logged in to view their reports, underscoring that engagement with the A/F tool is a key driver for improving screening follow-up rates.
Beyond intermediate outcomes like screening participation, the ultimate goal of screening programs is to reduce cancer-specific mortality. A meta-analysis of follow-up strategies after curative-intent treatment for common cancers provides critical insights [24].
Table 2: Impact of Intensive Follow-Up on Survival for Common Cancers (Meta-Analysis of Low Risk of Bias Studies)
| Cancer Type | Impact on Overall Survival (Hazard Ratio, 95% CI) | Impact on Curative Treatment of Recurrences (Relative Risk, 95% CI) |
|---|---|---|
| Colorectal | 0.99 [0.92 - 1.06] | 1.30 [1.05 - 1.61] |
| Breast | 1.06 [0.92 - 1.23] | Not Available |
| Upper Gastro-Intestinal | 0.78 [0.51 - 1.19] | 0.92 [0.47 - 1.81] |
| Prostate | 1.00 [0.86 - 1.16] | Not Available |
The analysis concluded that for colorectal and breast cancer, high-quality studies do not show a significant impact of intensive follow-up strategies on overall survival [24]. However, for colorectal cancer, intensive follow-up did lead to a 30% increase in the rate of recurrences being treated with curative intent, highlighting an important clinical benefit even in the absence of a clear survival signal [24].
Experimental Protocols for Evaluating A/F Interventions
Protocol 1: Factorial Experiment to Test Email Content for A/F Engagement
Objective: To determine whether emails incorporating specific Behavior Change Techniques (BCTs) increase log-in rates to a web-based A/F tool (the Screening Activity Report, or SAR) [4] [25].
Background: Analytics revealed that 50% of email recipients did not open the original monthly SAR update email, and less than 7% clicked the link to access their report [4]. This protocol was designed to optimize this communication.
Methods:
- Intervention Design:
- A user-centered, co-creation approach was employed, involving focus groups and workshops with both "adopter" (physicians who used the SAR) and "non-adopter" physicians [25].
- Three BCTs from the Behavior Change Technique Taxonomy (v1) were selected for testing [4] [25]:
- Anticipated Regret: Inducing expectations of future regret about not logging in (e.g., "How would you feel if a patient had a poor outcome because you missed an abnormal test result?") [4].
- Material Incentive (Behavior): Linking SAR use to an existing monetary bonus for achieving high screening rates [4].
- Problem Solving: Providing strategies to overcome barriers to access (e.g., tips on delegating access or scheduling time) [4].
- Study Design:
- A pragmatic, 2x2x2 factorial randomized experiment within a Multiphase Optimization Strategy (MOST) framework [4].
- Participants (primary care physicians registered for the SAR) were randomized into one of eight experimental conditions, receiving monthly emails with all possible combinations of the three BCTs (on or off) [4].
- Outcomes:
This protocol provides a robust model for experimentally testing communication strategies to enhance engagement with A/F systems.
Protocol 2: Measuring Mortality Impact - An Alternative to Rate Ratios
Objective: To accurately measure the mortality benefit of cancer screening interventions by using "deaths averted" to avoid dilutional bias inherent in traditional rate ratio analyses [26].
Background: In screening trials, follow-up must continue beyond the active screening period. This includes deaths from cancers that became detectable only after screening ended, which are expected to occur equally in both screening and control groups. Including these "post-screening" cases in a rate ratio calculation dilutes the estimated effect, biasing the result toward unity (no effect) [26].
Methods:
- Data Analysis:
- Calculate the absolute difference in the number of cancer deaths between the screening and control arms. This difference represents the number of deaths averted (DA) [26].
- Adjust for small differences in person-years of follow-up between groups. The expected number of deaths in the screening group (Es) is calculated as: Es = (Observed deaths in control) × (Person-years in screening / Person-years in control) [26].
- DA = Es - Os, where Os is the observed number of deaths in the screening group [26].
- Presentation of Results:
This methodological approach is crucial for researchers aiming to provide an undiluted and more accurate estimate of a screening program's impact on cancer mortality.
Workflow and Logical Diagrams
Research and Impact Pathway for A/F Systems
The following diagram illustrates the logical pathway from A/F intervention through to its key outcomes, integrating both intermediate clinical actions and ultimate mortality effects.
Experimental Design for BCT Testing
This diagram outlines the factorial design used to test the different behavior change techniques in email communications.
The Scientist's Toolkit: Research Reagent Solutions
For researchers aiming to replicate or build upon the studies cited, the following table details key resources and their functions.
Table 3: Essential Research Materials and Tools for A/F and Screening Impact Studies
| Item/Tool Name | Type/Model | Primary Function in Research |
|---|---|---|
| Behavior Change Technique Taxonomy (v1) | Classification System | Provides a standardized framework for defining and reporting active components (BCTs) in behavior change interventions, ensuring replicability [4] [25]. |
| Theoretical Domains Framework (TDF) | Analytical Framework | Used to identify potential determinants of behavior (e.g., emotions, beliefs about consequences) that BCTs are designed to target, informing intervention design [4]. |
| Multiphase Optimization Strategy (MOST) | Research Framework | An engineering-inspired framework for optimizing multicomponent behavioral interventions using factorial experiments to identify which components are active [4]. |
| Process Flow Diagrams (Swimlane Maps) | Quality Improvement Tool | Visual tools used to detail the specific steps, decision points, and responsibilities in a complex intervention, aiding in implementation, adaptation, and fidelity tracking [27]. |
| CanScreen5 Data Platform | Global Data Repository | A harmonized platform for collecting and reporting qualitative and quantitative data on cancer screening programs, enabling benchmarking and cross-program performance analysis [28] [16]. |
| Deaths Averted (DA) Metric | Statistical Method | An alternative to rate ratios for analyzing screening trial data; calculates the absolute difference in cancer deaths between arms to avoid dilutional bias from post-screening cases [26]. |
Building Effective Systems: A Step-by-Step Guide to A&F Implementation
Audit and feedback (A&F) systems represent a cornerstone implementation strategy for improving healthcare quality, particularly in cancer screening follow-up research. Defined as the collection and analysis of performance data (audit) followed by the presentation of clinical performance summaries to healthcare professionals (feedback), A&F programs aim to bridge evidence-practice gaps by influencing provider behavior [29]. When effectively designed and implemented, these systems can significantly impact adherence to cancer screening guidelines, though their success depends on a sophisticated interplay of core components. This article delineates the essential elements of a successful A&F program—assessment, reporting, and feedback loops—within the context of cancer screening research, providing researchers and drug development professionals with structured protocols and analytical frameworks to enhance intervention efficacy and sustainability.
Quantitative Foundations of A&F Effectiveness
Robust assessment forms the empirical foundation of any successful A&F program. Quantitative evaluation provides critical evidence of program impact, informs iterative refinements, and demonstrates value to stakeholders. Research across diverse cancer screening contexts reveals measurable effects on both participant engagement and clinical knowledge outcomes.
Table 1: Quantitative Outcomes from Cancer-Focused A&F and Educational Programs
| Program Characteristic | Program A (Tobacco Cessation) | Program B (Colorectal Cancer Screening) | Program C (Prostate Cancer Screening) | Program D (Caregiver Education) |
|---|---|---|---|---|
| Participants | 195 | 45 | 59 | 132 |
| Program Duration | 4 months | 7 months | 9 months | 7 months |
| Session Frequency | 4 monthly sessions | 7 monthly sessions | 9 monthly sessions | 7 monthly sessions |
| Participant Engagement | Average of 20.15 participants per session across all programs | |||
| Knowledge Increase (5-point scale) | +0.84 average increase across programs | |||
| Confidence Increase (5-point scale) | +0.77 average increase across programs | |||
| Implementation Likelihood | 59% of participants planned to use information within one month |
Source: Adapted from American Cancer Society ECHO Program evaluations [30]
The data in Table 1 illustrates that structured virtual education programs incorporating A&F principles can successfully engage healthcare professionals across multiple cancer domains. Notably, participants demonstrated significant improvements in both knowledge and confidence—essential precursors to behavior change—with the majority intending to rapidly implement learned strategies in clinical practice [30]. These quantitative outcomes provide a benchmark for researchers developing A&F interventions targeting cancer screening improvement.
Experimental Protocol: Measuring A&F Impact on Screening Participation
Objective: To quantitatively evaluate the effect of a multimodal A&F intervention on colorectal cancer screening participation rates within primary care practices.
Materials and Reagents:
- Electronic medical record system with screening-eligible patient population
- Data extraction and aggregation software (e.g., SQL databases, Python/R scripts)
- Secure data visualization platform for feedback reports
- Validated survey instruments for measuring knowledge and confidence (5-point Likert scales)
- Statistical analysis software (e.g., SPSS, GraphPad Prism, R)
Methodology:
- Baseline Assessment Phase (Months 1-3):
- Extract retrospective data on screening rates for 12 months pre-intervention
- Identify eligible patient population using established criteria (e.g., age 45-75, no prior screening, no personal history of CRC)
- Administer pre-intervention surveys to assess clinician knowledge, confidence, and perceived barriers regarding CRC screening guidelines
Intervention Phase (Months 4-9):
- Implement multimodal A&F intervention comprising:
- Monthly performance reports comparing individual and practice-level screening rates to regional benchmarks
- Peer comparison data presented through anonymized rankings
- Actionable recommendations for addressing screening barriers
- Virtual group sessions for case discussion and strategy sharing
- Implement multimodal A&F intervention comprising:
Post-Intervention Assessment (Months 10-12):
- Measure primary outcome: change in screening completion rates
- Administer post-intervention surveys to assess changes in knowledge and confidence
- Conduct semi-structured interviews to identify implementation facilitators and barriers
Statistical Analysis:
- Use paired t-tests or Wilcoxon signed-rank tests to compare pre-post screening rates
- Calculate mean differences in knowledge and confidence scores with 95% confidence intervals
- Perform multivariable regression to identify predictors of screening improvement
This protocol emphasizes the importance of baseline measurement, multimodal intervention components, and mixed-methods assessment to comprehensively evaluate A&F effectiveness in cancer screening contexts [30] [15].
Organizational Frameworks for A&F Implementation
The structural context in which A&F programs operate significantly influences their effectiveness. Research indicates that organizational determinants can either facilitate or impede successful implementation, particularly for complex processes like cancer screening that involve multiple steps and healthcare team members.
Table 2: Organizational Determinants of Successful Cancer Screening Programs
| Organizational Factor | Impact on Screening Participation | Evidence Strength |
|---|---|---|
| Centralized Program Coordination | Higher participation through systematic population management | Strong [15] |
| Active Invitation Systems | 15-30% increase in initial uptake compared to passive approaches | Moderate-Strong [15] |
| Integrated Quality Assurance | Improved adherence through continuous monitoring and improvement | Moderate [15] |
| Community-Based Outreach | Particularly effective for underserved populations (15-25% increases) | Moderate [15] |
| Culturally Tailored Education | Addresses disparities and improves equity in screening access | Moderate [15] |
| Digital Reminder Systems | Significant improvements when integrated with organizational workflows | Moderate [15] |
| Audit and Feedback Mechanisms | Modest improvements, enhanced when aligned with QI initiatives | Moderate [15] |
Organizational infrastructure emerges as a critical determinant of A&F success. As demonstrated in Table 2, programs with centralized coordination, active outreach, and integrated quality assurance mechanisms demonstrate substantially better screening participation outcomes [15]. These findings underscore the importance of addressing organizational context before implementing A&F interventions, as even well-designed feedback may fail without supportive structural elements.
A&F Workflow Visualization
A&F Cycle Diagram: This workflow illustrates the continuous quality improvement process central to effective audit and feedback systems, highlighting the interconnected phases of assessment, reporting, and feedback loops.
Optimized Reporting Protocols for Maximum Impact
The design and delivery of feedback reports significantly influence recipient engagement and subsequent behavior change. Research indicates that reports must balance comprehensiveness with usability to effectively communicate performance data while facilitating actionable insights.
Experimental Protocol: User-Centered Design of A&F Reports
Objective: To develop and test cancer screening feedback reports through iterative user-centered design, maximizing usability, comprehension, and actionability for primary care providers.
Materials and Reagents:
- Prototype reports (original and redesigned versions)
- Screen recording software for usability testing
- Think-aloud protocol guidelines
- System Usability Scale (SUS) questionnaire
- Semi-structured interview guides
- Qualitative data analysis software (e.g., NVivo, Dedoose)
Methodology:
- Initial Design Phase:
- Develop prototype reports incorporating evidence-based design principles (peer comparison, visual benchmarks, actionable recommendations)
- Conduct cognitive walkthroughs with design team to identify obvious usability issues
Iterative Testing Phase:
- Recruit 16-20 family physicians naïve to the reports (non-users)
- Conduct one-on-one usability sessions observing navigation and comprehension
- Employ think-aloud protocol to capture real-time user impressions
- Measure time to complete key tasks (e.g., identify worst-performing metric)
- Administer SUS questionnaire following each session
Redesign and Refinement:
- Analyze usability data to identify navigation barriers and comprehension gaps
- Implement iterative design changes addressing identified issues
- Improve visual hierarchy, data visualization, and action planning guidance
- Enhance connection between performance data and improvement strategies
Field Evaluation:
- Deploy redesigned reports to active users (family physicians receiving reports)
- Conduct semi-structured interviews with 17+ participants until thematic saturation
- Assess alignment with clinical expectations and workflow integration
- Identify persistent barriers to engagement and action
Analysis:
- Calculate SUS scores for quantitative usability assessment
- Employ emergent thematic analysis of interview transcripts
- Code data for expectations, perceived usability, and implementation barriers
This protocol emphasizes the importance of iterative, user-centered design rather than sole reliance on evidence-based guidelines. Research demonstrates that even reports incorporating best practices may fail if they misalign with clinician expectations or workflow realities [29].
Sustaining Effective Feedback Loops
The feedback loop component represents the most dynamic element of A&F systems, transforming static reporting into continuous quality improvement. Effective loops facilitate sense-making, action planning, and iterative refinement based on changed practices.
Sustainability Framework for A&F Programs
Sustainability Framework: This diagram visualizes the Integrated Sustainability Framework (ISF) applied to A&F programs, highlighting the multi-level determinants necessary for maintaining benefits over time [31].
Research indicates that only 39% of A&F trials substantially address sustainability considerations, with limited detail on how sustainability is planned, implemented, or assessed [31]. The most frequent sustainability period in research is 12 months, though real-world programs require longer-term perspectives. Effective sustainability planning extends beyond simple continuation to encompass adaptation and evolution while maintaining core benefits.
Table 3: Essential Research Reagents for A&F Implementation Science
| Reagent/Resource | Function/Application | Implementation Notes |
|---|---|---|
| Electronic Health Record Systems | Data extraction for audit phase; outcome measurement | Ensure structured data fields for screening metrics [29] |
| Data Visualization Platforms | Feedback report generation; performance trending | Prioritize user-centered design; intuitive interfaces [29] |
| Statistical Analysis Software | Performance calculation; significance testing; benchmarking | GraphPad Prism, R, or Excel for descriptive statistics [30] |
| Quality Indicator Specifications | Standardized metric definitions for reliable audit | HEDIS measures provide validated specifications [21] |
| Survey Instruments | Measurement of knowledge, confidence, and usability | 5-point Likert scales for knowledge/confidence; System Usability Scale [30] [29] |
| Clinical Practice Guidelines | Evidence base for recommendations and action plans | ACS or USPSTF screening guidelines for content validity [15] |
| Secure Communication Platforms | Feedback delivery and follow-up communication | Balance accessibility with data security requirements [29] |
This toolkit provides the foundational elements for implementing rigorous A&F research in cancer screening contexts. Particular attention should be paid to the validity of quality indicators and the usability of data visualization platforms, as these components significantly influence recipient engagement and trust in the feedback provided [21] [29].
Discussion and Implementation Considerations
The core components of successful A&F programs—rigorous assessment, user-centered reporting, and sustainable feedback loops—function as an interdependent system rather than discrete elements. Research consistently demonstrates that effectiveness depends on the careful integration of all three components, with particular attention to contextual factors that influence implementation.
A critical implementation challenge involves balancing data comprehensiveness with report usability. Family physicians have expressed that feedback reports must reflect best practices, demonstrate data validity and accuracy, and focus on clinical activities within their control to change [29]. Furthermore, expectations of feasible quality improvement activities must align between report designers and recipients. Even well-designed reports face implementation barriers when misaligned with workflow realities, competing priorities, time constraints, or limited quality improvement skills among recipients [29].
For cancer screening specifically, researchers should consider incorporating emerging organizational strategies that demonstrate effectiveness, including centralized coordination, active invitation systems, culturally tailored education, and digital reminder systems [15]. These approaches complement A&F interventions by creating supportive structural contexts for behavior change. Additionally, the evolving landscape of cancer screening guidelines—such as the lowered breast cancer screening start age from 52 to 42 years in HEDIS MY 2025—necessitates ongoing surveillance of measure specifications and timely updates to audit criteria [21].
Future research directions should address the limited empirical understanding of factors impacting A&F sustainability and the development of frameworks that explicitly consider spread and scale mechanisms. Planning for scalability should extend beyond cost and infrastructure to encompass leadership engagement, policy alignment, and communication strategies that support wider adoption [31]. By addressing these gaps while adhering to the core components outlined herein, researchers can advance the effectiveness and impact of A&F programs in critical cancer screening domains.
Robust public health surveillance data is the cornerstone of effective cancer prevention and control programs, enabling the setting of objectives, planning of interventions, and evaluation of progress [32]. For audit and feedback systems specifically focused on cancer screening follow-up, three primary data sources provide complementary insights: Electronic Health Records (EHRs), cancer registries, and administrative claims data. EHRs contain rich clinical information including diagnoses, procedures, lab results, medications, and vitals that can be accessed in near real-time on large convenience samples of in-care patients [32]. Cancer registries provide reliable population-level cancer incidence and prevalence data but often lack comprehensive information about the complete cascade of care from screening through treatment initiation [32]. Administrative claims data offer detailed billing information across healthcare settings but may lack clinical granularity. When strategically integrated, these sources create a powerful infrastructure for monitoring and improving cancer screening follow-up processes, though significant technical and methodological challenges must be addressed.
Table 1: Core Characteristics of Primary Data Sources for Cancer Screening Research
| Data Source | Primary Content | Key Strengths | Major Limitations | Best Applications in Screening Audit |
|---|---|---|---|---|
| EHR Systems | Clinical narratives, lab results, vital signs, medications, structured clinical data [32] | Rich clinical detail, real-time access, direct capture of clinical care | Data fragmentation, interoperability challenges, documentation variability [33] [34] | Measuring screening adherence, identifying follow-up delays, risk factor assessment |
| Cancer Registries | Cancer site, histology, stage at diagnosis, initial treatment, mortality [32] | Population coverage, standardized data collection, longitudinal tracking | Limited prevention/screening data, reporting delays, incomplete treatment data [32] | Benchmarking cancer incidence, measuring diagnostic stage, survival analysis |
| Claims Data | Billing codes, procedures, diagnoses, pharmacy dispensing, provider details | Complete billing history, cross-setting coverage, large populations | Limited clinical context, coding inaccuracies, financial rather than clinical focus | Healthcare utilization patterns, cost analysis, provider payment models |
Electronic Health Records: Protocols for Data Extraction and Validation
EHR Data Extraction Methodology
The organic evolution of EHRs has resulted in significant challenges for data extraction, including lack of interoperability, difficulty locating critical data, and poor organization of information [33] [34]. A national survey of gynecological oncology professionals found that 92% routinely access multiple EHR systems, with 29% using five or more separate systems, and 17% spend more than half their clinical time searching for patient information [34]. To address these challenges, the following structured protocol enables effective EHR data extraction for cancer screening audit and feedback systems.
Protocol 2.1.1: Multi-System EHR Data Aggregation
- Objective: Consolidate structured clinical data from disparate EHR systems across participating healthcare institutions for cancer screening follow-up assessment.
- Materials: EHR access credentials, secure data transfer environment, data mapping specifications, patient matching algorithms.
- Procedure:
- Engage EHR vendors early to understand capabilities, pricing structures, and limitations around extracting clinical data for quality measures [35].
- Request standardized data extracts in QRDA-I, FHIR, CCDA, or flat-file formats (CSV, JSON) to ensure comprehensive data capture [35].
- Implement extraction-transform-load (ETL) pipelines using tools like Apache NiFi, Talend, or Python/Pandas to normalize disparate data structures [35].
- Apply Common Data Models (CDMs) such as OMOP or FHIR to standardize vocabulary and create interoperable data structures across systems [35].
- Create a centralized, standardized data repository that maintains data integrity and clinical context while enabling longitudinal analysis [35].
- Quality Control: Conduct chart reviews to validate that documentation accuracy is reflected in data extracts, with particular attention to external results not automatically incorporated into the primary EHR [35].
EHR Data Validation and Quality Assessment
A critical challenge in using EHR data for cancer surveillance is ensuring completeness and accuracy. Research indicates that EHR-based measures for risk factor indicators are often similar to estimates from external sources, but cancer screening and vaccination indicators can be substantially underestimated compared to external benchmarks [32]. These discrepancies often occur because screenings and vaccinations may be recorded in sections of the EHR not captured by common data models or because external results are never entered into the primary EHR system [35] [32]. The following protocol addresses these validation challenges.
Protocol 2.2.1: EHR Data Quality Assurance for Cancer Screening Metrics
- Objective: Identify and remediate data quality issues that impact accurate calculation of cancer screening follow-up measures.
- Materials: Source EHR systems, validation sample frames, data quality dashboards, clinical liaisons for chart review.
- Procedure:
- Conduct targeted chart reviews on a representative sample of patients for each provider to ensure documentation accuracy is reflected in data extracts [35].
- Cross-reference ACO-assigned patient lists from CMS (or other relevant sources) against EHR and billing data to ensure complete coverage and accurate attribution [35].
- Identify common data gaps including missing vital signs, tobacco use not recorded in structured fields, external lab results not entered into primary EHR, and incomplete diagnostic coding [35].
- Work closely with clinical teams to ensure documentation occurs in structured fields rather than solely in narrative notes [35].
- Compare EHR-derived estimates against external benchmarks from established surveillance systems to identify systematic biases [32].
- Quality Control: Establish ongoing data quality monitoring with predefined thresholds for key quality measures, implementing corrective actions when thresholds are not met.
Table 2: Common EHR Data Quality Issues and Remediation Strategies in Cancer Screening Contexts
| Data Quality Issue | Impact on Screening Metrics | Detection Method | Remediation Strategy |
|---|---|---|---|
| Missing structured data for cancer screenings [32] | Underestimation of screening rates | Compare EHR data with manual chart review | Implement clinical documentation improvement initiatives |
| External results not entered into primary EHR [35] | Incomplete cancer diagnosis and staging information | Identify patients with missing expected follow-up data | Establish health information exchange interfaces |
| Inconsistent diagnostic coding [35] | Inaccurate patient stratification and risk adjustment | Analyze code distribution patterns across providers | Provide coder education and automated coding suggestions |
| Fragmented data across multiple unconnected EHRs [34] | Incomplete clinical picture impacting follow-up decisions | Survey clinicians on time spent searching for information | Implement master patient index and record linkage algorithms |
Cancer Registries: Linkage Protocols for Enhanced Surveillance
Registry-EHR Integration Methodology
Cancer registries provide reliable data on cancer prevalence and incidence but traditionally lack comprehensive information about the full cascade of engagement with the healthcare system [32]. There has been growing support and adoption of using EHRs to automate and standardize reporting to state central cancer registries [32]. The integration of EHR data with traditional registry structures creates powerful opportunities for enhancing cancer screening audit and feedback systems.
Protocol 3.1.1: Registry-EHR Data Linkage for Comprehensive Cancer Surveillance
- Objective: Create enhanced surveillance capabilities by linking EHR clinical data with population-based cancer registry information.
- Materials: Registry data files, EHR extracts, secure linkage environment, probabilistic matching software, privacy-preserving record linkage protocols.
- Procedure:
- Extract and standardize patient demographics from both EHR and registry sources using common formats for matching variables.
- Apply probabilistic linkage methods using patient attributes such as name, date of birth, gender, address, and phone number [35].
- Implement unique patient identifiers where available to improve linkage accuracy and prevent future duplication.
- Conduct manual review processes for edge cases with conflicting or overlapping records that automated systems cannot resolve [35].
- Validate linkage quality through sampling and verification of matched records against source documents.
- Quality Control: Calculate false-match and non-match rates through rigorous sampling, with established thresholds for linkage quality acceptance.
Administrative Claims Data: Analysis Protocols for Screening Follow-up
Claims-Based Screening Metric Development
Administrative claims data offer valuable insights into healthcare utilization patterns relevant to cancer screening follow-up. The following protocol outlines approaches for leveraging claims data to monitor and improve cancer screening processes.
Protocol 4.1.1: Claims Data Analysis for Cancer Screening Quality Measures
- Objective: Utilize administrative claims data to monitor cancer screening adherence and identify follow-up gaps across healthcare systems.
- Materials: Medical and pharmacy claims files, enrollment data, provider directories, code sets for screening procedures.
- Procedure:
- Identify relevant diagnosis and procedure codes for cancer screenings and follow-up procedures (e.g., ICD-10-CM, CPT/HCPCS codes) [36].
- Apply attribution methodologies to assign patients to providers or accountable care organizations for quality measurement.
- Calculate screening adherence metrics based on guideline-appropriate intervals for specific cancer types.
- Identify potential follow-up gaps by flagging abnormal screening results without subsequent diagnostic procedures within recommended timeframes.
- Analyze patterns of care across demographic groups, providers, and geographic regions to identify disparities.
- Quality Control: Validate claims-based algorithms against clinical data from EHRs when possible to assess accuracy and completeness.
Integrated Data Systems: Advanced Applications for Audit & Feedback
Multi-Source Data Integration Framework
The most powerful approach to cancer screening audit and feedback systems involves strategic integration of EHR, registry, and claims data sources. This integration enables a more comprehensive view of the cancer screening continuum than any single source can provide. The 2022 National Cancer Policy Forum workshop highlighted opportunities for EHR innovations to substantially benefit patient care, quality improvement efforts, research, and cancer surveillance activities [33]. The following protocol outlines a framework for creating these integrated data systems.
Protocol 5.1.1: Multi-Source Data Integration for Cancer Screening Audit & Feedback
- Objective: Create a unified data infrastructure that leverages complementary strengths of EHR, registry, and claims data for comprehensive cancer screening monitoring.
- Materials: Data use agreements, secure computing environment, identity management system, data standardization tools.
- Procedure:
- Establish governance frameworks addressing data sharing, privacy, security, and appropriate use across participating organizations.
- Implement privacy-preserving record linkage to connect patient records across data sources while maintaining confidentiality.
- Develop common data models that accommodate structured and unstructured elements from each source while preserving critical clinical context.
- Create integrated patient timelines that sequence screening events, results, diagnoses, and treatments across all available data sources.
- Build feedback mechanisms that deliver timely, actionable information to clinicians and healthcare systems to improve screening follow-up.
- Quality Control: Implement comprehensive data quality assessment across all integrated sources, with ongoing monitoring of linkage accuracy and completeness.
Table 3: Cancer Screening Quality Measures Enabled by Integrated Data Systems
| Quality Measure Domain | EHR Contribution | Registry Contribution | Claims Contribution | Integrated Capability |
|---|---|---|---|---|
| Breast cancer screening follow-up [35] | Screening mammography results, biopsy reports | Cancer diagnosis confirmation, stage at diagnosis | Screening and diagnostic procedure billing codes | Complete pathway from screening to diagnosis and treatment initiation |
| Colorectal cancer screening adherence | Colonoscopy findings, FIT/fecal occult blood results | Colorectal cancer incidence, stage data | Screening modality claims, polyp surveillance | Longitudinal screening history with appropriate follow-up intervals |
| Cervical cancer prevention [32] | Pap and HPV test results, colposcopy findings | Cervical cancer cases, histology | Screening and procedure billing codes | Coordinated prevention and early detection strategies |
| Lung cancer screening [37] | LDCT results, smoking status documentation | Lung cancer incidence, histology | Screening claims, tobacco cessation counseling | Risk-based screening with appropriate diagnostic follow-up |
The Researcher's Toolkit: Essential Solutions for Data Integration
Table 4: Research Reagent Solutions for Cancer Screening Data Integration
| Tool Category | Specific Solutions | Primary Function | Application Context |
|---|---|---|---|
| Data Standardization | OMOP Common Data Model, FHIR Resources, CDISC Standards | Standardize vocabulary and structure across disparate data sources | Enables cross-system aggregation and analysis of clinical data [35] |
| Record Linkage | Probabilistic Matching Algorithms, Master Patient Index Systems, Privacy-Preserving Record Linkage | Accurately identify the same patient across different data systems | Essential for creating comprehensive patient timelines from fragmented sources [35] |
| Natural Language Processing | Clinical Text Analytics, Named Entity Recognition, Information Extraction Pipelines | Extract structured information from unstructured clinical narratives | Critical for capturing data documented only in free-text notes [33] [34] |
| Quality Measurement | eCQM Value Sets, QRDA Reporting Tools, FHIR-based Measure Evaluation | Calculate standardized quality metrics from structured clinical data | Supports compliance reporting and quality improvement initiatives [35] |
| Data Visualization | Clinical Dashboards, Quality Performance Displays, Longitudinal Patient Timelines | Present complex clinical data in accessible formats for feedback | Enables effective audit and feedback to clinicians and health systems [34] |
Audit and feedback (A&F) is a cornerstone strategy for improving healthcare quality, operating on the principle that highly motivated health professionals, when presented with information showing their clinical practice is inconsistent with evidence-based guidelines or peer performance, will focus attention on areas needing improvement [1]. Within cancer screening follow-up research, A&F systems are instrumental in addressing unwarranted clinical variation—the underuse, overuse, or misuse of services that cannot be explained by patient preference or medical science [38]. The ultimate goal of developing actionable metrics within these systems is to move beyond simple data reporting to a process that motivates change, closes care gaps, and increases population-level screening rates, which have been shown to increase by a median of 13 percentage points for breast, cervical, and colorectal cancer tests through such interventions [39].
Theoretical Foundation and Key Mechanisms
Effective A&F is not merely a data delivery system but a complex intervention operating through specific sociological and psychological mechanisms. A 2023 realist study identified eight core mechanisms through which A&F strategies exert their influence, categorized here as facilitators and barriers [38]:
Table: Key Mechanisms in Audit and Feedback Implementation
| Facilitating Mechanisms | Constraining Mechanisms |
|---|---|
| 1. Clinician ownership and buy-in | 5. Rationalizing current practice (vs. learning) |
| 2. Ability to make sense of information | 6. Perceptions of unfairness and data integrity concerns |
| 3. Motivation through social influence | 7. Development of unimplemented improvement plans |
| 4. Acceptance of responsibility and accountability | 8. Perceived intrusions on professional autonomy |
The Clinical Performance Feedback Intervention Theory suggests effective feedback is cyclical and sequential, becoming less effective if any process within the cycle fails [38]. This cyclical process typically involves five stages: preparing for audit, selecting criteria, measuring performance, making improvements, and sustaining improvements [1]. The design of actionable metrics must account for these mechanisms throughout the cycle.
A Framework for Actionable Metrics
Effective A&F systems require metrics at multiple levels of the care continuum, from broad clinic-level performance to individual provider actions. These metrics should be structured to create a clear pathway from measurement to action.
Table: Actionable Metrics Framework for Cancer Screening Follow-Up
| Level | Metric Category | Specific Metrics | Data Sources | Actionability |
|---|---|---|---|---|
| Clinic-Level | Population Health | % age-eligible patients up-to-date with screening | EHR, Patient Registry (UDS, HEDIS) | Identify system-level care gaps and resource needs |
| Efficiency | Screening completion rate (% referred who complete test) | EHR, Laboratory data | Assess patient follow-through and system barriers | |
| Provider-Level | Clinical Practice | % patients due for screening given a recommendation | EHR, Chart Audit | Target provider communication and recommendation habits |
| Documentation | % patients with screening test ordered | EHR, Billing Data | Improve adherence to screening protocols and documentation | |
| Patient-Level | Outcomes | Diagnostic follow-up rate (% with positive screen completing follow-up) | EHR, Specialist reports | Address care coordination and navigation gaps |
The design of these metrics should prioritize a limited number of indicators that are meaningful to clinicians, with clear targets and action plans specifying necessary steps for achievement [1] [38]. Feedback is more effective when focusing on providers with poor performance at baseline [1].
Experimental Protocols for Implementation and Evaluation
Cluster Randomized Controlled Trial Protocol
This protocol is adapted from Price-Haywood et al.' study comparing audit-feedback with additional communication training [2].
Objective: To evaluate whether training primary care providers (PCPs) in cancer risk communication and shared decision-making, in addition to audit-feedback, improves communication behaviors and increases cancer screening among patients with limited health literacy compared to audit-feedback alone.
Study Design: Four-year cluster randomized controlled trial.
Participants:
- 18 PCPs randomized to intervention or control groups.
- 168 patients with limited health literacy overdue for colorectal, breast, or cervical cancer screening.
Interventions:
- Communication Intervention Group: PCPs received skills training including standardized patient (SP) feedback on counseling behaviors.
- Control Group: PCPs received performance feedback only.
- Both Groups: Underwent chart audits of patients' screening status semiannually up to 24 months and received two annual performance feedback reports.
Key Measures:
- Process Measures: Unannounced SP encounters rating PCP communication behaviors.
- Outcome Measures: Patient knowledge of cancer screening guidelines over 12 months; patient cancer screening rates over 24 months.
Results Summary: The communication intervention group showed significantly higher ratings in general communication about cancer risks and shared decision-making for colorectal cancer screening. However, there were no between-group differences in screening rates except for mammography, and no improvement in patient cancer screening knowledge [2].
Realist Evaluation Protocol for Mechanism Investigation
This protocol is based on the study by Zurynski et al. investigating A&F for reducing clinical variation at scale [38].
Objective: To identify how, why, and in what contexts A&F strategies contribute to reducing unwarranted variation in care at scale.
Design: Realist study using a context-mechanism-outcome (CMO) framework.
Data Sources:
- Initial program theory development: systematic review, realist review, program document review, stakeholder discussions.
- Theory testing: semi-structured interviews with 56 participants.
- Theory validation: expert panels with senior health leaders (n=19), agency staff (n=11), and ministry of health staff (n=21).
Analysis: Retroductive analysis of transcripts coded into the A&F program theory to identify CMO configurations.
Key Findings: The program's A&F strategy operated through eight key mechanisms (see Section 2). Success was greatest when clinicians felt ownership, could understand the data, were socially influenced, and accepted accountability. Constraints included rationalization of current practice, data integrity concerns, unimplemented plans, and perceived threats to autonomy [38].
The Scientist's Toolkit: Research Reagent Solutions
Table: Essential Resources for Audit and Feedback Implementation
| Resource Category | Specific Tool/Reagent | Function/Application |
|---|---|---|
| Data Collection & Management | Electronic Health Record (EHR) Systems | Primary data source for automated performance assessment; enables chart audits and metric calculation [39]. |
| Patient Registries | Population-level tracking of screening eligibility and status across multiple providers and facilities [39]. | |
| Quality Assurance | Data Quality Assurance Forms | Ensure accuracy and consistency of data extracted from EHRs or manual chart reviews [39]. |
| Codebook for Narrative Data | Standardizes analysis of unstructured clinical notes for process evaluation [39]. | |
| Analysis & Visualization | Statistical Software (R, Python, SPSS) | Performs quantitative analysis, including descriptive statistics, regression, and significance testing [40] [41]. |
| Data Visualization Tools (ChartExpo, Prism) | Creates accessible feedback reports, dashboards, and graphs for presenting performance data to providers [40] [42]. | |
| Intervention Delivery | Standardized Patient Protocols | Assesses physician communication behaviors in controlled settings for intervention evaluation [2]. |
| Clinical Practice Guidelines | Evidence-based foundation for developing audit criteria and performance standards [39]. |
Data Presentation and Visualization Protocols
Effective presentation of quantitative data is critical for provider engagement. The feedback should provide a clear message that directs professionals’ attention to actionable, achievable tasks [1].
Table: Quantitative Data Analysis Methods for Audit and Feedback
| Analysis Method | Primary Function | Application in A&F | Example Visualization |
|---|---|---|---|
| Descriptive Statistics | Summarizes and describes data characteristics [41]. | Profile baseline performance, describe central tendency (mean, median) and dispersion (standard deviation) of screening rates [40] [41]. | Bar charts showing clinic-level screening rates; pie charts displaying proportion of patients up-to-date [41]. |
| Cross-Tabulation | Analyzes relationships between categorical variables [40]. | Compare screening performance across provider specialties, clinic sites, or patient demographics [40]. | Stacked bar charts illustrating performance differences between groups [40]. |
| Time Series Analysis | Tracks data points over consistent time intervals. | Monitor trends in screening rates pre- and post-intervention, assess sustainability of improvements. | Line charts showing monthly/quarterly screening compliance over multiple years [41]. |
| Statistical Process Control | Differentiates between common-cause and special-cause variation. | Identify statistically significant shifts in performance following feedback interventions. | Control charts with upper and lower control limits to detect non-random patterns. |
Visualizations should be tailored to the audience and purpose. For group feedback sessions, bar charts comparing peer performance (without identifying individuals) can leverage social influence mechanisms [38] [40]. For individual provider feedback, line charts showing their performance trend over time alongside goal lines are often more effective [41].
Developing actionable metrics for A&F in cancer screening requires more than technical precision; it demands attention to implementation science and human factors. Sustainable systems embody several key principles: they limit the number of audit indicators to maintain focus, involve clinical staff and local leaders in feedback design and delivery to ensure relevance and buy-in, provide opportunities for reflection to transform data into learning, and use iterative cycles of multimodal feedback from a credible source [1] [38]. Furthermore, the infrastructure for provider assessment and feedback should be integrated into existing systems where possible, as adding cancer screening to an existing system is more sustainable than creating parallel processes [39]. By adhering to these principles, researchers and health systems can transform raw performance data into actionable intelligence that systematically reduces unwarranted variation and improves cancer screening outcomes.
Within the framework of audit and feedback (A&F) systems for cancer screening follow-up, the mechanism by which performance data is delivered to stakeholders is a critical determinant of success. Audit and feedback involves the systematic assessment of clinical performance against standards and the subsequent delivery of that information to healthcare providers [15]. This application note details three core delivery mechanisms—digital dashboards, structured reports, and face-to-face sessions—providing protocols for their implementation within organized cancer screening programs. These protocols are designed to help researchers and scientists optimize A&F interventions to increase adherence to breast, cervical, and colorectal cancer screening guidelines, a challenge underscored by suboptimal participation rates despite robust evidence of clinical effectiveness [15].
Comparative Analysis of Feedback Delivery Mechanisms
The table below summarizes the defining characteristics, implementation requirements, and evidence base for the three primary feedback delivery mechanisms.
Table 1: Comparative Analysis of Feedback Delivery Mechanisms in Cancer Screening Audit and Feedback Systems
| Feature | Digital Dashboards | Structured Reports | Face-to-Face Sessions |
|---|---|---|---|
| Core Definition | Interactive, visual data platforms providing real-time or near-real-time performance metrics [39]. | Static, periodic documents (digital or print) detailing performance data, often in a standardized format [39]. | Direct, interpersonal meetings for discussing performance data, such as one-on-one or group academic detailing [39]. |
| Key Advantages | Promotes continuous self-monitoring; enables rapid identification of trends; can be customized to user role [39]. | Provides a stable, documented record for reference; suitable for broad distribution; lower initial technical burden [39]. | Facilitates in-depth discussion of barriers and solutions; allows for nuanced interpretation of data; builds peer accountability [43]. |
| Best Applications | Health systems with integrated EHRs and IT support; ongoing quality improvement initiatives; providing feedback at a glance [44]. | Programs with limited IT infrastructure; initial implementation phases; providing comprehensive, periodic summaries [39]. | Addressing significant performance gaps; complex cases requiring context; champion-led initiatives and quality improvement huddles [43] [39]. |
| Quantitative Impact Evidence | Associated with improved clinical processes; effectiveness enhanced by visual design principles [45]. | In CDC's CRCCP, part of a bundle of EBIs that increased screening rates [43]. | Increased completed cancer screenings by a median of 13 percentage points (Community Guide) [39]. |
Experimental Protocols for Implementation
The following protocols provide a step-by-step guide for implementing each feedback mechanism in a cancer screening A&F study.
Protocol 1: Implementing a Provider Feedback Dashboard
This protocol outlines the creation and deployment of a digital dashboard for providing screening feedback, leveraging principles of visual perception.
Step 1: Define Metrics and Data Sources
- Action: Convene stakeholders to select a limited set of key performance indicators (KPIs). Examples include clinic-level screening rates, provider-specific recommendation rates, or patient subpopulations due for screening [39].
- Methodology: Identify and validate electronic data sources, such as Electronic Health Records (EHRs) or patient registries. Determine the feasibility of automated data extraction.
Step 2: Dashboard Design and Visualization
- Action: Apply pre-attentive visual attributes (color, size, spatial position) to create an intuitive and hierarchy-driven display [45].
- Methodology: Use contrasting hues (e.g., red for "below target," green for "on target") to signal status instantly. Position the most critical summary metric (e.g., overall screening rate) in the upper-left corner. Opt for simple bar charts or gauges over complex visualizations [44]. Pilot-test mockups with end-users to assess clarity and usability.
Step 3: Integration and Training
- Action: Integrate the dashboard into existing clinical workflows, such as EHR home screens or dedicated quality improvement portals.
- Methodology: Develop and deliver concise training for providers and staff on how to access, interpret, and use the dashboard. Designate a point of contact for technical support [39].
Step 4: Monitoring and Iteration
- Action: Track dashboard usage metrics and solicit user feedback periodically.
- Methodology: Use analytics to monitor login frequency and feature use. Conduct brief surveys or focus groups to identify pain points and opportunities for improvement, iterating on the design accordingly [44].
Protocol 2: Producing and Distributing Structured Feedback Reports
This protocol covers the systematic process for generating and disseminating structured reports, a foundational A&F method.
Step 1: Performance Assessment
- Action: Conduct a retrospective audit of provider or clinic performance against predefined screening metrics.
- Methodology: Extract data from EHRs or registries. Calculate metrics such as the percentage of eligible patients up-to-date with screening for each provider, or the percentage of patients who received a screening recommendation during an appointment [39]. Ensure data quality through random chart audits.
Step 2: Report Generation
- Action: Compile the data into a standardized report format.
- Methodology: Structure reports to include: a summary of performance compared to the goal, individual provider data, and peer-group or clinic-average comparisons to foster "friendly competition" [39]. Use clear data visualizations like bar charts or tables, adhering to the same pre-attentive principles as dashboards [45].
Step 3: Report Distribution and Feedback Delivery
- Action: Disseminate reports to providers according to a planned schedule.
- Methodology: Determine the frequency (e.g., monthly, quarterly) and format (e.g., PDF, printed). Reports can be delivered via email or presented in a group setting. The choice depends on clinic culture and resources [39].
Step 4: Outcome Tracking
- Action: Monitor the impact of the feedback reports on screening outcomes.
- Methodology: Track the same KPIs used in the assessment phase over time to measure improvement. Monitor process measures like the number of feedback reports distributed per year [39].
Protocol 3: Conducting Face-to-Face Feedback Sessions
This protocol describes the organization and execution of interpersonal feedback sessions, which are highly effective but resource-intensive.
Step 1: Champion Identification and Preparation
- Action: Identify a credible individual to lead the feedback session.
- Methodology: Champions can be assigned or naturally emerge, with evidence suggesting naturally emerging champions may experience lower turnover [43]. They are often physicians, quality improvement managers, or high-level administrators. Provide champions with data interpretation and communication skills training [43].
Step 2: Data Review and Agenda Setting
- Action: The champion reviews performance data and prepares a structured agenda for the session.
- Methodology: Pre-circulate the structured feedback report to participants. The agenda should focus on interpreting the data, identifying root causes of screening gaps, and collaboratively developing actionable improvement strategies [39].
Step 3: Session Facilitation
- Action: Conduct the feedback session in a constructive, non-punitive manner.
- Methodology: The champion leads the discussion, using the data as a starting point. The session should encourage open dialogue about systemic barriers (e.g., time constraints, lack of patient navigators) and generate concrete solutions, such as workflow changes or new standing orders [43] [39].
Step 4: Action Plan Formulation and Follow-up
- Action: Conclude the session with a documented action plan and schedule for follow-up.
- Methodology: Document agreed-upon actions, responsible individuals, and timelines. Integrate these actions into the clinic's quality improvement cycle and schedule a follow-up session to review progress, which is critical for sustaining effects [39].
Visual Workflows
The following diagram illustrates the high-level logical relationship and typical workflow between the three feedback delivery mechanisms within an A&F system.
Diagram 1: Feedback Mechanism Workflow
The Scientist's Toolkit: Research Reagent Solutions
The table below lists key tools and components essential for building and studying audit and feedback systems for cancer screening.
Table 2: Essential Materials and Tools for A&F Research and Implementation
| Tool / Resource | Function / Description | Application in A&F Research |
|---|---|---|
| Electronic Health Record (EHR) | Primary source for structured data on patient demographics, appointments, and screening test orders/results [39]. | Extracting performance metrics for audits; can be used to build automated data pipelines for dashboards and reports. |
| Clinical Data Registry | A centralized database that aggregates patient care data across multiple sources for a specific condition or population [39]. | Provides a more standardized and reliable data source for calculating population-level screening rates than isolated EHR queries. |
| Data Visualization Software | Tools like R, Python, or commercial BI platforms to create graphs, charts, and interactive dashboards [44]. | Generating static visualizations for reports or building interactive dashboard prototypes for research interventions. |
| REDCap | Web application for building and managing online surveys and databases [43]. | Capturing qualitative feedback from clinicians on A&F interventions; managing study-related data. |
| Program Champion | A credible individual (e.g., QI manager, physician) who advocates for and facilitates the implementation of the A&F system [43]. | Critical for driving adoption, leading face-to-face feedback sessions, and ensuring the sustainability of the A&F intervention. |
The persistent gap between evidence-based guidelines and clinical practice remains a significant challenge in healthcare, particularly within cancer screening programs where suboptimal follow-up of abnormal results can lead to delayed diagnosis and poorer patient outcomes [46]. This case study examines the integration of Clinical Decision Support (CDS) systems with Audit and Feedback (A&F) tools to address the critical problem of inadequate follow-up for abnormal cervical cancer screening results, a issue affecting many patients globally [3]. The approach represents a convergence of two complementary strategies: CDS, which provides real-time, point-of-care guidance, and A&F, which delivers retrospective performance summaries to encourage practice improvement [46]. By framing this integration within the context of cervical cancer screening follow-up, this analysis provides researchers and healthcare professionals with evidence-based protocols and implementation frameworks that leverage the strengths of both approaches to enhance care quality and address systematic gaps in screening completion.
Theoretical Framework and Mechanisms of Action
Distinctions and Complementarity of CDS and A&F
Clinical Decision Support systems and Audit and Feedback represent distinct but potentially synergistic approaches to quality improvement. CDS functions primarily as a point-of-care intervention, providing "just-in-time" information to support specific clinical decisions for individual patients during clinical encounters [46]. In contrast, A&F operates retrospectively, summarizing clinical performance data over time to help providers identify patterns, compare their practice against benchmarks or standards, and engage in reflective practice improvement [46]. This temporal distinction—real-time versus retrospective—defines their fundamental operational differences but also reveals their potential complementarity.
The theoretical foundation for A&F interventions draws heavily from psychological theories of self-regulation and behavior change, particularly control theory [46]. Control theory posits a feedback loop where individuals detect and work to reduce discrepancies between their actual performance and desired goals or standards [46]. Clinical Performance Feedback Intervention Theory (CP-FIT) further expands this foundation by incorporating goal-setting theory and feedback intervention theory, creating a comprehensive framework for understanding how feedback interacts with recipient and contextual factors to influence clinical behavior [46]. Within this theoretical framework, A&F interventions aim to trigger a cyclical process of performance assessment, reflection, and intentional behavior change, whereas CDS provides immediate decision support aligned with the desired performance standards.
Integrated Workflow and Logical Relationships
The integration of CDS with A&F creates a continuous quality improvement cycle that connects real-time decision support with retrospective performance reflection. The following diagram illustrates the logical relationships and workflow between these complementary systems:
Materials and Methods
Research Reagent Solutions and Essential Materials
Successful implementation of integrated CDS and A&F systems requires specific technical components and methodological approaches. The table below details essential "research reagents" and their functions in developing and evaluating such systems:
Table 1: Essential Research Reagents and Methodological Components for Integrated CDS-A&F Systems
| Component Category | Specific Tool/Solution | Function/Application | Evidence Source |
|---|---|---|---|
| CDS Identification Systems | Natural Language Processing (NLP)-Enhanced System | Extracts and processes clinical data from unstructured EHR fields to identify patients needing follow-up | [3] |
| CDS Identification Systems | LOINC-Defined EHR Integration | Utilizes standardized laboratory nomenclature to identify abnormal results through structured data fields | [3] |
| Feedback Delivery Platforms | Interactive Performance Dashboards | Provides visualizations of performance metrics with peer comparison and trend analysis capabilities | [47] [48] |
| Feedback Delivery Platforms | Precision A&F Email Systems | Delivers customized feedback messages prioritizing metrics with highest improvement potential | [48] |
| Evaluation Methodologies | Manual Chart Review Validation | Serves as gold standard for assessing CDS identification accuracy and follow-up completion | [3] |
| Evaluation Methodologies | Cluster Randomized Controlled Trials | Enables rigorous evaluation of intervention effectiveness while accounting for organizational-level effects | [3] [48] |
| Behavioral Intervention Components | Patient Navigation Services | Addresses socioeconomic barriers through direct patient contact and support | [3] |
| Behavioral Intervention Components | Multimodal Patient Outreach | Combines patient portal messages, mailed letters, and telephone contacts to encourage follow-up | [3] |
Experimental Protocol: Multisite Randomized Controlled Trial
This protocol outlines a comprehensive approach for evaluating integrated CDS and A&F interventions to improve follow-up of abnormal cervical cancer screening results, based on methodologies employed in recent research [3].
Study Design and Setting
- Design: Pragmatic, cluster randomized controlled trial with clinics as the unit of randomization and patients as the unit of analysis.
- Settings: Primary care clinics across multiple healthcare systems to ensure diverse patient populations and practice environments.
- Intervention Arms: Four distinct study arms to isolate intervention components:
- Usual care (control)
- CDS alone
- CDS with patient outreach
- CDS with patient outreach and navigation
Participant Eligibility and Recruitment
- Clinic Inclusion: Primary care practices with established cervical cancer screening populations and EHR capabilities supporting CDS implementation.
- Patient Inclusion: Individuals with abnormal cervical cancer screening results (e.g., abnormal Pap tests or positive HPV tests) without documented follow-up care within recommended timeframes.
- Identification Period: Enroll patients identified through the CDS system over a defined period (e.g., October 2020 to December 2021) to ensure adequate sample size and follow-up duration.
CDS Implementation and Configuration
Two distinct CDS models should be implemented to enable comparative effectiveness assessment:
- System A: Utilizes natural language processing to evaluate extracted data outside the EHR, capable of processing unstructured clinical data.
- System B: Employs commercial EHR functionality using LOINC-defined result fields, leveraging structured data elements.
Both systems must be configured to:
- Identify patients with overdue abnormal screening results
- Specify recommended follow-up actions based on current clinical guidelines
- Indicate appropriate time intervals for follow-up completion
- Integrate with existing clinical workflows to minimize disruption
A&F and Adjunctive Intervention Components
Precision A&F Implementation: Apply principles from precision feedback research [48], including:
- Identification of performance gaps most relevant to each provider
- Customized message framing based on recipient characteristics
- Visual displays optimized for rapid interpretation
- Reduction of cognitive processing burden through information prioritization
Patient Outreach Protocol: Implement multimodal outreach strategies including:
- Electronic patient portal messages with clear follow-up instructions
- Traditional mailed letters for patients without portal access
- Structured telephone follow-up with standardized scripting
Navigation Services: Deploy trained patient navigators to:
- Conduct barrier assessments through structured interviews
- Provide education about the importance of follow-up care
- Assist with appointment scheduling and transportation coordination
- Address financial concerns and identify available resources
Outcome Assessment and Data Collection
- Primary Outcome: Completion of recommended follow-up within 120 days of enrollment, verified through EHR documentation and manual chart review.
Secondary Outcomes:
- Time to follow-up completion from identification
- CDS accuracy (true positive rate) assessed through manual chart review
- Provider engagement with A&F components (dashboard logins, click-through rates)
- Patient satisfaction with navigation services (where applicable)
Data Collection Methods:
- Automated extraction from EHR systems for efficiency metrics
- Manual chart review for validation and outcome ascertainment
- Patient surveys to assess barriers and experiences (subsample)
- Provider interviews to understand implementation barriers and facilitators
Analysis Plan
- Power Calculation: Conduct sample size calculations accounting for cluster design effects and anticipated intraclass correlation coefficients.
- Primary Analysis: Compare follow-up completion rates across study arms using appropriate multilevel models that account for clustering at the clinic level.
- Subgroup Analyses: Examine intervention effects across patient demographics, clinic types, and CDS systems to identify potential effect modifiers.
- Process Evaluation: Employ mixed methods to understand implementation barriers, unintended consequences, and contextual factors influencing outcomes.
Results and Data Analysis
Quantitative Outcomes of CDS with Adjunctive Strategies
The implementation of integrated CDS with A&F and adjunctive strategies produces distinct quantitative outcomes across different intervention models. The following table summarizes key effectiveness data from recent trials:
Table 2: Comparative Effectiveness of Integrated CDS and A&F Interventions for Abnormal Cervical Cancer Screening Follow-up
| Intervention Component | System A Performance | System B Performance | Overall Effectiveness Assessment |
|---|---|---|---|
| CDS Identification Accuracy | 61.3% true positive rate | 70.4% true positive rate | Moderate accuracy across systems with LOINC-based approach demonstrating advantage [3] |
| CDS Alone vs. Usual Care | No significant improvement | No significant improvement | CDS alone insufficient to improve follow-up outcomes [3] |
| CDS + Patient Outreach vs. Usual Care | 38.2% vs. 23.5% (p<0.001) | 25.4% vs. 19.7% (p=0.044) | Statistically significant improvements in both systems [3] |
| CDS + Outreach + Navigation vs. Usual Care | 37.2% vs. 23.5% (p<0.001) | 23.0% vs. 19.7% (p=0.044) | Consistent significant effects, though magnitude varies by system [3] |
| Key Success Factors | NLP-enabled data extraction | LOINC-defined result fields | Multimodal approach critical; technology alone insufficient [3] |
Implementation Considerations and System Characteristics
The effective integration of CDS with A&F requires attention to specific implementation characteristics and system attributes. Evidence from antibiotic prescribing dashboards suggests that standalone dashboard implementations typically produce modest effects, while combinations with educational components, public commitment strategies, or behavioral economic principles demonstrate enhanced effectiveness [47]. This pattern aligns with findings from cervical cancer screening interventions, where CDS alone showed limited impact, but multimodal approaches significantly improved outcomes [3].
The precision A&F framework offers promising approaches to enhance engagement and effectiveness through mass customization of feedback [48]. This approach prioritizes the display of information for metrics carrying the highest value for performance improvement for each recipient and employs optimal message formats based on recipient characteristics and context [48]. Implementation strategies that incorporate theory-based customization, group-level segmentation, and individual-level tailoring create robust systems capable of accommodating varied user preferences and information needs [48].
Discussion
Implications for Cancer Screening Follow-up Research
The integration of CDS with A&F tools represents a promising approach to addressing persistent gaps in cancer screening follow-up, but requires careful implementation strategy. The evidence consistently demonstrates that technological solutions alone—whether CDS or A&F—produce modest effects at best [3] [47]. Rather, the greatest improvements emerge from combined approaches that address both cognitive support for clinicians (CDS) and reflective practice improvement (A&F) while simultaneously engaging patients through outreach and navigation services [3]. This suggests that effective interventions must target multiple points in the complex pathway from abnormal result to completed follow-up.
The comparative effectiveness of different CDS architectures offers important insights for future system development. The superior accuracy of the LOINC-defined result field approach (70.4% true positive rate) compared to the NLP-enhanced system (61.3%) suggests that structured data elements provide more reliable identification of abnormal results, though NLP systems may offer advantages in environments with less standardized documentation [3]. This accuracy differential may partially explain the variation in follow-up rates between systems (38.2% in System A versus 25.4% in System B with patient outreach), though contextual factors and implementation fidelity likely contribute to outcome differences.
Methodological Considerations for Future Research
Future research in integrated CDS and A&F systems should address several methodological challenges evident in current studies. First, the development of more sophisticated precision feedback systems requires better understanding of how different clinicians process and respond to performance data [48]. Research should explore how individual cognitive styles, behavioral economics principles, and organizational contexts influence engagement with feedback and subsequent behavior change.
Second, the effective integration of CDS with A&F necessitates advances in interoperability and knowledge management systems [48]. The development of open-source tools through public-private partnerships could accelerate innovation while reducing implementation barriers across diverse healthcare settings [3]. Such platforms would enable more rapid iteration and refinement of both CDS and A&F components based on real-world performance data.
Finally, research should explore optimal strategies for balancing specificity and scalability in integrated systems. While precision approaches offer theoretical advantages through customization [48], they also create implementation complexities that may limit dissemination. Identifying core components essential for effectiveness while allowing customizable elements based on local context represents a critical challenge for the field.
This case study demonstrates that integrating Clinical Decision Support with Audit and Feedback tools creates synergistic effects that address the complex challenge of improving follow-up for abnormal cancer screening results. The evidence indicates that neither CDS nor A&F alone produces substantial improvements, but combined interventions that incorporate patient engagement strategies significantly increase follow-up rates [3]. The most effective implementations leverage the respective strengths of each approach: CDS provides real-time, patient-specific guidance during clinical encounters, while A&F supports reflective practice improvement through performance summarization and benchmarking.
For researchers and healthcare organizations aiming to implement similar integrated systems, success appears to depend on several key factors: utilizing structured data elements for reliable patient identification, incorporating multimodal patient outreach and navigation services, applying precision feedback principles to enhance engagement, and embedding intervention components within broader organizational ecosystems that support quality improvement [3] [15] [48]. Future research should focus on refining precision feedback approaches, developing interoperable technical infrastructures, and identifying core components that maintain effectiveness while enabling scalable implementation across diverse healthcare settings.
Application Note: A Multi-Dimensional Framework for Data Quality Assurance
Automated chart audits are transforming quality assurance in cancer screening follow-up research by enabling systematic evaluation of complex healthcare data. Traditional manual audits are time-consuming, prone to subjectivity, and difficult to scale across healthcare systems. The integration of artificial intelligence (AI) and machine learning (ML) with electronic health records (EHRs) presents unprecedented opportunities for standardized, continuous quality monitoring. However, these approaches face significant data hurdles including heterogeneity, fragmentation, and variable quality across sources [49]. This application note details a structured framework for automated data quality assurance, providing researchers with validated methodologies to ensure data reliability for audit and feedback systems in cancer screening.
Core Data Quality Dimensions
A comprehensive data validation framework must assess both clinical metadata and imaging data across five critical dimensions established in cancer imaging research: completeness, validity, consistency, integrity, and fairness [49]. This multi-dimensional approach systematically identifies data quality issues that could compromise research outcomes.
Table 1: Data Quality Dimensions and Assessment Methods
| Quality Dimension | Definition | Common Issues | Assessment Methods |
|---|---|---|---|
| Completeness | Degree to which expected data is present | Missing clinical information, incomplete follow-up records | Percentage of missing values per required field; pattern analysis of missingness |
| Validity | Conformance to expected formats and value ranges | Inconsistent formatting, out-of-range values | Regular expression validation; range checks; format verification |
| Consistency | Absence of contradictions in the data | Conflicting dates (e.g., treatment before diagnosis); discrepant measurements | Cross-field validation rules; temporal logic checks |
| Integrity | Structural soundness and relational accuracy | Duplicate records; broken referential links | Deduplication algorithms; foreign key verification |
| Fairness | Balanced representation across population subgroups | Underrepresentation of demographic groups; subgroup imbalances | Subgroup distribution analysis; disparity metrics |
The fairness dimension requires particular emphasis in cancer screening research, where it refers to the balanced representation of key demographic and clinical subgroups, assessed for sex, age, cancer grade, and cancer type. This aligns with fairness principles in machine learning and is crucial for ensuring audit and feedback systems do not perpetuate healthcare disparities [49].
Protocol: Implementing Automated Quality Assurance for Cancer Screening Data
Data Extraction and Preprocessing
Objective: Establish reproducible methods for extracting and preparing cancer screening data from EHR systems for automated quality assessment.
Materials:
- Clinical Data Warehouses (CDWs): Centralized repositories aggregating data from hospital EHR systems [50]
- FHIR (Fast Healthcare Interoperability Resources) Standards: Enable interoperability between disparate healthcare systems [51]
- Natural Language Processing (NLP) Tools: For extracting structured information from unstructured clinical notes and pathology reports [50]
Procedure:
- Multi-Source Data Identification: Extract structured data elements from EHR systems using standardized code systems:
- ICD-10 codes for cancer diagnoses and comorbidities
- Procedure codes (e.g., CCAM in French systems) for screening and treatment interventions
- Pathology codes (e.g., ADICAP coding system) for histopathological confirmation [50]
Temporal Cohort Definition: Apply appropriate time windows for identifying incident cases and excluding recurrences. For example, exclude recurrences identified within three years after initial diagnosis to ensure incident case identification [50].
Data Harmonization: Implement terminology mapping to address syntactic (data representation) and semantic (meaning interpretation) heterogeneity across different healthcare systems [49].
Algorithm Development and Validation
Objective: Develop and validate automated algorithms for calculating cancer quality indicators from EHR data.
Materials:
- Computational Environment: Python or R with specialized healthcare data packages (e.g., PyHealth, OHDSI)
- Validation Framework: Implementation of performance metrics including PPV, accuracy, and F1-score
- Gold Standard Reference: Manual chart review by clinical experts
Procedure:
- Indicator Specification: Define computable phenotypes for each quality indicator using structured data elements. For example:
- Denominator: All newly referred cancer patients within specified timeframe
- Numerator: Subset meeting quality indicator criteria (e.g., completed follow-up, timely treatment) [50]
Algorithm Development: Create automated algorithms using logic operations combining multiple data sources (e.g., ICD-10 codes combined with pathology codes) to improve accuracy [50].
Performance Validation:
- Randomly select 100-200 patient charts for manual review by clinical experts
- Calculate algorithm performance metrics against gold standard manual review:
- Positive Predictive Value (PPV): Proportion of algorithm-identified cases that are true positives
- Accuracy: Overall correctness of identification
- F1-Score: Harmonic mean of precision and recall [50]
- Iteratively refine algorithms based on performance results
Table 2: Example Algorithm Performance Metrics from Multicentric Study
| Quality Indicator | Data Sources | PPV AP-HP | PPV Bordeaux | Accuracy | F1-Score |
|---|---|---|---|---|---|
| Newly referred HNC diagnoses | ICD-10 only | 37% | 87% | - | - |
| Newly referred HNC diagnoses | ICD-10 + Pathology codes | 89% | 100% | - | - |
| HNC surgery identification | Procedure codes only | - | - | 65% | - |
| HNC surgery identification | Procedure + Pathology codes | - | - | 84% | - |
Bias Assessment and Mitigation
Objective: Identify and address potential biases in cancer screening data that could skew audit results.
Materials:
- Bias Assessment Toolkit: Statistical packages for subgroup analysis (e.g., AI Fairness 360)
- Data Diversity Framework: Guidelines for evaluating representation across demographic and clinical subgroups
Procedure:
- Subgroup Representation Analysis: Assess data adequacy across key demographic (sex, age) and clinical (cancer type, stage) dimensions [49].
Algorithmic Bias Testing: Evaluate whether algorithm performance varies significantly across subgroups, which could indicate algorithmic bias [52].
Mitigation Strategy Implementation: If biases are identified, employ techniques such as:
- Oversampling of underrepresented groups
- Algorithmic adjustment to equalize performance across groups
- Stratified reporting to ensure visibility of subgroup-specific results [52]
Visualization: Automated Data Quality Assurance Workflow
Figure 1: Automated Data Quality Assurance Workflow. This diagram illustrates the sequential process for implementing automated data quality assurance, from initial data extraction through multi-dimensional assessment to final audit reporting.
The Scientist's Toolkit: Essential Research Reagents and Solutions
Table 3: Key Research Reagent Solutions for Automated Chart Audits
| Tool Category | Specific Solutions | Function | Implementation Considerations |
|---|---|---|---|
| Data Extraction Tools | FHIR APIs, OHDSI/OMOP CDM, SQL queries | Enable standardized access to EHR data across institutions | Require mapping local terminologies to standard vocabularies; privacy-preserving approaches essential |
| Quality Assessment Algorithms | Custom Python/R scripts, Data Quality Dashboards | Automate validation of data quality dimensions | Performance varies by data source combination; require ongoing validation against clinical gold standard |
| Bias Assessment Frameworks | AI Fairness 360, FairML, Custom subgroup analysis | Identify representation disparities across demographic and clinical groups | Must define relevant subgroups contextually; require demographic data completeness |
| Interoperability Standards | DICOM (imaging), ICD-10 (diagnoses), SNOMED CT (clinical terms) | Support semantic interoperability across heterogeneous data sources | Implementation consistency varies across healthcare systems; terminology mapping required |
| Validation Tools | Manual audit templates, Statistical comparison packages | Establish gold standard for algorithm validation | Time-intensive; require clinical expertise; sampling strategies critical for efficiency |
Advanced Implementation Strategies
Multi-Center Validation and Portability
Implementing automated chart audits across multiple healthcare institutions requires specific strategies to address system heterogeneity:
Cross-Site Validation Protocol:
- Algorithm Transfer Testing: Validate algorithms developed at one site on data from another healthcare system to assess portability [50].
- Harmonization Procedures: Address discrepancies between data sources through standardized terminology mapping. One multicentric study reported an average discrepancy rate of 44% between ICD-10 and pathology coding sources, highlighting the importance of multi-source verification [50].
- Federated Learning Approaches: For privacy-preserving multi-center analysis, consider federated learning architectures where algorithms are shared instead of patient data [49].
Integration with Audit and Feedback Systems
Linking data quality assurance with effective audit and feedback mechanisms requires:
Structured Feedback Design:
- Performance Benchmarking: Compare individual or site performance against peer groups, noting that this approach may have differential effects based on baseline performance [53].
- Actionable Reporting: Provide specific, measurable recommendations for quality improvement rather than simple score reporting.
- Longitudinal Tracking: Monitor quality metrics over time to identify trends and evaluate improvement interventions.
Recent research indicates that audit and feedback interventions should avoid one-size-fits-all approaches, as they may paradoxically disincentivize high performers while potentially motivating those with lower baseline performance [53].
Visualization: Multi-Dimensional Data Assessment Framework
Figure 2: Multi-Dimensional Data Assessment Framework. This diagram illustrates the five core data quality dimensions and their corresponding assessment methodologies that collectively ensure reliable data for cancer screening audit and feedback systems.
Automated chart audits represent a transformative approach to data quality assurance in cancer screening follow-up research. By implementing the structured frameworks and protocols outlined in this application note, researchers can overcome significant data hurdles including heterogeneity, incompleteness, and potential biases. The multi-dimensional assessment approach—encompassing completeness, validity, consistency, integrity, and fairness—provides a comprehensive foundation for developing trustworthy audit and feedback systems. Successful implementation requires meticulous attention to algorithm validation, bias mitigation, and cross-system portability to ensure that resulting quality metrics reliably inform cancer care improvement initiatives. As automated approaches mature, they offer the potential to shift quality assessment from periodic manual audits to continuous, systematic monitoring that can significantly enhance cancer screening outcomes across diverse healthcare settings.
Navigating Implementation Barriers and Enhancing A&F System Performance
Application Note: Systematic Identification of Implementation Pitfalls in Cancer Screening Audit & Feedback
Audit and feedback systems are critical for improving cancer screening follow-up, yet their implementation faces persistent challenges across healthcare systems. This application note synthesizes evidence on three core pitfall categories—workflow integration, data complexity, and provider engagement—that impact the effectiveness of audit systems for cancer screening quality improvement. By identifying these barriers and providing structured assessment protocols, we aim to enhance the design and implementation of audit systems for breast, colorectal, cervical, and lung cancer screening programs.
Quantitative Analysis of Documented Pitfalls
Table 1: Prevalence and Characteristics of Implementation Pitfalls in Cancer Screening Programs
| Pitfall Category | Specific Challenge | Documented Prevalence/Impact | Primary Screening Contexts |
|---|---|---|---|
| Workflow Integration | Manual, paper-based processes | Common in breast imaging centers; creates inefficiency & tracking errors [54] | Mammography Workflow |
| Siloed data systems (EMR, RIS, PACS) | Requires double data entry; disrupts care continuity [54] | Multi-modality Screening | |
| Lack of automated MQSA reporting | Drains staff time; complex data difficult to understand [54] | Mammography Quality Reporting | |
| Data Complexity | Unstructured data in EHRs | >80% of healthcare data is unstructured, requiring significant preprocessing [55] | Multi-Cancer Screening Data |
| Class imbalance in medical datasets | Biases ML algorithms; misclassifies rare cancer cases [56] | AI-Enhanced Diagnostics | |
| Limited data generalizability | AI algorithms show inconsistent performance across diverse populations [57] | AI-Enhanced Mammography | |
| Provider Engagement | Lack of provider recommendation | Strongest modifiable factor; significantly lowers screening odds (e.g., OR=0.01 for Latinas) [58] | Breast & Cervical Cancer |
| Gaps in shared decision-making knowledge | Only 50% aware of reimbursement for SDM visits in lung cancer screening [59] | Lung Cancer Screening | |
| Insufficient training resources | 67% need eligibility guidance; 42% require cessation training [59] | Safety-Net Screening Programs |
Experimental Protocols for Pitfall Assessment
Protocol 1: Workflow Integration Barrier Analysis
Objective: To quantify time-motion and efficiency losses in existing screening audit workflows.
Methodology:
- Process Mapping: Conduct direct observation to document each step from screening order to result communication and audit data capture. Use time-motion tracking for each step [54].
- System Interoperability Assessment: Catalog all software systems (EMR, RIS, PACS, registries) and identify all manual data transfer points requiring double entry [54].
- Stakeholder Feedback Sessions: Conduct structured interviews with radiologists, technologists, and navigators to identify pain points using scenarios (e.g., high-risk patient referral, MQSA audit preparation) [54].
Data Analysis: Calculate total process time, proportion of time spent on manual tasks, and frequency of workflow exceptions. Identify bottlenecks where >20% of total process time is consumed.
Protocol 2: Data Complexity and Quality Assessment
Objective: To evaluate structured and unstructured data quality for audit and feedback systems.
Methodology:
- Data Source Inventory: Create a data dictionary for all structured fields and catalog all unstructured data sources (clinician notes, pathology reports, patient histories) [55].
- Class Imbalance Quantification: For AI model development, calculate Imbalance Ratio (IR) where IR = Nmaj/Nmin. Flag datasets with IR > 9:1 as high-risk for biased models [56].
- Feature Extraction Validation: For unstructured data, apply NLP techniques (named entity recognition, relation extraction) to a 100-document sample. Calculate precision/recall against manual annotation [55].
Data Analysis: Report data completeness, class distribution metrics, and NLP extraction accuracy. Data quality thresholds should be set a priori (e.g., >95% completeness for critical fields).
Protocol 3: Provider Engagement Measurement
Objective: To assess provider knowledge, attitudes, and readiness to participate in screening audit and feedback.
Methodology:
- Cross-Sectional Survey: Adapt validated instruments to measure familiarity with guidelines, perceived barriers, and self-efficacy. Include case-based questions [59].
- Communication Content Analysis: Apply standardized coding schemes to audio-recorded provider-patient screening discussions. Code for discussion elements: risk benefit, patient preference, shared decision-making [58].
- Feedback Engagement Tracking: Monitor provider access rates to audit reports through electronic tracking. Correlate access with screening quality metrics [59].
Data Analysis: Calculate composite knowledge scores, code communication quality, and perform multivariate analysis to identify engagement predictors.
Visualization of Pitfalls and Mitigation Framework
Audit System Pitfalls and Mitigations
The Scientist's Toolkit: Research Reagent Solutions
Table 2: Essential Resources for Cancer Screening Audit & Feedback Research
| Research Tool | Type | Primary Function | Application Context |
|---|---|---|---|
| Consolidated Framework for Implementation Research (CFIR) | Theoretical Framework | Identifies barriers/facilitators across socioecological levels [57] | Implementation Science Studies |
| Structured Data Collection Forms | Methodology Tool | Standardizes variable extraction across multiple studies [57] | Systematic Reviews & Meta-Analyses |
| Natural Language Processing (NLP) | Computational Tool | Extracts information from unstructured clinical text [55] | Unstructured Data Analysis |
| Class Imbalance Handling Methods | Algorithmic Tool | Corrects biased learning from uneven datasets (e.g., SMOTE) [56] | ML Model Development |
| Provider Survey Instruments | Assessment Tool | Measures knowledge, attitudes, and readiness for screening [59] | Provider Engagement Studies |
| Communication Coding Schemes | Analytical Framework | Quantifies content and quality of provider-patient discussions [58] | Shared Decision-Making Research |
| MQSA Audit Software | Compliance Tool | Automates quality reporting and outcome tracking [54] | Mammography Quality Assurance |
| REASSURED Criteria | Evaluation Framework | Assesses POCT devices against modern diagnostic standards [60] | Point-of-Care Test Development |
This application note provides a structured approach to identifying and addressing critical implementation pitfalls in cancer screening audit and feedback systems. The integrated protocols and frameworks enable researchers to systematically evaluate and optimize workflow integration, manage data complexity, and enhance provider engagement—ultimately strengthening cancer screening follow-up and improving early detection outcomes.
Application Notes
Effective audit and feedback (A&F) systems are fundamental to improving cancer screening follow-up, a process critical for achieving positive patient outcomes. Research indicates that up to 30% of women fail to attend recommended immediate follow-up for high-risk mammograms, and delayed follow-up after abnormal mammography decreases survival rates among underserved minority women [61]. Similarly, for colorectal cancer (CRC), patients with an initial positive stool-based test who do not receive a follow-up colonoscopy are twice as likely to die as those who do [62]. These gaps highlight systemic failures that robust A&F systems aim to address. However, the design, implementation, and maintenance of these complex systems are hampered by a significant "talent crunch"—a shortage of skilled professionals capable of bridging clinical medicine, data management, quality improvement methodology, and systems engineering. This document provides structured application notes and experimental protocols to guide the building of a skilled team capable of executing high-impact A&F research within cancer screening programs.
Foundational Workforce Strategies for Audit and QI Teams
Building a resilient team requires intentional strategies focused on professional development, role definition, and well-being. The high-stakes nature of cancer diagnostics, coupled with the complexity of healthcare data, demands a supported and multidisciplinary workforce.
Table 1: Key Strategies for Building and Sustaining an Audit and QI Team
| Strategy Domain | Implementation Notes | Rationale & Supporting Evidence |
|---|---|---|
| Fostering Team Resiliency | Implement structured mindfulness meditation sessions and psychological first aid training [63]. | Mitigates burnout and stress, which are significant within cancer care teams, thereby preserving institutional knowledge and expertise [63]. |
| Prioritizing Supervisor Communication | Establish a cadence of consistent, structured conversations between team members and their supervisors [64]. | 86% of healthcare workers report that such conversations make them feel valued and supported, which is crucial for retention [64]. |
| Championing Mentorship Programs | Develop formal peer-to-peer mentorship programs, potentially engaging retired healthcare professionals to guide less experienced staff [63]. | Peer mentorship empowers the workforce and is a key tactic for addressing the needs of a growing patient population amidst workforce shortages [63]. |
| Addressing Generational Needs | Tailor communication and benefits. For example, 71% of Gen Z and Millennials value online employer reviews, and over 90% prioritize annual salary increases and paid health insurance [64]. | A one-size-fits-all approach to talent management is ineffective. Recognizing generational differences is key to attracting and retaining a diverse team [64]. |
Quantitative Benchmarks for Audit and Feedback System Performance
A skilled team must operate against clear, evidence-based performance benchmarks. The move towards standardized measurement, as seen in modern healthcare quality sets, provides critical data points for goal setting.
Table 2: Key Quantitative Benchmarks in Cancer Screening Follow-Up
| Cancer Type | Performance Measure | Benchmark Data & Gaps | Source / Context |
|---|---|---|---|
| Breast Cancer | Follow-up after abnormal assessment | Failure to follow-up rate: ~30% [61]. | New HEDIS Measure (MY 2025) [61]. |
| Colorectal Cancer | Follow-up colonoscopy after abnormal stool test | Follow-up rates vary widely: 24% to 75% [62]. | New HEDIS Measure in development [62]. |
| Colorectal Cancer | Overall screening adherence | Screening rates: Commercial (56%), Medicare (64%), Medicaid (39%) [62]. | HEDIS MY 2023 data [62]. |
Experimental Protocols
Protocol 1: Implementing a Clinical Decision Support (CDS) and Audit Tool for Abnormal Result Follow-Up
This protocol is adapted from a pragmatic cluster-randomized trial evaluating the "Future Health Today" (FHT) tool, designed to improve follow-up of abnormal blood tests linked to cancer risk [65].
Objective
To evaluate the effectiveness and implementation of an integrated CDS and audit tool in increasing guideline-concordant follow-up for patients with abnormal blood test results indicative of undiagnosed cancer.
Materials and Reagents
Table 3: Research Reagent Solutions for CDS and Audit Systems
| Item Name | Function / Application |
|---|---|
| Electronic Medical Record (EMR) System | Serves as the primary data source and integration platform for patient demographics, laboratory results, and cancer history [65]. |
| Clinical Decision Support (CDS) Algorithm | Applies evidence-based rules to patient data in the EMR to generate patient-specific prompts and recommendations for the clinician [65]. |
| Web-based Audit and Feedback Portal | Provides a population-level view of patients flagged for follow-up, enabling quality improvement monitoring and recall activities [65]. |
| Practice Champion Survey | A qualitative instrument used to identify a lead clinician at each site who will drive local implementation and serve as a liaison to the research team [65]. |
Methodology
Step 1: Tool Development and Integration. Develop the CDS algorithm to flag patients based on specific, evidence-based clinical criteria (e.g., iron-deficiency anemia, raised platelets, raised PSA). Integrate the tool within the existing EMR to allow for seamless data processing and prompt generation [65].
Step 2: Site Recruitment and Practice Champion Identification. Recruit general practices or oncology clinics to participate. At each site, identify a "Practice Champion" – a clinician or staff member who will lead local implementation and communication [65].
Step 3: Multimodal Training and Support.
- Initial Training: Offer regular, live (e.g., Zoom-based) training sessions on using the CDS and audit tools in the lead-up to and during the initial phase of the trial.
- Ongoing Education: Conduct educational sessions (e.g., Project ECHO model) on topics like cancer diagnosis and quality improvement.
- Just-in-Time Resources: Provide short training videos and written guides accessible on-demand.
- Dedicated Support: Assign a study coordinator to handle technical queries and provide ongoing practice support [65].
Step 4: Data Collection and Cohort Creation. At the trial's start and at predefined intervals (e.g., 6 months), instruct practices to use the audit tool to generate patient cohorts. These are lists of all patients identified by the algorithm as requiring follow-up for each abnormal test type. This data serves for both intervention and benchmarking [65].
Step 5: Pragmatic Intervention. Practices use the FHT tool as they choose during the trial period. The CDS component activates when a clinician opens a flagged patient's record, displaying a prompt with guideline-based recommendations. The audit tool allows practices to manage their cohorts proactively [65].
Step 6: Process Evaluation. Collect and analyze mixed-methods data to understand implementation success:
- Quantitative: Tool usage logs, engagement with training, rates of cohort creation.
- Qualitative: Semi-structured interviews with clinicians and staff to identify barriers (e.g., time, complexity) and facilitators (e.g., ease of use of CDS, practice support) [65].
The workflow for this protocol, from system setup to evaluation, is outlined in the diagram below:
Protocol 2: Evaluating Organizational Determinants of Screening Participation
This protocol outlines a systematic approach to investigating how organizational factors influence the success of cancer screening programs, providing evidence to guide strategic talent deployment.
Objective
To synthesize current evidence on how organizational determinants influence adherence and participation in organized cancer screening programs for breast, cervical, and colorectal cancers.
Methodology
Step 1: Define Search Strategy per PRISMA Guidelines.
- Databases: Search PubMed/MEDLINE and Scopus.
- Timeframe: Studies published from January 2015 to January 2025.
- Search String: Combine terms related to:
- Cancer Screening: "cancer screening", "mammography", "Pap smear", "colonoscopy", "FOBT".
- Organizational Strategies: "organizational determinants", "personalized invitations", "recall system", "health interventions".
- Outcomes: "screening participation", "compliance", "uptake" [15].
Step 2: Apply Study Selection Criteria.
- Inclusion: Adult populations; organized screening interventions; quantitative participation outcomes; observational or quasi-experimental studies.
- Exclusion: Opportunistic screening; studies without participation outcomes; randomized controlled trials; reviews and commentaries [15].
Step 3: Data Extraction and Quality Assessment.
- Use a standardized form to extract data on study design, setting, intervention details, and participation outcomes.
- Perform quality assessment using the ROBINS-I tool for non-randomized studies [15].
Step 4: Synthesize Evidence. Analyze data to identify successful organizational features. Key themes to extract include:
- The effectiveness of centralized coordination and active invitation systems.
- The impact of community-based outreach and culturally tailored education on underserved groups.
- The role of digital tools (e.g., reinforcement learning-based reminders) and their integration into organizational ecosystems.
- The effect of audit and feedback mechanisms on adherence [15].
The logical flow of the systematic review methodology is depicted below:
The integration of artificial intelligence (AI) and automation into auditing represents a paradigm shift for healthcare systems, particularly within the critical domain of cancer screening follow-up. Effective audit and feedback systems are proven evidence-based interventions that increase cancer screening rates by a median of 13 percentage points [39]. However, traditional methods often rely on manual chart reviews, which are costly, time-intensive, and prone to human error, ultimately hindering the timely identification of patients due for screening. The healthcare sector is now deploying AI at more than twice the rate (2.2x) of the broader economy [66], creating unprecedented opportunities to enhance these systems. This document provides detailed application notes and protocols for leveraging AI to automate and improve the accuracy, efficiency, and impact of audits for cancer screening follow-up, providing researchers and scientists with the methodologies to advance this crucial field of study.
Recent market analyses and industry surveys reveal rapid growth and significant investment in healthcare AI. The table below summarizes key quantitative data that defines the current landscape.
Table 1: AI Adoption and Market Size in Healthcare
| Metric | Value | Context & Source |
|---|---|---|
| Healthcare AI Adoption | 22% of organizations | A 7x increase over 2024, led by health systems (27% adoption) [66]. |
| Overall Enterprise AI Adoption | 9% of companies | Highlights healthcare's leading role in AI implementation [66]. |
| Healthcare AI Spending | $1.4 Billion | Nearly tripled from the previous year [66]. |
| AI in Healthcare Audits Market CAGR (2025-2034) | 9.8% | Predicted growth rate, reflecting expanding adoption [67]. |
| AI Impact on Chart Audit Costs | Reduce by 90% | Automated methods vs. manual record review [39]. |
The distribution of AI spending is heavily concentrated in areas that address acute operational pain points. The table below breaks down the flow of AI investment within healthcare provider organizations.
Table 2: Breakdown of Healthcare Provider AI Spend [66]
| Spending Category | Estimated Spend | Primary Driver |
|---|---|---|
| Total Healthcare AI Spend | $1.4 billion | |
| Health Systems Share | $1.0 billion (75%) | Thin margins, high staffing costs, and labor shortages. |
| Ambient Clinical Documentation | $600 million | Addresses physician burnout by automating note-taking. |
| Coding & Billing Automation | $450 million | Recovers revenue lost to coding errors and claim denials. |
AI Application Notes for Audit & Feedback Systems
Within the framework of audit and feedback for cancer screening, AI applications can be categorized by their technological maturity and specific function. Research indicates that while "simple AI" is widely used, "complex AI" tools are still in development phases, facing challenges related to transparency, explainability, and data privacy [68].
Core AI Applications
- Pre-Billing and Recovery Audits: AI is transforming pre-billing audits by automatically analyzing claims for potential errors, coding compliance, and medical necessity before submission. This proactive risk mitigation saves both time and money by ensuring accurate reimbursements [67]. Similarly, recovery audits use AI to retrospectively identify sources of revenue loss, directly boosting cash flow and profits [67].
- Automated Provider Performance Assessment: AI algorithms can automatically analyze Electronic Health Record (EHR) data to assess provider performance on key metrics, such as the percentage of their age-eligible patients who are up-to-date with recommended cancer screenings [39]. This automates the creation of the "report cards" central to the feedback process.
- Predictive Analytics for Risk Identification: AI-driven predictive models can analyze patient data to identify those at highest risk for not completing screenings or those with potential audit risks, allowing healthcare organizations to prioritize outreach and resource allocation [67].
- Robotic Process Automation (RPA) for Administrative Workflows: RPA is used to automate repetitive, rule-based administrative tasks. In the context of audits, this can include automated data extraction from various documents and systems, which is a widely adopted "simple AI" technology [68].
Integration with Evidence-Based Interventions
AI does not operate in a vacuum; it amplifies the impact of established evidence-based interventions (EBIs) for increasing cancer screening rates [69]. For instance:
- AI-Powered Patient Reminders: An AI system can identify patients due for screening and automatically trigger personalized reminders via mail, email, or patient portal messages.
- Enhanced Patient Navigation: By predicting which patients face the most significant barriers (e.g., transportation, language, fear), AI can help direct limited patient navigation resources more effectively [69].
- Dynamic Provider Reminders: Instead of generic prompts, AI can generate intelligent provider reminders within the EHR that are tailored to a specific patient's profile and calculated risk.
Experimental Protocols for AI-Enhanced Audit & Feedback
This section outlines a detailed protocol for implementing and studying an AI-enhanced audit and feedback system for colorectal cancer screening, based on guidance from the CDC and the American Cancer Society [39] [70].
Protocol: Implementation of an AI-Driven Feedback Loop
Objective: To automate the assessment of provider performance and delivery of feedback to increase colorectal cancer screening rates in a primary care practice.
Background: Provider assessment and feedback is an evidence-based intervention with a median increase of 13 percentage points in completed cancer screenings [39]. AI automation can make this process more efficient and sustainable.
Materials & Reagents: Table 3: Research Reagent Solutions for AI Audit Implementation
| Item / Solution | Function in the Protocol |
|---|---|
| Electronic Health Record (EHR) System | Primary data source for patient records, provider assignments, and screening status. |
| AI-Powered Data Analytics Platform | Automates data extraction, calculates performance metrics, and generates feedback reports. |
| Clinical Data Warehouse | Consolidated, cleaned data repository for analysis, improving AI model accuracy. |
| BI Visualization Tool (e.g., Tableau, Ajelix BI) | Creates intuitive dashboards and charts for presenting feedback to providers [71]. |
| Secure Communication System | Delivers feedback reports to providers confidentially via email or portal. |
Methodology:
- Define Metrics and Data Sources:
- Convene a multidisciplinary guideline development panel, inclusive of a patient advocate, to define objectives and metrics, following the American Cancer Society's rigorous methodology [70].
- Select key performance indicators (KPIs): e.g.,
(Number of patients screened / Number of patients due for screening) * 100. - Identify specific data sources within the EHR (e.g., CPT codes for colonoscopy, results from FIT tests) and ensure data quality.
Develop and Train the AI Assessment Model:
- Build or configure an AI algorithm to automatically extract data and calculate the selected KPIs for each provider.
- Test the algorithm on a subset of data to assess its accuracy and utility in correctly identifying screened patients.
Implement the Automated Feedback Mechanism:
- Format: Develop a feedback dashboard using data visualization best practices. Use sequential color palettes for numeric data and qualitative palettes for categorical data [72]. Prioritize clarity and avoid "chartjunk" [72].
- Delivery: Determine the feedback frequency (e.g., monthly) and method (e.g., automated email with a PDF report or a link to a live dashboard).
- Presentation: Decide whether to present results individually or in a group setting. Comparative feedback (e.g., comparing individual performance to the practice average) can motivate providers through friendly competition [39].
Execute and Monitor the Intervention:
- The system automatically generates and distributes feedback reports at the scheduled intervals.
- Track outputs (e.g., number of feedback reports distributed) and outcomes (e.g., changes in screening rates over time).
- Conduct regular evaluations and be prepared to revise the process with new evidence, as is standard for guideline development [70].
The workflow for this protocol is visualized in the following diagram:
Protocol: Evaluating AI System Efficacy in a Clinical Setting
Objective: To compare the effectiveness and cost-efficiency of an AI-driven audit and feedback system against traditional manual chart audits.
Study Design: Randomized controlled trial or a pre-post implementation study across multiple clinic sites.
Methodology:
- Baseline Measurement: Conduct a manual chart audit across all participating sites to establish baseline colorectal cancer screening rates and record the personnel time and cost required.
- Intervention: Implement the AI-driven audit and feedback system as described in Protocol 4.1 in the intervention group only. The control group continues with usual care (which may include manual audits).
- Data Collection:
- Primary Outcome: Change in clinic-level colorectal cancer screening rates over a 12-month period, measured using standard metrics like the Uniform Data System (UDS) [39].
- Secondary Outcomes: Time from audit cycle initiation to feedback delivery; cost per audit; qualitative feedback from providers on the usefulness and clarity of the AI-generated reports.
- Analysis: Compare the change in screening rates from baseline to follow-up between the intervention and control groups. Perform a cost-benefit analysis comparing the implementation cost of the AI system to the cost of manual audits and the financial impact of increased screening revenue.
Visualization and Workflow Diagrams
Effective data presentation is critical for the feedback component of the audit cycle. The following diagram outlines the high-level logical flow of a comprehensive AI-enhanced cancer screening follow-up system, integrating multiple evidence-based interventions.
Application Note: Core Principles of Effective Feedback Presentation
This document provides a detailed framework for the presentation of audit and feedback data within cancer screening follow-up research. Its objective is to equip researchers and scientists with methodologies to clearly communicate complex data and secure stakeholder buy-in for quality improvement initiatives.
Effective presentations are crucial in strategy development as they clarify the vision, facilitate informed decision-making, and foster collaboration [73]. To achieve this, presenting feedback data must transcend simple data reporting; it requires a structured narrative that engages stakeholders both logically and emotionally. Compelling storytelling is vital for establishing trust and influencing decision-making [73]. The following protocols outline the steps for constructing such presentations, from data aggregation to the final delivery, ensuring the feedback is not just seen, but understood and acted upon.
Protocol for constructing a feedback presentation narrative
Reagents and Materials
- Data Aggregation Tool: (e.g., SQL database, REDCap) Function: Centralizes raw audit data from various sources (EHR, lab systems, registries).
- Statistical Analysis Software: (e.g., R, Python with Pandas, Stata) Function: Calculates key performance indicators (KPIs) and performs significance testing.
- Data Visualization Library: (e.g., ggplot2, Matplotlib, Tableau) Function: Generates standardized charts and graphs that adhere to accessibility guidelines.
- Presentation Software: (e.g., Microsoft PowerPoint, Google Slides) Function: The final assembly platform for the narrative, data visuals, and stakeholder call-to-action.
Procedure
- Define the Strategic Objective (Why): Begin the narrative by clearly stating the primary clinical problem. For example, "Our objective is to reduce the rate of lost-to-follow-up for positive colorectal cancer screens from 18% to 5% within 12 months." This frames the entire presentation [74].
- Synthesize Baseline Data (What): Present the current state using 2-3 key metrics. Use a clear visualization, such as a bar chart comparing follow-up completion rates across different clinics or patient demographics. This establishes the baseline and identifies disparities.
- Articulate the Root Cause (How): Transition from the "what" to the "how" by presenting data on underlying causes. This could involve a flowchart analyzing the patient follow-up pathway or survey data on patient-reported barriers. This demonstrates a deep understanding of the problem [74].
- Propose the Evidence-Based Intervention (Solution): Introduce the proposed solution, explicitly linking its features to the root causes identified. For instance, "Implementing an automated patient navigation system will address the barrier of appointment scheduling complexity identified in our survey."
- Issue the Call-to-Action (Now): Conclude with a direct, unambiguous request for buy-in, specifying the needed resources (e.g., "We request approval to initiate a pilot program for the patient navigation platform in the Gastroenterology department").
Visualization of Narrative Structure
The logical flow of the presentation narrative can be visualized as a pathway from problem identification to solution.
Application Note: Securing Stakeholder Buy-In
Gaining commitment from decision-makers requires translating the feedback data into a compelling business case that aligns with broader organizational goals. Executives prioritize investments that drive productivity, realize cost savings, or enhance competitive position [74]. Therefore, the value proposition of an audit and feedback intervention must be framed in these terms.
Anticipating and addressing executive concerns is a critical component of this process. Common objections include questions about return on investment (ROI), implementation complexity, and potential disruption to clinical workflows [74] [75]. A robust business case, supported by pilot data and a clear implementation plan, is essential for providing reassurance and evidence to overcome these concerns.
Protocol for building a business case and securing buy-in
Reagents and Materials
- Financial Modeling Spreadsheet: (e.g., Microsoft Excel) Function: Projects ROI, cost savings from improved efficiency, and cost-avoidance from reduced patient attrition.
- Stakeholder Analysis Matrix: Function: Identifies key influencers, decision-makers, and potential champions across the organization.
- Pilot Project Protocol: Function: A miniaturized study design to demonstrate efficacy and feasibility on a small, low-risk scale.
- Vendor Comparison Table: Function: A structured format to evaluate potential solutions based on cost, features, and integration capabilities [75].
Procedure
- Align with Organizational Priorities: Explicitly connect the intervention to high-level strategic goals, such as improving cancer care quality metrics, enhancing patient satisfaction scores, or reducing long-term treatment costs through early intervention [74]. For example, state, "This initiative directly supports the organizational strategic pillar of 'Excellence in Cancer Care'."
- Quantify the Tangible Benefits: Build a financial model that projects ROI. Calculate potential cost savings from factors such as:
- Increased Revenue: From a higher volume of completed diagnostic procedures.
- Cost Avoidance: Reduced costs associated with re-contacting lost patients and managing more advanced cancer cases.
- Productivity Gains: Time saved by clinical staff through streamlined workflows.
- Identify and Involve a Coach: Recruit a respected and influential leader within the organization who can advocate for the proposal, provide insights into the decision-making process, and help navigate organizational politics [75].
- Propose a Pilot Program: To mitigate perceived risk, propose a controlled implementation within a single department or clinic. A pilot program demonstrates effectiveness on a small scale and generates internal data to build the case for a wider rollout [74].
- Prepare for Objections: Anticipate specific questions and prepare data-driven responses [74] [75]. For example, if challenged on cost, respond with: "While there is an initial investment, our model shows that reducing lost-to-follow-up by 10% will lead to net savings within 18 months by avoiding the costs of managing later-stage disease."
Quantitative Data for Business Case
The following table summarizes key quantitative metrics that can be leveraged to build a compelling business case.
Table 1: Key Metrics for Stakeholder Buy-In
| Metric Category | Specific Metric | Data Source | Strategic Impact |
|---|---|---|---|
| Clinical Outcome | Lost-to-Follow-Up Rate | Audit Database | Primary indicator of system performance and patient safety risk. |
| Operational Efficiency | Staff Time Spent on Follow-Up Tasks | Time-Motion Study, EHR Logs | Identifies opportunity for cost savings and workflow improvement. |
| Financial Impact | Cost per Patient Navigated | Pilot Program Budget | Provides a realistic estimate for full-scale implementation. |
| Return on Investment | Projected Savings from Increased Procedure Volume | Financial Model | Directly addresses executive concerns about budget and resource allocation [74]. |
Application Note: Accessible Data Visualization
The effectiveness of a feedback presentation is contingent on its clarity and universal readability. Adhering to established design principles ensures that data is perceived accurately by all stakeholders, including those with color vision deficiencies [76]. A well-chosen color palette can also evoke specific emotions and underline goals, which is essential for connecting with the audience [77].
The Web Content Accessibility Guidelines (WCAG) provide a definitive framework for color contrast. For standard body text, a minimum contrast ratio of 4.5:1 against the background is required (AA rating), while larger text requires a ratio of at least 3:1 [78] [79]. These rules also extend to non-text elements, such as icons and graphs, which require a contrast ratio of at least 3:1 [79].
Protocol for creating accessible visualizations
Reagents and Materials
- WCAG-Compliant Color Palette: A predefined set of colors that meet contrast ratios. Function: Ensures all visual outputs are accessible.
- Color Contrast Checker: (e.g., WebAIM's Color Contrast Checker, Firefox Developer Tools) Function: Verifies that color pairings meet WCAG standards [78].
- Perceptually Uniform Color Map: (e.g., Scientific colour maps like 'batlow') Function: Represents data fairly without visual distortion and is readable by those with color vision deficiencies [76].
Procedure
- Select a Base Color Palette: Begin with a palette that offers inherent contrast. The following table provides an example of WCAG-compliant colors.
- Check Contrast Ratios: Before finalizing any visual, use a contrast checker to validate all color pairings, especially for text-on-background and data series in graphs [78].
- Use Texture and Pattern: For line graphs or stacked bars, supplement color differentiation with textures (e.g., dashed lines) or patterns to ensure readability in black-and-white printouts.
- Label Directly: Avoid relying on color-alone in legends. Place data labels directly on or near graph elements to provide redundant coding of information.
- Test for Accessibility: Use tools to simulate how visuals appear to users with various forms of color vision deficiency (e.g., CVD simulators).
Accessible Color Palette and Specifications
The table below details a color palette that meets WCAG AA standards against a white background, suitable for scientific and clinical presentations.
Table 2: Accessible Color Palette for Data Visualization
| Color Name | HEX Code | RGB Code | Use Case | Contrast Ratio (vs. White) |
|---|---|---|---|---|
| Primary Blue | #4285F4 | rgb(66, 133, 244) | Primary data series, key metrics | 4.5:1 (Meets AA) |
| Alert Red | #EA4335 | rgb(234, 67, 53) | Highlighting deficits, critical issues | 4.3:1 (Meets AA) |
| Accent Yellow | #FBBC05 | rgb(251, 188, 5) | Secondary data series, warnings | 4.5:1 (Meets AA) |
| Success Green | #34A853 | rgb(52, 168, 83) | Positive trends, target achievement | 4.5:1 (Meets AA) |
| Dark Gray | #5F6368 | rgb(95, 99, 104) | Body text, axes, labels | 7.1:1 (Exceeds AA) |
Visualization of Accessible Workflow
The process of creating an accessible figure involves specific checks at multiple stages.
Application Note: A&F in Cancer Screening Programs
Audit and Feedback (A&F), defined as the structured retrospective assessment of clinical performance against standards followed by the dissemination of findings to practitioners, is a critical intervention for bridging the gap between evidence-based cancer screening guidelines and real-world practice. In the context of cancer screening follow-up, suboptimal adherence to recommended diagnostic evaluations after an abnormal result presents a significant barrier to reducing cancer-related mortality [18]. The multilevel Follow-up of Cancer Screening (mFOCUS) trial exemplifies a structured approach, highlighting that barriers to timely follow-up exist at the patient, provider, care team, and health system levels [18]. Integrating A&F into Continuous Quality Improvement (CQI) programs provides a mechanism for systematically identifying and addressing these barriers, transforming static data into a dynamic driver for performance enhancement and ensuring the long-term sustainability of screening initiatives. Evidence from a systematic review of organizational determinants indicates that such integrated, data-informed frameworks are essential for enhancing screening participation and reducing disparities [15].
Key Quantitative Evidence and Outcomes
The effectiveness of A&F and related interventions is supported by quantitative evidence from real-world implementations and systematic reviews. The following table summarizes key outcome data.
Table 1: Quantitative Effectiveness of Interventions to Improve Cancer Screening and Follow-up
| Intervention / Component | Cancer Type | Key Outcome Metric | Reported Effect | Source / Context |
|---|---|---|---|---|
| Provider Reminder Systems | Breast, Cervical, Colorectal | Screening Completion | Median increase of 7.2 percentage points for all tests [80] | Systematic Review |
| Provider Reminders (Mammography) | Breast | Cost per Additional Screening | $75 (after one reminder); $118 (if additional reminders) [80] | Economic Assessment |
| Provider Reminders (Pap Test) | Cervical | Cost per Additional Screening | <$20 (computer-printed message, tagged files); >$60 (memorandum to provider) [80] | Economic Assessment |
| Audit and Feedback Mechanisms | Breast, Cervical, Colorectal | Screening Adherence | Modest improvement, especially when aligned with quality improvement initiatives [15] | Systematic Review of Organizational Strategies |
Sustainability Framework within CQI
Integrating A&F into CQI programs moves beyond one-off audits, creating a self-reinforcing cycle of performance measurement, feedback, action, and re-measurement. This integration is vital for countering the observed effect that provider reminders can diminish over time [80]. Sustainable A&F systems are characterized by their ability to be maintained, integrated into routine workflows, and consistently produce benefits. A systematic review of organizational strategies confirms that combining structural standardization with community engagement and digital accessibility offers the greatest promise for lasting impact [15]. Key strategies for strengthening performance and sustainability include:
- Periodic System Enhancement: To maintain effect, A&F systems require periodic adjustment. This includes disabling providers' ability to turn off EHR reminders and conducting training refreshers for clinic staff [80].
- Workflow Automation: Programming the Electronic Health Record (EHR) system to automatically flag patients due for screening, consistent with guidelines, reduces manual effort and improves reliability [80].
- Multi-component Strategies: A&F is most effective when coupled with other evidence-based approaches, such as patient navigation and community outreach, to create a robust safety net for patients who do not complete recommended screening [80] [18].
- Performance Benchmarking and Incentivization: Inspiring competition among clinics or providers using performance monitoring metrics can incentivize appropriate recommendation practices [80].
Experimental Protocols
Protocol 1: Implementing a Multilevel A&F System for Screening Follow-up
This protocol is adapted from the design of the mFOCUS pragmatic cluster randomized controlled trial [18].
1. Objective: To implement and evaluate a multilevel A&F intervention to improve the follow-up of abnormal breast, cervical, colorectal, and lung cancer screening tests within a defined patient population.
2. Materials and Reagents: Table 2: Essential Research and Implementation Toolkit
| Item / Tool | Function / Specification | Implementation Example |
|---|---|---|
| Electronic Health Record (EHR) System | Primary data source for identifying abnormal screens, due dates, and patient demographics. Requires ability to configure reminders and reports. | Epic EHR system [18]. |
| Patient Registry or Database | Tracks patients' screening status, follow-up deadlines, and intervention touchpoints across the care continuum. | Computerized patient registry [80]. |
| Health Information Technology (IT) Infrastructure | Supports the integration of reminder systems, data extraction for audit, and secure communication channels. | Internal IT department or external consultants [80]. |
| Audit and Feedback Reporting Software | Generates performance reports for clinics and providers, summarizing follow-up completion rates. | Custom-built or commercial analytics platforms. |
| Patient Navigation Protocols | Structured guidelines for navigators to assist patients in overcoming barriers to care (e.g., transportation, scheduling). | Protocols for screening and referral to address social barriers [18]. |
3. Methodology:
- 2.1.1 Study Design and Randomization: A cluster randomized design is employed, with primary care sites as the unit of randomization. Practices are stratified by factors such as size and patient socioeconomic status before being randomly assigned to one of four study arms [18]:
- Arm 1: Standard Care. Existing follow-up procedures with no additional intervention.
- Arm 2: Visit-Based EHR Reminders. Prompts that appear in a patient’s EHR when accessed by a provider or patient, indicating overdue follow-up [18].
- Arm 3: Arm 2 + Population Health Outreach. Augments visit-based reminders with proactive outreach (e.g., letters, calls) from a population health team [18].
- Arm 4: Arm 3 + Patient Navigation. Adds patient navigation with systematic screening for and referral to address social determinants of health [18].
- 2.1.2 Patient Eligibility and Identification: Eligible patients are adults overdue for follow-up of an abnormal screening test for breast, cervical, colorectal, or lung cancer. Overdue status is determined by clinical guidelines, allowing a grace period (e.g., 2-6 months) after the recommended follow-up date [18].
- 2.1.3 Intervention Workflow: The following diagram illustrates the core logic of the multilevel intervention, particularly for Arms 3 and 4.
- 2.1.4 Data Collection and Outcome Measures:
- Primary Outcome: The proportion of patients who receive appropriate follow-up within 120 days of becoming eligible for the trial [18].
- Secondary Outcomes: Measures of the patient and provider experience, and fidelity of intervention delivery (e.g., reminder acknowledgment rates, navigation contacts completed).
- 2.1.5 Audit and Feedback Cycle: Performance data on follow-up completion rates are aggregated at the clinic and provider level. These data are fed back to clinics quarterly through structured reports and facilitated discussions to identify root causes of failures and develop improvement plans.
Protocol 2: Implementing and Sustaining a Provider Reminder System
This protocol provides a detailed guide for establishing a foundational provider reminder system, a core component of A&F and CQI [80].
1. Objective: To create, implement, and sustain a system that prompts healthcare providers to recommend cancer screening to patients who are due or overdue.
2. Materials: EHR system, predefined cancer screening guidelines, clinic staff.
3. Methodology:
- 2.2.1 Identify Patients Due for Screening: Configure the EHR or patient registry to automatically identify the priority population based on age, sex, and time since last screening, consistent with guidelines [80].
- 2.2.2 Create the Reminder System: Determine the delivery mechanism (e.g., electronic flag, sticker in paper chart). Design the reminder to be clear and unambiguous, explicitly stating the patient is due for cancer screening [80].
- 2.2.3 Integrate into Clinic Workflow: Assign responsibility for managing the reminder system (e.g., administrative staff to flag charts). Train all involved staff on the process, screening guidelines, and the system's operation. Crucially, consider and manage the ability of providers to turn off reminders [80].
- 2.2.4 Track Outcomes and Refine: Establish methods to track key process and outcome measures, such as the proportion of patients with a screening test ordered and the proportion completing screening [80]. Use this data in CQI meetings to refine the reminder system.
The following diagram outlines the core process flow of a provider reminder system and its integration with a CQI cycle.
Pragmatic trials are essential for evaluating the effectiveness of interventions in real-world clinical settings, moving beyond the controlled conditions of explanatory trials. Within the specific context of improving cancer screening follow-up, audit and feedback (A&F) systems have emerged as a cornerstone intervention. These systems assess provider performance in delivering or offering evidence-based care and present the results back to them to motivate improvement [39]. The implementation of such systems, however, is often fraught with challenges that can compromise their success. This article analyzes the implementation gaps commonly encountered in pragmatic trials, drawing on recent studies to provide researchers and drug development professionals with actionable insights and structured methodologies for robust trial design and execution.
Quantitative Analysis of Implementation Determinants
Systematic reviews reveal that the success of interventions like A&F is influenced by specific organizational determinants. A 2025 review of 26 studies on cancer screening programs identified key features that significantly impact participation and adherence [15].
Table 1: Organizational Determinants of Successful Cancer Screening Program Implementation
| Organizational Determinant | Reported Effect on Participation/Adherence | Exemplary Intervention Components |
|---|---|---|
| Centralized Coordination | Increases structured program delivery and follow-up | Active invitation systems with routine recall mechanisms |
| Culturally Tailored Education | Particularly effective in increasing uptake among underserved populations | Community-based outreach and culturally adapted health materials |
| Integrated Digital Tools | Higher effectiveness when part of a broader organizational ecosystem | Reinforcement learning-based reminders and mobile health applications |
| Audit and Feedback Mechanisms | Modest improvement in adherence, especially when aligned with quality improvement initiatives | Provider performance reports and benchmarked feedback sessions |
| Quality Assurance Systems | Improves consistency and reliability of screening processes | Integrated quality assurance and follow-up mechanisms |
The data indicates that interventions combining structural standardization with community engagement and digital accessibility offer the greatest promise for enhancing screening participation and reducing disparities [15].
Qualitative Insights into Implementation Barriers and Facilitators
Beyond quantitative metrics, qualitative research provides critical depth, uncovering the "why" behind implementation outcomes. Analyses of pragmatic trials consistently highlight recurring themes across multiple domains.
Table 2: Common Barriers and Facilitators in Pragmatic Trials for Cancer Care
| Domain | Barriers | Facilitators |
|---|---|---|
| Technology & Tools | • High complexity of EMR-driven tools and auditing functions [81] [65]• Inability to accurately identify eligible patients via EMR [81]• Alert fatigue from clinical decision support (CDS) systems [82] | • CDS with active, point-of-care delivery [65]• Tools perceived as easy to use and acceptable by clinicians [65] |
| Workflow & Resources | • Significant time burden on clinic staff [81]• Competition with other clinical priorities [81]• Inadequate time and resources in busy practice settings [65] | • Integration into existing clinical workflows [82]• Dedicated implementation support, such as a study coordinator [65] |
| Organizational Context | • Leadership and staff turnover [81]• Perceived incompatibility with organizational culture or patient population [81]• Low relevance for practices with small eligible patient cohorts [65] | • Leadership buy-in and support [81]• Tension for change within the organization [82]• Nomination of a practice champion [65] |
| Patient Factors | • Low patient awareness of cancer screening [81]• Logistical challenges (e.g., transportation) and cost, particularly for colonoscopy follow-up [81] [83]• Psychological fears and anxieties about cancer diagnosis [83] | • Reduced patient costs for screening [81]• Mailed fecal testing programs to improve access [81]• Patient-facing decision aids and educational materials [82] |
A study of cancer prevention CDS found that pre-implementation assessment of these barriers and facilitators, using frameworks like the Consolidated Framework for Implementation Research (CFIR), is crucial for planning and can inform specialized training, pilot testing, and tailored implementation plans [82].
Experimental Protocols for Implementation Research
To systematically study implementation processes, researchers require robust methodological protocols. The following outlines two key approaches.
Protocol for a Multi-Site Process Evaluation
This protocol is designed to understand the implementation of a complex intervention, such as a clinical decision support tool, across multiple primary care practices [65].
1. Objective: To understand implementation gaps, explore differences between general practices, and provide context for trial effectiveness outcomes. 2. Study Population: All intervention-arm practices in a pragmatic cluster-randomized trial (e.g., 21 general practices). 3. Data Collection: - Semi-structured Interviews: Conduct with key stakeholders (e.g., general practitioners, practice nurses, clinic managers) guided by implementation frameworks like CFIR. Interviews should explore perceptions of the intervention, workflow integration, and perceived barriers/facilitators [65] [82]. - Technical Engagement Logs: Quantitatively track the usage of different intervention components (e.g., frequency of CDS prompt views, audit tool logins). - Usability Surveys: Administer standardized surveys (e.g., System Usability Scale) and custom questionnaires post-training to assess the user experience. 4. Data Analysis: - Qualitative Analysis: Transcribe interviews and analyze using thematic analysis, coding data into pre-defined and emergent themes related to implementation [81]. - Quantitative Analysis: Analyze engagement and survey data descriptively. Correlate usage metrics with practice characteristics and trial outcomes. - Integration: Merge qualitative and quantitative findings to build a comprehensive explanation of what worked, for whom, and under what circumstances.
Protocol for a Matrixed Multiple Case Study Analysis
This approach capitalizes on heterogeneity across sites to understand variations in implementation [84].
1. Objective: To compare variations in implementation processes and influences across multiple sites in an implementation trial. 2. Case Definition: Each participating site (e.g., a medical center or clinic) is treated as a single case. 3. Data Collection: Gather both quantitative (fidelity measures, outcome data) and qualitative (interview, observational) data from each case. 4. Analysis: - Within-Case Analysis: Construct a detailed narrative for each site, describing the implementation context, process, and outcomes. - Cross-Case Synthesis: Systematically compare and contrast the cases using a structured matrix. The matrix rows are the cases (sites), and the columns are the implementation factors (e.g., leadership engagement, workflow integration, resource availability) and outcomes (e.g., fidelity, screening rates). This visual representation allows for the identification of patterns—for instance, how high leadership engagement across different sites consistently correlates with better implementation fidelity.
The following workflow diagram illustrates the sequential and iterative stages of this protocol.
The Scientist's Toolkit: Research Reagent Solutions
Successful execution of implementation research requires a suite of methodological "reagents." The following table details essential tools and their functions.
Table 3: Essential Tools for Implementation Research in Pragmatic Trials
| Tool or Framework | Function in Implementation Research |
|---|---|
| Consolidated Framework for Implementation Research (CFIR) [81] [82] | A meta-theoretical framework used to guide systematic assessment of implementation contexts, identifying barriers and facilitators across intervention characteristics, outer/inner settings, and individual roles. |
| Matrixed Multiple Case Study Approach [84] | A systematic mixed-methods evaluation methodology that enables researchers to understand how implementation processes and influences interact with outcomes similarly or differently across multiple sites. |
| Provider Assessment and Feedback Systems [39] | An evidence-based intervention that assesses provider performance in delivering cancer screening and presents feedback to motivate increased screening recommendations and follow-up. |
| Clinical Decision Support (CDS) Tools [65] [82] | EHR-integrated software that provides patient-specific recommendations and prompts at the point of care, assisting providers in adhering to evidence-based guidelines for cancer screening and follow-up. |
| Process Evaluation Framework (MRC) [65] | A framework for evaluating complex interventions by analyzing implementation processes, mechanisms of impact, and contextual factors, providing explanation for trial outcomes. |
| Search Summary Tables (SSTs) [85] | A tool for documenting and evaluating the effectiveness of literature search strategies in evidence syntheses, ensuring transparency and comprehensiveness in systematic reviews and evidence gap maps. |
Workflow Diagram: Implementing an Audit & Feedback System
The following diagram outlines the logical workflow for implementing a provider assessment and feedback system in a clinical setting, based on guidelines from the Centers for Disease Control and Prevention (CDC) [39].
Evaluating Impact: Evidence, Comparative Effectiveness, and Emerging Measures
Audit and feedback (A&F) systems are integral to enhancing the quality and effectiveness of cancer screening programs. This application note delineates a structured methodology for implementing A&F cycles aimed at increasing screening completion and follow-up care adherence. We present a quantitative framework of key performance indicators (KPIs), detailed experimental protocols for evaluating A&F interventions, and visual tools to guide researchers and public health professionals in optimizing screening pathways. The protocols are framed within the context of organized screening for breast, cervical, and colorectal cancers, with a focus on achieving health equity through data-driven program management.
Cancer screening programs are a cornerstone of secondary prevention, yet their impact is limited by suboptimal participation and adherence to follow-up care. Audit and feedback is a systematic process of reviewing performance data against predefined standards and delivering comparative summaries to healthcare providers and program managers to prompt quality improvement. Evidence synthesized from recent systematic reviews confirms that organizational strategies, including A&F, are critical determinants of screening participation [15]. When integrated within a broader framework of centralized coordination and quality assurance, A&F mechanisms modestly improve adherence and are particularly effective when aligned with specific quality improvement initiatives [15]. This document provides a practical toolkit for developing, implementing, and evaluating such A&F systems.
Core Principles and Quantitative Framework
A successful A&F system for cancer screening is built upon a foundation of carefully selected, equity-focused indicators. A Delphi study involving cancer screening experts established a priority set of 23 indicators covering the entire screening pathway, including harms, barriers, and inequalities [19]. The table below summarizes the highest-priority indicators for assessing screening program performance, which should form the basis of any A&F cycle.
Table 1: High-Priority Performance and Outcome Indicators for Cancer Screening A&F
| Indicator Category | Specific Indicator | Definition and Calculation | Target/Standard |
|---|---|---|---|
| Coverage & Participation | Examination Coverage | Proportion of eligible population screened in a defined period [19] | Program-specific target |
| Screening Index* | Proportion of at-risk individuals successfully screened and informed [86] | >90% | |
| Process Timeliness | Time from Screen to Result Notification | Average time from screening examination to participant receiving results [19] | As short as feasible |
| Effectiveness & Outcomes | Detection Rate | Number of confirmed cancer cases per 1,000 screens [19] | Program-specific benchmark |
| Interval Cancer Rate | Cancer diagnoses in screened population between recommended screenings [19] | Program-specific benchmark | |
| Prevention Index* | Number of women enrolled per affected birth prevented [86] | Lower number indicates higher efficiency | |
| Organizational Metrics | Adherence/Follow-up Rate | Proportion with completed follow-up after positive/abnormal result | >95% |
| Discrepancy Rate | Percentage of results with unverifiable or inconsistent data [87] [88] | Track for process improvement | |
| Equity & Reach | Underserved Population Participation | Screening coverage stratified by demographic groups (e.g., ethnicity, socioeconomic status) [15] | Minimize disparity gaps |
*Indicators adapted from targeted screening programs can be conceptually applied to cancer screening A&F [86].
Experimental Protocols for A&F Implementation
This section provides a detailed, step-by-step protocol for establishing and running an A&F cycle focused on improving screening completion.
Protocol: Baseline Assessment and Data Infrastructure Setup
Objective: To establish a baseline and create the data infrastructure necessary for a continuous A&F cycle.
Materials and Reagents:
- Data Sources: Centralized cancer screening registry, electronic health records (EHR), hospital administration systems, and pathology databases.
- Analytical Software: Statistical computing software (e.g., R, Python, SAS, Stata).
- Reporting Platform: A secure dashboard or reporting tool (e.g., Tableau, Power BI) for data visualization.
Methodology:
- Define Cohort: Identify the target population for a specific screening cycle (e.g., women aged 50-69 for mammography) using registry or census data.
- Extract Baseline Data: Calculate all relevant KPIs from Table 1 for the 12-24 months preceding the intervention. This establishes the pre-A&F performance baseline.
- Stratify Data: Disaggregate all data by relevant dimensions: provider, clinic, geographic region, and sociodemographic factors to identify equity gaps [15].
- Validate Data Quality: Check for completeness, duplicates, and logical errors. Calculate the Discrepancy Rate to assess data integrity [88].
- Configure Dashboard: Develop an A&F dashboard that visualizes performance against targets, highlights trends, and allows for stratification by key dimensions.
Protocol: Cluster-Randomized Trial of A&F Interventions
Objective: To quantitatively evaluate the efficacy of a structured A&F intervention in increasing screening completion rates.
Study Design: Pragmatic, cluster-randomized controlled trial, with clinics or primary care practices as the unit of randomization.
Materials and Reagents:
- Intervention Arm Materials: Personalized feedback reports, benchmarked data summaries, and action-planning templates.
- Control Arm Materials: Standard, aggregate performance reports without benchmarking or personalized guidance.
- Survey Instruments: Validated questionnaires for measuring provider and stakeholder satisfaction [89].
Methodology:
- Recruitment and Randomization:
- Recruit a representative sample of clinics.
- Randomly assign clinics to either the intervention (A&F) arm or the control (standard reporting) arm.
- Intervention Delivery:
- For the intervention arm, schedule a facilitated feedback session with clinic leads. Present their clinic-specific data, benchmarked against regional averages and performance targets. Use the dashboard developed in Protocol 3.1.
- Collaboratively develop an action plan addressing weaknesses (e.g., strategies to improve Examination Coverage in underserved subgroups).
- Control Procedure: Provide the control arm with the standard, high-level program reports issued by the health authority, without clinic-level benchmarking or facilitated review.
- Outcome Measurement:
- Primary Outcome: Change in Examination Coverage from baseline to 12 months post-intervention.
- Secondary Outcomes: Changes in Time from Screen to Result Notification, Follow-up Rate after abnormal results, and Stakeholder Satisfaction scores [89].
- Data Analysis:
- Use intention-to-treat analysis.
- Employ multilevel regression models to account for clustering within clinics, adjusting for baseline performance and patient demographic characteristics.
The logical flow of this A&F cycle, from data collection to improvement, is illustrated below.
The Scientist's Toolkit: Research Reagent Solutions
The following table details key analytical "reagents" and their functions in conducting rigorous A&F research.
Table 2: Essential Reagents and Tools for A&F Research
| Research Reagent / Tool | Function in A&F Experiments |
|---|---|
| Centralized Screening Registry | Primary data source for calculating participant-level coverage, detection, and interval cancer rates; enables longitudinal tracking [19]. |
| Stratified Performance Data | Data disaggregated by clinic, provider, and sociodemographic factors to identify disparities and target interventions effectively [15]. |
| Standardized KPI Definitions | Precisely defined metrics (e.g., Calculation of "Examination Coverage") to ensure consistent measurement and valid benchmarking across sites and time [19]. |
| Statistical Process Control (SPC) | Analytical methods for distinguishing common-cause from special-cause variation in KPI data over time, helping to identify true effects of interventions. |
| Stakeholder Satisfaction Survey | Validated instrument to measure perceptions of the A&F process among providers and staff, which is critical for long-term adoption and success [89]. |
Visualization of A&F Impact Pathways
The effectiveness of A&F is mediated through specific pathways that influence provider and system behavior. The following diagram maps the logical sequence from feedback delivery to ultimate outcomes, highlighting key mediators.
This application note provides a comprehensive, evidence-based framework for employing A&F to quantify and improve success in cancer screening programs. By adopting the structured protocols, prioritized indicators, and visualization tools outlined herein, researchers and public health practitioners can systematically enhance program performance, address critical bottlenecks, and ultimately reduce disparities in cancer screening completion and follow-up care. The continuous A&F cycle ensures that screening programs are not only implemented but are perpetually refined based on robust quantitative data.
Within the broader thesis on improving cancer screening follow-up, this application note provides a critical comparative analysis of implementation strategies. Audit and Feedback (A&F), defined as the summary and provision of clinical performance data to healthcare providers, is a cornerstone intervention for supporting clinical behaviour change [90]. However, its relative effectiveness against other common strategies—such as reminder-only systems and provider education—determines its optimal application in a comprehensive cancer screening programme. This document synthesizes current evidence to guide researchers and scientists in selecting, designing, and evaluating these strategies for maximising follow-up rates after abnormal cancer screening results. The increasing availability of electronic health data has significantly potentiated the use of electronic A&F (e-A&F), which utilizes interactive computer interfaces to provide clinical performance summaries, allowing for more dynamic and exploratory feedback [90].
Comparative Effectiveness of A&F, Education, and Reminders
Direct comparative studies and meta-analyses provide quantitative evidence for the relative performance of different interventions. The data, summarized in the table below, indicate that multi-component interventions often yield the greatest benefit.
Table 1: Comparative Effectiveness of Interventions to Improve Cancer Screening and Follow-up
| Intervention Category | Specific Strategy | Comparative Effect Size & Key Findings | Contextual Notes |
|---|---|---|---|
| Audit & Feedback (A&F) | Performance feedback reports to providers | Modest effect when used alone; highly variable effects due to heterogeneity in design and context [90]. In a direct comparative trial, A&F alone increased screening rates, but adding communication training did not yield further significant improvements in most screening outcomes [2] [91]. | Effectiveness is influenced by feedback characteristics, recipient factors, and targeted clinical behaviour [90] [29]. |
| Provider Education | Communication skills training (e.g., with standardized patients) | Significantly improved provider behaviours: better patient-centered counseling and shared decision-making for colorectal cancer screening compared to A&F alone [2] [91]. Did not translate to a significant increase in actual cancer screening rates versus A&F alone, except for mammography [2] [91]. | Improves communication process metrics but may not be sufficient to change complex patient adherence outcomes. |
| Reminder-Only Systems | Electronic Health Record (EHR) reminders for providers | Minimal impact when used in isolation. One study found EHR reminders alone resulted in 23% follow-up completion, identical to usual care [92]. | Passive reminders are insufficient to address multi-faceted barriers to follow-up. |
| Multi-Component / Combined Interventions | A&F + Education + Patient Outreach | Most effective. A combination of EHR reminders, plus a patient letter, plus a phone call increased follow-up testing completion to 31%, a significant improvement over reminders alone or usual care [92]. Patient navigation combined with other strategies consistently increases screening uptake (Relative Risk = 2.01) [93]. Mailed fecal test outreach doubles screening uptake (Relative Risk = 2.26) [93]. | Synergistic effect. Combining strategies that target different levels (provider, system, patient) is most effective [93] [92]. |
Detailed Experimental Protocols
To ensure reproducibility and rigorous evaluation of these interventions, the following protocols detail the methodologies from key cited studies.
Protocol 1: A&F Versus Enhanced Provider Education
This protocol is adapted from a four-year cluster randomized controlled trial by Price-Haywood et al. (2014) [2] [91].
- 1. Study Aim: To compare the effectiveness of A&F alone versus A&F combined with additional physician communication training for improving cancer screening rates among patients with limited health literacy.
- 2. Design: Cluster randomized controlled trial, with randomization at the clinic level to minimize cross-contamination.
- 3. Participants:
- Providers: Primary care physicians (PCPs) practicing in clinics serving populations at risk for low health literacy.
- Patients: Men and women overdue for colorectal, breast, or cervical cancer screening and identified as having limited health literacy.
- 4. Intervention Arms:
- Arm 1 (A&F Alone - Control):
- Chart Audit: Semiannual audits of patients' cancer screening status.
- Performance Feedback: Two annual performance feedback reports provided to PCPs.
- Arm 2 (A&F + Communication Training - Intervention):
- All components of Arm 1, plus:
- Unannounced Standardized Patient (SP) Visits: Three unannounced visits with actors portraying patients overdue for screening.
- Structured Feedback: Immediately after the visit, SPs reveal their identity and provide structured verbal feedback on the physician's communication.
- Academic Detailing: A one-on-one 30-minute session with a study investigator to review guidelines, identify patients with limited health literacy, and train in communication strategies (e.g., "teach-back," shared decision-making).
- Arm 1 (A&F Alone - Control):
- 5. Data Collection & Outcomes:
- Primary Outcome: Change in cancer screening rates over 24 months, assessed via electronic medical record (EMR) review.
- Secondary Outcomes:
- Physician communication behaviours, rated by SPs using validated checklists immediately after each visit.
- Patient knowledge of cancer screening guidelines, assessed via surveys.
- 6. Analysis: Between-group differences in changes in screening rates and SP ratings over time.
Diagram 1: A&F vs Education Trial Flow
Protocol 2: Multi-Level Reminders for Abnormal Screening Follow-up
This protocol is adapted from an NCI-funded clinical trial by Atlas et al. (2023) [92].
- 1. Study Aim: To evaluate the effectiveness of multi-level reminder systems in increasing follow-up testing completion after an abnormal breast, cervical, colorectal, or lung cancer screening result.
- 2. Design: Pragmatic randomized controlled trial, with randomization at the primary care practice level.
- 3. Participants: Patients from primary care practices who were 1-6 months overdue for follow-up of an abnormal cancer screening result.
- 4. Intervention Arms:
- Arm 1 (Usual Care): Outreach and follow-up at the clinician's discretion; no systematic EHR reminder.
- Arm 2 (EHR Reminder Only): An automated reminder within the EHR flagging the patient as overdue for follow-up.
- Arm 3 (EHR Reminder + Patient Outreach): EHR reminder plus a mailed or patient-portal letter, followed by a telephone call from study staff if needed.
- Arm 4 (EHR Reminder + Patient Outreach + Navigation): All components of Arm 3, with the addition of a telephone call from a patient navigator if needed.
- 5. Data Collection & Outcomes:
- Primary Outcome: Proportion of patients who completed the recommended follow-up test within 4 months of study enrollment.
- Data Source: Electronic health records.
- 6. Analysis: Comparison of follow-up completion rates across the four study arms.
Application Notes: Designing an Effective A&F System for Cancer Screening Follow-up
Moving beyond isolated experiments, implementing A&F in real-world cancer screening programmes requires careful attention to design and context. Evidence suggests that the theoretical foundations and usability of A&F are critical to its success [90] [29].
Theoretical Foundations of A&F
A systematic review of e-A&F found that most interventions implicitly target a combination of theoretical domains from the Theoretical Domains Framework (TDF), most commonly 'knowledge,' 'social influences,' 'goals,' and 'behaviour regulation' [90]. Effective A&F systems should be designed to explicitly activate these domains. For instance, providing comparative data on peer performance taps into 'social influences,' while offering actionable improvement plans directly supports 'behaviour regulation.'
Implementation Framework and Cost Considerations
A pragmatic approach to implementation must account for workflow integration and cost. A qualitative study of family physicians receiving A&F reports identified two major themes affecting usability [29]:
- Alignment with Recipient Expectations: Feedback must be perceived as accurate, reflect best practices, and focus on activities within the physician's control.
- Capacity to Engage: Barriers include poor fit with clinical workflow, competing priorities, time constraints, and lack of skills to act on the data.
Furthermore, a micro-costing analysis of an A&F intervention for opioid use disorder revealed that implementation costs can be separated into delivery costs (e.g., developing dashboards, data validation) and participation costs (e.g., clinic staff time to review data and plan improvements) [94]. Understanding this distinction is vital for budget planning and economic evaluation.
Diagram 2: A&F System Logic Model
The Scientist's Toolkit
To support the experimental and implementation work in this field, the following table outlines key resources and their applications.
Table 2: Essential Research Reagents and Tools for A&F and Screening Studies
| Tool / Resource | Function / Definition | Application in Research |
|---|---|---|
| Electronic Health Record (EHR) | A digital version of a patient's paper chart, containing the patient's medical history, diagnoses, medications, and test results. | Primary data source for chart audits to determine screening and follow-up status [92] [2] [95]. Can be configured to generate automated reminders and performance dashboards [92]. |
| Theoretical Domains Framework (TDF) | A consolidated framework of 12 domains (e.g., knowledge, skills, social influences) derived from 33 behaviour change theories [90]. | Used to guide the design of A&F interventions and to retrospectively analyze the theoretical components of existing interventions [90]. |
| Standardized Patients (SPs) | Individuals trained to portray a patient with a specific medical condition in a consistent, standardized manner. | Used to objectively measure and provide feedback on provider communication behaviours in a controlled, yet realistic, setting [2] [91]. |
| RE-AIM Framework | An evaluation framework focusing on Reach, Effectiveness, Adoption, Implementation, and Maintenance. | Used to plan and evaluate the translational potential and public health impact of implementation strategies like A&F in real-world settings [96]. |
| Client Reminder Systems | Automated or manual systems (letters, calls, texts) to remind patients of needed care. | A core component of multi-level interventions. Used in research to test the additive effect of patient-directed reminders alongside provider-focused A&F [92] [97]. |
Audit and Feedback (A&F), a cornerstone implementation strategy in healthcare, demonstrates variable effectiveness when deployed in isolation for complex behaviors such as cancer screening follow-up. Contemporary evidence from implementation science reveals that A&F functions most effectively as a modest modifier within multifaceted strategies. This application note synthesizes current evidence and protocols, framing A&F within a broader thesis on improving cancer screening follow-up research. We provide a structured analysis of A&F's synergistic role alongside other interventions, supported by quantitative data summaries, conceptual models, and detailed experimental protocols tailored for researchers and drug development professionals working in translational oncology and public health.
Audit and Feedback is defined as a quality improvement process that involves "providing healthcare professionals and/or organisations with a summary of clinical performance over time on objectively measured quality indicators" [46]. Its foundational philosophy is sound: it aims to close gaps between desired and actual clinical performance by measuring care against explicit standards and feeding this information back to practitioners [46]. However, the 2025 Cochrane Review of A&F identified 48 unique behaviour change techniques within A&F trials, signaling its inherent complexity and the fact that it is rarely a simple, unitary intervention [46].
Theoretical frameworks like Clinical Performance Feedback Intervention Theory (CP-FIT) posit that healthcare professionals and organisations have a finite capacity to engage with feedback, and that feedback supporting direct clinical behaviours is most effective [46]. This establishes the conceptual basis for A&F's role as part of a larger system. In the specific context of cancer screening, a 2025 systematic review found that organizational strategies—including A&F—play a critical role in determining program reach and impact, with A&F mechanisms improving adherence modestly, especially when aligned with broader quality improvement initiatives [15]. This "modest" yet important effect underscores its nature as a modifier rather than a standalone solution.
Theoretical Framework for a Multi-Component Strategy
Integrating A&F effectively requires understanding its mechanisms of action and how it interacts with other strategies. The following model, derived from established theories and empirical findings, visualizes A&F's role within a multi-component strategy for cancer screening follow-up.
Diagram 1: A&F as a Modest Modifier in a Multi-Component Strategy. A&F is activated by improvement goals and works synergistically with other strategies. Its effect on outcomes is mediated by recipient reaction and is moderated by contextual factors.
The model illustrates that A&F's pathway to impact is not direct. Its effect is mediated by the recipient's reaction (encompassing acceptance, cognitive engagement, and emotional response) and the subsequent development of intermediate outcomes like intention to change [98] [99]. Furthermore, the entire process is moderated by critical contextual factors, including leadership support and organizational capacity [100]. A&F synergizes with other components; for instance, educational meetings can enhance the capability to act on feedback, while program champions can increase motivation and opportunity by creating a supportive environment [101].
Quantitative Evidence Synthesis
The following tables consolidate recent quantitative evidence on the effectiveness of A&F and related implementation strategies, highlighting its relative contribution within multi-faceted approaches.
Table 1: Effectiveness of Implementation Strategies on Clinical Practice and Patient Outcomes
| Implementation Strategy | Effect on Clinical Practice Outcomes | Effect on Patient Outcomes | Key Contextual Notes |
|---|---|---|---|
| Audit & Feedback (A&F) Alone | Modest improvement [15] | Limited evidence; likely small, indirect effect [101] | Effectiveness is highly variable; depends on design and context [46] [99]. |
| Educational Meetings | Statistically significant improvement [101] | Statistically significant improvement [101] | Improves knowledge, attitude, and skills. |
| Program Champions | Associated with increased screening prevalence [100] | Not separately reported | Naturally emerging champions showed lower turnover (64.3% zero turnover) [100]. |
| Tailored Interventions | Statistically significant improvement [101] | Statistically significant improvement [101] | Interventions designed to address context-specific barriers. |
| Reminders (Patient/Provider) | Statistically significant improvement [101] | Modest effect [101] | Digital tools show higher effectiveness when integrated [15]. |
| Multifaceted vs. Single (A&F) | Small, non-significant effect in meta-analysis, but favorable direction in narrative synthesis [101] | Modest effect [101] | Combining structural standardization with engagement offers greatest promise [15]. |
Table 2: Key Features of A&F and Their Experimental Impact on Intention to Change
| Feedback Modification Feature | Definition / Operationalization | Experimental Impact on Intention | Source / Protocol |
|---|---|---|---|
| Effective Comparators | Comparing performance to peers or benchmarks. | No independent effect, but interacts with other features. | [98] |
| Multimodal Feedback | Delivering information through multiple formats (e.g., text, graphs). | No independent effect; shows synergistic and antagonistic interactions. | [98] |
| Specific Actions | Providing clear, concrete recommendations for improvement. | No independent effect; part of most effective combinations. | [98] |
| Patient Voice | Incorporating perspectives or data from patients. | Part of the most effective combination for clinicians. | [98] |
| Minimized Cognitive Load | Presenting data in a simple, easily digestible format. | Part of both the most and least effective combinations. | [98] |
| Most Effective Combination | Multimodal feedback + Specific actions + Patient voice + Reduced cognitive load. | Highest predicted intention (2.40 on a scale of -3 to +3) among clinicians. | [98] |
Experimental Protocols
Protocol 1: Fractional Factorial Screening Experiment for A&F Optimization
This protocol is adapted from a study that used the Multiphase Optimization Strategy (MOST) to efficiently test multiple A&F components [98].
Objective: To identify the most effective combination of feedback modifications for increasing intention to adhere to cancer screening follow-up standards.
Design: Randomized online fractional factorial screening experiment.
Participants: Clinicians, managers, and audit staff involved in cancer screening programs (e.g., target N ≥ 600).
Interventions:
- Independent Variables: Six feedback modifications, each with two levels (ON/OFF):
- Effective Comparators: ON = includes peer comparison benchmarks; OFF = no benchmarks.
- Multimodal Feedback: ON = uses text and graphical summaries; OFF = text only.
- Specific Actions: ON = includes a list of recommended improvement actions; OFF = no specific actions.
- Optional Detail: ON = offers hyperlink to detailed data; OFF = no detail.
- Patient Voice: ON = includes patient narrative or experience data; OFF = no patient voice.
- Minimized Cognitive Load: ON = simplified data presentation; OFF = complex presentation.
- Participants are randomized to view an audit report excerpt representing one of 32 possible combinations of these modifications.
Primary Outcome: Intention to enact the audit standard, measured on a 7-point Likert scale (-3 to +3) using a validated multi-item instrument (e.g., "I intend to...") [98].
Secondary Outcomes: Comprehension, user experience, and engagement.
Analysis: Factorial analysis to estimate main and interaction effects of the six modifications on the primary outcome.
Protocol 2: Implementing and Evaluating Program Champions with A&F
This protocol integrates a key supportive strategy identified as effective in clinical settings [101] [100].
Objective: To assess the effect of adding program champions to an A&F intervention on colorectal cancer screening follow-up rates.
Design: Cluster randomized trial or prospective quasi-experimental study.
Setting: Primary care clinics within a cancer screening network.
Intervention Arm (A&F + Champions):
- A&F Component: Monthly or quarterly feedback reports to clinics on their follow-up colonoscopy rates for Fecal Immunochemical Test (FIT)-positive patients, incorporating evidence-based features from Protocol 1.
- Champion Component:
- Identification: Recruit one or more naturally emerging or assigned champions per clinic. Roles may include physicians, quality improvement managers, or medical assistants [100].
- Training: Provide champions with training on data interpretation, quality improvement methods, and advocacy for colorectal cancer screening.
- Role Definition: Champions act as implementers, advocates, connectors, motivators, and data wranglers [100].
Control Arm: A&F alone, or usual care.
Primary Outcome: Clinic-level rate of completed follow-up colonoscopy within 90 days of a positive FIT test.
Secondary Outcomes: Champion turnover, sustainability of the intervention, and clinician attitudes and knowledge.
Data Collection: Utilize existing electronic health record data for screening outcomes. Conduct surveys and interviews with champions and clinic staff to assess process measures.
Analysis: Compare change in follow-up rates from baseline to follow-up between intervention and control clinics using mixed-effects models to account for clustering.
The Scientist's Toolkit: Research Reagent Solutions
Table 3: Essential Materials and Tools for A&F Cancer Screening Research
| Item / Tool | Function / Application in A&F Research | Exemplar / Notes |
|---|---|---|
| Clinical Performance Data System | Provides the "audit" data for feedback reports. Requires robust data linkage and extraction capabilities. | Veterans Affairs External Peer Review Program (EPRP) [99]; National Clinical Audit (NCA) programmes [98]. |
| Theoretical Frameworks | Guides intervention design, measurement, and interpretation of mechanisms of effect. | Clinical Performance Feedback Intervention Theory (CP-FIT) [46]; Theoretical Framework of Acceptability (TFA) [102]. |
| Validated Intention Scale | Serves as a proximal outcome in optimization experiments, predicting future behavior change. | 7-point Likert scale (-3 to +3) with "I intend," "I want," and "I expect" stems [98]. |
| Qualitative Interview Guides | Elicits in-depth understanding of feedback recipient reaction, a key mediator of A&F effectiveness. | Semi-structured guides exploring feedback acceptance, emotional response, and perceived barriers [99]. |
| Champion Identification & Training Toolkit | Supports the implementation of the champion strategy in multi-component studies. | Materials for defining roles (implementer, advocate, connector) and training on data and QI methods [100]. |
| Digital Feedback Platform | Enables the delivery of multimodal, tailored feedback with minimized cognitive load. | Web portals or integrated EHR dashboards that can test different feedback modifications [98]. |
Audit and Feedback is a necessary but often insufficient component for achieving substantial improvements in complex cancer care processes like screening follow-up. Its true power is unlocked when it is thoughtfully positioned as a modest modifier within a synergistic multi-component strategy. This requires moving beyond "if" A&F works to a more nuanced investigation of "how" it works best, for whom, and under what conditions. The frameworks, data, and protocols provided herein offer a roadmap for researchers to design and evaluate such integrated strategies, ultimately contributing to more effective and equitable cancer screening outcomes.
Application Note: Enhancing Cancer Screening Audit and Feedback Systems
Audit and feedback (A/F) systems are widely adopted implementation strategies designed to improve clinical practice guideline adherence, particularly in cancer screening programs. These systems provide health professionals with summaries of their clinical performance over a specified period, comparing their results with those of other professionals or established standards [103]. In cancer screening, where physician recommendation strongly predicts patient adherence, A/F systems can play a crucial role in improving screening participation rates [91]. However, considerable heterogeneity exists in the effectiveness of A/F interventions, necessitating rigorous real-world validation to optimize their design and implementation [103] [23].
This application note synthesizes evidence from cluster-randomized trials and analyses of health system data to provide methodological guidance for validating A/F systems in real-world settings. The insights are framed within cancer screening follow-up research, addressing the critical need to bridge the gap between efficacy demonstrated in controlled trials and effectiveness in routine clinical practice. By leveraging real-world data (RWD) sources and robust experimental designs, researchers can generate real-world evidence (RWE) to inform the optimization and scaling of A/F interventions [104] [105].
Key Quantitative Evidence from Real-World Studies
Table 1: Summary of Key Findings from Audit and Feedback Intervention Studies
| Study Reference | Intervention Type | Sample Size | Primary Outcome | Effect Size | Key Findings |
|---|---|---|---|---|---|
| Screening Activity Report (SAR) Factorial Experiment [103] | Email messages with BCTs | 5,449 primary care physicians | SAR access rate | Risk Ratio: 0.871 (problem-solving content) | Fewer than half opened messages; <10% clicked through; problem-solving content reduced access but increased cervical screening |
| Primary Care Screening Activity Report (PCSAR) Evaluation [23] | Web-based audit and feedback tool | 7,800 physicians; >1.2 million patients | Screening participation | Adjusted OR: 1.07-1.22 across screening types | Small positive association between PCSAR use and screening participation; 63% of physicians registered, 38% of those logged in |
| Communication Training vs. Audit-Feedback [91] | CME training + audit/feedback vs. audit/feedback alone | 18 PCPs; 168 patients | Physician communication behaviors; screening rates | Improved communication scores; no significant difference in screening rates | Communication training improved patient-centered counseling but did not significantly increase screening rates compared to audit/feedback alone |
Table 2: Electronic Medical Record Data Sources for Real-World Validation Studies
| Data Source | Key Applications in A/F Research | Strengths | Limitations |
|---|---|---|---|
| Electronic Health Records (EHRs) [104] [106] | Clinical granularity, patient outcomes, screening completion | Rich clinical data; diagnostic and treatment information | Fragmented across systems; unstructured data challenges |
| Insurance Claims Data [104] | Treatment patterns, healthcare utilization, screening referrals | Longitudinal view; large sample sizes | Limited clinical detail; administrative purpose |
| Disease Registries [104] | Specialized databases for specific conditions | Curated data quality; natural history tracking | Narrow focus; potential selection bias |
| Patient-Reported Outcomes (PROs) [104] | Patient-centered outcomes, experiences | Direct patient perspective; symptom tracking | Subject to various biases; implementation challenges |
Experimental Protocols for Real-World Validation
Protocol 1: Pragmatic Factorial Cluster-Randomized Trial
Background and Purpose
This protocol outlines a pragmatic factorial experimental design to test multiple behavior change techniques (BCTs) embedded within email communications intended to promote engagement with an online audit and feedback tool for cancer screening. The protocol is adapted from a published study that tested three BCTs: anticipated regret, material incentive, and problem-solving [103] [25].
Detailed Methodology
Study Design
- Design Type: Pragmatic 2×2×2 factorial cluster-randomized experiment
- Setting: Primary care practices in a universal healthcare system
- Duration: 4-month intervention period with outcomes assessed using routinely collected administrative data
- Randomization Unit: Individual primary care physicians
Participants and Eligibility
- Inclusion Criteria: Primary care physicians who had agreed to receive routine email messages about the Screening Activity Report (SAR) [103]
- Exclusion Criteria: Nominated delegates (to avoid contamination)
- Sample Size: 5,449 physicians (based on prior feasibility assessment)
Intervention Development The development process employed user-centered design principles:
- Step 1: Interdisciplinary research team selected BCTs from Michie et al.'s taxonomy and developed draft content [25]
- Step 2: Conducted cocreation workshops with physician users (adopters) to refine content and ensure relevance [25]
- Step 3: Held focus groups with non-users to pretest content and identify potential barriers [25]
- Step 4: Finalized eight email versions corresponding to all combinations of the three BCTs
Intervention Components
- Anticipated Regret: Targeted beliefs about consequences (e.g., "How would you feel if a patient had a poor outcome because you missed an abnormal test result?") [103]
- Material Incentive (Behaviour): Targeted reinforcement (e.g., "Logging into the SAR can help you maximize your screening rates and save time when calculating your preventive care bonus.") [103]
- Problem-Solving: Targeted behavioural regulation (e.g., "Email ONE ID to register a delegate with eHealth Ontario so they can check your report") [103]
Implementation Procedures
- Emails sent monthly by the provincial cancer agency for 4 months
- Each physician received the same email version throughout the trial
- Open and click rates automatically collected using email marketing platform
- No additional training or support provided beyond the email content
Outcome Measures
- Primary Outcome: SAR access (≥1 log-in event during 4-month experiment)
- Secondary Outcomes: Number of different days with log-ins; proportion of patients up-to-date with breast, cervical, and colorectal cancer screening
- Process Measures: Email open rates; click-through rates; calls to support lines
Data Collection Methods
- SAR Access: Automatically captured through login system
- Screening Rates: Calculated using routinely collected administrative data
- Physician Characteristics: Obtained from corporate provider database (sex, years of practice)
- Practice Characteristics: Practice size, rurality from health system databases
Analysis Plan
- Primary analysis used risk ratios with 95% confidence intervals
- Adjusted for physician and practice characteristics
- Factorial analysis examined main effects and interactions
Protocol 2: Retrospective Cohort Study Using Health System Data
Background and Purpose
This protocol describes a retrospective cohort design to evaluate the effectiveness of an existing audit and feedback tool (Primary Care Screening Activity Report) on cancer screening participation using routinely collected health system data [23]. This approach leverages real-world data to assess the tool's impact under routine practice conditions.
Detailed Methodology
Study Design
- Design Type: Retrospective cohort study
- Setting: Universal healthcare system with organized screening programs
- Data Sources: Linked administrative health databases
- Exposure Period: 2014 calendar year
Cohort Definition Three separate cohorts were defined based on screening program eligibility:
- Colorectal Cancer Screening: Men and women aged 50-74 years
- Breast Cancer Screening: Women aged 50-74 years
- Cervical Cancer Screening: Women aged 21-69 years
Exposure Assessment Two exposure levels were evaluated:
- Registration: Enrollment with a physician registered to receive PCSAR
- Log-in: Enrollment with a registered physician who accessed the PCSAR
Outcome Measurement
- Primary Outcome: Screening participation during exposure period
- Operational Definitions:
- Colorectal cancer: FOBT within previous 2 years, flexible sigmoidoscopy within 5 years, or colonoscopy within 10 years
- Breast cancer: Mammography within previous 2 years
- Cervical cancer: Pap test within previous 3 years
Covariates and Adjustment Variables
- Patient Characteristics: Age, comorbidities, prior screening history, socioeconomic status
- Physician Characteristics: Sex, years in practice, practice size
- Practice Characteristics: Rurality, group size
Statistical Analysis
- Used multivariable logistic regression to estimate odds ratios
- Adjusted for patient, physician, and practice characteristics
- Calculated 95% confidence intervals for all effect estimates
The Scientist's Toolkit: Research Reagent Solutions
Table 3: Essential Research Materials and Methods for Real-World Validation Studies
| Tool/Resource | Function/Purpose | Example Applications | Implementation Considerations |
|---|---|---|---|
| Behavior Change Technique Taxonomy (v1) [103] [25] | Standardized classification of intervention components | Selecting and operationalizing BCTs (anticipated regret, material incentive, problem-solving) | Requires adaptation to specific context and target behaviors |
| Electronic Medical Record Systems [104] [106] | Source of real-world clinical data for outcome assessment | Extracting screening participation data, patient characteristics | Data standardization and interoperability challenges across systems |
| Administrative Health Databases [23] | Population-level data on healthcare utilization and outcomes | Calculating screening rates, adjusting for covariates | Data quality validation and linkage across datasets |
| User-Centered Design Frameworks [25] | Engaging end-users in intervention development | Co-creation workshops, focus groups for content refinement | Balancing user preferences with evidence-based approaches |
| PRECEDE-PROCEED Model [107] | Planning and evaluation framework for complex interventions | Systematic assessment of barriers and facilitators to screening | Requires adaptation to specific organizational contexts |
| Multiphase Optimization Strategy (MOST) [103] | Framework for optimizing and evaluating behavioral interventions | Factorial experiments to identify active intervention components | Resource-intensive; requires careful experimental design |
Real-world validation of audit and feedback systems for cancer screening requires methodological rigor and pragmatic considerations. The protocols and tools outlined in this document provide a framework for generating robust real-world evidence about A/F interventions. Key insights from existing studies indicate that even well-designed A/F systems achieve modest effects, with engagement being a critical mediator of effectiveness [103] [23].
Future research should focus on optimizing engagement strategies, testing implementation approaches in diverse healthcare settings, and exploring the role of emerging technologies like artificial intelligence in enhancing A/F systems. The integration of real-world data sources and rigorous experimental designs will continue to advance our understanding of how to effectively implement audit and feedback systems to improve cancer screening outcomes.
The Healthcare Effectiveness Data and Information Set (HEDIS) serves as a cornerstone for evaluating health plan performance, with over 235 million Americans enrolled in plans that report HEDIS results [108]. Within cancer care, the systematic tracking of follow-up activities represents a critical frontier for quality measurement, particularly given evidence that approximately 30% of women fail to attend recommended immediate follow-up for high-risk mammograms [61]. This application note examines the development of new standardized HEDIS measures for follow-up within the context of audit and feedback systems for cancer screening, providing researchers with methodological frameworks and implementation protocols.
The evolution toward electronic clinical data systems (ECDS) and stratified measurement by race and ethnicity represents a paradigm shift in how follow-up care is quantified and evaluated [61] [109]. These developments enable more granular assessment of care quality while highlighting disparities in follow-up care delivery. This document outlines the specifications, experimental frameworks, and research applications of these emerging measurement standards.
New HEDIS Follow-Up Measures: Specifications and Significance
For Measurement Year (MY) 2025, NCQA introduced several new measures that specifically address critical gaps in follow-up care documentation and evaluation [61]. These measures represent a significant advancement in standardizing the assessment of care continuity, particularly for cancer screening programs.
Table 1: New HEDIS Measures for Follow-Up and Monitoring (MY 2025)
| Measure Name | Target Population | Follow-Up Timeframe | Clinical Intent | Reporting Method |
|---|---|---|---|---|
| Documented Assessment After Mammogram | Members 40-74 years undergoing mammography | Documentation within 14 days of mammogram | Standardize reporting of results using BI-RADS assessment categories | ECDS |
| Follow-Up After Abnormal Breast Cancer Assessment | Members 40-74 years with inconclusive or high-risk BI-RADS assessments | Appropriate follow-up within 90 days of assessment | Address failure rates in diagnostic testing after abnormal results | ECDS |
| Blood Pressure Control for Patients With Hypertension | Members 18-85 years with hypertension diagnosis | Most recent BP <140/90 mm Hg during measurement period | Modified from CBP measure with improved denominator inclusion | ECDS with race/ethnicity stratification |
The "Follow-Up After Abnormal Breast Cancer Assessment" measure addresses a critical juncture in the cancer screening continuum. Research indicates that delayed follow-up after abnormal mammography contributes to decreased survival rates, particularly among underserved minority populations [61]. This measure aims to standardize the quantification of this quality gap, enabling targeted interventions.
Enhanced Follow-Up Measures in Behavioral Health
Beyond cancer screening, HEDIS has expanded follow-up measurement in behavioral health, creating parallel frameworks for tracking care continuity. These include:
- Follow-Up After Emergency Department Visit for Mental Illness (FUM): Now includes expanded denominator criteria incorporating phobia diagnoses, anxiety diagnoses, intentional self-harm codes, and suicidal ideation codes [61].
- Follow-Up After Hospitalization for Mental Illness (FUH): Features additional follow-up options, including expanded provider types, psychiatric residential treatment, and peer support services [61].
These enhancements demonstrate the evolutionary trajectory of HEDIS follow-up measures toward greater inclusiveness of patient populations and care modalities, providing researchers with standardized outcomes for evaluating care transition interventions.
Methodological Frameworks for Audit and Feedback Systems
PRECEDE-PROCEED Model for Screening Program Audit
The PRECEDE-PROCEED model provides a robust framework for developing audit systems for screening programs, as demonstrated in a Lombardy, Italy-based breast cancer screening initiative [107]. This operational approach supports the planning and evaluation of complex health interventions through a multidimensional structure that considers epidemiological, socio-psychological, administrative, political, and environmental factors.
Table 2: PRECEDE-PROCEED Model Phases Adapted for Cancer Screening Audit
| Phase | Application to Cancer Screening Follow-Up | Outputs/Indicators |
|---|---|---|
| 1. Identification of Program Goals | Define targets for participation, sensitivity, false positive rates, and follow-up completion | Specific, measurable targets for follow-up rates |
| 2. Epidemiological Analysis | Identify disparities in follow-up care across demographic groups | Data on follow-up rates stratified by race, ethnicity, socioeconomic status |
| 3. Best Practices Analysis | Review evidence-based interventions to improve follow-up | Inventory of effective strategies (mail reminders, telephone calls, etc.) |
| 4. Evidence-Based Actions | Implement proven interventions in screening centers | Standardized protocols for patient notification and tracking |
| 5. Priority Setting | Identify and rank solutions for specific follow-up barriers | Ranked list of implementation priorities |
| 6. Indicator Definition | Establish standardized metrics for follow-up measurement | HEDIS-compatible follow-up measures |
| 7. Monitoring | Continuous tracking of follow-up rates | Real-time dashboards with performance data |
| 8. Evaluation | Assess impact of interventions on follow-up rates | Pre-post analysis of implementation effectiveness |
| 9. Impact Assessment | Measure effect on downstream clinical outcomes | Cancer stage at diagnosis, treatment timelines, mortality |
The Lombardy implementation demonstrated that plans developed using this framework were more standardized and featured clearer indicators for monitoring and evaluation compared to traditional approaches [107]. This model provides researchers with a systematic methodology for developing and testing audit systems tailored to specific healthcare contexts.
Behavior Change Techniques for Audit and Feedback Implementation
Effective audit and feedback systems require strategic implementation to ensure clinician engagement. Research by Ivers et al. demonstrated that incorporating behavior change techniques (BCTs) into communication strategies can significantly impact provider engagement with audit and feedback tools [25].
Their methodology employed:
- Identification of BCTs from established taxonomies proven effective in other healthcare settings
- Draft content development operationalizing these BCTs for specific clinical contexts
- Co-creation workshops with physician users to refine and adapt content
- Iterative pretesting with both adopters and non-adopters of audit and feedback tools
- Factorial experimentation to test different BCT combinations in real-world settings
This approach highlights the tension between user preferences and scientific evidence in designing implementation strategies [25]. Researchers applying this methodology should balance stakeholder input with evidence-based practice while considering organizational constraints and scientific objectives.
Experimental Protocols for Follow-Up Measure Development
Co-Creation Protocol for Measure Development
Based on successful implementations, the following protocol provides a framework for developing and refining follow-up measures:
Objective: To develop user-informed follow-up measures and implementation strategies through structured stakeholder engagement.
Materials:
- Draft measure specifications based on evidence review
- Behavior change technique taxonomy
- Recording equipment for workshops
- Data collection templates for qualitative analysis
Procedure:
- Recruitment: Use purposive and convenience sampling to recruit both adopters (frequent users of audit systems) and non-adopters (infrequent users) [25].
- Preliminary Content Development: Research team identifies potential BCTs and develops draft measure specifications and implementation content.
- Co-Creation Workshops:
- Conduct separate workshops with adopter and non-adopter groups
- Present draft specifications and BCT-informed content
- Facilitate structured feedback sessions using SWOT analysis [107]
- Collaboratively refine measure parameters and implementation strategies
- Content Analysis:
- Review workshop notes and recordings
- Code content for underlying BCTs and stakeholder concerns
- Analyze valence (positive/negative) of reactions to each proposed element
- Measure Finalization:
- Integrate stakeholder input with evidence base
- Finalize measure specifications and implementation guides
- Develop evaluation framework for testing measure implementation
This protocol emphasizes the iterative nature of measure development, balancing scientific rigor with practical implementability—a critical tension identified in implementation research [25].
Health Equity Stratification Protocol
The integration of health equity considerations into follow-up measures requires systematic methodology:
Objective: To integrate health equity stratification into follow-up measures to identify and address disparities in care.
Data Requirements:
- Race and ethnicity data aligned with OMB categories, including Middle Eastern or North African (MENA) category per 2024 guidelines [109]
- Options for "declined" for members choosing not to provide demographic data
- Separate stratification for race and ethnicity
Analytical Procedure:
- Data Collection: Implement standardized race/ethnicity data collection across participating sites
- Stratified Analysis: Calculate follow-up rates separately for each racial/ethnic group
- Disparity Identification: Compare follow-up rates across groups to identify significant disparities
- Root Cause Analysis: Investigate systemic, organizational, and interpersonal factors contributing to identified disparities
- Intervention Development: Design targeted interventions to address specific barriers in underserved groups
- Impact Evaluation: Monitor stratified rates over time to assess intervention effectiveness
As of MY 2026, 22 HEDIS measures can be stratified by race and ethnicity, enabling researchers to document and address inequities in follow-up care [109].
Research Applications and Visualization
Logical Workflow for Follow-Up Measure Implementation
The development and implementation of standardized follow-up measures follows a systematic workflow that integrates multiple methodological approaches:
Diagram 1: Follow-Up Measure Development Workflow (82 characters)
This workflow integrates the PRECEDE-PROCEED model for comprehensive planning [107] with behavior change technique integration for effective implementation [25], and health equity stratification for disparity reduction [109]. Researchers can apply this framework to develop and test new follow-up measures across diverse clinical contexts.
Audit and Feedback System Architecture
Effective implementation of follow-up measures requires a robust audit and feedback system architecture that facilitates data collection, analysis, and reporting:
Diagram 2: Audit and Feedback System Data Flow (76 characters)
This architecture highlights the cyclic nature of audit and feedback systems, where quality improvement actions generate enhanced data collection, creating a continuous learning cycle. The transition to ECDS reporting enables more robust data capture from electronic sources, facilitating more accurate measurement of follow-up activities [61].
Research Reagent Solutions for Follow-Up Measurement Studies
Table 3: Essential Research Materials for Follow-Up Measurement Studies
| Research Tool | Function/Application | Implementation Example |
|---|---|---|
| PRECEDE-PROCEED Planning Software | Provides structured framework for planning and evaluating screening program improvements | Lombardy region breast cancer screening audit system [107] |
| Behavior Change Technique Taxonomy (v1) | Classification system for designing implementation strategies targeting clinician behavior | Email content development to promote audit tool use [25] |
| HEDIS Technical Specifications (Volume 2) | Standardized protocols for data collection, calculation, and reporting of follow-up measures | Health plan performance measurement and reporting [108] [110] |
| Electronic Clinical Data Systems (ECDS) | Framework for capturing data from electronic health records, practice management systems | Reporting for new measures like Follow-Up After Abnormal Breast Cancer Assessment [61] |
| Race and Ethnicity Stratification Protocols | Standardized methods for collecting and analyzing data to identify health disparities | HEDIS health equity reporting for 22 measures by MY 2026 [109] |
| HEDIS Compliance Audit Standards (Volume 5) | Methodology for auditing data collection processes and ensuring compliance with specifications | Verification of data integrity for follow-up measure reporting [108] [110] |
These "research reagents" provide the methodological infrastructure necessary for rigorous development and testing of follow-up measures. Researchers should consider how these tools can be adapted to specific clinical contexts while maintaining methodological consistency for cross-study comparison.
The development of new standardized HEDIS measures for follow-up represents a significant advancement in quantifying and improving care continuity, particularly in cancer screening. The integration of ECDS reporting, health equity stratification, and evidence-based implementation frameworks provides researchers with powerful tools for addressing critical gaps in care transitions.
Future research should focus on:
- Evaluating the impact of specific follow-up measures on clinical outcomes
- Testing implementation strategies to maximize clinician engagement with audit and feedback systems
- Developing novel methods for capturing follow-up activities across diverse care settings
- Advancing health equity through targeted interventions informed by stratified performance data
The methodological frameworks and protocols outlined in this document provide a foundation for advancing the science of follow-up measurement through rigorous, standardized, and actionable research.
Conclusion
Audit and feedback systems are a proven, powerful component of efforts to close the critical gap between an abnormal cancer screening result and definitive diagnostic follow-up. The evidence demonstrates that successful implementation relies on more than just data delivery; it requires strategic integration into clinical workflows, thoughtful presentation of feedback, and sustained organizational commitment. For researchers and drug development professionals, the future lies in refining these systems through technological innovation—such as integrated CDS and AI-driven data analytics—and developing more nuanced, standardized outcome measures. Future research must focus on optimizing implementation strategies across diverse healthcare settings, personalizing feedback mechanisms for different provider types, and rigorously evaluating the long-term impact of A&F on stage-shift and cancer-specific survival. By treating A&F not as a simple compliance tool but as a dynamic, learning component of the healthcare system, the biomedical community can significantly advance the goal of timely cancer diagnosis and improved patient outcomes.
References
- 1. Audit and Feedback as a Quality Strategy - NCBI - NIH [https://www.ncbi.nlm.nih.gov/books/NBK549284/]
- 2. Comparative effectiveness of audit-feedback versus additional physician communication training to improve cancer screening for patients with limited health literacy - PubMed [https://pubmed.ncbi.nlm.nih.gov/24590734/]
- 3. Comparing clinical decision support systems for improving follow-up of abnormal cervical cancer screening test results - PubMed [https://pubmed.ncbi.nlm.nih.gov/40935221/]
- 4. Testing Behavior Change Techniques to Encourage Primary Care Physicians to Access Cancer Screening Audit and Feedback Reports: Protocol for a Factorial Randomized Experiment of Email Content - PMC [https://pmc.ncbi.nlm.nih.gov/articles/PMC5834752/]
- 5. Using audit and feedback to guide tailored ... [https://pmc.ncbi.nlm.nih.gov/articles/PMC10424451/]
- 6. Updates in Cancer Prevention and Screening for 2025 [https://www.pharmacytimes.com/view/updates-in-cancer-prevention-and-screening-for-2025-a-pharmacist-primer]
- 7. Colour Coding Navigation: “Triage” Techniques to Improve ... [https://pmc.ncbi.nlm.nih.gov/articles/PMC7535990/]
- 8. Best practices for data visualization: creating and ... [https://pmc.ncbi.nlm.nih.gov/articles/PMC7647241/]
- 9. Follow‐Up After Receiving Abnormal Results From Self‐ ... [https://pmc.ncbi.nlm.nih.gov/articles/PMC12475505/]
- 10. Evaluating Screening Participation, Follow-up, and ... [https://pmc.ncbi.nlm.nih.gov/articles/PMC7073922/]
- 11. CPSTF Findings for Cancer Prevention and Control [https://www.thecommunityguide.org/pages/task-force-findings-cancer-prevention-and-control.html]
- 12. Organizational Determinants, Outcomes Related to ... [https://www.mdpi.com/2072-6694/17/11/1775]
- 13. Contrast Checker [https://webaim.org/resources/contrastchecker/]
- 14. A step toward understanding the mechanism of action of audit ... [https://implementationscience.biomedcentral.com/articles/10.1186/s13012-021-01102-6]
- 15. Organizational Determinants, Outcomes Related to ... [https://pmc.ncbi.nlm.nih.gov/articles/PMC12153609/]
- 16. CanScreen5, a global repository for breast, cervical and ... [https://www.nature.com/articles/s41591-023-02315-6]
- 17. Audit and feedback to reduce unwarranted clinical ... [https://pmc.ncbi.nlm.nih.gov/articles/PMC10714549/]
- 18. Multilevel Follow-up of Cancer Screening (mFOCUS) [https://pmc.ncbi.nlm.nih.gov/articles/PMC8900526/]
- 19. Prioritizing performance and outcome indicators for quality ... [https://www.sciencedirect.com/science/article/pii/S0033350624005067]
- 20. Timely Follow-Up of Abnormal Diagnostic Imaging Test ... [https://pmc.ncbi.nlm.nih.gov/articles/PMC2919821/]
- 21. Tips to Help You Prepare for HEDIS MY 2025 Reporting [https://www.ncqa.org/blog/hedis-my-2025-reporting-tips/]
- 22. CoC Standards Updates for 2025 | ACS [https://www.facs.org/for-medical-professionals/news-publications/news-and-articles/cancer-programs-news/121924/coc-standards-updates-for-2025/]
- 23. The Primary Care Screening Activity Report (PCSAR) [https://www.sciencedirect.com/science/article/abs/pii/S0091743516303978]
- 24. Follow-up strategy and survival for five common cancers [https://www.sciencedirect.com/science/article/pii/S0959804922004610]
- 25. Designing Emails Aimed at Increasing Family Physicians' Use ... [https://humanfactors.jmir.org/2018/3/e25]
- 26. Deaths averted: An unbiased alternative to rate ratios for ... [https://pmc.ncbi.nlm.nih.gov/articles/PMC11330079/]
- 27. Optimizing process flow diagrams to guide implementation of ... [https://pmc.ncbi.nlm.nih.gov/articles/PMC10689519/]
- 28. Data sources and methods - CanScreen5 - IARC [https://canscreen5.iarc.fr/?page=datasources]
- 29. Qualitative Study Among Family Physicians Who Engaged ... [https://humanfactors.jmir.org/2023/1/e38736]
- 30. A Quantitative Approach to Data Collection and Analysis ... [https://pmc.ncbi.nlm.nih.gov/articles/PMC12276416/]
- 31. Sustainability, spread, and scale in trials using audit and ... [https://implementationscience.biomedcentral.com/articles/10.1186/s13012-023-01312-0]
- 32. The use of electronic health records to inform cancer surveillance... [https://bmcmedinformdecismak.biomedcentral.com/articles/10.1186/s12911-022-01831-8]
- 33. Re-Envisioning Electronic Health Records to Optimize... [https://pmc.ncbi.nlm.nih.gov/articles/PMC11834962/]
- 34. JMIR Cancer - Understanding and Addressing Challenges With... [https://cancer.jmir.org/2025/1/e58657]
- 35. 2025 DIY Guide to MSSP ACO eCQM Reporting [https://mrocorp.com/blog/2025-diy-guide-to-mssp-aco-ecqm-reporting-from-clinical-data-chaos-to-submission-success/]
- 36. New Cancer ICD-10-CM Codes Hit in October [https://www.oncologynewscentral.com/oncology/new-cancer-icd-10-cm-codes-hit-in-october]
- 37. Cancer statistics, 2025 [https://pubmed.ncbi.nlm.nih.gov/39817679/]
- 38. Audit and feedback to reduce unwarranted clinical variation at ... [https://implementationscience.biomedcentral.com/articles/10.1186/s13012-023-01324-w]
- 39. Assessment and Provider Planning Guide | Feedback | CDC Cancer [https://www.cdc.gov/cancer/php/ebi-planning-guides/provider-assessment-and-feedback-planning-guide.html]
- 40. Top 6 Visualizations for Quantitative Data Analysis Methods [https://chartexpo.com/blog/quantitative-data-analysis-methods]
- 41. Data Analysis and Visualization - Research ... [https://guides.library.txstate.edu/research-data/analysis-visualization]
- 42. Prism [https://www.graphpad.com/features]
- 43. Characterizing screening champions in the center for disease ... [https://implementationsciencecomms.biomedcentral.com/articles/10.1186/s43058-025-00759-0]
- 44. creating and sharing data visualizations from a remote ... [https://www.frontiersin.org/journals/digital-health/articles/10.3389/fdgth.2025.1520990/full]
- 45. Visual Perception and Pre-Attentive Attributes in ... [https://www.mdpi.com/2306-5354/12/7/782]
- 46. Audit, Feedback, and Behaviour Change [https://www.cambridge.org/core/elements/audit-feedback-and-behaviour-change/406505A44118E67FC88E397AFC1A9E8B]
- 47. The Effectiveness of Interactive Dashboards to Optimise ... [https://pmc.ncbi.nlm.nih.gov/articles/PMC9854857/]
- 48. A Scalable Service to Improve Health Care Quality ... [https://www.researchprotocols.org/2022/5/e34990]
- 49. A Multi-Dimensional Framework for Data Quality Assurance in ... [https://pmc.ncbi.nlm.nih.gov/articles/PMC12524141/]
- 50. Automated calculation of healthcare quality and safety ... [https://bmcmedinformdecismak.biomedcentral.com/articles/10.1186/s12911-025-03163-9]
- 51. AI and Machine Learning in Healthcare: 2025 Executive Guide [https://blog.nalashaahealth.com/ai-and-machine-learning-in-healthcare-an-executive-guide-for-2025/]
- 52. Machine Learning Applications in Population and Public Health [https://pmc.ncbi.nlm.nih.gov/articles/PMC12551935/]
- 53. Evaluating a Physician Audit and Feedback Intervention to ... [https://www.sciencedirect.com/science/article/abs/pii/S0360301623079385]
- 54. Mammography Workflow Challenges and How to Overcome ... [https://magview.com/blog/5-common-mammography-workflow-challenges/]
- 55. Challenges and best practices for digital unstructured data ... [https://pmc.ncbi.nlm.nih.gov/articles/PMC10566734/]
- 56. Handling imbalanced medical datasets: review of a decade ... [https://link.springer.com/article/10.1007/s10462-024-10884-2]
- 57. Challenges in Implementing Artificial Intelligence in Breast ... [https://pmc.ncbi.nlm.nih.gov/articles/PMC12123233/]
- 58. Impact of Provider-Patient Communication on Cancer ... [https://pmc.ncbi.nlm.nih.gov/articles/PMC5518612/]
- 59. Provider readiness and implementation barriers for lung ... [https://www.sciencedirect.com/science/article/pii/S2211335525002037]
- 60. Machine learning in point-of-care testing: innovations, ... [https://www.nature.com/articles/s41467-025-58527-6]
- 61. HEDIS MY 2025: What's New, What's Changed, ... - NCQA [https://www.ncqa.org/blog/hedis-my-2025-whats-new-whats-changed-whats-retired/]
- 62. NCQA Is Developing a New HEDIS Measure for Colorectal ... [https://www.ncqa.org/blog/ncqa-developing-hedis-measure-for-colorectal-cancer-screening-follow-up/]
- 63. How To Build a Resilient Oncology Team [https://www.accc-cancer.org/home/learn/management-operations/oncology-team-well-being]
- 64. How healthcare leaders can support and grow their teams [https://wellsky.com/blog/insights-from-the-inside-how-healthcare-leaders-can-support-and-grow-their-teams/]
- 65. Implementation of a Quality Improvement and Clinical ... [https://cancer.jmir.org/2025/1/e65461]
- 66. 2025: The State of AI in Healthcare [https://menlovc.com/perspective/2025-the-state-of-ai-in-healthcare/]
- 67. AI in the Healthcare Audits Market Latest Report 2025-2034 [https://www.insightaceanalytic.com/report/ai-in-the-healthcare-audits-market/2062]
- 68. Challenges and opportunities for artificial intelligence in ... [https://www.sciencedirect.com/science/article/pii/S1467089525000107]
- 69. Health Systems Improvement to Increase Cancer Screening [https://www.health.ny.gov/diseases/cancer/improvements_increase_screening/index.htm]
- 70. Cancer Screening Guidelines Overview and Processes [https://www.cancer.org/health-care-professionals/american-cancer-society-prevention-early-detection-guidelines/overview.html]
- 71. Visualizing Quantitative Data: Best Practices [https://ajelix.com/data/visualizing-quantitative-data-best-practices/]
- 72. Designing Effective Data Visualizations [https://guides.library.jhu.edu/datavisualization/design]
- 73. Presentation and Storytelling Skills for Strategy ... [https://medium.com/@designative/presentation-and-storytelling-skills-for-strategy-development-and-stakeholder-engagement-e205c58189b3]
- 74. How to Secure Executive Buy-In for an Engagement Survey [https://sparkbay.com/en/culture-blog/executive-approval-engagement-platform-64]
- 75. 5 Steps to Getting Executive Buy-In for Employee ... [https://blog.clearcompany.com/getting-executive-buy-in-employee-engagement-surveys]
- 76. Scientific colour maps [https://www.fabiocrameri.ch/colourmaps/]
- 77. Color Palettes for Science - Blog [https://sayostudio.com/color-palettes-for-science/]
- 78. Color contrast - Accessibility - MDN Web Docs - Mozilla [https://developer.mozilla.org/en-US/docs/Web/Accessibility/Guides/Understanding_WCAG/Perceivable/Color_contrast]
- 79. Understanding WCAG 2 Contrast and Color Requirements [https://webaim.org/articles/contrast/]
- 80. Provider Reminder Planning Guide | Cancer [https://www.cdc.gov/cancer/php/ebi-planning-guides/provider-reminder-planning-guide.html]
- 81. Implementation successes and challenges in participating in a ... [https://pmc.ncbi.nlm.nih.gov/articles/PMC5645273/]
- 82. Barriers and facilitators to implementing cancer prevention ... [https://bmchealthservres.biomedcentral.com/articles/10.1186/s12913-019-4326-4]
- 83. Assessing Barriers to Cancer Screening and Early ... [https://pmc.ncbi.nlm.nih.gov/articles/PMC11674532/]
- 84. Comparing variations in implementation processes and ... [https://www.sciencedirect.com/science/article/pii/S0165178119307589]
- 85. Insights from search summary tables for evidence and gap maps [https://pmc.ncbi.nlm.nih.gov/articles/PMC12058345/]
- 86. Measuring success of targeted screening and prevention for ... [https://pmc.ncbi.nlm.nih.gov/articles/PMC12434111/]
- 87. Key metrics for an effective employee background ... [https://www.veremark.com/blog/measuring-success-key-metrics-for-an-effective-employee-background-screening-program]
- 88. 7 Metrics to Measure to Get More from Background Checks [https://www.goodhire.com/blog/7-screening-metrics-to-measure/]
- 89. Metrics That Matter: Measuring Program Management ... [https://www.andrewreise.com/insights/metrics-that-matter-measuring-program-management-success-with-kpis-that-count]
- 90. A systematic review of electronic audit and feedback [https://pmc.ncbi.nlm.nih.gov/articles/PMC5427645/]
- 91. Comparative Effectiveness of Audit-Feedback Versus ... [https://pmc.ncbi.nlm.nih.gov/articles/PMC4099465/]
- 92. Reminders May Increase Follow-Up after Abnormal ... [https://www.cancer.gov/news-events/cancer-currents-blog/2023/cancer-screening-reminders-improve-follow-up]
- 93. What Multi-Level Interventions Do We Need to Increase the ... [https://pmc.ncbi.nlm.nih.gov/articles/PMC8288035/]
- 94. A pragmatic approach to estimating the cost to deliver and ... [https://pmc.ncbi.nlm.nih.gov/articles/PMC12535059/]
- 95. Improving Guideline-Adherent Follow-Up in Cervical ... [https://www.annfammed.org/content/23/Supplement_1/7901]
- 96. A pharmacist-led educational and audit & feedback strategy to ... [https://bmcprimcare.biomedcentral.com/articles/10.1186/s12875-025-02933-8]
- 97. Client (Patient) Reminders | Cancer [https://www.cdc.gov/cancer/php/interventions/client-reminders.html]
- 98. A randomised fractional factorial screening experiment to ... [https://implementationscience.biomedcentral.com/articles/10.1186/s13012-022-01208-5]
- 99. Model depicting aspects of audit and feedback that impact ... [https://pmc.ncbi.nlm.nih.gov/articles/PMC4944319/]
- 100. Characterizing screening champions in the center for ... [https://pmc.ncbi.nlm.nih.gov/articles/PMC12309199/]
- 101. Effects of implementation strategies on nursing practice and ... [https://pmc.ncbi.nlm.nih.gov/articles/PMC11443951/]
- 102. Acceptability of using point-of-care tests for cancer in ... [https://www.frontiersin.org/journals/cancer-control-and-society/articles/10.3389/fcacs.2025.1568916/full]
- 103. Testing e-mail content to encourage physicians to access an ... [https://pmc.ncbi.nlm.nih.gov/articles/PMC6588071/]
- 104. Real world data clinical trials: Essential 2025 [https://lifebit.ai/blog/real-world-data-clinical-trials/]
- 105. Revisiting real-world data studies: Progress, value, and ... [https://www.the-innovation.org/article/doi/10.59717/j.xinn-med.2025.100143]
- 106. Advancements in Electronic Medical Records for Clinical Trials [https://pmc.ncbi.nlm.nih.gov/articles/PMC12071135/]
- 107. an experience with breast cancer screening in the region of ... [https://bmcpublichealth.biomedcentral.com/articles/10.1186/s12889-020-09842-8]
- 108. HEDIS Measures and Technical Resources [https://www.ncqa.org/hedis/measures/]
- 109. Data and Measurement - Health Equity [https://www.ncqa.org/health-equity/data-and-measurement/]
- 110. hedis - NCQA > Performance Measurement [https://store.ncqa.org/hedis.html]