Optimizing Plasma Processing for cfDNA Extraction: A Complete Guide for Robust Liquid Biopsy Workflows
This article provides a comprehensive guide for researchers and drug development professionals on establishing reliable plasma processing workflows for cell-free DNA (cfDNA) extraction.
Optimizing Plasma Processing for cfDNA Extraction: A Complete Guide for Robust Liquid Biopsy Workflows
Abstract
This article provides a comprehensive guide for researchers and drug development professionals on establishing reliable plasma processing workflows for cell-free DNA (cfDNA) extraction. It covers the foundational biology of cfDNA and the critical impact of pre-analytical variables, explores and compares current extraction methodologies and automation technologies, details common troubleshooting and optimization strategies for yield and purity, and outlines analytical validation frameworks and performance comparisons for clinical applications. The content synthesizes the latest advancements and practical insights to support the development of robust, reproducible cfDNA-based assays in precision medicine.
The Fundamentals of Cell-Free DNA: Biology, Sources, and Pre-analytical Pitfalls
What is cfDNA? Defining Characteristics, Fragment Sizes, and Cellular Origins
Cell-free DNA (cfDNA) refers to fragmented DNA molecules released from cells into various body fluids, most commonly blood plasma, through various physiological and pathological cellular processes [1] [2]. The study of cfDNA has emerged as a pivotal component of liquid biopsy, providing a minimally invasive method for accessing genetic and epigenetic information that reflects the physiological and pathological states of the body [3] [1]. While its most prominent applications are in oncology and non-invasive prenatal testing (NIPT), the utility of cfDNA is expanding to include transplant rejection monitoring, infectious disease detection, and the study of systemic inflammatory conditions [3] [1].
A crucial subset of cfDNA, particularly in oncology, is circulating tumor DNA (ctDNA), which originates specifically from malignant cells [2]. The isolation and analysis of ctDNA from the total cfDNA pool enable tumor profiling, disease monitoring, and the identification of therapeutic targets without the need for invasive tissue biopsies [4] [5]. The efficient extraction and purification of cfDNA are therefore critical first steps, as impurities can significantly interfere with sensitive downstream analytical techniques like next-generation sequencing (NGS) [6].
Defining Characteristics and Cellular Origins
Key Physical and Molecular Characteristics
The defining characteristics of cfDNA are its fragment size and molecular composition. cfDNA in plasma is predominantly mononucleosomal, resulting from DNA wrapped around histone complexes that are protected from digestion by nucleases during programmed cell death [7] [2]. The most frequent fragment size observed is approximately 167 base pairs (bp), which corresponds to the length of DNA (~147 bp) wrapped around a single nucleosome core plus the linker DNA [7] [2]. Higher-order fragments, such as dinucleosomes (~340 bp) and trinucleosomes (~560 bp), are also present but less abundant [2]. Apart from nuclear cfDNA (cf-nDNA), a mitochondrial component (cf-mtDNA) also exists and is readily detectable in body fluids due to the high copy number of the mitochondrial genome per cell [8].
The fragmentation of cfDNA is not a random process. Instead, it is influenced by the placement of nucleosomes, transcription factors, and other DNA-binding proteins that protect specific genomic regions from degradation [7]. This non-random fragmentation pattern forms the basis of the emerging field of cfDNA fragmentomics, which leverages these patterns to infer epigenetic and transcriptional information about the tissue of origin [3] [7]. For instance, the diversity of fragment sizes and end motifs can be quantified using metrics like Shannon entropy and the end motif diversity score (MDS) to distinguish between cancer and non-cancer samples, as well as between different cancer types [7].
Biological Origins and Release Mechanisms
cfDNA is continuously shed into the bloodstream by all cells in the body, but its release is influenced by a complex interplay of biological mechanisms. The primary mechanisms involved in cfDNA release include:
- Apoptosis (Programmed Cell Death): This is considered the major source of cfDNA, producing characteristic short fragments of about 147-200 bp [9] [2].
- Necrosis: This form of cell death results in the release of longer, more variable DNA fragments, approximately 10,000 bp in length, due to uncontrolled DNA breakdown [9].
- Active Secretion: Metabolically active cells can also secrete cfDNA directly. This actively released DNA is often associated with DNA-protein complexes or packaged within extracellular vesicles like exosomes and microvesicles, with fragment sizes ranging from 1,000 to 20,000 bp [9].
The relative contribution of these mechanisms can vary significantly based on pathophysiological conditions. For example, in cancer patients, the proportion of cfDNA derived from tumor cells (ctDNA) can increase, and its fragmentomic profile may differ from cfDNA derived from healthy cells due to altered chromatin structure in malignancies [3] [7]. Furthermore, specific cell populations, such as Cancer Stem Cells (CSCs), may contribute disproportionately to the cfDNA pool. Pioneering research on colon cancer cell lines has shown that cultures enriched with CSCs release greater amounts of cfDNA with a distinct fragment profile compared to non-enriched cultures [9].
Table 1: Summary of cfDNA Fragment Sizes and Associated Release Mechanisms
| Release Mechanism | Typical Fragment Sizes | Molecular Characteristics |
|---|---|---|
| Apoptosis | 147 - 200 bp [9] [2] | Mononucleosomal dominance (~167 bp) [2] |
| Necrosis | ~10,000 bp [9] | Longer, more heterogeneous fragments |
| Active Secretion | 1,000 - 20,000 bp [9] | Associated with proteins or extracellular vesicles |
Experimental Protocols for Plasma Processing and cfDNA Extraction
Standardized and robust protocols for plasma separation and cfDNA extraction are fundamental to the reliability and reproducibility of any downstream liquid biopsy application. The following section details a validated, high-throughput protocol.
Standardized Plasma Separation Protocol
A critical goal of plasma processing is to minimize contamination by genomic DNA from white blood cells, which can dilute the ctDNA signal and impair detection sensitivity. The protocol below, adapted from a clinical study involving 874 cancer patients, ensures the isolation of high-purity plasma [5].
Materials:
- Blood collection tubes (e.g., Streck Cell-Free DNA BCT tubes).
- Chilled swinging bucket and fixed-angle centrifuges.
- Refrigerated centrifuge (capable of 4°C).
- Piper tips and sterile conical tubes.
Step-by-Step Workflow:
- Blood Collection and Transport: Collect whole blood into appropriate preservative tubes (e.g., Streck BCT). Gently invert the tube 10 times immediately after collection. Transport at room temperature, avoiding agitation or pneumatic tube systems, and process within specified time windows (e.g., within 96 hours for Streck tubes) [5].
- First Centrifugation (Soft Spin): Gently mix the blood tube and place it in a chilled swinging bucket rotor. Centrifuge at 1,600 × g for 10 minutes at 4°C with no brake. This step separates plasma from blood cells and platelets [5].
- Plasma Transfer and Second Centrifugation (Hard Spin): Carefully transfer the supernatant (plasma) to a new sterile conical tube using a pipette, ensuring not to disturb the buffy coat layer. Centrifuge in a fixed-angle rotor at 10,000 × g for 10 minutes at 4°C with a soft brake. This pellets any remaining cells [5].
- Third Centrifugation (Final Clean-up): Transfer the supernatant to a new tube, leaving behind any pellet. Perform a final centrifugation under the same conditions as the second spin (10,000 × g, 10 minutes, 4°C). This three-spin protocol is designed to maximize the removal of cellular debris and minimize germline DNA contamination [5].
- Plasma Storage: Aliquot the final, clarified plasma into cryotubes and store at -80°C until cfDNA extraction.
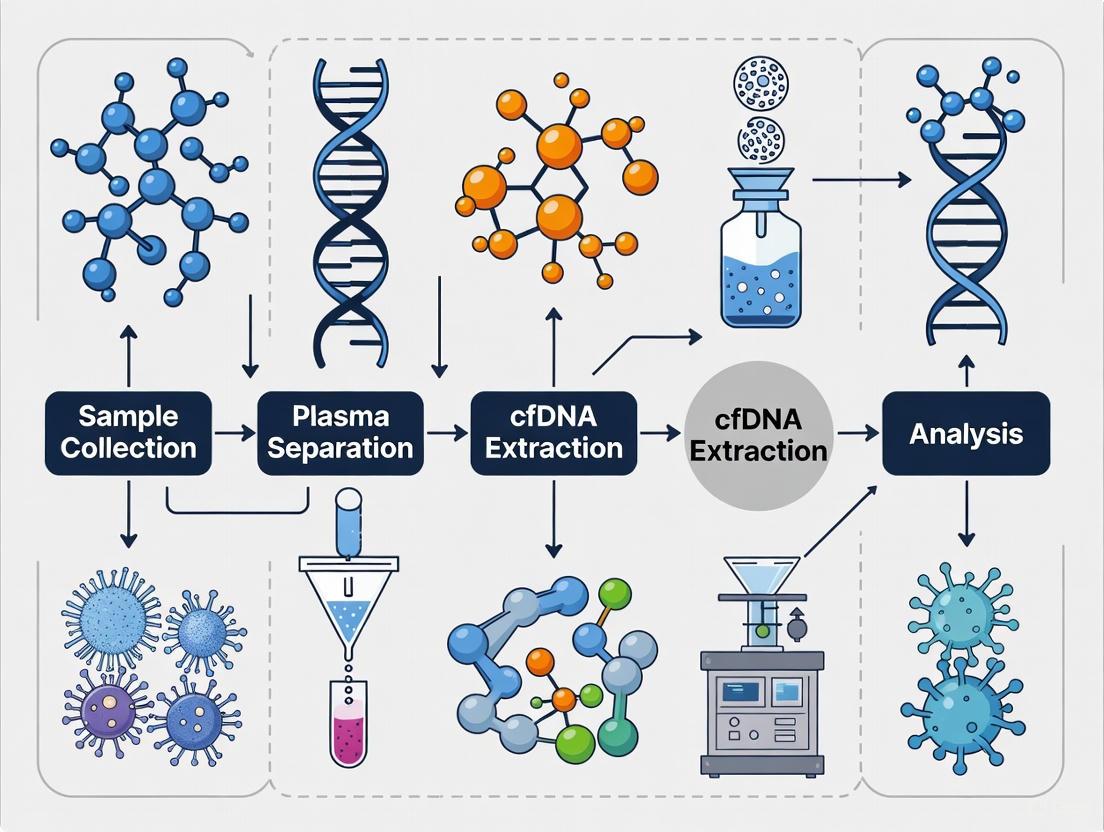
This workflow is summarized in the following diagram:
High-Throughput cfDNA Extraction Using Magnetic Beads
Magnetic bead-based extraction methods are favored for their efficiency, scalability, and compatibility with automation. The protocol below is validated for use with a single-use cartridge-based, magnetic bead-assisted system [2].
Materials:
- Processed plasma samples.
- Magnetic bead-based cfDNA extraction kit (e.g., from manufacturers like Anchor Molecular, nRichDx, or other validated suppliers).
- Liquid handling robot or manual magnetic stand.
- Elution buffer (e.g., TE buffer, nuclease-free water).
- Agilent TapeStation or Bioanalyzer for quality control.
Step-by-Step Workflow:
- Lysis and Binding: Mix the plasma sample with a lysis/binding buffer. This solution disrupts protein-DNA interactions and provides the appropriate chemical conditions for DNA to bind to the silica surface of the magnetic beads [2].
- Bead Binding: Add the magnetic silica beads to the lysate and incubate with mixing. During this step, the cfDNA fragments bind to the beads' surface.
- Magnetic Separation and Washes: Place the tube on a magnetic stand to capture the beads (and bound cfDNA). Carefully remove and discard the supernatant. Wash the bead pellet multiple times with a wash buffer to remove contaminants like proteins, salts, and other impurities [2] [6].
- Elution: Remove the final wash buffer and air-dry the bead pellet briefly. Add a low-salt elution buffer (e.g., TE buffer or nuclease-free water) to the beads and incubate to release the purified cfDNA. Separate the eluate containing the purified cfDNA from the beads using the magnetic stand.
- Concentration and Quality Control: Quantify the cfDNA yield using fluorescent assays (e.g., Qubit dsDNA HS Assay). Assess the fragment size distribution and profile using a microfluidic capillary electrophoresis system like the Agilent TapeStation with a High Sensitivity D5000 or D1000 screen tape [2]. A successful extraction should show a dominant peak at ~167 bp, indicating a high proportion of mononucleosomal cfDNA with minimal genomic DNA contamination.
The Scientist's Toolkit: Essential Reagents and Materials
Successful cfDNA research relies on a suite of specialized reagents and materials. The following table details key components for plasma processing and cfDNA analysis.
Table 2: Essential Research Reagents and Materials for cfDNA Analysis
| Item Category | Specific Examples | Function and Application |
|---|---|---|
| Blood Collection Tubes | Streck Cell-Free DNA BCT tubes; CellSave tubes; EDTA tubes [4] [5] | Stabilizes nucleated blood cells to prevent lysis and background gDNA release during transport and storage. |
| cfDNA Extraction Kits | Magnetic bead-based kits (e.g., from nRichDx, Anchor Molecular) [2] | Selective binding, washing, and elution of short-fragment cfDNA from plasma; enables high-throughput automation. |
| Reference Standards | Seraseq ctDNA Reference Material; AcroMetrix ctDNA plasma control; nRichDx cfDNA standard [2] | Validates extraction efficiency, assay performance, and variant detection accuracy; essential for QC and standardization. |
| Quantification & QC Kits | Agilent TapeStation HS D5000/D1000; Qubit dsDNA HS Assay [2] [5] | Measures cfDNA concentration and fragment size distribution; confirms sample quality and suitability for NGS. |
| Targeted Sequencing Panels | Commercial panels (e.g., Tempus xF, Guardant360 CDx, FoundationOne Liquid CDx, TruSight Oncology 500) [7] [5] | Enables deep sequencing of cancer-associated genes for variant calling and fragmentomics analysis in clinical samples. |
Analytical Validation and Downstream Applications
Quality Control and Validation Metrics
Robust analytical validation is required to ensure that extracted cfDNA is of sufficient quality for downstream molecular applications. Key validation parameters include:
- Yield and Concentration: The concentration of cfDNA in plasma from cancer patients can vary vastly, from 0.50 to 1132.9 ng/mL [5]. Recovery rates should be consistently high, as demonstrated by a bead-based system showing strong linearity with varying input volumes and concentrations of reference standards [2].
- Fragment Size Profile: A high-quality cfDNA extract should show a predominant peak at approximately 166 ± 5 bp [5]. The percentage of fragments within a specific size range (e.g., 140-200 bp) is a critical quality metric.
- Purity and Contamination: The extract should have minimal genomic DNA contamination, which manifests as a smear or a prominent peak above 1,000 bp on a fragment analyzer trace. Protein and salt impurities should also be minimized to prevent interference with enzymatic reactions in downstream steps [2] [6].
- Variant Detection Accuracy: Using reference materials with known variant allele frequencies (VAFs), the extraction and downstream NGS workflow must demonstrate high sensitivity and specificity for mutation detection, even at low VAFs (e.g., 0.1% - 1.0%) [2].
Application in Fragmentomics for Cancer Detection
A key application of extracted cfDNA is fragmentomics analysis, which moves beyond simple variant calling to infer cancer presence and type from fragmentation patterns. Research has shown that multiple fragmentomics metrics can be effectively analyzed using targeted sequencing panels already employed in clinical settings [7].
These metrics include:
- Normalized Fragment Read Depth: The fragment counts normalized to sequencing depth and region size. This has been identified as one of the top-performing metrics for predicting cancer phenotypes across different cohorts [7].
- Fragment Size Ratios and Proportions: This includes the fraction of small fragments (<150 bp) and the distribution of fragments across different size bins [7].
- End Motif Diversity: The analysis of the diversity of 4-mer sequences at the ends of cfDNA fragments [7].
Studies comparing these metrics have found that normalized depth across all exons in a panel generally allows for excellent prediction of cancer phenotypes, achieving average Area Under the Receiver Operating Characteristic curve (AUROC) values as high as 0.943 to 0.964 in distinguishing cancer from non-cancer samples [7]. This demonstrates that fragmentomics-based analysis of cfDNA does not necessarily require whole-genome sequencing and can be effectively integrated with existing targeted sequencing workflows.
Cell-free DNA (cfDNA) refers to short fragments of double-stranded DNA that circulate freely in the bloodstream, originating from various tissues and cell types through processes including apoptosis, necrosis, and active secretion [10] [11]. These fragments typically exhibit a characteristic size distribution peaking at approximately 166 base pairs, corresponding to DNA wound around nucleosomes [10] [12]. In healthy individuals, plasma cfDNA concentrations typically range from 1-100 ng/mL, though this can increase significantly in various disease states [13] [11].
The analysis of cfDNA has emerged as a cornerstone of liquid biopsy, enabling minimally invasive diagnostic, prognostic, and monitoring approaches across medical specialties [12] [11]. The applications of cfDNA analysis in precision medicine are diverse, spanning oncology (via circulating tumor DNA), non-invasive prenatal testing (NIPT) (via cell-free fetal DNA), and transplant rejection monitoring (via donor-derived cfDNA) [11]. This application note details the specific contexts, analytical methodologies, and protocols underpinning these three key applications, providing researchers with practical guidance for implementing these approaches in their laboratories.
Application Note: Oncology and Circulating Tumor DNA (ctDNA)
Background and Biological Basis
Circulating tumor DNA (ctDNA) represents the fraction of cfDNA specifically shed by tumor cells through various cell death mechanisms or active secretion [11]. ctDNA fragments often exhibit a bimodal size distribution, including shorter fragments (<150 bp) alongside longer DNA strands, and carry tumor-specific somatic mutations (e.g., in genes such as EGFR or TP53) that distinguish them from wild-type cfDNA derived from healthy cells [11]. Although ctDNA often constitutes less than 1% of total cfDNA, even in patients with advanced cancer, its detection and quantification provide a powerful tool for cancer management [13] [11].
Key Applications in Cancer Management
- Early Detection & Screening: Multi-cancer early detection (MCED) panels target specific methylation patterns and somatic mutations to identify multiple cancer types (e.g., lung, breast, colorectal) at early stages, particularly in high-risk populations [11].
- Treatment Selection & Personalized Therapy: Identification of targetable mutations (e.g., EGFR, KRAS, BRAF) in ctDNA guides selection of tyrosine kinase inhibitors or immunotherapy regimens, while also monitoring for emergence of resistance mutations (e.g., EGFR T790M in NSCLC) [11].
- Minimal Residual Disease (MRD) & Recurrence Monitoring: Detection of ctDNA after tumor resection predicts clinical relapse months before radiographic evidence appears, enabling dynamic risk stratification and identification of patients who may benefit from adjuvant therapy [11].
- Therapeutic Response Assessment: Declining ctDNA levels post-treatment correlate with tumor regression, while rising levels indicate progression or resistance, making ctDNA a valuable surrogate endpoint in clinical trials [11].
Representative Experimental Protocol: ctDNA Extraction and Analysis from Liquid Biopsy
Objective: To isolate and analyze ctDNA from patient blood samples for detection of tumor-specific mutations.
Materials:
- Streck Cell-Free DNA Blood Collection Tubes (or equivalent)
- QIAamp Circulating Nucleic Acid Kit (Qiagen) or MagMAX Cell-Free DNA Isolation Kit (Thermo Fisher)
- Qubit dsDNA HS Assay Kit (Thermo Fisher)
- Bioanalyzer High-Sensitivity DNA Kit (Agilent) or TapeStation
- Droplet digital PCR system or targeted NGS panel (e.g., Guardant360, Oncomine)
Procedure:
- Blood Collection & Processing:
- Collect 10 mL peripheral blood into Streck BCTs, which stabilize nucleated blood cells for up to 7 days at room temperature, preventing gDNA contamination [11].
- Process samples within 2-4 hours if using EDTA tubes [11].
- Perform double-centrifugation: First at 1,600 × g for 10 minutes at room temperature, followed by transfer of supernatant to a new tube and second centrifugation at 16,000 × g for 10 minutes to completely remove cellular debris [13] [14].
- Aliquot plasma into 1.5 mL tubes and store at -80°C if not extracting immediately.
ctDNA Extraction:
- Use bead-based extraction methods (e.g., MagMAX) for optimal recovery of short ctDNA fragments [11].
- Extract from 1-2 mL plasma using the QIAamp Circulating Nucleic Acid Kit according to manufacturer instructions [14].
- Elute in 50 μL elution buffer provided with the kit.
- Consider adding carrier RNA to improve recovery of rare ctDNA fragments, though this may affect downstream analysis [15] [11].
Quantification & Quality Control:
Downstream Mutation Analysis:
- For rare mutation detection, use ultra-sensitive techniques such as droplet digital PCR (ddPCR) capable of detecting variants at frequencies as low as 0.01% [10] [11].
- For broader mutation profiling, employ targeted NGS panels (e.g., Oncomine Lung cfTNA Assay) with high specificity (99% at 0.1% limit of detection) [14].
- Prepare libraries according to manufacturer specifications and sequence on appropriate platforms (e.g., Ion Torrent S5 System) [14].
- Apply bioinformatic filters (e.g., total mapped reads >3M, median read coverage >25,000) to ensure data reliability [14].
Expected Results and Interpretation
Successful ctDNA isolation should yield 1-10 ng of total cfDNA per mL of plasma from healthy individuals, with potentially higher yields in cancer patients [13]. The fragment size profile should show a predominant peak at ~166 bp, with possible additional shorter fragments in cancer samples [11]. In NSCLC patients, for example, detection of EGFR mutations in ctDNA can guide TKI therapy with high concordance to tissue testing [11]. The BESPOKE-CRC trial demonstrated that ctDNA-guided therapy reduced unnecessary chemotherapy by 48% in colorectal cancer patients, highlighting the clinical utility of this approach [11].
Figure 1: ctDNA Analysis Workflow for Oncology Applications. The process begins with tumor DNA release into bloodstream, followed by standardized pre-analytical and analytical phases to enable clinical application of results.
Application Note: Non-Invasive Prenatal Testing (NIPT)
Background and Biological Basis
Cell-free fetal DNA (cffDNA) in maternal plasma originates from apoptotic placental cells (trophoblasts) and represents approximately 3-15% of total cfDNA in maternal circulation, depending on gestational age [10] [11]. cffDNA becomes detectable from approximately 4 weeks of gestation and is rapidly cleared from maternal circulation after delivery, with a half-life of less than 2 hours [10] [11]. This rapid clearance enables pregnancy-specific monitoring and facilitates subsequent pregnancies without interference.
Key Applications in Prenatal Care
- Aneuploidy Detection: Screening for fetal chromosomal abnormalities including Trisomy 21 (Down Syndrome), Trisomy 18 (Edwards Syndrome), and Trisomy 13 (Patau Syndrome) with >99% sensitivity and specificity for T21 [11] [16].
- Fetal RhD Genotyping: Determination of fetal Rhesus D status in RhD-negative women, allowing targeted use of antenatal anti-D prophylaxis and avoiding unnecessary treatment for women carrying RhD-negative fetuses [10].
- Fetal Sex Determination: Early identification of fetal sex for X-linked genetic disorders [11].
- Microdeletion Detection: Identification of subchromosomal deletions (e.g., 22q11.2 deletion syndrome) [11].
Representative Experimental Protocol: cffDNA Extraction and Analysis for NIPT
Objective: To isolate and analyze cffDNA from maternal plasma for detection of fetal aneuploidies.
Materials:
- K2 EDTA blood collection tubes (Sarstedt)
- QIAamp Circulating Nucleic Acid Kit (Qiagen) or MGIEasy Circulating DNA Isolation Kit (MGI)
- Qubit dsDNA HS Assay Kit (Thermo Fisher)
- Next-generation sequencing platform (e.g., Illumina, BGI)
- Bioinformatics analysis software for chromosomal dosage assessment
Procedure:
- Blood Collection & Processing:
- Collect peripheral blood from pregnant women (gestational age ≥12 weeks) into K2 EDTA tubes [16].
- Process samples within 2-8 hours of collection to prevent cellular DNA contamination [16].
- Perform double-centrifugation: 1,600 × g for 10 minutes at 20°C followed by 6,000 × g for 10 minutes at 20°C [12].
- Aliquot plasma and store at -80°C if not proceeding immediately to extraction.
cffDNA Extraction:
Library Preparation & Sequencing:
- Prepare sequencing libraries using kits specifically validated for low-input cfDNA (e.g., xGen cfDNA & FFPE DNA Library Prep Kit) [17].
- Use unique molecular identifiers to account for amplification bias.
- Perform shallow whole-genome sequencing (0.1-1x coverage) on next-generation sequencing platforms.
Bioinformatic Analysis:
- Align sequences to reference genome and assign to chromosomes.
- Calculate normalized chromosomal representation and identify deviations from euploid expectation.
- Apply statistical algorithms to determine aneuploidy status with 99% confidence.
Expected Results and Interpretation
Successful NIPT analysis should yield total cfDNA concentrations of approximately 4-5 ng/mL plasma, with fetal fraction typically >4% for reliable aneuploidy detection [16]. In a clinical validation study of 304 samples, the method demonstrated 100% sensitivity, 99.65% specificity, and 95% positive predictive value for detection of fetal aneuploidies [16]. This high performance enables significant reduction in invasive diagnostic procedures (e.g., amniocentesis) while maintaining detection accuracy.
Application Note: Transplant Rejection Monitoring
Background and Biological Basis
Donor-derived cfDNA (dd-cfDNA) is released into the recipient's bloodstream following organ injury or rejection in transplant patients [11]. During rejection episodes, apoptotic and necrotic cells of donor origin release DNA fragments that can be distinguished from recipient cfDNA through genetic differences [11]. Elevated dd-cfDNA levels serve as an early indicator of allograft injury, preceding clinical symptoms and conventional diagnostic markers.
Key Applications in Transplant Management
- Acute Rejection Detection: Identification of ongoing immune-mediated graft injury with reported area under the curve (AUC) of 0.91, making it a reliable biomarker for early rejection detection [11].
- Chronic Allograft Injury: Monitoring for long-term graft deterioration and fibrosis development.
- Therapy Guidance: Informing immunosuppression adjustment and targeting of invasive biopsies.
- Infection Versus Rejection Differentiation: Helping distinguish between rejection episodes and other causes of graft dysfunction.
Representative Experimental Protocol: dd-cfDNA Quantification for Rejection Monitoring
Objective: To isolate and quantify dd-cfDNA in plasma from transplant recipients for detection of allograft rejection.
Materials:
- EDTA blood collection tubes
- QIAamp Circulating Nucleic Acid Kit (Qiagen)
- Qubit dsDNA HS Assay Kit (Thermo Fisher)
- SNP-based NGS panel or digital PCR assays for donor-recipient differentiation
- Bioinformatics pipeline for dd-cfDNA calculation
Procedure:
- Blood Collection & Processing:
cfDNA Extraction:
Donor-Derived cfDNA Quantification:
- Method A (SNP-based NGS): Use targeted sequencing of informative single nucleotide polymorphisms (SNPs) that differ between donor and recipient to calculate the fraction of dd-cfDNA.
- Method B (Digital PCR): Employ allele-specific assays for donor-recipient distinguishing polymorphisms if genotype information is available.
- Include appropriate controls and calibrators in each run.
Data Analysis:
- Calculate dd-cfDNA fraction as (donor-derived molecules / total cfDNA molecules) × 100.
- Compare to established clinical thresholds: <1% generally indicates absence of active rejection, while elevated levels (>1%) correlate with rejection risk.
Expected Results and Interpretation
In stable transplant patients without rejection, dd-cfDNA typically comprises <1% of total cfDNA [11]. During active rejection, this fraction can increase significantly, providing an early diagnostic marker that precedes clinical manifestations. Studies demonstrate that dd-cfDNA monitoring offers real-time, dynamic assessment of graft health, enabling timely intervention and potentially reducing the need for invasive surveillance biopsies [11].
Comparative Performance of Methodologies
Table 1: Comparison of cfDNA Extraction Methods Across Applications
| Extraction Method | Technology | Best Suited Application | Relative Yield | Fragment Size Recovery | Automation Potential |
|---|---|---|---|---|---|
| QIAamp Circulating Nucleic Acid Kit | Silica membrane | Transplant monitoring, NIPT | High [12] [18] | Good for >150 bp [11] | Semi-automated (QIAcube) [15] |
| MagMAX Cell-Free DNA Isolation Kit | Magnetic beads | Oncology (ctDNA) | Moderate [12] | Excellent for <150 bp [11] | Fully automated [12] |
| NucleoSpin Plasma XS | Spin column | Low volume samples | Low [12] | Standard | Manual |
| QIAamp MinElute ccfDNA Kit | Mixed | General purpose | Moderate [12] | Standard | Semi-automated [15] |
| MagNA Pure 24 System | Magnetic beads (automated) | High-throughput labs | Moderate [10] [12] | Smaller fragments [10] | Fully automated [12] |
Table 2: Analytical Performance Across Precision Medicine Applications
| Application | Sample Input | Key Analytical Methods | Sensitivity | Specificity | Turnaround Time |
|---|---|---|---|---|---|
| Oncology (ctDNA) | 1-4 mL plasma [13] | ddPCR, Targeted NGS [11] | 0.01% VAF [11] | >99% [14] | 3-5 days |
| NIPT | 1 mL plasma [12] | Shallow WGS [11] | >99% (T21) [11] | >99% [11] | 5-7 days |
| Transplant Monitoring | 2-4 mL plasma [12] | SNP-based NGS, ddPCR [11] | AUC 0.91 [11] | High [11] | 3-5 days |
The Scientist's Toolkit: Essential Research Reagents
Table 3: Key Research Reagents for cfDNA Applications
| Reagent/Category | Specific Examples | Function & Application Notes |
|---|---|---|
| Blood Collection Tubes | Streck Cell-Free DNA BCT, EDTA-K2 tubes [13] [11] | Stabilize blood cells to prevent gDNA release; Streck: 7-day stability; EDTA: process within 2-4h [11] |
| Extraction Kits | QIAamp Circulating Nucleic Acid Kit, MagMAX cfDNA Isolation Kit [12] | High purity cfDNA isolation; silica columns yield more; beads better for short fragments [12] [11] |
| Quantification Assays | Qubit dsDNA HS Assay, Bioanalyzer/TapeStation [13] [12] | Fluorometric quantification and fragment sizing; essential for QC pre-downstream analysis |
| Library Prep Kits | xGen cfDNA & FFPE DNA Library Prep Kit [17] | Optimized for low-input, fragmented cfDNA; enables high library complexity from limited samples |
| Downstream Analysis | Oncomine cfTNA Assays, ddPCR mutation assays [11] [14] | Targeted detection of cancer mutations; ultra-sensitive for rare variant detection |
| Automation Systems | QIAcube Connect, QIAsymphony, MagNA Pure 24 [15] [12] | Standardize workflow, increase throughput, reduce hands-on time and variability |
The isolation and analysis of cfDNA has revolutionized precision medicine across oncology, prenatal diagnostics, and transplant monitoring. Successful implementation requires careful consideration of pre-analytical variables, including blood collection methodology, processing protocols, and extraction techniques optimized for specific applications [13] [12]. The QIAamp Circulating Nucleic Acid Kit consistently demonstrates high performance across multiple applications, while bead-based methods may offer advantages for ctDNA recovery [12] [18].
Each clinical application demands distinct analytical approaches: ultra-sensitive mutation detection for oncology, chromosomal dosage analysis for NIPT, and donor-specific fraction quantification for transplant monitoring [11]. As these technologies continue to evolve, standardization of protocols and validation of clinical utility remain essential for widespread adoption. The workflows and methodologies detailed in this application note provide researchers with a foundation for implementing robust cfDNA analysis in their precision medicine initiatives.
Figure 2: Unified cfDNA Workflow for Precision Medicine Applications. A standardized pre-analytical phase branches into application-specific analytical methods, ultimately supporting clinical decision-making across multiple medical specialties.
The integrity of cell-free DNA (cfDNA) research is fundamentally dependent on the pre-analytical phase, which encompasses all procedures from patient preparation to sample processing. Within the context of plasma processing for cfDNA extraction, the choice of blood collection tubes, anticoagulants, and venipuncture techniques directly influences analytical outcomes by affecting cfDNA yield, fragment size distribution, and the degree of genomic DNA contamination [2] [19]. Variations in these initial steps can introduce irreparable bias, compromising the validity of downstream molecular applications such as next-generation sequencing (NGS) and quantitative PCR (qPCR) [20] [2]. This document provides detailed application notes and standardized protocols to control these critical pre-analytical variables, ensuring the reliability and reproducibility of cfDNA data for research and drug development.
Blood Collection Tube Selection and Anticoagulants
The selection of an appropriate blood collection tube is a primary determinant of cfDNA sample quality. Tubes are characterized by their anticoagulant mechanisms and their ability to stabilize nucleated blood cells to prevent the release of genomic DNA, which can dilute the rare cfDNA signal of interest [19].
Table 1: Blood Collection Tubes for cfDNA Analysis
| Tube Type (Additive) | Mechanism of Action | Primary Use in cfDNA Research | Key Performance Metrics (cfDNA Yield & Stability) | Draw Volume Considerations |
|---|---|---|---|---|
| K2EDTA | Chelates calcium to prevent coagulation [21] [22]. | Standard processing; requires rapid plasma isolation (<1-2 hours) [19]. | Yield increases significantly over time if plasma is not separated promptly (e.g., from 2.41 ng/mL at 0h to 68.19 ng/mL at 168h), indicating gDNA contamination [19]. | Must be filled to nominal volume (e.g., 4-5 mL) to ensure correct blood-to-anticoagulant ratio [23] [21]. |
| Cell-Free DNA BCT (Streck) | Crosslinks cellular membranes to stabilize nucleated cells, preventing lysis and gDNA release [19]. | Long-term stability; allows for extended sample transport (up to 7 days) [2] [19]. | High initial yield (2.74 ng/mL at 0h) with minimal increase over 168h, demonstrating superior cellular stabilization [19]. | Standard 10 mL tube; fill volume is critical for maintaining osmotic balance and cellular integrity. |
| PAXgene Blood ccfDNA | Prevents apoptosis and stabilizes cells [19]. | Long-term stability studies. | Moderate initial yield (1.66 ng/mL) with a 49.4% increase by 168h, suggesting less effective stabilization than Streck tubes [19]. | Follow manufacturer's fill volume precisely. |
| Sodium Citrate | Chelates calcium to prevent coagulation [24] [25]. | Coagulation testing; sometimes used in cfDNA studies. | Not as widely characterized for cfDNA as other tubes. Stability is dependent on correct 9:1 blood-to-anticoagulant ratio [24] [21]. | Critical fill volume; under-filling prolongs clotting times and may affect cfDNA quality [24] [25]. |
Protocol: Comparative Evaluation of Blood Collection Tubes for cfDNA Yield and Purity
Objective: To systematically evaluate the impact of different blood collection tubes and processing delays on cfDNA yield, fragment size, and gDNA contamination.
Materials:
- Research Reagent Solutions:
- K2EDTA tubes (e.g., BD Vacutainer)
- Cell-Free DNA BCT tubes (Streck)
- PAXgene Blood ccfDNA tubes (Qiagen)
- DNA-free plasma (e.g., Zeptometrix) for spike-in controls
- cfDNA reference standard (e.g., nRichDx, Seraseq ctDNA complete)
- Magnetic bead-based cfDNA extraction kit (e.g., for QIAsymphony SP)
- Qubit dsDNA HS Assay Kit (Fluorometric analysis)
- qPCR reagents and primers (e.g., for short (60-74bp) and long (>187bp) amplicons) [19]
Methodology:
- Blood Collection: After obtaining informed consent, draw blood from a cohort of healthy volunteers (e.g., n=20). Collect blood into each of the four tube types (K2EDTA, Streck, PAXgene, Citrate) following the correct order of draw to prevent cross-contamination [25].
- Processing Time Course: For each tube type, process aliquots at predefined time points:
- T0: Process within 60 minutes of draw [19].
- T48: Store tubes upright at room temperature and process at 48 hours.
- T168: Store tubes upright at room temperature and process at 168 hours.
- Plasma Isolation: Centrifuge tubes using a standardized, validated protocol.
- cfDNA Extraction: Extract cfDNA from all plasma samples (e.g., 1-4 mL input volume) using a validated magnetic bead-based, high-throughput automated system according to the manufacturer's instructions [2].
- Quality and Quantity Assessment:
- Concentration: Measure cfDNA concentration using both fluorometric (e.g., Qubit) and qPCR assays targeting short fragments (e.g., 74bp) [19].
- Purity/Contamination: Assess gDNA contamination by:
- Calculating the ratio of long (e.g., 445bp) to short (e.g., 74bp) amplicons in qPCR. A higher ratio indicates cellular DNA contamination [19].
- Analyzing fragment size distribution using parallel capillary electrophoresis (e.g., Agilent TapeStation) to visualize the characteristic ~167 bp cfDNA peak and detect high molecular weight gDNA [2] [19].
- Integrity: Determine the fragment size profile and the presence of mono-/di-nucleosomal fragments via capillary electrophoresis [2].
Data Analysis: Compare cfDNA yields and gDNA contamination levels across tube types and time points using paired statistical tests (e.g., paired t-test). The optimal tube will show high cfDNA yield at T0 with minimal increase and low gDNA contamination over time.
Blood Draw Techniques and Sample Handling
The technique used during venipuncture and the subsequent handling of samples are critical pre-analytical variables that can directly alter analyte composition and compromise sample quality for cfDNA analysis [23] [26].
Key Variables and Their Effects
- Tourniquet Application and Fist Clenching: Prolonged tourniquet placement (>1 minute) and repeated fist clenching can cause hemoconcentration and lead to pseudohyperkalemia due to potassium efflux from forearm muscle cells [23]. This alteration in the blood matrix can potentially affect the release and composition of cfDNA.
- Order of Draw: The sequence in which blood collection tubes are filled is crucial to prevent cross-contamination with additives from previous tubes. The Clinical and Laboratory Standards Institute (CLSI) guideline GP41 provides the recommended order [25].
- Tube Mixing: Upon collection, blood tubes must be inverted gently several times (typically 5-10 times) to ensure complete dissolution and mixing of the anticoagulant with blood. Inadequate mixing will lead to clot formation, rendering the sample unsuitable for analysis [26] [24]. Overly vigorous mixing can cause hemolysis [26].
- Sample Transport and Storage: Temperature and time until processing are critical.
- K2EDTA tubes: Must be processed ideally within 1-2 hours to prevent gDNA contamination from leukocyte lysis. If processing is delayed beyond this, storage at 4°C may slow degradation, but is not a long-term solution [19].
- Streck-type preservative tubes: Can be stored and transported at room temperature for up to 7-14 days, depending on the manufacturer's specifications [2] [19].
The following workflow summarizes the critical decision points and steps for proper blood collection and processing for cfDNA analysis:
Protocol: Validation of Sample Mixing and Centrifugation Parameters
Objective: To establish a standardized and validated protocol for sample mixing and plasma preparation that ensures sample homogeneity and minimizes cell lysis.
Materials:
- Rocking- and rotary-type mechanical mixers
- Clinical centrifuge capable of 2,000 × g and 16,000 × g
- Timer
- Transfer pipettes
- Secondary polypropylene storage tubes [24]
Methodology:
- Mixing Validation:
- Collect blood into K2EDTA tubes from healthy volunteers (n=10).
- Immediately upon collection, invert each tube 8-10 times using a consistent, gentle wrist motion to mix.
- Prior to analysis, homogenize samples using a rotary-type mechanical mixer for 5 minutes.
- Visually inspect tubes for clots. Compare hematology parameters (e.g., hemoglobin, WBC, platelet count) between manually inverted and mechanically mixed aliquots to ensure homogeneity [26].
- Centrifugation Validation:
- Critical: Do not use refrigerated centrifuges for coagulation or cfDNA samples, as RPMs differ from g-forces at different temperatures, leading to inconsistent pellets and potential platelet contamination [24].
- Centrifuge K2EDTA tubes at 2,000 × g for 10-20 minutes at room temperature.
- Carefully transfer the supernatant plasma to a polypropylene secondary tube, avoiding the buffy coat layer.
- Perform a second centrifugation of the plasma at 16,000 × g for 10 minutes at room temperature to obtain platelet-poor plasma (platelet count < 10,000/µL) [24] [2].
- Aliquot the cleared plasma into secondary tubes for immediate extraction or frozen storage at -80°C.
Data Analysis: Successful mixing is confirmed by consistent hematology results and the absence of microclots. Successful centrifugation is validated by achieving a platelet count of < 10,000/µL in the plasma aliquot, which is critical for accurate downstream cfDNA analysis and for preventing the neutralization of heparin in certain assays [24].
The Scientist's Toolkit: Essential Research Reagent Solutions
Table 2: Key Materials for Pre-analytical cfDNA Workflow
| Item | Function | Example Use Case & Rationale |
|---|---|---|
| Streck Cell-Free DNA BCT | Preserves blood sample by stabilizing nucleated cells, preventing gDNA release. | Essential for multi-center trials or when transport delays >2 hours are anticipated. Enables room temperature shipping [19]. |
| Magnetic Bead-based cfDNA Extraction Kit | Automated, high-throughput isolation of high-quality, short-fragment cfDNA. | Preferred for consistency and scalability in large studies. Provides high cfDNA recovery rates suitable for low-concentration samples [2]. |
| cfDNA Reference Standard | Synthetic cfDNA with known mutations and fragment sizes for spike-in recovery experiments. | Used to validate the entire workflow (extraction to detection), calculate recovery efficiency, and monitor assay performance [2]. |
| DNA-free Plasma | Plasma matrix devoid of endogenous cfDNA for creating standard curves. | Serves as a negative control and a matrix for spiking reference standards to assess extraction efficiency without background interference [2]. |
| qPCR Assays (Short & Long Amplicons) | Quantify total cfDNA and assess gDNA contamination by amplifying targets of different lengths. | Short assays (e.g., 60-74bp) quantify cfDNA; long assays (e.g., >187bp) detect gDNA contamination. The ratio indicates sample purity [19]. |
| Capillary Electrophoresis System | Analyzes cfDNA fragment size distribution and integrity. | Confirms the presence of the characteristic ~167 bp nucleosomal peak and the absence of high molecular weight gDNA, verifying sample quality [2]. |
The pursuit of reliable and reproducible cfDNA data for cancer detection, therapeutic monitoring, and other research applications demands rigorous standardization of the pre-analytical phase. The protocols and application notes detailed herein provide a framework for controlling critical variables related to blood collection tubes, anticoagulants, and draw techniques. Adherence to these standardized workflows, coupled with the use of appropriate research reagents and quality control measures, is paramount for minimizing pre-analytical artifacts and ensuring that analytical results accurately reflect the patient's clinical status, thereby strengthening the validity of research findings in cfDNA analysis.
The analysis of cell-free DNA (cfDNA) has emerged as a powerful tool in liquid biopsy, with applications spanning from oncology to cardiovascular disease [27] [28]. However, the reliable detection and analysis of cfDNA are profoundly influenced by pre-analytical variables, including centrifugation protocols, storage temperatures, and processing timelines [29] [30] [31]. The impact of these factors is particularly critical given the low abundance and fragmented nature of cfDNA, which typically exists at concentrations below 10 ng/mL in healthy individuals and features a characteristic fragment size of approximately 167 base pairs [19]. This application note provides detailed, evidence-based protocols for sample handling to ensure the integrity and stability of cfDNA throughout the pre-analytical phase, with specific recommendations framed within the context of plasma processing for cfDNA extraction research.
Centrifugation Protocols for Optimal cfDNA Yield and Purity
Centrifugation is a critical step in plasma preparation, directly influencing cfDNA yield, quality, and the degree of genomic DNA (gDNA) contamination from blood cells [29]. The choice of protocol must balance the recovery of sufficient cfDNA concentration against the need to minimize cellular DNA contamination.
Comparative Analysis of Centrifugation Strategies
A systematic comparison of five centrifugation protocols revealed significant differences in cfDNA concentration and DNA integrity based on centrifugation speed, time, and the number of steps [29]. The table below summarizes the performance characteristics of these protocols when used with common blood collection tubes.
Table 1: Impact of Centrifugation Protocols on cfDNA Parameters in Different Blood Collection Tubes
| Protocol ID | Protocol Specifications | Tube Type | cfDNA Yield | gDNA Contamination | Recommended Use |
|---|---|---|---|---|---|
| CPBasic [29] | 1 step: 10 min @ 400 g | EDTA | High | High | Not recommended for cfDNA alone |
| CPPlat [29] | 3 steps: 20 min @ 120 g, 20 min @ 360 g, 5 min @ 360 g (with PBS wash) | EDTA | High quality | Low | Optimal for combined cfDNA/cfRNA studies |
| CPStreck [29] | 2 steps: 10 min @ 1600 g, 10 min @ 6000 g | Streck | High quality | Low | Optimal for cfDNA with Streck tubes |
| CPCEN [29] | 2 steps: 10 min @ 1900 g, 10 min @ 16,000 g (at 4°C) | EDTA | Good quality | Low | Good for cfDNA; requires refrigeration |
| CPAdCEN [29] | 2 steps: 10 min @ 1900 g, 10 min @ 16,000 g (Room Temperature) | EDTA | Good quality | Low | Good for cfDNA; simplified temperature control |
Detailed Experimental Protocol: Two-Step High-Speed Centrifugation
Principle: A two-step centrifugation protocol effectively separates plasma from cellular components while minimizing leukocyte lysis, which is a primary source of contaminating gDNA [29] [30].
Materials:
- Fresh whole blood collected in K₂EDTA tubes or specialized cfDNA blood collection tubes (e.g., Streck Cell-Free DNA BCT, Roche Cell-Free DNA Collection Tubes).
- Centrifuge capable of maintaining 4°C (for refrigerated protocols) and achieving forces up to 16,000× g.
- Low-binding micropipettes and tubes.
Procedure:
- First Centrifugation (Plasma Separation):
- Centrifuge freshly drawn blood samples at 1,600–2,000 × g for 10 minutes at room temperature [29] [30].
- Use a smooth braking profile to prevent disturbance of the buffy coat layer [29].
- Carefully transfer the upper plasma layer to a new tube using a pipette, avoiding the buffy coat and cellular pellet.
- Second Centrifugation (Plasma Clarification):
Note: The necessity of a second centrifugation step is evidenced by survey data, which shows that 60% of clinical laboratories employ a two-step process for plasma separation from EDTA tubes [30].
Storage Temperature and Timeline Stability
The stability of cfDNA in blood samples before processing is highly dependent on the type of blood collection tube used, storage temperature, and time elapsed before plasma separation.
Quantitative Stability Across Tube Types and Conditions
The following table synthesizes data from multiple studies on how storage conditions affect cfDNA concentration and stability.
Table 2: Effects of Storage Time and Temperature on cfDNA Stability in Different Blood Collection Tubes
| Tube Type | Stabilization Mechanism | Storage Condition | Max Stable Duration (cfDNA) | Key Findings |
|---|---|---|---|---|
| K₂EDTA Tubes [31] [19] | Anticoagulant only | Room Temperature | < 6 hours | cfDNA levels increase significantly after 6h; +4°C slows but does not prevent increase |
| Cell-Free DNA BCT (Streck) [31] [19] | Cell stabilizer | Room Temperature | Up to 7 days | cfDNA concentrations remain stable; minimal gDNA release |
| Roche Cell-Free DNA Tube [32] | Not specified | Room Temperature or 4-8°C | 48 hours | No significant change in median ccfDNA concentration after 24h/48h at RT or 4-8°C |
| PAXgene Blood ccfDNA Tube [19] | Prevents apoptosis | Room Temperature | 7 days | Moderate increase (~49%) in cfDNA yield after 7 days |
| Norgen cf-DNA/cf-RNA Tube [19] | Osmotic cell stabilizer | Room Temperature | 7 days | Stable cfDNA yield over time |
Detailed Experimental Protocol: Evaluating Storage Stability
Principle: This protocol assesses the stability of cfDNA in whole blood under various storage conditions to define acceptable pre-analytical windows [32] [19].
Materials:
- Blood collection tubes (K₂EDTA and preservative tubes, e.g., Streck, Roche).
- Temperature-controlled storage environments (e.g., 4°C refrigerator, room temperature incubator).
- Equipment for plasma separation and cfDNA extraction and quantification (e.g., QIAsymphony SP, ddPCR/qPCR).
Procedure:
- Sample Collection and Aliquoting:
- Collect venous blood from participants into multiple types of blood collection tubes (e.g., K₂EDTA, Streck BCT, Roche Cell-Free DNA tube).
- Invert tubes 8-10 times gently immediately after collection to ensure proper mixing with additives [30].
Storage Conditions:
Plasma Processing and Analysis:
- At each time point, process the tubes according to a standardized centrifugation protocol (e.g., the two-step method described in Section 2.2).
- Extract cfDNA from all plasma samples using a consistent method (e.g., QIAamp Circulating Nucleic Acid Kit) [18].
- Quantify total cfDNA concentration using droplet digital PCR (ddPCR) or quantitative PCR (qPCR) [29] [32].
- Assess gDNA contamination by evaluating DNA integrity, for example, via the ratio of long (>400 bp) to short (~60-100 bp) amplicons in qPCR assays [19] or by fragment analysis.
Expected Results: Blood in K₂EDTA tubes shows a time-dependent increase in cfDNA concentration when processing is delayed, especially at room temperature, indicating leukocyte lysis [31] [19]. In contrast, blood in preservative tubes (Streck, Roche) should demonstrate stable cfDNA concentrations with minimal gDNA contamination across the tested time points, even at room temperature [32] [31] [19].
Integrated Workflow for cfDNA Sample Processing
The following diagram synthesizes the key decision points and recommendations for an optimal cfDNA processing workflow, from blood draw to plasma storage.
Diagram 1: Integrated workflow for optimal cfDNA sample processing, highlighting critical decision points for tube selection and processing timelines.
The Scientist's Toolkit: Essential Research Reagents and Materials
Successful cfDNA research relies on carefully selected reagents and materials designed to maintain analyte integrity throughout the pre-analytical phase.
Table 3: Essential Research Reagent Solutions for cfDNA Analysis
| Item | Function | Examples & Key Features |
|---|---|---|
| Blood Collection Tubes with Preservative [32] [31] [19] | Stabilizes nucleated blood cells to prevent lysis and gDNA release, enabling delayed processing. | Streck Cell-Free DNA BCT: Chemical crosslinker.Roche Cell-Free DNA Collection Tube: Proprietary stabilizer.PAXgene Blood ccfDNA Tube: Prevents apoptosis. |
| cfDNA Extraction Kits [18] | Isolate and purify short, low-concentration cfDNA fragments from plasma efficiently. | QIAamp Circulating Nucleic Acid Kit: High recovery rates, manual or automated.QIAsymphony DSP Circulating DNA Kit: Automated, high throughput. |
| Automated Extraction Systems [18] [19] | Provide consistency, reduce human error, and increase throughput in sample processing. | QIAsymphony SP: Magnetic bead-based, compatible with large sample volumes. |
| Quantification Assays [27] [19] | Precisely measure low cfDNA concentrations and assess fragment size distribution and purity. | Droplet Digital PCR (ddPCR): Absolute quantification, high sensitivity.qPCR with Short/Long Amplicons: Assesses gDNA contamination.Capillary Electrophoresis: Analyzes fragment size profile. |
The reliability of cfDNA analysis is fundamentally rooted in robust pre-analytical practices. This document provides detailed, evidence-based protocols demonstrating that the choice of centrifugation protocol directly impacts cfDNA yield and purity, while the selection of blood collection tubes and storage conditions determines the stability of the analyte before processing. Adherence to the optimized workflows and recommendations outlined herein—particularly the use of two-step centrifugation and appropriate preservative tubes for logistical flexibility—will enable researchers to minimize pre-analytical variability, thereby ensuring the generation of high-quality, reproducible cfDNA data for downstream applications in clinical research and drug development.
cfDNA Extraction Methodologies: From Manual Kits to Automated High-Throughput Systems
Within clinical and research diagnostics, the analysis of cell-free DNA (cfDNA) from liquid biopsies has emerged as a transformative tool for non-invasive prenatal testing, oncology, and transplantation medicine [12] [16]. The reliability of these advanced applications is fundamentally dependent on the pre-analytical phase, specifically the efficiency of cfDNA extraction. The isolation of cfDNA is particularly challenging due to its low abundance (often less than 10 ng/mL of plasma in healthy individuals) and highly fragmented nature, with a dominant peak around 167 base pairs [19] [33]. Among the various extraction chemistries available, silica-based columns and magnetic bead-based methods have become the most prevalent. This application note provides a detailed comparative analysis of these two core technologies, presenting structured quantitative data, detailed experimental protocols, and workflow visualizations to guide researchers and scientists in selecting and optimizing methods for plasma processing in cfDNA research.
Fundamental Binding Principles
- Silica Column Technology: This method relies on the selective binding of DNA to a silica-based membrane in the presence of chaotropic salts, which disrupt hydrogen bonding and facilitate nucleic acid adsorption. Under high-salt conditions, the phosphate backbone of DNA binds to the silica surface. Following a series of washes to remove contaminants, the purified DNA is eluted in a low-ionic-strength buffer such as Tris-EDTA (TE) or nuclease-free water [34] [35].
- Magnetic Bead Technology: This approach utilizes superparamagnetic silica particles coated with functional groups. In the presence of a binding buffer containing polyethylene glycol (PEG) and high salt concentrations, DNA adsorbs to the bead surface, forming an ionic bridge. An external magnetic field is then applied to separate the bead-DNA complexes from the solution. After washing, the DNA is released into the elution buffer once the ionic bridge is dissolved in a low-salt environment [12] [16].
Quantitative Performance Metrics
Direct comparisons of commercial kits reveal significant differences in performance, crucial for application-specific decisions. A 2022 study evaluating six commercial kits demonstrated yield variations of up to 4.3 times between the highest and lowest performers [12].
Table 1: Comparative Performance of Representative cfDNA Extraction Kits
| Product Name | Technology | Automation Potential | Input Volume (Plasma) | Elution Volume | Mean Extraction Efficiency (%) [33] | Key Performance Notes |
|---|---|---|---|---|---|---|
| QIAamp Circulating Nucleic Acid Kit | Silica Spin Column | Manual (Low) | 1-5 mL | 50-150 µL | 84.1% (± 8.17) | Highest yield and reproducibility; superior for low-abundance targets [12] [18] |
| NucleoSpin Plasma XS | Silica Spin Column | No | < 0.24 mL | 5-30 µL | - | Lower yield due to small input volume; high-sensitivity protocol [12] |
| MagMAX Cell-Free DNA Isolation Kit | Magnetic Beads | Yes | 0.5-10 mL | 15-50 µL | - | Cheaper, faster, and easier to upscale [12] |
| MagNA Pure 24 Total NA Isolation Kit | Magnetic Beads (Automated) | Fully Automated | 2 mL | 50/100 µL | - | High yield and reproducibility; suitable for high-throughput labs [12] |
| Zymo Quick-DNA Urine Kit | Magnetic Beads (Urine) | Yes | Urine Specimen | As specified | 58.7% (± 11.1) | Designed for urinary cfDNA; different size selectivity [33] |
Beyond yield, fragment size selectivity is a critical differentiator. While all major kits successfully isolate the characteristic mono-nucleosomal cfDNA (~167 bp), their efficiency in recovering shorter fragments varies. Magnetic bead systems, particularly those optimized for cfDNA, often demonstrate superior retention of short (<150 bp) DNA fragments, which is critical for detecting circulating tumor DNA (ctDNA) in oncology [36]. In contrast, some silica column methods may exhibit lower recovery efficiencies for these shorter species [36]. Furthermore, a study on urinary cfDNA highlighted that an in-house Q Sepharose (anion-exchange) method recovered a larger proportion of fragments below 90 bp compared to a commercial magnetic bead kit, underscoring that performance is also influenced by the sample matrix [33].
Detailed Experimental Protocols
Protocol 1: Silica-Based Membrane Extraction from Plasma
This protocol is adapted from the QIAamp Circulating Nucleic Acid Kit, a widely used reference method [34].
Materials and Reagents
- QIAamp Circulating Nucleic Acid Kit (Qiagen, Cat. No. 55114) or equivalent, containing: Lysis Buffer, Binding Buffer, Wash Buffer 1, Wash Buffer 2, and Elution Buffer.
- Proteinase K (often supplied with kit).
- Carrier RNA (provided with kit, essential for improving recovery of low-concentration cfDNA).
- 100% Ethanol and 100% Isopropanol (for buffer preparation).
- 1.5 mL DNA LoBind microcentrifuge tubes (Eppendorf).
- Vacuum manifold (e.g., QIAvac 24 Plus) or a standard microcentrifuge.
- Water baths or heating blocks set at 60°C and 56°C.
- Refrigerated centrifuge.
Step-by-Step Procedure
Buffer and Sample Preparation:
- Prepare working solutions as per kit instructions: Mix Binding Buffer concentrate with isopropanol. Combine Wash Buffer concentrates with the specified volumes of ethanol [34].
- Reconstitute carrier RNA in the provided Elution buffer to a concentration of 0.2 μg/μL. Add the required volume (e.g., 5.6 μL for 1 mL plasma) to the Lysis buffer (e.g., 0.9 mL) (See Table 1 in [34] for precise volumes).
- Thaw frozen plasma samples on ice or at room temperature. If needed, adjust the sample volume to 1 mL using sterile phosphate-buffered saline (PBS).
Lysis and Digestion:
- Transfer 1 mL of plasma to a 50 mL centrifuge tube.
- Add 100 μL of Proteinase K and 0.8 mL of the prepared Lysis buffer (containing carrier RNA) to the plasma.
- Close the tube and mix thoroughly by pulse-vortexing for 30 seconds.
- Incubate the mixture at 60°C for 30 minutes in a water bath [34].
DNA Binding:
- Add 1.8 mL of the prepared Binding Buffer to the lysate. Mix immediately and thoroughly by pulse-vortexing for 15-30 seconds.
- Incubate the resulting mixture on ice for 5 minutes.
- Assemble the vacuum manifold with a silica column and a tube extender. Pour the entire mixture into the column and apply a vacuum until all liquid has passed through. Alternatively, for centrifugation, split the lysate and process through multiple columns via sequential centrifugation at ≥11,000 x g [34].
Washing:
- Add 600 μL of Wash Buffer 1 to the column. Centrifuge at 11,000 x g for 1 minute. Discard the flow-through.
- Add 750 μL of Wash Buffer 2 to the column. Centrifuge at 11,000 x g for 1 minute. Discard the flow-through.
- Add 750 μL of 100% ethanol to the column. Centrifuge at 11,000 x g for 1 minute. Discard the flow-through [34].
Drying and Elution:
- Place the column in a clean 2 mL collection tube and centrifuge at full speed (≥20,000 x g) for 3 minutes to dry the membrane completely.
- Transfer the column to a new 1.5 mL elution tube. Incubate the open column in a heating block at 56°C for 10 minutes to ensure all residual ethanol evaporates.
- Apply 20-150 μL of pre-warmed Elution Buffer to the center of the silica membrane. Close the lid and incubate at room temperature for 3-5 minutes.
- Centrifuge the column at 20,000 x g for 1 minute to elute the purified cfDNA. Store the eluate at -20°C or -80°C [34].
Protocol 2: Magnetic Bead-Based Extraction from Plasma
This protocol outlines a general magnetic bead procedure, representative of kits like the MagMAX Cell-Free DNA Isolation Kit [12] [16].
Materials and Reagents
- Magnetic bead-based cfDNA extraction kit (e.g., MagMAX [Thermo Fisher], MGIEasy [MGI], or equivalent).
- Magnetic stand suitable for the sample tube format (e.g., 1.5 mL or 2 mL tubes).
- 80% Ethanol (prepared with nuclease-free water).
- TE Buffer (pH 8.0) or kit-specific Elution Buffer.
- Nuclease-free microcentrifuge tubes.
Step-by-Step Procedure
Sample and Bead Preparation:
- Transfer 1 mL of plasma to a nuclease-free 1.5 mL microcentrifuge tube.
- Resuspend the magnetic beads thoroughly by vortexing. Add the recommended volume of beads (e.g., 30-50 μL) to the plasma sample.
- Add the kit's specified volume of Binding Buffer, which typically contains PEG and salt to create optimal binding conditions [16] [36].
Binding and Capture:
- Mix the sample-bead mixture thoroughly by pipetting or vortexing.
- Incubate the mixture at room temperature for 5-10 minutes with gentle agitation to allow cfDNA to bind to the beads.
- Place the tube on a magnetic stand and wait for 2-5 minutes, or until the solution clears and the beads form a tight pellet on the tube wall.
- Carefully aspirate and discard the supernatant without disturbing the bead pellet [16].
Washing:
- While the tube is still on the magnetic stand, add 500 μL of a freshly prepared 80% ethanol solution.
- Incubate for 30 seconds, then carefully aspirate and discard the ethanol wash.
- Repeat the wash step a second time with 500 μL of 80% ethanol.
- After the second wash, briefly spin the tube, place it back on the magnetic stand, and remove any residual ethanol with a low-volume pipette [36].
Drying and Elution:
- Allow the bead pellet to air-dry at room temperature for 5-10 minutes. It is critical not to over-dry the beads, as this will reduce elution efficiency.
- Remove the tube from the magnetic stand. Resuspend the dried beads completely in the desired volume of TE Buffer or Elution Buffer (typically 20-50 μL).
- Incubate the suspension at room temperature for 4-5 minutes to allow the DNA to dissociate from the beads.
- Place the tube back on the magnetic stand for 2 minutes until the beads have pelleted.
- Carefully transfer the clear supernatant, which contains the purified cfDNA, to a new nuclease-free tube. Store at -20°C or -80°C [16] [36].
Workflow Visualization
The following diagram illustrates the core procedural steps and logical flow for both silica column and magnetic bead-based cfDNA extraction methods, highlighting key differences and decision points.
The Scientist's Toolkit: Essential Research Reagent Solutions
Selecting the appropriate reagents and materials is fundamental to successful cfDNA extraction. The following table details key solutions and their functions.
Table 2: Essential Materials and Reagents for cfDNA Extraction
| Item | Function/Application | Examples & Technical Notes |
|---|---|---|
| Blood Collection Tubes | Stabilizes blood cells to prevent lysis and gDNA contamination during transport and storage. | K2EDTA Tubes: Process within 2 hours. Streck/PAXgene Tubes: Allow plasma isolation up to 7-14 days post-collection due to cell-stabilizing additives [19] [36]. |
| Chaotropic Salt Buffers | Enable nucleic acid binding to silica surfaces by disrupting water molecules and neutralizing charge. | Guanidine hydrochloride or guanidine isothiocyanate are common. A key component of lysis and binding buffers in silica-based kits [34] [35]. |
| Functionalized Magnetic Beads | Solid-phase support for DNA binding and isolation via magnetic separation. | Amino Magnetic Beads: Bind DNA via electrostatic force, sometimes without high-salt environment [16]. Carboxyl Magnetic Beads: Bind via salt bridge in high-PEG/salt buffers; standard for purification [16]. |
| Carrier RNA | Improves recovery efficiency of low-abundance cfDNA by occupying non-specific binding sites on silica. | Added to lysis buffer. Critical when processing samples with expected low cfDNA yields (e.g., early-stage cancer) [34] [36]. |
| Size-Selective Beads | Enriches or depletes DNA fragments of specific sizes to improve analytical sensitivity. | Used in some bead-based protocols (e.g., CEWB method) by adjusting bead-to-sample ratio to selectively retain longer or shorter fragments [16]. |
| Elution Buffers | Provides a low-ionic-strength environment to disrupt DNA-silica/bead binding for final recovery. | TE Buffer (pH 8.0) or nuclease-free water. Low pH can damage DNA; ensure elution buffer is at neutral-to-alkaline pH [36]. |
The choice between silica column and magnetic bead-based technologies for cfDNA extraction is not a matter of one being universally superior, but rather dependent on the specific requirements of the research or clinical application. Silica column-based methods, exemplified by the QIAamp Circulating Nucleic Acid Kit, consistently demonstrate higher yields and recovery efficiencies, making them the gold standard for applications where maximizing the recovery of every DNA molecule is paramount, such as with low-input samples or early disease detection [12] [18]. Conversely, magnetic bead-based methods offer significant advantages in throughput, automation potential, and speed, and they often show superior performance in retaining the short DNA fragments that are clinically relevant in areas like oncology [12] [36]. The decision must therefore balance the need for yield and fragment selectivity against practical considerations of workflow integration, scalability, and cost. Standardizing pre-analytical protocols and carefully considering the impact of blood collection tubes and processing times are equally critical steps to ensure the reliability and reproducibility of downstream cfDNA analysis [19].
Circulating cell-free DNA (cfDNA) in plasma has emerged as a transformative biomarker in molecular diagnostics and life sciences research. These DNA fragments, originating from cellular apoptosis and necrosis, provide a non-invasive window into physiological and pathological states, particularly in oncology, prenatal diagnostics, and personalized medicine [37]. The integrity and yield of extracted cfDNA directly influence the sensitivity and accuracy of downstream applications, including next-generation sequencing (NGS), digital PCR, and quantitative PCR [38].
Magnetic bead-based nucleic acid extraction technology has established itself as the cornerstone of modern cfDNA isolation workflows. This method surpasses traditional techniques, such as phenol-chloroform extraction and column-based purification, by offering superior automation compatibility, higher throughput, and elimination of organic solvent residues [38]. The principle relies on the use of magnetic nanoparticles whose surfaces are functionalized with specific chemical groups (e.g., carboxyl or silanol groups) that bind nucleic acids under optimized buffer conditions. The magnetic properties of the beads then enable efficient separation, washing, and elution through the simple application and removal of a magnetic field, facilitating a highly standardized and scalable process [38] [39].
This application note provides a detailed, step-by-step protocol for a standardized magnetic bead-based workflow for plasma cfDNA extraction. It is designed to empower researchers, scientists, and drug development professionals with a robust methodology that ensures high yield, purity, and reproducibility, thereby strengthening the foundation of their plasma processing research.
Workflow and Principle: A Visual Guide to Magnetic Bead Technology
The following diagram illustrates the core biochemical principle of how magnetic beads capture nucleic acids from a complex lysate, which underpins the entire extraction workflow.
The complete extraction process, from sample preparation to pure eluted cfDNA, is outlined in the workflow below.
Detailed Experimental Protocol
Reagent Preparation and Sample Lysis
- Starting Material: Begin with centrifuged plasma. For clinical applications, a starting volume of 3-5 mL is recommended to ensure sufficient yield of low-abundance cfDNA, as yield is proportional to input volume [40] [41].
- Lysis Buffer Preparation: Prepare a lysis buffer containing:
- 20 mM Tris-HCl (pH 8.0)
- 2 mM Ethylenediaminetetraacetic acid (EDTA)
- 1.2% Triton X-100 (or a similar non-ionic detergent)
- 4 M Guanidine Isothiocyanate [39].
- Lysis Procedure: Add the prepared lysis buffer to the plasma sample at a 1:1 (v/v) ratio. Mix thoroughly by vortexing for 15-20 seconds. Incubate the mixture at 65°C for 30 minutes to ensure complete cell membrane disruption and protein denaturation, effectively releasing cfDNA into the solution.
cfDNA Binding and Magnetic Separation
- Binding Conditions: Add magnetic beads (e.g., silicon dioxide or hydroxy-silica magnetic particles) to the lysate [39]. The binding reaction is optimized with a high concentration of a chaotropic salt (e.g., Guanidine Isothiocyanate) and is conducted at room temperature for 10 minutes with continuous gentle mixing to allow for maximal cfDNA adsorption onto the bead surface [38] [39].
- Magnetic Capture: Transfer the reaction tube to a magnetic separation stand. Allow the beads to be fully captured against the wall of the tube for 2-5 minutes, or until the solution clears. Carefully aspirate and discard the supernatant without disturbing the magnetic pellet.
Wash Steps and Final Elution
- First Wash (Stringent Wash): Resuspend the magnetic bead-cfDNA complex in 1 mL of a wash buffer containing 20 mM Tris-HCl (pH 8.0), 2 mM EDTA, and 40% isopropanol. Mix well and perform magnetic separation. Aspirate and discard the supernatant completely [39].
- Second Wash (Ethanol Wash): Resuspend the pellet in 1 mL of a freshly prepared 80% ethanol solution. Incubate at room temperature for 1 minute, then perform magnetic separation and remove the supernatant. Repeat this ethanol wash step a second time for optimal purity.
- Drying: After the final ethanol wash, briefly air-dry the bead pellet for 5-10 minutes at room temperature to allow residual ethanol to evaporate. Caution: Do not over-dry the beads, as this will make cfDNA elution more difficult.
- Elution: Elute the pure cfDNA from the beads by resuspending them in 20-50 µL of a low-salt elution buffer (e.g., 10 mM Tris-HCl, pH 8.0-8.5, or nuclease-free water). Incubate at 65°C for 5-10 minutes to facilitate the release of cfDNA. Perform a final magnetic separation and carefully transfer the supernatant containing the purified cfDNA to a new, nuclease-free tube [39].
Performance Data and Optimization
Quantitative Yield and Quality Assessment
The performance of a magnetic bead-based cfDNA extraction protocol can be evaluated using several metrics. The following table summarizes typical expected outcomes and comparative data.
Table 1: Quantitative Performance Metrics of Magnetic Bead-Based cfDNA Extraction
| Performance Metric | Typical Outcome (Magnetic Bead Method) | Comparative Context |
|---|---|---|
| Extraction Yield | Linearly scales with plasma input volume (e.g., 1.5 mL to 10 mL) [40]. | Significantly higher yield from 4 mL plasma vs. a leading column-based kit (Kit C) [40]. |
| Fragment Size Profile | Efficient capture of short-fragment cfDNA (~160-170 bp) [40]. | Superior recovery of smaller cfDNA fragments compared to other methods [40]. |
| Downstream Compatibility | High-quality DNA suitable for qPCR, ddPCR, and NGS library construction [38] [40]. | Extracted cfDNA demonstrates higher quality NGS libraries with less noise [40]. |
| Recovery Efficiency | Demonstrated 80-91% recovery rate of spiked-in DNA, as measured by Picogreen assay and Bioanalyzer [40]. | Magnetic beads can provide more consistent yields than glass fiber filters [38]. |
Critical Optimization Parameters
- Plasma Input Volume: Increasing the plasma input volume directly increases the absolute yield of cfDNA, which is critical for detecting low-abundance mutations. One study showed that larger plasma volumes yielded 2.38 to 3.98 times more cfDNA compared to smaller volumes [41].
- Elution Conditions: Extending the incubation time during the elution step and using a slightly elevated temperature (e.g., 65°C for 5-10 minutes) can significantly improve the final concentration of cfDNA in the eluate [41].
- Automation: Implementing the protocol on an automated magnetic particle processor (e.g., KingFisher systems) enhances throughput, improves reproducibility by minimizing manual handling errors, and reduces overall hands-on time. A full extraction run can be completed in 40 minutes or less for 6 to 24 samples [38].
The Scientist's Toolkit: Essential Reagents and Equipment
Table 2: Key Research Reagent Solutions for Magnetic Bead-Based cfDNA Extraction
| Item | Function / Description | Example Product / Composition |
|---|---|---|
| Functionalized Magnetic Beads | Solid-phase matrix for nucleic acid binding; core component. | Silica-coated magnetic particles; MagMAX magnetic beads [38]; MagVigen beads [40]. |
| Lysis Buffer | Disrupts vesicles and inactivates nucleases to release cfDNA. | Contains Guanidine Isothiocyanate, Triton X-100, Tris-HCl, EDTA [39]. |
| Wash Buffers | Remove proteins, salts, and other impurities from bead-cfDNA complex. | Wash 1: Tris-EDTA with Isopropanol. Wash 2: 80% Ethanol [39]. |
| Elution Buffer | Low-ionic-strength solution to release pure cfDNA from beads. | 10 mM Tris-HCl (pH 8.0-8.5) or nuclease-free water [39]. |
| Proteinase K | Digest proteins and enhance lysis efficiency. | Added during the lysis step for complex samples [39]. |
| Automated Nucleic Acid Extractor | Instrument for hands-free, high-throughput purification. | Thermo Fisher KingFisher systems [38]. |
This protocol provides a robust, scalable, and highly effective magnetic bead-based workflow for the extraction of cfDNA from plasma. The standardized nature of the procedure ensures high reproducibility and yield, making it exceptionally suitable for demanding downstream applications like cancer biomarker discovery [37] and non-invasive prenatal testing (NIPT) [38].
The key advantages of this methodology include:
- High Purity and Yield: Effectively removes PCR inhibitors and recovers high-quality cfDNA, which is crucial for the success of sensitive techniques like NGS [38].
- Automation Compatibility: The entire process is readily automated on platforms like the KingFisher, enabling high-throughput processing and significantly reducing operational variability [38].
- Workflow Flexibility: The protocol can be linearly scaled to accommodate a wide range of plasma input volumes (from 100 µL to 10 mL), providing the flexibility needed for various research scenarios, from pilot studies to large-scale clinical validation [40].
By implementing this detailed protocol, researchers can achieve a reliable and standardized foundation for their plasma cfDNA studies, thereby generating high-quality data that accelerates discovery and translational research in the field of liquid biopsy.
The analysis of cell-free DNA (cfDNA) has emerged as a cornerstone of liquid biopsy, enabling non-invasive diagnostic and monitoring approaches in oncology, prenatal testing, and transplant medicine [19] [2]. A significant technical challenge in this field stems from the inherently low abundance and highly fragmented nature of cfDNA, which necessitates workflows of exceptional robustness and sensitivity [42]. The pre-analytical phase, particularly cfDNA extraction, is a critical source of variability that can profoundly impact downstream analytical performance [19] [2]. Automating this extraction process offers a compelling solution, enhancing reproducibility, increasing throughput, and minimizing manual errors [42] [43]. This application note details standardized protocols and performance data for automated cfDNA extraction systems, providing researchers with a framework for implementing reliable, high-throughput workflows integrated with downstream assays.
Experimental Protocols and Workflow Design
Key Pre-analytical Considerations
Successful cfDNA analysis begins with meticulous sample collection and handling. Plasma is the recommended matrix over serum, as the clotting process can cause significant genomic DNA contamination from white blood cell lysis [42]. To preserve sample integrity:
- Blood Collection Tubes: The choice of tube significantly influences cfDNA yield and quality. K2EDTA tubes require plasma isolation within 6 hours of collection. For longer processing delays, preservative tubes (e.g., Streck, PAXgene) are essential [19] [42].
- Centrifugation Protocols: A double centrifugation protocol is recommended to minimize cellular contamination. The first, lower-speed spin isolates plasma from whole blood, and a second, higher-speed spin pellets any remaining cells [19] [42].
- Sample Stability: Isolated plasma should be stored at -80°C if not processed immediately, with freeze-thaw cycles avoided to prevent DNA degradation [42].
Automated cfDNA Extraction: A Standardized Protocol
The following protocol is adapted for magnetic bead-based, automated extraction systems, which are widely used for their scalability and efficiency [2] [43].
Materials and Reagents
- Plasma Samples: 0.5 mL to 8 mL of plasma, double-centrifuged and stored at -80°C.
- Automated cfDNA Extraction Kit: For example, Mag-Bind cfDNA LSP Kit (Omega Bio-tek) or chemagic cfDNA kit (Revvity) [43] [44].
- Proteinase K: For enzymatic digestion of plasma proteins.
- Binding Buffer: To facilitate cfDNA adsorption onto magnetic beads.
- Wash Buffers: Typically two different buffers to remove impurities while retaining bound cfDNA.
- Elution Buffer: Low-salt buffer or nuclease-free water for final cfDNA elution.
- Internal Control: Exogenous DNA (e.g., lambda DNA) spiked into the sample to monitor extraction efficiency [42].
Equipment
- Automated Nucleic Acid Extraction System: Hamilton MagEx STAR, Dynamic Devices Lynx, Tecan DreamPrep NAP, or Promega Maxwell RSC [45] [43] [46].
- Microcentrifuge and Vortex Mixer.
- Agilent TapeStation 4150 or Bioanalyzer for cfDNA quality control.
- Real-Time PCR System or fluorometer for quantification.
Procedure
- Sample and Reagent Preparation:
- Thaw frozen plasma samples on ice or in a refrigerator.
- Equilibrate all reagents to room temperature and vortex to ensure homogeneity.
- Load the automated instrument deck according to the manufacturer's layout (Figure 1), positioning samples, prefilled reagent reservoirs, tip combs, magnetic beads, and a 96-well elution plate [43].
Automated Extraction Run:
- The pre-scripted method on the liquid handler executes the following steps:
- Lysis and Digestion: Combines plasma with Proteinase K and lysis buffer, followed by an incubation period (typically 10-30 minutes at 55-65°C) to digest proteins and release cfDNA.
- Binding: Adds magnetic beads and binding buffer to the lysate. cfDNA binds to the silica-coated beads in the presence of a chaotropic salt.
- Bead Washing: A magnetic rod head or stationary magnet secures the bead-DNA complex while the system performs two or more wash steps to remove contaminants [46].
- Elution: The purified cfDNA is released from the beads into a small volume of elution buffer (e.g., 50-100 µL), yielding a concentrated sample ready for analysis [43].
- The pre-scripted method on the liquid handler executes the following steps:
Post-Extraction Handling:
- Transfer the eluted cfDNA to low-bind microcentrifuge tubes or plates.
- Perform quality control and quantification immediately or store at -20°C for short-term or -80°C for long-term preservation.
Downstream Analysis: ddPCR for Variant Detection
The suitability of extracted cfDNA for sensitive downstream applications can be validated using droplet digital PCR (ddPCR) for variant detection [43].
Procedure
- Assay Setup:
- Design ddPCR assays targeting mutant and wild-type alleles (e.g., for EGFR or NRAS). Use a FAM-labeled probe for the mutant allele and a HEX- or SUN-labeled probe for the wild-type.
- Combine 15 ng of extracted cfDNA with ddPCR Supermix, primers, and probes in a total reaction volume of 300 µL [43].
Droplet Generation and PCR:
- Generate droplets using a QX200 Droplet Generator.
- Transfer the emulsified samples to a 96-well PCR plate, seal, and amplify on a thermal cycler using manufacturer-recommended cycling conditions.
Data Analysis:
- Read the droplets using a QX200 Droplet Reader.
- Analyze data with QuantaSoft Analysis Pro software. Set fluorescence thresholds using a wild-type control and calculate the variant allele frequency (VAF) from the ratio of mutant to total (mutant + wild-type) droplets [43].
Results and Data Analysis
Performance Metrics of Automated Platforms
Automated cfDNA extraction systems demonstrate high efficiency and robustness, which is critical for reliable downstream analysis. Performance data from various platforms are summarized in Table 1.
Table 1: Performance Comparison of Automated cfDNA Extraction Platforms
| Platform (Kit) | Sample Input Volume | Throughput (Time) | Extraction Efficiency | Key Downstream Applications Validated |
|---|---|---|---|---|
| Hamilton MagEx STAR (Mag-Bind cfDNA LSP Kit) | 4 mL | 96 samples in ~3h 20m | 76-83% [43] | ddPCR (detection down to 0.1% VAF), NGS [43] |
| Tecan DreamPrep NAP (MAGicBead cfDNA Kit) | Not Specified | Scalable for various needs | High yield and reliability reported [45] | Liquid biopsy assays [45] |
| Revvity chemagic 360 (chemagic cfDNA Kit) | 0.5 - 18 mL | 96 samples in <2h | Comparable to manual column methods [42] | ddPCR, qPCR, NGS [42] [44] |
| Promega Maxwell RSC (Maxwell RSC ccfDNA Kit) | 0.2 - 1.0 mL (standard); 2-8 mL (LV) | 16-48 samples in ~70 min | High yield, minimal gDNA contamination [47] | qPCR, NGS, digital PCR [47] |
| Dynamic Devices Lynx | 3.5 - 4 mL | 24 samples per run | Aims to increase yield and robustness [46] | Aneuploidy screening, sequencing [46] |
Impact of Pre-analytical Variables
The integrity of cfDNA is highly susceptible to pre-analytical conditions. A comprehensive study evaluating 649 plasma samples demonstrated that cfDNA yield is significantly dependent on the type of blood collection tube and the time delay between sampling and plasma isolation [19]. When processed immediately (0 hours), Streck and K2EDTA tubes provided the highest yields. However, cfDNA concentrations in K2EDTA tubes increased markedly over time (reaching 68.19 ng/mL at 168 hours), indicating leukocyte lysis and genomic DNA contamination. In contrast, preservative tubes like Streck maintained stable yields, underscoring their importance for workflows with delayed processing [19]. These findings highlight the necessity of standardizing pre-analytical conditions to ensure reliable and comparable results.
Downstream Assay Integration and Validation
The ultimate measure of a successful extraction is performance in downstream applications. Automated extraction methods have been rigorously validated for compatibility with highly sensitive techniques. For instance, cfDNA extracted using the Mag-Bind cfDNA LSP Kit on the Hamilton MagEx STAR platform enabled ddPCR detection of EGFR and NRAS mutations at allelic frequencies as low as 0.1%, with excellent concordance between observed and expected frequencies (R² ≈ 0.99) [43]. Furthermore, other automated workflows have shown consistent recovery of the characteristic cfDNA fragment size profile—a dominant peak at ~166 bp—which is crucial for sequencing-based analyses and fragmentomics [2] [48]. The use of automated systems also minimizes gDNA contamination, ensuring that variant calls in downstream NGS assays are accurate and reliable [2].
The Scientist's Toolkit
Table 2: Essential Research Reagent Solutions for Automated cfDNA Workflows
| Item | Function | Example Products / Notes |
|---|---|---|
| Magnetic Bead-based cfDNA Kit | Concentrates and purifies cfDNA from plasma using silica-coated magnetic beads. | Mag-Bind cfDNA LSP Kit (Omega Bio-tek) [43], chemagic cfDNA kits (Revvity) [42]. |
| Blood Collection Tubes with Stabilizers | Prevents white blood cell lysis and preserves cfDNA profile for extended periods before processing. | Cell-Free DNA BCTs (Streck), PAXgene Blood ccfDNA Tubes [19]. |
| Reference Standard Materials | Validates extraction efficiency and analytical sensitivity of downstream assays using samples with known mutations and VAFs. | Seraseq ctDNA (SeraCare), Multiplex I cfDNA in Synthetic Matrix (Horizon Discovery) [2] [43]. |
| Exogenous Internal Controls | Spiked into each sample prior to extraction to monitor the efficiency and consistency of the extraction process. | Lambda DNA, synthetic DNA sequences [42]. |
| Fragment Analysis System | Assesses the size distribution and quality of extracted cfDNA, confirming the presence of the characteristic ~166 bp peak. | Agilent TapeStation (Cell-Free DNA ScreenTape Assay) [2] [43]. |
| ddPCR/QPCR Reagents | For precise quantification of cfDNA and detection of low-frequency variants, confirming suitability for ultrasensitive applications. | Bio-Rad ddPCR Supermix, KAPA qPCR kits [42] [43]. |
Workflow Visualization
The following diagram illustrates the logical flow and integration points of a fully automated cfDNA workflow, from sample arrival to downstream analysis.
Figure 1: Automated cfDNA Analysis Workflow. This diagram outlines the key decision points and steps in a standardized, automated cfDNA workflow, highlighting the critical role of pre-analytical choices and quality control.
The automation of cfDNA extraction represents a significant advancement in standardizing liquid biopsy workflows. By implementing the detailed protocols and platforms discussed, research and clinical laboratories can achieve high-throughput, reproducible recovery of high-quality cfDNA. The consistent performance of these automated systems, validated through rigorous downstream assays like ddPCR and NGS, ensures the reliability of data for critical applications in cancer genomics, prenatal diagnostics, and disease monitoring. As the field progresses, the integration of fully automated, end-to-end workflows—from plasma separation to library preparation—will further enhance efficiency, reduce operational costs, and accelerate the translation of cfDNA-based biomarkers into clinical practice.
Aqueous Two-Phase Systems (ATPS) represent a remarkable liquid-liquid fractionation technique where two immiscible aqueous phases form through the amalgamation of at least two water-soluble components at precise concentrations [49]. First discovered in 1896 by Martinus Willem Beijerinck when mixing aqueous solutions of gelatin and agar, the practical application of ATPS was not realized until 1956 by Per-Åke Albertsson, who used it to separate chloroplasts in a polyethylene glycol-based system [50] [51]. This environmentally harmonious technique has gained significant interest for its extensive utility in isolating and refining biomolecules, including circulating cell-free DNA (cfDNA), owing to its innate simplicity, cost-effectiveness, and superior biocompatibility compared to organic solvent-based extraction methods [49] [50].
In the context of liquid biopsy for cancer diagnostics, efficient extraction of cfDNA is critically important, as these fragments are typically present at very low concentrations in plasma and are highly fragmented (~167 base pairs) [2] [19]. ATPS technology offers a promising alternative to conventional solid-phase extraction methods by providing a gentle aqueous environment that preserves biomolecule integrity while achieving high recovery yields of target analytes [6] [52]. The technology is particularly valuable for isolating circulating tumor DNA (ctDNA), where minimal loss during extraction is crucial for sensitive detection of low-frequency mutations in clinical applications [52] [53].
Fundamental Principles and System Configuration
Thermodynamic Basis and Phase Formation
ATPS formation occurs due to the incompatibility between combinations of polymers, salts, and surfactants when their concentrations surpass specific thresholds in water [49]. When molecules or particles are introduced into this system, they distribute themselves automatically between the two phases based on their relative affinity for each phase, reaching an equilibrium state governed by surface properties, electrochemical potential, and molecular interactions [49] [50]. The distribution of target molecules between the two phases follows Nernst's law, represented by the equation K = Ct/Cb, where Ct and Cb denote the concentrations of the target molecule in the upper and lower phases, respectively, and K represents the distribution coefficient [49].
The equilibrium relationship between phases determines partition behavior, which Albertsson suggested is driven by multiple factors including electrochemical potential, hydrophobicity, bio-specific affinity, molecular size, and conformational properties [50]. The logarithmic form of these partition coefficient factors can be expressed as: ln K = ln K° + ln Kelec + ln Khfob + ln Kaffinity + ln Ksize + ln Kconf, where each term represents contributions from different interaction forces [50].
System Types and Components
ATPS can be constructed using various component combinations, each offering distinct advantages for specific applications:
- Polymer-polymer systems: Typically using polyethylene glycol (PEG) and dextran, these systems provide low ionic strength environments suitable for separating ionic-sensitive solutes [50].
- Polymer-salt systems: Utilizing PEG with salts such as phosphate, sulfate, or citrate, these systems are cost-effective but exhibit high ionic strength [50].
- Alcohol-salt systems: Employing short-chain alcohols with salts, these offer reduced viscosity and easy constituent recovery but may denature some proteins [50].
- Ionic liquid-based systems: Emerging as novel alternatives with tunable properties for specific separation needs [50].
- Surfactant-based systems: Forming micellar and reverse micellar ATPS for membrane protein separation [50].
For cfDNA extraction, PEG-salt systems have demonstrated particular efficacy, with PEG 1000 systems proving more effective than PEG 400 systems for recovering short DNA fragments from plasma [6].
Phase Diagrams and System Characterization
Phase diagrams serve as fundamental tools for understanding and manipulating ATPS behavior, providing a visual representation of component concentrations that form two immiscible aqueous phases versus those that maintain a single phase [49] [50]. The binodal curve represents the boundary between these regions, with the area above the curve indicating concentrations that form two distinct phases and the area below representing monophasic conditions [49].
The tie line connects node points on the binodal curve representing the equilibrium compositions of the top and bottom phases, with the Tie Line Length (TLL) calculated as TLL = √[(ΔX)² + (ΔY)²] providing a thermodynamic parameter reflecting system properties [49] [50]. The critical point, located where the tie line length becomes zero, represents the minimum component concentration required for phase formation [49].
Figure 1: ATPS Phase Diagram Components. This schematic illustrates the key elements of an aqueous two-phase system phase diagram, including the binodal curve separating monophasic and biphasic regions, tie lines connecting equilibrium phase compositions, and the critical point [49] [50].
ATPS Workflows for cfDNA Extraction
Basic ATPS Mechanism for Biomolecule Separation
The fundamental separation process in ATPS involves selective partitioning of target molecules between the two aqueous phases based on their physicochemical properties. When system components are mixed in specific proportions, target substances distribute between upper and lower phases influenced by surface charge interactions, intermolecular forces, and environmental factors, enabling efficient separation of biomaterials [49]. For cfDNA extraction, this process is optimized to drive DNA fragments into one phase while excluding contaminants such as proteins and lipids into the opposing phase [52].
Figure 2: General ATPS Workflow. Basic operational sequence for aqueous two-phase extraction systems, from component mixing through phase separation and target molecule recovery [49] [52].
Advanced Multi-Stage ATPS for cfDNA Extraction
For clinical cfDNA extraction, advanced multi-stage ATPS protocols have been developed to enhance purity and recovery. The PHASIFY method exemplifies this approach, utilizing a series of ATPS formulations optimized to sequentially purify and concentrate cfDNA from plasma samples [52]. In the first ATPS, system components force phase separation where cfDNA partitions to the bottom phase while proteins and lipids partition to the top phase due to optimized electrostatic, hydrophilic/hydrophobic, and excluded-volume interactions [52]. The cfDNA-containing phase is then transferred to a second ATPS with a distinct formulation where cfDNA partitions to a reduced-volume top phase, effectively concentrating the target molecules for downstream analysis [52].
Figure 3: Multi-Stage ATPS cfDNA Extraction. Sequential purification and concentration workflow for optimal recovery of cell-free DNA from plasma samples using specialized ATPS formulations [52].
Comparative Performance Analysis
Quantitative Assessment of Extraction Efficiency
Table 1: Performance Comparison of cfDNA Extraction Methods
| Extraction Method | Recovery of 145 bp DNA | Total DNA Yield Increase | Mutant Copy Recovery Increase | Key Advantages | Limitations |
|---|---|---|---|---|---|
| ATPS (PHASIFY MAX) | 91% more than solid-phase from 4 ng/mL samples [52] | 60% increase vs. solid-phase [52] | 171% increase vs. solid-phase [52] | High recovery of short fragments; Gentle aqueous environment; Cost-effective [49] [52] | Requires optimization; Multiple processing steps [49] |
| ATPS (PHASIFY ENRICH) | Similar to MAX for 145 bp fragments [52] | 35% decrease vs. solid-phase [52] | 153% increase vs. solid-phase [52] | Size selection removes high molecular weight gDNA; Enriches for cfDNA <500 bp [52] | Lower total DNA yield; Additional processing step [52] |
| Solid-Phase (QCNA) | Reference method [52] | Baseline | Baseline | Established protocol; High purity [52] [19] | Lower recovery of short fragments; Potential bead loss [52] |
| Magnetic Bead-Based | Variable based on protocol [2] [19] | Dependent on sample type and volume [54] | Dependent on sample type and volume [54] | Amenable to automation; High-throughput capability [2] | Potential gDNA contamination; Requires specialized equipment [19] |
ATPS demonstrates superior recovery performance for short DNA fragments compared to conventional solid-phase extraction methods. In clinical validation studies, the PHASIFY MAX method showed a 60% increase in total DNA yield and 171% increase in mutant copy recovery compared to the QIAamp Circulating Nucleic Acid (QCNA) kit [52]. This enhanced recovery directly impacts diagnostic sensitivity, with the PHASIFY ENRICH method converting 9 out of 47 previously mutation-negative plasma samples to positive status after extraction, all with known positive tissue genotyping [52].
System Optimization Parameters
Table 2: ATPS Optimization Parameters for cfDNA Extraction
| Parameter | Impact on Extraction Performance | Optimal Conditions for cfDNA |
|---|---|---|
| Polymer Molecular Weight | ↑ MW → ↓ polymer concentration needed for phase formation; Affects partition coefficient [50] | PEG 1000 more effective than PEG 400 for DNA recovery from plasma [6] |
| Tie Line Length (TLL) | Longer TLL indicates greater phase property differences; Influences distribution behavior [49] | System-specific optimization required; Shorter TLL near critical point reduces phase divergence [49] |
| Phase Volume Ratio | Determines concentration factor; Affects distribution equilibrium [49] [52] | Reduced volume ratio in second ATPS (PHASIFY) concentrates cfDNA [52] |
| Salt Type and Concentration | Influences electrochemical potential; Impacts DNA partitioning via charge interactions [50] | Phosphate systems effective for DNA recovery; Concentration system-dependent [6] |
| Plasma Input Volume | Affects component concentrations and phase formation; Impacts yield [6] | Up to 66.7% (w/w) plasma achievable with solid PEG/phosphate modification [6] |
| Temperature | Affects phase diagram boundaries and partition coefficients [49] | Room temperature typically used; System-specific optimization recommended [49] |
Optimizing ATPS parameters is crucial for maximizing cfDNA recovery. Research indicates that PEG 1000 systems achieve up to 90% DNA recovery in the bottom phase, significantly outperforming PEG 400 systems [6]. System robustness has been confirmed using plasma from various donors and blood collection tube types, showing consistent DNA recovery and phase separation behavior [6]. Modified ATPS designs utilizing solid PEG and phosphate rather than liquid solutions can increase plasma input from 37.7% (w/w) to 66.7% (w/w) without compromising DNA partitioning efficiency [6].
Research Reagent Solutions
Table 3: Essential Research Reagents for ATPS cfDNA Extraction
| Reagent/Chemical | Function in ATPS | Application Notes |
|---|---|---|
| Polyethylene Glycol (PEG) | Phase-forming polymer; Exclusion volume effects drive biomolecule partitioning [50] | PEG 1000 recommended for cfDNA; Low toxicity, low cost, low volatile [50] [6] |
| Dextran | Phase-forming polymer; Creates hydrophilic environment incompatible with PEG [50] [51] | Can interfere with downstream RNA extraction; Requires dextranase treatment for removal [51] |
| Phosphate Salts | Phase-forming salt; Competes for water molecules leading to polymer exclusion [50] [6] | Enables high DNA recovery in PEG/salt systems; Concentration must be optimized [6] |
| Citrate/Sulfate Salts | Alternative phase-forming salts; Lower environmental impact than phosphate systems [50] | Useful for specific applications; May require different optimization parameters [50] |
| Dextranase | Enzyme that degrades dextran; Eliminates interference in downstream applications [51] | Critical for RNA extraction from dextran-rich phases; Enables immunolabeling of EVs [51] |
| Poly(A) Carrier | Enhances nucleic acid precipitation and recovery; Reduces surface adsorption losses [54] | Mixed efficacy reports for low-concentration cfDNA; Requires validation for specific systems [54] |
| Size Selection Solutions | Preferentially precipitates large DNA while retaining small fragments [52] | PHASIFY ENRICH method enriches for cfDNA <500 bp; Reduces gDNA contamination [52] |
The selection of appropriate reagents is critical for successful ATPS implementation. PEG remains the most widely used polymer due to its low toxicity, cost-effectiveness, and favorable physicochemical properties [50]. Recent innovations include dextranase treatment to overcome historical limitations of dextran-based systems, enabling efficient RNA extraction and improved immunolabeling capabilities for extracellular vesicles [51]. For cfDNA extraction specifically, PEG-phosphate systems have demonstrated robust performance across varied plasma samples and collection tube types [6].
Protocol for cfDNA Extraction Using ATPS
Materials and Reagents
- Polyethylene glycol 1000 (PEG 1000)
- Phosphate salt solution (specific concentration optimized for system)
- Plasma samples (1 mL aliquots)
- Centrifuge tubes (15 mL capacity)
- Benchtop centrifuge
- Vortex mixer
- Heating block or water bath
- DNA purification plates containing desalting matrix (for reverse elution protocol)
- Isopropanol (molecular biology grade)
- Ethanol (70%, molecular biology grade)
- Elution buffer (TE buffer or commercial cfDNA elution buffer)
Step-by-Step Procedure
System Preparation: Prepare stock solutions of PEG 1000 and phosphate salt at predetermined concentrations based on phase diagram construction. Filter sterilize if necessary for downstream molecular applications.
Phase System Formation: In a 15 mL centrifuge tube, combine 1 mL plasma with appropriate masses of solid PEG and phosphate salt to achieve final system composition of approximately 66.7% (w/w) plasma input. Alternatively, for lower plasma input systems, use prepared stock solutions adjusted to maintain final component concentrations.
Mixing and Equilibrium: Vortex the mixture vigorously for 1-2 minutes until homogeneous. Allow the system to equilibrate at room temperature for 15-30 minutes, or centrifuge at 2000-5000 × g for 10 minutes to accelerate phase separation.
Phase Separation: After centrifugation, two distinct phases will be visible with a well-defined interface. Carefully aspirate and discard the upper phase containing contaminants, proteins, and lipids.
cfDNA Recovery: Transfer the DNA-rich bottom phase to a fresh tube. For additional purification, implement a second ATPS with modified composition to further concentrate cfDNA into a reduced-volume phase as described in the PHASIFY method [52].
Reverse Elution Concentration: To address sample dilution from phase-forming components, apply the DNA-containing phase to purification plates containing a desalting matrix. Implement reverse elution to concentrate cfDNA while removing salts and residual proteins [6].
Final Purification: Add 2 volumes of isopropanol to the concentrated cfDNA solution, mix thoroughly, and incubate at -20°C for 30 minutes. Centrifuge at maximum speed (≥12,000 × g) for 15 minutes to pellet DNA. Wash with 70% ethanol, recentrifuge, and air-dry the pellet.
Elution: Resuspend the purified cfDNA pellet in an appropriate volume of elution buffer (typically 20-50 μL) compatible with downstream applications such as PCR, ddPCR, or NGS library preparation.
Quality Control and Validation
- Quantify cfDNA yield using fluorometric methods (Qubit) or quantitative PCR targeting short amplicons (60-100 bp).
- Assess fragment size distribution using microfluidic capillary electrophoresis (Bioanalyzer, TapeStation, or Fragment Analyzer).
- Verify absence of genomic DNA contamination by PCR amplification of long fragments (>400 bp).
- For ctDNA applications, validate recovery efficiency using reference standards with known variant allele frequencies.
Aqueous Two-Phase Systems represent a powerful, biocompatible alternative to conventional nucleic acid extraction methods, offering superior recovery of short cfDNA fragments crucial for liquid biopsy applications. The gentle aqueous environment preserves biomolecule integrity while providing cost-effective, scalable processing suitable for clinical research settings. Through optimized system parameters and multi-stage protocols, ATPS technology achieves significantly higher mutant copy recovery compared to solid-phase methods, directly enhancing detection sensitivity for low-frequency variants in cancer diagnostics. As liquid biopsy continues to advance toward early cancer detection and minimal residual disease monitoring, ATPS methodology offers a promising approach to overcome current limitations in cfDNA extraction efficiency.
Troubleshooting cfDNA Workflows: Maximizing Yield, Purity, and Avoiding Contamination
Top 5 Pre-analytical Pitfalls and How to Avoid Them
The pre-analytical phase is the most vulnerable stage in the liquid biopsy workflow, with errors in this phase accounting for the vast majority of laboratory errors [55]. For research on cell-free DNA (cfDNA), pre-analytical variability can profoundly impact downstream analysis, potentially compromising the validity of results in clinical trials and biomarker development [56] [57]. This document outlines the five most critical pre-analytical pitfalls in plasma processing for cfDNA extraction and provides detailed protocols to mitigate them, ensuring reliable and reproducible data.
Pitfall 1: Improper Blood Collection Tube Selection and Handling
The choice of blood collection tubes and their immediate handling is the foundational step that dictates cfDNA quality.
Impact on Research
Using inappropriate tubes or mishandling them can lead to cellular contamination and cfDNA degradation, altering concentration, fragment size distribution, and variant allele frequencies [56]. Direct comparisons between tube types show significant variation in cfDNA yields [58].
Experimental Protocol for Blood Collection
- Tube Selection: For cfDNA preservation, use cell-stabilizing blood collection tubes (e.g., Streck Cell-Free DNA BCT or PAXgene Blood ccfDNA Tubes) [56]. Standard EDTA tubes are acceptable only if plasma is separated within a narrow timeframe.
- Venipuncture: Perform a clean venipuncture with a 21-gauge needle to minimize hemolysis and cell stress.
- Tube Filling: Fill the tube to the exact nominal volume to ensure the correct blood-to-additive ratio.
- Mixing: Gently invert the tube 8-10 times immediately after collection to ensure proper mixing with the preservative, preventing clot formation.
- Temporary Storage: If using stabilizing tubes, stored whole blood can typically be held at room temperature (6-37°C) for up to 14 days. For EDTA tubes, proceed to plasma separation within 2 hours of draw [56] [59].
Pitfall 2: Delayed Plasma Processing
The time interval between blood draw and plasma separation is a critical variable that directly affects cfDNA integrity.
Impact on Research
Delays in processing allow leukocytes to lyse, releasing high-molecular-weight genomic DNA into the plasma. This compromises the cfDNA integrity index, dilutes tumor-derived cfDNA, and interferes with downstream assays like ddPCR and NGS [56] [58].
Experimental Protocol for Timely Plasma Processing
- Centrifugation Setup: Use a swinging-bucket rotor centrifuge. Pre-cool to 4°C to preserve cfDNA and inhibit cellular metabolism.
- First Centrifugation (To remove cells):
- Speed: 1,600 - 2,000 x g
- Duration: 10 minutes
- Temperature: 4°C
- Brake: OFF (to prevent disturbing the cell pellet)
- Plasma Transfer: Carefully transfer the supernatant (plasma) to a new sterile tube using a pipette, avoiding the buffy coat and cell pellet.
- Second Centrifugation (To remove residual cells and platelets):
- Speed: 16,000 x g
- Duration: 10 minutes
- Temperature: 4°C
- Final Plasma Aliquot: Transfer the double-centrifuged plasma into cryovials in small-volume aliquots suitable for a single extraction to avoid freeze-thaw cycles.
Table 1: Consequences of Delayed Plasma Processing in Different Tube Types
| Collection Tube Type | Maximum Recommended Time to Processing | Primary Risk of Delay |
|---|---|---|
| EDTA K2/K3 | 2 - 6 hours | Cellular lysis and genomic DNA contamination |
| Cell-Stabilizing Tubes | Up to 14 days | Gradual loss of cfDNA integrity |
| Citrate Tubes | 2 - 4 hours | Cellular degradation and clot formation |
The following workflow diagram summarizes the optimal plasma processing protocol to avoid delays and ensure sample integrity:
Pitfall 3: Inconsistent Centrifugation Protocols
Variations in centrifugation speed, time, and temperature are a major source of pre-analytical irreproducibility, especially in multi-center trials.
Impact on Research
Inconsistent centrifugation fails to completely remove cells and platelets, leading to cellular contamination in the plasma fraction. This introduces gDNA, skewing the cfDNA concentration and fragment profile [58]. Even cfDNA methylation, a generally stable biomarker, can be affected if gDNA contamination is severe [58].
Protocol for Standardized Centrifugation
Adhere strictly to the two-step centrifugation protocol detailed in Pitfall 2. Document all parameters (speed, time, temperature, rotor type) for every sample. In multi-center studies, provide identical protocols and calibrate centrifuges regularly to ensure harmonization [57] [59].
Pitfall 4: Failure to Monitor and Prevent Hemolysis
Hemolysis, the rupture of red blood cells, is the single most common pre-analytical error in laboratory medicine [55].
Impact on Research
Hemolysis releases intracellular components, including nucleases and PCR inhibitors, which can degrade cfDNA and inhibit downstream molecular assays like qPCR and ddPCR [60]. Visually hemolyzed samples should not be used for analysis.
Protocol for Hemolysis Assessment and Mitigation
- Prevention: Use proper venipuncture technique, avoid using small-gauge needles, and mix blood samples gently.
- Assessment: Visually inspect plasma for a pink or red hue. For objective measurement, quantify free hemoglobin spectrophotometrically (absorbance at 414 nm, 541 nm, and 576 nm).
- Action: Establish a hemoglobin threshold for sample rejection. If analysis must proceed, note the level of hemolysis as a potential confounding variable.
Pitfall 5: Suboptimal Plasma Storage and Freeze-Thaw Cycles
Improper storage conditions and repeated freezing and thawing of plasma samples lead to cfDNA degradation and loss.
Impact on Research
Each freeze-thaw cycle can cause cfDNA fragmentation and a reduction in yield, particularly affecting longer fragments. This can bias fragmentomics analyses and reduce the sensitivity of mutation detection [56].
Protocol for Plasma and cfDNA Storage
- Aliquoting: Immediately after the second centrifugation, aliquot plasma into cryovials. The volume should be tailored to the DNA extraction kit's requirements to avoid repeated use of the same aliquot.
- Freezing: Snap-freeze aliquots in liquid nitrogen or a dry-ice ethanol bath, then transfer to a -80°C freezer for long-term storage.
- Thawing: When needed, thaw plasma aliquots on ice or in a 4°C refrigerator—never at room temperature. Gently mix after thawing before proceeding with extraction.
- Extracted cfDNA Storage: Store extracted cfDNA in TE buffer (pH 8.0) at -20°C or -80°C. Avoid more than 1-2 freeze-thaw cycles.
Table 2: Key Reagent Solutions for cfDNA Pre-analytical Workflows
| Research Reagent / Material | Function & Rationale |
|---|---|
| Cell-Stabilizing Blood Collection Tubes | Preserves blood cells, prevents lysis, and stabilizes cfDNA for extended periods, enabling sample transportation. |
| Proteinase K | Enzymatically digests proteins and nucleases during extraction, protecting cfDNA from degradation and improving yield. |
| Magnetic Beads (Silica-coated) | Selectively bind nucleic acids in high-salt buffers for efficient cfDNA isolation and purification in automated/semi-automated systems. |
| Carrier RNA | Increases extraction yield of low-concentration cfDNA by providing a bulk substrate for silica binding, reducing loss. |
| Dithiothreitol (DTT) | A reducing agent that breaks down disulfide bonds in mucoid samples; can improve cfDNA yields from viscous seminal plasma [58]. |
| TE Buffer (pH 8.0) | Optimal chemical environment (Tris and EDTA) for long-term DNA storage, protecting against acid hydrolysis and nuclease activity. |
The Scientist's Toolkit: Essential Materials for cfDNA Research
Table 3: The Researcher's Pre-analytical Checklist for cfDNA Studies
| Pre-analytical Step | Critical Control Parameters | Documentation Requirement |
|---|---|---|
| Patient Preparation | Fasting status, time of day, physical activity | Standardized pre-collection questionnaire |
| Blood Collection | Tube type, lot number, draw order, fill volume | Phlebotomy record form |
| Plasma Processing | Time to processing, centrifugation speed/time/temp/brake | Laboratory processing worksheet |
| Sample Storage | Aliquot volume, freeze time/temperature, freeze-thaw cycles | Inventory management system log |
| Nucleic Acid Extraction | Kit name, version, lot number, elution volume | Extraction batch record |
Strategies to Minimize Genomic DNA Contamination from White Blood Cells
Within the framework of advancing plasma processing methodologies for cell-free DNA (cfDNA) research, minimizing genomic DNA (gDNA) contamination from white blood cells (WBCs) represents a critical pre-analytical challenge. The integrity of cfDNA-based analyses, particularly in liquid biopsy applications for oncology and prenatal diagnostics, is heavily dependent on the purity of the extracted cfDNA [12]. gDNA contamination, originating from the lysis of WBCs during sample collection and processing, can significantly compromise assay sensitivity and specificity by diluting the often low-abundance, disease-relevant cfDNA molecules [61] [42]. This application note details evidence-based strategies and standardized protocols to safeguard sample purity from the point of blood draw through DNA extraction.
Background and Significance
Cell-free DNA circulates in blood plasma as short, fragmented molecules, typically peaking at ~167 base pairs (bp), which corresponds to DNA protected by a nucleosome [62]. In healthy individuals, cfDNA concentrations are typically low, ranging from 1–30 ng/mL of plasma, while contaminating gDNA from WBCs is of high molecular weight [12] [19]. The presence of this high molecular weight gDNA can reduce the effective sequencing depth of rare variants in circulating tumor DNA (ctDNA) assays and distort fragmentomics analyses [61]. Therefore, a robust pre-analytical workflow is foundational for reliable downstream results in quantitative PCR (qPCR), droplet digital PCR (ddPCR), and next-generation sequencing (NGS).
Strategies for Minimizing gDNA Contamination
Blood Collection and Initial Handling
The risk of gDNA contamination begins at the venipuncture stage and is heavily influenced by the choice of blood collection tube and handling procedures before plasma isolation.
Key Considerations:
- Tube Selection: The use of blood collection tubes containing cell-stabilizing preservatives is recommended when a delay in plasma processing is anticipated. Streck Cell-Free DNA BCTs have been shown to maintain cfDNA yield and minimize gDNA release for up to 168 hours (7 days) post-collection [19]. For processing within 6 hours, standard K2EDTA tubes are acceptable, but delays beyond this lead to a significant increase in gDNA contamination due to WBC lysis [19] [42].
- Plasma Processing Timelines: Plasma should be separated from cellular components within 60 minutes of blood collection when using K2EDTA tubes to prevent cell lysis [19]. For Streck BCTs, plasma can be isolated within a week while maintaining sample integrity [19].
- Handling Techniques: To minimize mechanical lysis of WBCs, avoid excessive agitation or temperature shocks to blood tubes. Use an appropriate needle size and avoid prolonged tourniquet application during blood drawing [42].
Plasma Isolation Protocol
A double-centrifugation protocol is critical for generating cell-free plasma with minimal gDNA carryover.
Detailed Centrifugation Workflow:
- First Centrifugation: Centrifuge whole blood at 1600–2000 × g for 10 minutes at room temperature. This step separates plasma from red blood cells and the bulk of white blood cells [12] [19].
- Plasma Transfer: Carefully transfer the upper plasma layer to a new tube, taking extreme care to avoid disturbing the buffy coat (which contains WBCs) or the cell pellet [42].
- Second Centrifugation: Centrifuge the harvested plasma a second time at a higher force of 6000 × g for 10 minutes at room temperature. This step pellets any remaining cellular debris [12] [19].
- Final Aliquot: Transfer the supernatant into a new tube. This double-centrifuged plasma is now suitable for cfDNA extraction or can be stored at -80°C to prevent degradation.
Table 1: Recommended Centrifugation Protocols for Different Blood Collection Tubes
| Blood Collection Tube Type | Recommended Time to Processing | First Centrifugation | Second Centrifugation |
|---|---|---|---|
| K2EDTA | ≤ 60 minutes [42] | 1600–2000 × g, 10 min, 20°C [12] [19] | 6000 × g, 10 min, 20°C [12] [19] |
| Streck BCT | ≤ 7 days [19] | 1600–2000 × g, 10 min, 20°C [19] | 6000 × g, 10 min, 20°C [19] |
| PAXgene | Manufacturer's instructions | 1600–2000 × g, 10 min, 20°C [19] | 6000 × g, 10 min, 20°C [19] |
cfDNA Extraction and Quality Control
The choice of extraction chemistry and subsequent quality control are the final defenses against gDNA contamination.
Extraction Method Selection: Magnetic bead-based methods, which can be optimized to preferentially bind shorter DNA fragments, are widely used in automated systems and show excellent performance [12] [42]. However, studies have demonstrated that some spin-column-based kits, such as the QIAamp Circulating Nucleic Acid Kit, can yield high cfDNA recovery without compromising purity [63] [18]. The optimal method may depend on the specific requirements for yield, throughput, and downstream application.
Quality Control (QC) Assessment: Fluorometric methods (e.g., Qubit) quantify total DNA but cannot distinguish cfDNA from gDNA [62]. Therefore, PCR-based QC is essential.
- Fragment Size Analysis: Capillary electrophoresis (e.g., Agilent Bioanalyzer) provides a profile of the extracted DNA. A high-quality cfDNA sample shows a dominant peak at ~167 bp. A smear or a secondary peak at high molecular weight indicates gDNA contamination [12] [42].
- qPCR/ddPCR-Based Integrity Assays: These assays use two sets of primers to amplify a short target (e.g., 60-115 bp, within the cfDNA size range) and a long target (e.g., 400-500 bp, present only in gDNA). The ratio of the long to short amplicon quantification provides a numerical integrity index; a high ratio signifies significant gDNA contamination [61] [62]. A multiplex ddPCR assay can simultaneously quantify total cfDNA and assess the fragment size distribution in a single well [62].
Table 2: Performance Comparison of Commercial cfDNA Extraction Kits
| Extraction Kit | Chemistry | Automation Potential | Reported Performance |
|---|---|---|---|
| QIAamp Circulating Nucleic Acid Kit [63] [18] | Silica-based column | Manual / Semi-automated (QIAcube) | High yield, high purity, consistent performance [63] [18] |
| chemagic cfDNA Kit [42] | Magnetic Beads (M-PVA) | Full (chemagic 360) | Scalable input, high throughput, comparable yield and purity to manual columns [42] |
| MagMAX Cell-Free DNA Isolation Kit [12] | Magnetic Beads | Full | Lower yield in one study, but good reproducibility [12] |
| QIAamp MinElute ccfDNA Kit [63] [18] | Magnetic Beads / Column | Semi-automated (QIAcube) | Lower yield than CNA kit, but higher variant allelic frequency in some cases [63] |
The Scientist's Toolkit: Essential Research Reagents and Materials
Table 3: Key Reagents and Instruments for a gDNA-Free cfDNA Workflow
| Item | Function | Example Products / Specifications |
|---|---|---|
| Streck Cell-Free DNA BCT | Prevents WBC lysis during blood storage/shipping | Cell-Free DNA BCT [19] |
| K2EDTA Blood Collection Tubes | Standard anticoagulant tube for immediate processing | BD Vacutainer PPT [19] |
| Silica-Membrane / Magnetic Bead Kits | Selective binding and purification of cfDNA | QIAamp Circulating Nucleic Acid Kit [63] [18], chemagic cfDNA Kit [42] |
| Automated Nucleic Acid Extractor | High-throughput, reproducible cfDNA extraction | chemagic 360 [42], QIAsymphony SP [19] |
| Droplet Digital PCR System | Absolute quantification and size distribution analysis of cfDNA | Bio-Rad QX200 [62] |
| Capillary Electrophoresis System | Visual assessment of cfDNA fragment size and gDNA contamination | Agilent Bioanalyzer [12] [64], LabChip GX Touch [42] |
Experimental Workflow and Visualization
The following diagram summarizes the complete, integrated workflow for minimizing gDNA contamination, from blood draw to quality assurance.
Minimizing gDNA contamination from white blood cells is not a single step but a comprehensive quality management system embedded within the cfDNA research workflow. The synergistic application of correct blood collection tubes, a rigorous double-centrifugation protocol, a validated extraction method, and PCR-based quality control creates a robust defense against this pervasive pre-analytical variable. By standardizing these practices, researchers can significantly enhance the reliability and reproducibility of their cfDNA analyses, thereby strengthening the conclusions drawn from their plasma processing research.
Optimizing Elution Volumes and Plasma Input for Critical Low-Concentration Samples
The analysis of cell-free DNA (cfDNA) has emerged as a cornerstone of liquid biopsy applications, enabling non-invasive disease detection and monitoring. However, the reliable analysis of critical low-concentration samples remains a significant challenge, primarily due to the low abundance and highly fragmented nature of cfDNA. Efficient recovery during the final elution stage and maximizing input material are therefore paramount for downstream analytical success. This application note details optimized protocols for elution volume selection and plasma input management, providing a standardized framework for researchers and drug development professionals to enhance the sensitivity and reproducibility of their cfDNA workflows.
The Impact of Elution Volume and Plasma Input on cfDNA Analysis
The elution step in cfDNA extraction is critical for concentrating DNA into a minimal volume suitable for downstream applications. Suboptimal elution volumes can lead to inadequate DNA recovery or excessive dilution, directly impacting the limit of detection in subsequent molecular assays. Similarly, the volume of plasma used as input determines the total amount of cfDNA available for analysis, a factor especially crucial for low-concentration samples.
Table 1: Key Considerations for Elution and Input Optimization
| Parameter | Impact on cfDNA Analysis | Optimization Goal |
|---|---|---|
| Elution Volume | - Large Volume: Dilutes DNA, reducing concentration and assay sensitivity.- Small Volume: Increases concentration but risks incomplete DNA recovery from the solid phase. | Find the minimal volume that ensures >85% recovery of captured cfDNA. |
| Plasma Input Volume | - Low Input: Yields insufficient DNA molecules, risking false negatives, especially for low-VAF variants.- High Input: May exceed binding capacity of the extraction system, leading to saturation and nonlinear recovery. | Maximize within the linear recovery range of the extraction chemistry; typically 2-5 mL. |
| Sample Concentration | - Influenced by both elution volume and plasma input.- Must be sufficient for the specific downstream application (e.g., ddPCR, NGS). | Achieve a concentration that allows for the required number of input genome equivalents in the downstream assay. |
Evidence from recent studies underscores the importance of these parameters. In the clinical validation of the SafeCAP 2.0 magnetic bead-based kit, a final elution volume of 40 µL was used, which helped achieve a low limit of detection (LoD) of 0.3 pg/µL and a limit of quantification (LoQ) of 1 pg/µL [65]. For low-volume archival samples, one study found that using a high-efficiency extraction system (MagNA Pure 96) that yielded 28% higher cfDNA isolation efficiency was critical for maintaining an 80% sensitivity in HPV-cfDNA detection, even when plasma volumes dropped below 750 µL [66].
Experimental Protocols for Parameter Optimization
Protocol: Determining Optimal Elution Volume for Magnetic Bead-Based Kits
This protocol is designed to empirically determine the most effective elution volume for a given magnetic bead-based cfDNA extraction system.
Research Reagent Solutions:
- Magnetic Beads: Silica-coated magnetic beads for nucleic acid binding [65] [36].
- Binding Buffer: Typically contains guanidine salt, sodium sulfate, and 2-propanol to promote DNA adherence to beads [65].
- Wash Buffers: Ethanol-based solutions (70-80%) with low salt concentration for removing impurities [65] [36].
- Elution Buffer: Low-ionic-strength buffer, such as Tris-HCl or TE buffer (pH 8.0), to efficiently desorb DNA from the beads [65] [36].
Methodology:
- Spike and Split Sample: Spike a known quantity of a synthetic double-stranded oligonucleotide standard (e.g., 50 ng of a ~160 bp fragment) into multiple 1 mL aliquots of DNA-free human plasma [65].
- Extraction: Process each aliquot identically through the lysis and binding steps of your chosen magnetic bead-based protocol.
- Elution Variation: After the final wash step, elute each sample in a different volume of pre-warmed (60°C) elution buffer. Test a range of volumes, for example: 20 µL, 40 µL, 60 µL, and 100 µL.
- Quantification and Analysis: Quantify the recovered oligonucleotide in each eluate using a fluorometric method (e.g., Qubit HS DNA assay) and a PCR-based method (e.g., ddPCR targeting the spike-in sequence) [67] [68]. The optimal elution volume is the smallest volume that recovers >85% of the measurable DNA, thus providing the highest concentration without significant loss.
Protocol: Establishing Linearity of Plasma Input Volume
This protocol assesses the relationship between plasma input volume and cfDNA yield, identifying the point of saturation for the extraction chemistry.
Methodology:
- Sample Preparation: Use a pooled plasma sample or spike a consistent amount of reference material (e.g., Seraseq ctDNA) into DNA-free plasma to minimize biological variability [2].
- Variable Input: Extract cfDNA from a series of increasing plasma volumes (e.g., 0.5 mL, 1 mL, 2 mL, 3 mL, 4 mL, 5 mL) while keeping the final elution volume constant (e.g., 40-60 µL) [2].
- Quantification: Measure the total cfDNA yield (ng) and the concentration (ng/µL) for each input volume using fluorometry and a sensitive qPCR or ddPCR assay [67].
- Data Interpretation: Plot the total yield against the input volume. The linear range is where the yield increases proportionally with volume. The point where the curve plateaus indicates the system's binding capacity has been saturated. For clinical applications, choose an input volume within the linear range that provides sufficient DNA for downstream analysis.
Integrated Workflow for Low-Concentration Samples
The following diagram illustrates the critical decision points and optimized steps for processing low-concentration cfDNA samples, from blood collection to final elution.
Essential Research Reagent Solutions
Successful optimization relies on a suite of specific reagents and materials. The following table details key components for establishing a robust cfDNA workflow.
Table 2: Essential Research Reagents for cfDNA Workflows
| Reagent / Material | Function in Workflow | Key Considerations |
|---|---|---|
| Preservative Blood Collection Tubes (e.g., Streck, PAXgene) | Prevents white blood cell lysis and genomic DNA contamination, allowing delayed processing for up to several days [19] [30]. | Essential for multi-center studies or when immediate processing is logistically challenging. |
| Magnetic Beads (Silica-coated) | Solid-phase matrix for binding cfDNA from a solution; compatible with automation and provides high recovery of short fragments [2] [65] [36]. | Bead size and surface chemistry (e.g., -COOH, -OH) impact recovery efficiency and should be optimized [65]. |
| Lysis Buffer | Disrupts protein-DNA complexes and exposes cfDNA for binding, typically containing guanidinium HCl and detergents [65]. | Critical for efficient release of cfDNA, especially from nucleosomal complexes. |
| Binding Buffer | Creates conditions (e.g., high salt, presence of isopropanol/PEG) that promote cfDNA binding to the magnetic beads or silica membrane [65]. | Formulation affects the efficiency of short fragment capture. |
| Wash Buffers | Remove proteins, salts, and other contaminants from the bound DNA, typically ethanol-based [65] [36]. | Must be stringent enough to remove impurities without causing DNA loss or introducing PCR inhibitors. |
| Elution Buffer (e.g., Tris-HCl, TE buffer) | Desorbs purified cfDNA from the solid phase into an aqueous solution [65] [36]. | Low ionic strength and slightly alkaline pH (8.0-9.0) facilitate efficient elution. |
| Reference Materials (e.g., Seraseq ctDNA, nRichDX) | Synthetic cfDNA standards spiked into plasma for spike-and-recovery experiments to quantify extraction efficiency and assay performance [2]. | Vital for workflow validation, quality control, and comparing performance across different lots or labs. |
Optimizing elution volumes and plasma input is not a one-size-fits-all endeavor but a necessary process that must be tailored to the specific extraction chemistry and analytical requirements of the project. By adhering to the protocols outlined here—systematically testing elution volumes, establishing the linear range for plasma input, and integrating these into a standardized workflow—researchers can significantly improve the yield and quality of cfDNA from critical low-concentration samples. This rigorous approach to pre-analytical optimization ensures that maximum genetic information is retained from precious samples, thereby enhancing the sensitivity and reliability of downstream liquid biopsy analyses in both research and drug development contexts.
The analysis of cell-free DNA (cfDNA) from plasma has become a cornerstone of liquid biopsy applications in oncology, prenatal diagnostics, and transplantation medicine. The reliability of these analyses is critically dependent on the quality of the extracted cfDNA, which can be influenced by numerous pre-analytical and analytical factors. Research demonstrates that higher levels of cfDNA in cancer patients are associated with poorer clinical outcomes, highlighting the importance of accurate quantification and characterization [69]. Effective quality control (QC) is therefore not merely procedural but fundamental to generating clinically actionable data. This application note details comprehensive QC best practices for assessing the three pillars of cfDNA quality: fragment size distribution, sample purity, and the absence of inhibitors, all within the context of plasma processing for cfDNA extraction research.
The unique nature of cfDNA presents specific QC challenges. Unlike genomic DNA, cfDNA is fragmented, with a characteristic peak around 167 base pairs (bp) in plasma, corresponding to DNA wrapped around a nucleosome [70]. The fragment size profile can serve as an indicator of sample integrity and origin. Furthermore, cfDNA exists in low concentrations in healthy individuals, making it susceptible to interference from contaminants [71]. A rigorous, multi-parametric QC strategy is essential to control these variables, ensuring that downstream applications such as next-generation sequencing (NGS), droplet digital PCR (ddPCR), and quantitative PCR (qPCR) yield reliable and reproducible results.
Core Quantification and Qualification Methods
A robust cfDNA QC workflow employs orthogonal methods to characterize different aspects of the sample. The choice of technique depends on the required information—whether it is concentration, purity, fragment size, or functional integrity. No single method provides a complete picture; instead, they complement each other to give researchers confidence in their sample quality before proceeding to costly downstream applications.
The table below summarizes the primary techniques used for cfDNA quality control, their underlying principles, and key applications.
Table 1: Core Methodologies for cfDNA Quality Control
| Method | Principle | Information Provided | Sample Volume | Key Metric(s) |
|---|---|---|---|---|
| Fluorometry (e.g., Qubit) | Fluorescent dye binding to dsDNA | Highly specific DNA concentration, yield [72] | 1-20 µL | Concentration (ng/µL), Total Yield (ng) |
| Spectrophotometry (e.g., NanoDrop) | UV light absorbance by nucleic acids | Nucleic acid concentration, purity assessment (contaminant detection) [72] | 0.5-2 µL | A260/A280, A260/A230, Concentration |
| qPCR/RT-qPCR | Amplification of specific DNA sequences | Presence of inhibitors, amplifiable DNA concentration, absolute quantification [69] | Variable | Cq values, Amplification Efficiency |
| Agarose Gel Electrophoresis | Size separation by electric charge | Fragment size distribution, gross contamination (e.g., RNA) [72] | 5-20 µL | Banding pattern, smear analysis |
| Bioanalyzer/TapeStation (Microfluidics) | Electrokinetic separation and fluorescence detection | High-resolution fragment size distribution, concentration, Integrity Number [71] | 1 µL | Peak profile, DV200, DIN |
Comparative Performance of Quantification Techniques
Different quantification methods can yield varying results for the same cfDNA sample due to their different detection principles. A 2023 study on breast cancer cfDNA provides a direct comparison of three common techniques, revealing critical differences in their performance and diagnostic utility [69].
Table 2: Comparative Performance of cfDNA Quantification Methods in Clinical Research
| Method | Key Finding in Breast Cancer Study | Statistical Significance (p-value) | Primary Utility in QC |
|---|---|---|---|
| Fluorometry (Quantus) | Identified a significant difference in cfDNA levels between patients and healthy controls. | Not specified in excerpt | Accurate concentration measurement, unaffected by RNA contamination. |
| Spectrophotometry (NanoDrop) | Used for concentration measurement and purity assessment. | Not specified in excerpt | Rapid assessment of sample purity and contamination. |
| RT-qPCR (ALU115) | Produced the most statistically significant results for discriminating patients from healthy controls. | p=0.000 [69] | Detection of amplifiable DNA, identification of PCR inhibitors. |
| Combined Fluorometry & RT-qPCR | Recommended as an efficacious approach for preliminary assessment of total circulating cfDNA. | N/A | Provides both accurate concentration and functional integrity. |
This data underscores that while fluorometry provides excellent specificity for concentration, and spectrophotometry quickly identifies major contaminants, functional assays like RT-qPCR can offer the highest sensitivity for detecting biologically relevant differences in cfDNA levels. The combination of fluorometric measurement and RT-qPCR was concluded to be particularly effective [69].
Detailed Experimental Protocols
Integrated Workflow for cfDNA QC Analysis
The following diagram illustrates the comprehensive workflow for the extraction and quality control of cell-free DNA from plasma, integrating the protocols detailed in this section.
Protocol 1: Plasma Separation and cfDNA Extraction
Principle: The objective of this initial protocol is to obtain high-quality, inhibitor-free cfDNA from blood plasma. The use of appropriate blood collection tubes and a double-centrifugation protocol is critical to prevent contamination by genomic DNA from lysed white blood cells [71].
Materials:
- Blood Collection Tubes: K2EDTA tubes or specialized Cell-Free DNA BCT tubes (e.g., Streck) [71].
- Centrifuge: Capable of maintaining 4°C.
- Pipettes and Sterile Tips.
- Microcentrifuge Tubes: Nuclease-free.
- cfDNA Extraction Kit: Examples include:
Procedure:
- Blood Collection and Handling: Draw blood into pre-chilled K2EDTA tubes. Invert tubes gently several times to mix. Process samples within 2 hours of collection [14].
- First Centrifugation: Centrifuge blood tubes at 1600–2500 × g for 10–30 minutes at room temperature to separate plasma from blood cells [14] [71].
- Plasma Transfer: Carefully transfer the upper plasma layer to a new sterile tube using a pipette, ensuring no disturbance to the buffy coat (white blood cell layer).
- Second Centrifugation: Centrifuge the transferred plasma a second time at 1600 × g for 10 minutes [14] or 16,000 × g for 10 minutes [71] to remove any remaining cellular debris.
- Plasma Aliquoting: Transfer the clarified plasma into fresh nuclease-free tubes. If not extracting immediately, store plasma at -80°C.
- cfDNA Extraction: Extract cfDNA from 1-5 mL of plasma using a dedicated cfDNA extraction kit, strictly following the manufacturer's instructions. This typically involves lysis, binding to a silica membrane or magnetic beads, washing, and elution in a small volume (e.g., 20-100 µL) of nuclease-free water or low-EDTA elution buffer [14] [71].
Protocol 2: Concentration and Purity Analysis
Principle: This protocol uses fluorometry and spectrophotometry to determine the concentration and purity of the extracted cfDNA. Fluorometry provides a highly specific DNA concentration, while spectrophotometry assesses purity by calculating absorbance ratios that indicate contamination [72].
Materials:
- Fluorometer (e.g., Qubit, Quantus) and associated dsDNA HS Assay Kit [69] [71].
- Microspectrophotometer (e.g., NanoDrop) [69].
- Nuclease-free water and tubes.
Procedure: A. Fluorometric Quantification (Qubit):
- Prepare the Qubit working solution by diluting the dsDNA HS reagent 1:200 in the provided Qubit buffer.
- Pipette 190 µL of working solution into each Qubit assay tube.
- Add 10 µL of each standard ( Standards 1 and 2) and cfDNA sample to the respective tubes. Mix by vortexing.
- Incubate at room temperature for 2 minutes.
- Read the samples on the Qubit fluorometer. The instrument will calculate and display the concentration.
- Calculate the total yield: Yield (µg) = Concentration (ng/µL) × Total Elution Volume (µL) / 1000 [72].
B. Spectrophotometric Analysis (NanoDrop):
- Clean the NanoDrop pedestals with nuclease-free water and a lint-free wipe.
- Pipette 1-2 µL of the elution buffer (or nuclease-free water) to perform a blank measurement.
- Wipe the pedestals and load 1-2 µL of the extracted cfDNA sample.
- Record the absorbance measurements at 230 nm, 260 nm, and 280 nm.
- Assess the sample purity using the calculated ratios:
Protocol 3: Fragment Size Distribution Analysis
Principle: Agarose gel electrophoresis separates DNA fragments by size, providing a visual assessment of the cfDNA fragment size distribution and integrity. It confirms the presence of the characteristic ~170 bp nucleosomal peak and the absence of high molecular weight genomic DNA contamination [72].
Materials:
- Agarose.
- Electrophoresis chamber and power supply.
- TAE or TBE buffer.
- DNA stain (e.g., ethidium bromide or a safer alternative like SYBR Safe).
- DNA molecular weight ladder (e.g., 100 bp ladder).
- Gel loading dye.
- Gel documentation system.
Procedure:
- Prepare a 2-3% agarose gel by dissolving agarose in 1X TAE or TBE buffer. Microwave until clear, allow to cool, add nucleic acid stain, and pour into a gel tray with a comb.
- Once solidified, place the gel in the electrophoresis chamber filled with 1X TAE or TBE buffer.
- Mix 5-20 µL of cfDNA sample with 6X loading dye.
- Load the sample and an appropriate DNA ladder into the wells.
- Run the gel at 5-8 V/cm until the dye front has migrated sufficiently.
- Visualize the gel under UV light and capture an image.
- Interpretation: A successful plasma cfDNA extraction should show a dominant band or smear centered around 150-200 bp. A strong, high molecular weight band indicates contamination with cellular genomic DNA, which can compromise downstream analyses [72] [71].
Protocol 4: Inhibitor Detection via qPCR Amplification
Principle: This functional assay tests the amplifiability of the cfDNA, which is the ultimate test for the presence of PCR inhibitors. Inhibition is detected by a delay or failure in the amplification of a control gene, or by using a spiked-in synthetic control [69].
Materials:
- Real-Time PCR system.
- qPCR master mix (e.g., SYBR Green or TaqMan).
- Primers for a ubiquitous single-copy gene (e.g., ALU repeats, β-actin, AGO1) [69] [70].
- Nuclease-free water and PCR plates/tubes.
Procedure:
- Dilute the cfDNA sample to a working concentration (e.g., 1-5 ng/µL).
- Prepare the qPCR reaction mix according to the manufacturer's instructions, including the master mix, primers, and template DNA.
- For inhibitor detection, include a reaction where a known quantity of synthetic control DNA (e.g., CEREBIS spike-in) is added to the cfDNA sample [70].
- Run the qPCR protocol with appropriate cycling conditions.
- Analysis:
- Compare the Cq (quantification cycle) values of the samples to those of a positive control (a known clean DNA sample) and a no-template control (NTC).
- A significant increase in the Cq value (> 2 cycles) for the test sample compared to the positive control suggests the presence of PCR inhibitors.
- If a spike-in control is used, a high Cq or failure to amplify the spike-in directly confirms inhibition, as the sample's endogenous DNA may be unaffected by the inhibitors.
The Scientist's Toolkit: Essential Research Reagents and Materials
Successful cfDNA quality control relies on a suite of specialized reagents and kits. The selection of an appropriate extraction method is crucial, as studies show reproducible, method-specific extraction efficiencies that can impact final yield and fragment representation [70].
Table 3: Key Research Reagent Solutions for cfDNA Analysis
| Product Category/Name | Manufacturer | Primary Function | Key Characteristics |
|---|---|---|---|
| QIAamp Circulating Nucleic Acid Kit | Qiagen | Silica-membrane based cfDNA extraction from plasma. | Widely used; high recovery efficiency for plasma cfDNA [70]. |
| MagMax Cell-Free Total Nucleic Acid Isolation Kit | Thermo Fisher Scientific | Magnetic bead-based extraction of total nucleic acids. | Compatible with automation; used in studies of healthy donors [71]. |
| Maxwell RSC ccfDNA Plasma Kit | Promega | Automated, magnetic bead-based cfDNA extraction on Maxwell instrument. | Provides consistent yields, minimizes cross-contamination [69]. |
| Quick-DNA/RNA MagBead Kit | Zymo Research | Magnetic bead-based nucleic acid purification. | Effective inhibitor removal; suitable for sensitive applications [73]. |
| Qubit dsDNA HS Assay Kit | Thermo Fisher Scientific | Fluorometric quantification of dsDNA. | Highly specific for dsDNA; insensitive to RNA/salt contamination [72] [71]. |
| QuantiFluor dsDNA System | Promega | Fluorometric quantification of dsDNA. | Used with Quantus Fluorometer for concentration and yield [72] [69]. |
| Oncomine Lung/Breast cfDNA Assay | Thermo Fisher Scientific | Targeted NGS library preparation from cfDNA. | Enables sensitive mutation detection from low-input cfDNA [14] [71]. |
| CEREBIS Spike-in | Synthetic Construct | Synthetic DNA spike-in to evaluate extraction efficiency. | Non-human, size-matched to cfDNA; monitors technical variability [70]. |
The implementation of a multi-faceted quality control strategy is non-negotiable for rigorous cfDNA research. By systematically assessing fragment size, purity, and the presence of inhibitors through the detailed protocols outlined herein, researchers can ensure the analytical validity of their data. The consistent application of these best practices, utilizing the appropriate tools from the scientist's toolkit, forms the foundation for reliable downstream molecular analyses. This, in turn, enhances the reproducibility of research and bolsters the translation of cfDNA-based liquid biopsy from a research tool into validated clinical applications.
Benchmarking and Validation: Ensuring Analytical Rigor for Clinical and Research Use
The reliability of liquid biopsy results for cancer detection and monitoring is fundamentally dependent on the robustness of the underlying analytical methods. Establishing a comprehensive validation framework for cell-free DNA (cfDNA) analysis is therefore critical for both clinical diagnostics and research applications. This framework must rigorously address three core performance parameters: analytical sensitivity (the ability to detect low-abundance variants), reproducibility (consistency across operators, instruments, and time), and recovery efficiency (the proportion of cfDNA successfully extracted from plasma) [2] [74]. The pre-analytical phase, particularly plasma processing and cfDNA extraction, introduces significant variability that can compromise downstream molecular analyses if not properly controlled [30]. This application note provides detailed protocols and experimental designs for establishing an analytical validation framework tailored to cfDNA research, contextualized within a broader thesis on plasma processing.
Core Validation Parameters and Experimental Design
A comprehensive validation framework must quantitatively assess key performance metrics using appropriate reference materials and controlled experiments. The table below summarizes the primary parameters, their definitions, and experimental approaches for evaluation.
Table 1: Core Analytical Validation Parameters for cfDNA Workflows
| Validation Parameter | Definition | Key Experimental Approach | Typical Target Performance |
|---|---|---|---|
| Analytical Sensitivity | Lowest variant allele frequency (VAF) reliably detected [74] | Testing serially diluted reference standards (e.g., Seraseq ctDNA) with known VAFs (0.1%-5%) [2] [74] | >95% detection at LOD95 (e.g., 3.45 PPM) [75] |
| Reproducibility | Agreement between results across different runs, operators, days, and instruments [76] | Replicate testing (n≥3) of identical samples in varying conditions [2] [33] | ≥95% agreement in measured tumor fraction or variant calls [76] |
| Recovery Efficiency | Percentage of input cfDNA successfully isolated [33] | Spike-in experiments using synthetic cfDNA (e.g., CEREBIS, nRichDx) into DNA-free plasma [2] [33] | High recovery (e.g., 70-90%) with minimal gDNA contamination [2] [36] |
| Precision | Closeness of agreement between independent results under specified conditions (includes repeatability) [75] | Multiple extractions and measurements from the same plasma pool over time [33] [77] | Coefficient of variation ≤12.8% across a dynamic range [75] |
| Linearity | Ability of the method to obtain results directly proportional to analyte concentration [75] | Testing a range of cfDNA inputs (e.g., 1-50 ng) or spike-in concentrations [2] [76] | Pearson correlation coefficient ≥0.99 [75] |
Quantitative Data from Validation Studies
Recent studies provide benchmark data for these validation parameters, achieved through optimized workflows. The following table compiles quantitative performance metrics from published validation studies.
Table 2: Representative Performance Metrics from cfDNA Assay Validations
| Study / Assay | Sensitivity (LOD95) | Recovery Efficiency | Precision (CV) | Key Methodology |
|---|---|---|---|---|
| NeXT Personal Assay [75] | 3.45 Parts Per Million (PPM) | N/R | 12.8% to 3.6% (25-25,000 PPM) | Tumor-informed, whole-genome sequencing |
| SafeCAP 2.0 Kit [78] | 0.3 pg/μL (LoD) | Equivalent or superior to commercial benchmark | No detectable PCR inhibition | Magnetic bead-based optimization |
| Shallow WGS (ichorCNA) [76] | 97.2% detection at TFx=3% (1x coverage) | N/R | >95% agreement across replicates | Low-pass whole-genome sequencing |
| Magnetic Bead-based System [2] | High sensitivity for expected variants in reference materials | High recovery rates, minimal gDNA contamination | Strong concordance across expected variants | Magnetic beads, high-throughput automation |
| Direct qPCR (no extraction) [77] | LOQ: 0.47 ng/mL (90 bp assay) | Avoids extraction-related losses | Intermediate precision ≤12.1% | SYBR Green-based detection of L1PA2 repeats |
Figure 1: Analytical Validation Workflow for cfDNA Analysis. This diagram outlines the three-phase framework for establishing validated cfDNA methods, connecting pre-analytical processing with core performance assessment and final verification.
Detailed Experimental Protocols
Protocol 1: Determining Recovery Efficiency Using Spike-in Controls
Principle: Adding known quantities of synthetic cfDNA to plasma before extraction enables precise calculation of recovery efficiency by comparing output to input quantities [33].
Materials:
- DNA-free human plasma (commercially available)
- Synthetic cfDNA reference standard (e.g., nRichDx, CEREBIS, Seraseq ctDNA)
- Magnetic bead-based cfDNA extraction kit
- Fluorometer (Qubit) or ddPCR system for quantification
Procedure:
- Spike-in Preparation: Spike DNA-free plasma with reference standard at known concentrations (e.g., 10-200 ng of nRichDx standard into 2 mL plasma) [2].
- Extraction: Process spiked samples through your cfDNA extraction workflow alongside unspiked controls.
- Quantification: Measure recovered DNA concentration using fluorometry (Qubit HS DNA assay) and/or target-specific methods (ddPCR for spike-in sequence).
- Calculation: Calculate percentage recovery as: (Measured output concentration / Expected input concentration) × 100.
Technical Notes:
- Use spike-ins that mimic native cfDNA size distribution (e.g., ~167 bp) for realistic recovery assessment [33].
- The CEREBIS spike-in fragment is specifically designed for evaluating both extraction and bisulfite conversion efficiency [33].
- Expected recovery efficiencies for optimized magnetic bead-based methods typically range from 70-90% [2] [36].
Protocol 2: Assessing Sensitivity and Limit of Detection (LOD)
Principle: Serial dilution of reference materials with known variant allele frequencies (VAF) determines the lowest concentration at which variants can be reliably detected [74] [75].
Materials:
- Commercial ctDNA reference standards with predetermined VAFs (e.g., Seraseq ctDNA with VAFs of 0.1%, 0.5%, 1%, 5%)
- DNA extraction kit and downstream analysis platform (NGS, ddPCR)
- Statistical software for Probit analysis
Procedure:
- Sample Preparation: Obtain reference standards covering a range of VAFs, preferably including levels below your expected LOD.
- Extraction and Analysis: Process each reference standard through your complete workflow (extraction to analysis) with sufficient replication (n≥5 recommended at each VAF).
- Variant Calling: Perform blinded analysis of samples and record detection/non-detection for expected variants.
- Statistical Analysis: Use Probit analysis to determine the VAF at which 95% of expected variants are detected (LOD95) [75].
Technical Notes:
- For tumor-informed assays, LOD95 as low as 3.45 PPM (0.000345%) has been demonstrated [75].
- Sensitivity is highly dependent on cfDNA input amount; establish minimum input requirements (e.g., 5-20 ng) during validation [76].
- Include different variant types (SNVs, INDELs, CNVs) as sensitivity may vary [74].
Protocol 3: Evaluating Reproducibility and Precision
Principle: Systematic testing of identical samples across variable conditions (time, operators, instruments) quantifies method robustness [76] [33].
Materials:
- Pooled patient plasma or commercial reference standards
- Multiple operators, instruments, and reagent lots if available
- Data tracking spreadsheet for statistical analysis
Procedure:
- Sample Pooling: Create a large, homogeneous pool of plasma or use commercial reference standards to ensure identical starting material.
- Inter-day Precision: Aliquot and process identical samples across different days (≥3 days) by the same operator.
- Inter-operator Precision: Have multiple trained technicians (≥2) process identical samples independently.
- Inter-instrument Precision: If available, run identical extracted samples on different instruments of the same type.
- Data Analysis: Calculate coefficient of variation (CV) for quantitative results (e.g., tumor fraction, variant allele frequency) across all conditions.
Technical Notes:
- For cfDNA quantification, CV values ≤12% demonstrate acceptable precision [77].
- Shallow whole-genome sequencing for tumor fraction determination has shown >95% agreement across replicates and sequencing instruments [76].
- Biological variability typically exceeds technical variability; ensure sufficient sample pooling to isolate technical effects [33].
The Researcher's Toolkit: Essential Reagents and Materials
Table 3: Essential Research Reagents for cfDNA Analytical Validation
| Reagent / Material | Function | Examples & Specifications |
|---|---|---|
| Reference Standards | Validate sensitivity, accuracy, and recovery using materials with known properties | Seraseq ctDNA (variant panels), nRichDx (mononucleosomal DNA), AcroMetrix multi-analyte controls [2] [74] |
| Spike-in Controls | Monitor extraction efficiency and normalize for technical variability | CEREBIS constructs (e.g., 180 bp, 89 bp), synthetic oligonucleotides with non-human sequences [33] |
| Specialized Blood Collection Tubes | Maintain sample stability during transport and storage | Streck Cell-Free DNA BCT, PAXgene Blood ccfDNA tubes, K2EDTA tubes [36] [30] |
| Nucleic Acid Extraction Kits | Isolate cfDNA from plasma with high efficiency and minimal contamination | Magnetic bead-based kits (e.g., SafeCAP 2.0, commercial high-throughput systems), silica membrane kits [2] [78] [36] |
| Quantification Methods | Precisely measure cfDNA concentration and quality | Fluorometry (Qubit HS DNA assay), fragment analyzers (Bioanalyzer, TapeStation), ddPCR [2] [76] [36] |
Establishing a rigorous analytical validation framework for cfDNA analysis is prerequisite for generating reliable data in both research and clinical settings. By implementing the protocols outlined in this application note—systematically evaluating sensitivity, reproducibility, and recovery efficiency—researchers can ensure their plasma processing and cfDNA extraction workflows yield robust, interpretable results. The use of appropriate reference materials, spike-in controls, and statistical approaches detailed herein provides a comprehensive method for demonstrating assay performance, ultimately supporting the growing importance of liquid biopsy in precision oncology and other research applications.
Spike-and-recovery experiments are fundamental for validating the accuracy and efficiency of circulating tumor DNA (ctDNA) extraction and analysis workflows. These experiments determine whether analyte detection is affected by differences between the standard curve diluent and the biological sample matrix [79]. In the context of a broader thesis on plasma processing for cell-free DNA (cfDNA) extraction, the use of well-characterized reference materials is a critical pre-analytical step to ensure that downstream molecular applications, such as next-generation sequencing (NGS) and digital PCR (dPCR), yield reliable and reproducible results [2]. This protocol details the application of commercially available ctDNA controls for conducting spike-and-recovery and linearity-of-dilution assessments, which are essential for qualifying entire liquid biopsy workflows from blood collection to data analysis [2] [80].
The Role of Spike-and-Recovery Experiments in ctDNA Analysis
The core principle of a spike-and-recovery experiment is to add a known quantity of a reference analyte into the intended sample matrix and then measure the percentage of the analyte that is recovered by the assay [79]. For ctDNA analysis, this involves spiking a synthetic or cell line-derived ctDNA reference standard into DNA-free plasma or a plasma-like matrix. A recovery rate of 100% indicates that the sample matrix does not interfere with the detection of the analyte. Discrepancies from 100% signal the presence of matrix effects that can inhibit or enhance detection, potentially leading to inaccurate variant allele frequency (VAF) quantification in patient samples [2] [79]. These experiments are therefore indispensable for demonstrating that an extraction and detection workflow is fit for its intended purpose, particularly for sensitive applications like minimal residual disease (MRD) monitoring and early cancer detection [81] [82].
Essential Reference Materials and Reagents
A successful spike-and-recovery study relies on high-quality, well-defined reference materials. The table below summarizes key commercially available controls utilized in recent validation studies.
Table 1: Commercial Reference Materials for ctDNA Spike-and-Recovery Experiments
| Reference Material | Key Characteristics | Reported Application in Validation |
|---|---|---|
| nRichDx cfDNA Reference Standard [2] | - Contains mono-, di-, and trinucleosomal DNA fragments (~150 bp, ~340 bp, ~560 bp)- Harbors KRAS p.G12V mutation- Concentration: 1 ng/µL in TE buffer | Used for assessing extraction recovery via qPCR. Linearity tested with input volumes from 0.5-6 mL and concentrations from 10-200 ng spiked into DNA-free plasma. |
| Seraseq ctDNA Complete Reference Material [2] | - Provided in a plasma-like matrix- Multiple VAF levels (e.g., 0.1%, 0.5%, 1%, 5%)- Contains 25 multiplexed variants (SNVs, INDELs, CNVs, SVs) across 16 genes | Evaluated extraction efficiency, accuracy, precision, and reproducibility. Used for downstream NGS assay validation. |
| AcroMetrix Multi-analyte ctDNA Plasma Control [2] | - Fragmented synthetic DNA in human plasma matrix- Multiple VAF levels (0%, 0.1%, 0.5%, 1%)- Includes 7 SNVs, 4 INDELs, and 2 CNVs | Employed to assess cfDNA extraction efficiency across a range of mutation burdens. |
| DNA-free Plasma (e.g., from Zeptometrix) [2] | - Serves as a clean matrix for spiking experiments- Confirms the absence of background DNA that could interfere with recovery calculations | Used as the dilution matrix for spiking different concentrations of the nRichDx cfDNA reference standard. |
The Scientist's Toolkit: Key Research Reagent Solutions
Table 2: Essential Materials and Reagents for ctDNA Workflow Validation
| Item | Function | Example/Brief Explanation |
|---|---|---|
| Stabilizing Blood Collection Tubes | Preserves blood sample integrity | Tubes with cell-stabilizing preservatives (e.g., from Streck, Qiagen) prevent white blood cell lysis and gDNA contamination during storage/transport [83] [84]. |
| Magnetic Bead-based Extraction Kits | Isolates cfDNA from plasma | High-throughput, automated systems (e.g., Apostle MiniMax, SafeCAP 2.0) offer superior recovery of fragmented cfDNA and minimal gDNA contamination [2] [65]. |
| Fragment Analysis System | Assesses cfDNA quality and size | Systems like the Agilent TapeStation or Bioanalyzer confirm the presence of the characteristic ~167 bp mononucleosomal peak and the absence of high molecular weight gDNA [2]. |
| Ultra-Sensitive Detection Platforms | Quantifies ctDNA and specific mutations | dPCR, ddPCR, and error-corrected NGS platforms are essential for detecting low VAF variants in spiked and patient samples [81] [85]. |
Experimental Protocol: Spike-and-Recovery and Linearity Assessment
This section provides a detailed methodology for performing spike-and-recovery and linearity-of-dilution experiments, adapted from published literature and commercial guidelines [2] [79].
The following diagram illustrates the overarching logic and workflow for conducting a combined spike-and-recovery and linearity assessment.
Step-by-Step Procedure
Step 1: Spike into Standard Diluent and Sample Matrix
- Prepare a dilution series of the reference ctDNA material (e.g., nRichDx, Seraseq) in the standard diluent used for your calibration curve (e.g., TE buffer) [79].
- In parallel, spike the same known amounts of the reference ctDNA material into the intended sample matrix, which is typically DNA-free plasma [2] [79]. For a linearity-of-dilution assessment, a single spike level can be added to a series of dilutions of the sample matrix.
Step 2: Process Samples Through the Entire Workflow
- Subject both the standard diluent spikes and the sample matrix spikes to the complete analytical workflow. This includes:
- cfDNA Extraction: Use the validated magnetic bead-based or silica membrane method [2] [65].
- Quantification and QC: Measure cfDNA concentration and fragment size distribution using a fluorometric assay or microelectrophoresis system [2].
- Downstream Analysis: Analyze the samples using the intended detection technology, such as qPCR/ddPCR for a specific mutation (e.g., KRAS p.G12V) or NGS for a broader panel of variants [2] [85].
Step 3: Calculate Percentage Recovery
- For each spike level, calculate the percentage recovery using the formula:
% Recovery = (Measured concentration in sample matrix / Measured concentration in standard diluent) × 100[79]. - The results are often summarized as mean recovery across replicates for low, medium, and high spike levels. Acceptable recovery typically falls between 80% and 120% [79].
Step 4: Assess Linearity of Dilution
- Using the data from the spiked sample matrix dilutions, plot the observed concentration (multiplied by the dilution factor) against the expected concentration (or the dilution factor) [79].
- Calculate the coefficient of determination (R²). A value of >0.95 generally indicates excellent linearity, meaning samples can be reliably diluted to fall within the assay's dynamic range [79].
Workflow Integration and Data Interpretation
The experimental workflow for validating the pre-analytical phase, which includes spike-and-recovery, is complex and involves multiple coordinated steps as shown below.
Troubleshooting Poor Recovery and Linearity
- Poor Recovery (<80% or >120%): This indicates interference from the sample matrix [79].
- Cause: The standard diluent and sample matrix affect analyte detectability differently, potentially due to inhibitors or enhancers present in the plasma.
- Solution: Alter the sample matrix by diluting it in the standard diluent or adding a carrier protein. Alternatively, adjust the standard diluent to more closely match the sample matrix's composition, though this may affect the assay's signal-to-noise ratio [79].
- Poor Linearity (R² <0.95): This suggests that the detectability of the analyte changes non-linearly with dilution.
- Cause: Often related to the same factors causing poor spike and recovery. Components in the sample matrix that inhibit or enhance detection may not be diluted linearly [79].
- Solution: Optimize the sample diluent as described above. A single checkerboard experiment varying spike levels, sample types, and dilution factors can simultaneously diagnose both issues [79].
The integration of spike-and-recovery experiments using commercial ctDNA reference materials is a non-negotiable component of a robust plasma processing and cfDNA extraction research thesis. By systematically validating recovery rates and linearity, researchers can ensure their liquid biopsy workflows generate accurate, reproducible, and clinically meaningful data. The protocols and materials outlined here provide a foundation for establishing a standardized pre-analytical pipeline, ultimately supporting the reliable implementation of ctDNA analysis in precision oncology.
Within the broader research on plasma processing for cell-free DNA (cfDNA) analysis, the extraction step is a critical pre-analytical variable that directly influences the success of all downstream applications. Circulating cfDNA in plasma is typically present in low concentrations (often less than 10 ng/mL in healthy individuals) and is highly fragmented, with a characteristic peak around 166 base pairs [86] [19]. These inherent challenges place significant demands on extraction methodologies to efficiently recover these scarce molecules without introducing bias or contamination. The selection of an optimal extraction kit is therefore paramount for sensitive detection of rare variants in liquid biopsy, robust genomic analysis, and reliable biomarker discovery. This application note provides a structured, head-to-head comparison of leading commercial cfDNA extraction kits, summarizing quantitative performance data and detailing the experimental protocols essential for informed kit selection.
The performance of several commercially available cfDNA extraction kits was evaluated based on key metrics including DNA yield, recovery efficiency, and fragment size profile. The following tables consolidate quantitative findings from comparative studies.
Table 1: Comparison of cfDNA Isolation Kit Performance from Plasma
| Extraction Kit | Average Yield (from 4 mL Plasma) | Key Performance Characteristics | Recommended Downstream Application |
|---|---|---|---|
| QIAamp Circulating Nucleic Acid Kit (CNA) | ~13.9 - 17.6 ng [86] | Highest yield in comparisons; may contain slightly more high molecular weight DNA [86]. | Applications requiring maximum yield (e.g., low-frequency variant detection) [86] [18]. |
| QIAamp MinElute ccfDNA Kit | ~16.5 - 17.4 ng [87] | High yield and strong sequencing performance; recommended for nanopore sequencing [87]. | Sequencing applications, particularly nanopore sequencing [87]. |
| Maxwell RSC ccfDNA Plasma Kit | ~5.2 - 7.8 ng [86] | Lower yield compared to CNA kit; average fragment size ~174-177 bp [86]. | — |
| MagMAX Cell-Free DNA Isolation Kit | ~12.1 - 13.4 ng [87] | Lower yields in manual protocol; designed for automation on KingFisher instruments [87]. | Automated, high-throughput workflows. |
| SafeCAP 2.0 (Novel Kit) | Information missing | Cost-effective, high-performance magnetic bead-based solution; LoD of 0.3 pg/µL [65]. | Research and clinical workflows where cost is a consideration [65]. |
Table 2: Performance of Bisulfite Conversion Kits for Methylation Analysis
| Bisulfite Conversion Kit | DNA Recovery | Performance Notes |
|---|---|---|
| EpiTect Plus DNA Bisulfite Kit | 10-20% (for inputs ≥ 2 ng) [86] | Highest DNA concentration and recovery across input amounts; longest fragment lengths post-conversion [86]. |
| Premium Bisulfite Kit | 10-20% (for inputs ≥ 2 ng) [86] | Good performance, particularly in lower DNA input range (2-0.5 ng) [86]. |
| EZ DNA Methylation-Direct Kit | Information missing | Good performance in higher DNA input range (20-3 ng) [86]. |
| Imprint DNA Modification Kit | <10% [86] | Lowest recovery rate among tested kits [86]. |
Experimental Protocols for Kit Evaluation
To ensure reproducible and meaningful comparisons, the following standardized protocols should be adopted.
Protocol for Comparative Extraction from Plasma
This protocol outlines the steps for a head-to-head evaluation of different cfDNA extraction kits from plasma samples [86] [19].
- Sample Collection and Plasma Isolation: Collect whole blood into appropriate blood collection tubes (e.g., K2EDTA or preservative tubes like Streck BCT). Process plasma within 60 minutes for K2EDTA tubes or within the tube-specific stability period. Perform double centrifugation: first at 1,600 × g for 10 minutes at 4°C to separate plasma from cells, followed by a second centrifugation of the supernatant at 16,000 × g for 10 minutes to remove any residual cells or debris [86] [87] [19].
- cfDNA Extraction: Aliquot a standardized volume of plasma (e.g., 1-4 mL) for each extraction kit to be tested. Follow the manufacturer's instructions precisely for each kit. To control for variability, use a single, large-volume plasma pool from a healthy donor or patients, divided into aliquots for each kit [86] [87].
- Elution: Elute the purified cfDNA in a recommended elution buffer (e.g., Tris-HCl, pH 8.0-8.5) or nuclease-free water. Keep the elution volume consistent across all kits to allow for direct concentration comparison.
Protocol for Downstream Analysis: Droplet Digital PCR (ddPCR)
Droplet Digital PCR (ddPCR) provides absolute quantification of cfDNA concentration and recovery efficiency with high precision [86] [18].
- Quantification of Total cfDNA: Quantify the extracted cfDNA using a fluorometric method (e.g., Qubit dsDNA HS Assay). For more precise molecular quantification, use a multiplexed ddPCR assay that targets a reference gene (e.g., Ribonuclease P RNA component H1 (RPPH1) or a similar control assay) to determine the number of DNA molecules per microliter [86].
- Calculation of Extraction Yield and Efficiency: Calculate the total yield (ng) of cfDNA recovered from the initial plasma volume. The recovery efficiency can be further assessed by spiking a known quantity of synthetic DNA or fragmented genomic DNA into plasma prior to extraction and using a ddPCR assay specific to the spike-in to calculate the percentage recovery [86].
Protocol for Combining Extraction and Bisulfite Conversion
For DNA methylation analysis, the compatibility between extraction and bisulfite conversion kits is critical [86].
- Extraction: Extract cfDNA from patient plasma samples using the selected optimal isolation kit (e.g., QIAamp Circulating Nucleic Acid Kit).
- Bisulfite Conversion: Convert the extracted cfDNA using the selected bisulfite kit (e.g., EpiTect Plus DNA Bisulfite Kit), strictly following the manufacturer's protocol for low DNA input.
- Methylation Analysis: Analyze the bisulfite-converted DNA using a targeted, highly sensitive method such as ddPCR with assays specific for methylated genes (e.g., BCAT1 and IKZF1 for colorectal cancer) [86].
Workflow and Kit Optimization Visualization
The following diagrams illustrate the core experimental workflow for kit evaluation and the key parameters for optimizing magnetic bead-based extraction.
The Scientist's Toolkit: Essential Research Reagents and Materials
Table 3: Key Reagents and Equipment for cfDNA Extraction and Evaluation
| Item | Function/Description | Example Products/Assays |
|---|---|---|
| Blood Collection Tubes | Stabilize nucleated blood cells to prevent genomic DNA contamination and maintain cfDNA profile. | K2EDTA tubes (short-term), Streck Cell-Free DNA BCT, PAXgene Blood ccfDNA tubes [19]. |
| Magnetic Beads | Bind nucleic acids in presence of binding buffer; separated using a magnet. | Silica-coated magnetic beads with various functional groups (–COOH, –OH) [65]. |
| Lysis & Binding Buffers | Disrupt vesicles & proteins; create conditions for cfDNA binding to beads/columns. | Contain guanidine HCl, detergents (Triton X-100), isopropanol, PEG [65]. |
| Wash Buffers | Remove proteins, salts, and other impurities without eluting cfDNA. | Typically ethanol-based solutions with low salt concentration [65]. |
| Elution Buffer | Release pure cfDNA from beads/column; low ionic strength, slightly alkaline. | Tris-HCl (pH 8.0-8.5) or nuclease-free water [65]. |
| Droplet Digital PCR (ddPCR) | Absolute quantification of cfDNA concentration and assessment of extraction recovery. | Bio-Rad QX200; assays for reference genes (RPPH1) or spike-in controls [86]. |
| Parallel Capillary Electrophoresis | Analyze cfDNA fragment size distribution and profile. | Agilent Bioanalyzer, Agilent TapeStation, Agilent Femto Pulse system [87] [19] [18]. |
Correlating Extraction Efficiency with Downstream Assay Success in NGS and ddPCR
Within the evolving field of liquid biopsy, cell-free DNA (cfDNA) has emerged as a prominent biomarker for non-invasive disease detection and monitoring. The analytical journey of cfDNA, from blood collection to final data analysis, is fraught with technical challenges, primarily due to the low abundance and fragmented nature of cfDNA. The pre-analytical phase, particularly the efficiency and consistency of cfDNA extraction from plasma, is a critical determinant of success for sophisticated downstream assays like Next-Generation Sequencing (NGS) and Droplet Digital PCR (ddPCR). Research confirms that the choice of extraction method introduces significant variability in cfDNA yield and quality, which can directly impact the sensitivity, accuracy, and reliability of subsequent molecular analyses [18] [33]. This application note details the correlation between cfDNA extraction efficiency and downstream assay performance, providing structured data, validated protocols, and practical guidance to ensure analytical excellence.
The Critical Link: Extraction Efficiency and Assay Performance
The core objective of cfDNA extraction is to isolate a representative population of DNA fragments from plasma without introducing bias or significant loss. Inefficient extraction can lead to two major problems in downstream applications: (1) reduced sensitivity, increasing the risk of false negatives, especially for low-frequency variants; and (2) inaccurate quantification, which compromises the ability to monitor disease burden or biological changes over time.
Studies have demonstrated that different extraction methods exhibit reproducible but variable efficiencies. For instance, the QIAamp Circulating Nucleic Acid Kit has been shown to achieve a mean extraction efficiency of 84.1% (± 8.17) for a 180 bp spike-in fragment in plasma, significantly outperforming other methods tested [33]. This higher recovery rate translates directly into a greater yield of cfDNA, providing more input material for library preparation in NGS or template for ddPCR, thereby enhancing the assay's power.
Furthermore, extraction methods exhibit size-selective biases. This is particularly relevant for urinary cfDNA, which comprises a broader spectrum of fragment sizes, including short fragments below 100 bp. Methods like the in-house Q Sepharose (Qseph) protocol recover a larger proportion of these short (< 90 bp) fragments compared to the Zymo Quick-DNA Urine Kit [33]. Selecting an extraction method with an inappropriate size profile can thus systematically exclude a biologically relevant fraction of cfDNA, leading to skewed results in downstream fragmentation analyses or the failure to detect specific biomarkers.
Table 1: Comparison of cfDNA Extraction Method Efficiencies and Characteristics
| Extraction Method | Mean Extraction Efficiency (180 bp spike-in) | Key Characteristics | Best Suited For |
|---|---|---|---|
| QIAamp Circulating Nucleic Acid Kit | 84.1% (± 8.17) [33] | High yield, reproducible, minimal HMW DNA contamination [18] | High-sensitivity NGS & ddPCR applications |
| Zymo Quick-DNA Urine Kit | 58.7% (± 11.1) [33] | Higher yield for urine cfDNA, less efficient for <50bp fragments [33] | Urinary cfDNA studies focusing on longer fragments |
| Q Sepharose (Qseph) Protocol | 30.2% (± 13.2) [33] | Recovers shorter fragments (<90 bp), in-house protocol [33] | Research on short-fragment cfDNA populations |
Quantitative Data on Technical and Biological Variability
Understanding the sources of variability in a cfDNA workflow is essential for robust experimental design. A variance component analysis reveals that while technical variability (e.g., differences between extractions and ddPCR measurements) exists, it is often dwarfed by the biological variability between individuals [33]. This finding underscores the importance of meticulous sample processing to minimize the technical contribution, making the true biological signal clearer.
Pre-analytical factors extend beyond the extraction kit itself. The type of blood collection tube and the time interval between blood draw and plasma processing are major factors influencing cfDNA yield and purity. For example, when plasma is isolated immediately (<60 minutes), Streck and K2EDTA tubes provide high cfDNA yield. However, cfDNA concentrations in K2EDTA tubes can increase dramatically over time (e.g., to 68.19 ng/mL at 168 hours) due to leukocyte lysis and genomic DNA contamination, while preservative tubes like Streck maintain more stable yields [19]. Using qPCR assays targeting long vs. short DNA sequences or parallel capillary electrophoresis can help detect this contaminating high-molecular-weight DNA [19].
Table 2: Impact of Blood Collection Tubes on cfDNA Yield Over Time Data presented as average cfDNA concentration (ng/mL plasma) measured by qPCR [19].
| Blood Collection Tube | 0 Hours (Recommended) | 48 Hours | 168 Hours (1 Week) |
|---|---|---|---|
| K2EDTA | 2.41 | 7.39 | 68.19 |
| Streck | 2.74 | 2.38* | 2.38* |
| PAXgene | 1.66 | 1.74 | 2.48 |
| Norgen | 0.76 | 0.75 | 0.77 |
*Data estimated from trend described in text; Streck tubes showed a 13.1% decrease at 168h.
Experimental Protocols
Protocol: Evaluating cfDNA Extraction Efficiency Using Spike-Ins
The use of an exogenous, synthetic DNA spike-in is a reliable method to quantify the recovery efficiency of a cfDNA extraction process.
Principle: A known quantity of a non-human, size-standardized DNA construct (e.g., CEREBIS, 180 bp) is spiked into the plasma or urine sample prior to extraction. The recovery is quantified post-extraction using ddPCR, and the efficiency is calculated as (measured copies / input copies) × 100% [33].
Spike-in Preparation:
- Resuspend a lyophilized synthetic oligonucleotide (e.g., miR-39 for miRNA, CEREBIS for DNA) in nuclease-free water to create a stock solution [88].
- Perform serial dilutions to create a working solution and quantify it using a fluorometer (e.g., Qubit) to determine the exact concentration [88].
- Spike a defined volume of this solution into the plasma sample, ensuring the spike-in concentration is within the dynamic range of the downstream ddPCR assay.
Extraction and Quantification:
- Proceed with the chosen cfDNA extraction protocol.
- Elute the cfDNA in a defined volume.
- Quantify the recovered spike-in using a target-specific ddPCR assay.
- Calculate Extraction Efficiency:
Efficiency (%) = (Spike-in concentration post-extraction / Spike-in concentration pre-extraction) × 100.
Protocol: High-Sensitivity ddPCR for cfDNA Target Quantification
Droplet Digital PCR is prized for its absolute quantification and high sensitivity, making it ideal for analyzing low-abundance cfDNA targets.
Primer/Probe Design: Design assays to produce short amplicons (60-80 bp) to match the fragmented nature of cfDNA. For maximum specificity, use hydrolysis probes (e.g., TaqMan) [89].
ddPCR Reaction Setup (per 25 μL reaction) [88]:
12.5 μLddPCR Supermix (no dUTP)1.25 μLTaqMan Assay (20X concentration)5.0 μLTemplate cfDNA (or cDNA for miRNA)6.25 μLNuclease-free water
Droplet Generation and PCR:
- Load the reaction mix into a DG8 cartridge with 70 μL of droplet generation oil.
- Generate droplets using a Bio-Rad Droplet Generator.
- Transfer 40 μL of generated droplets to a 96-well PCR plate and seal.
- Perform PCR amplification with optimized cycling conditions.
- Read the plate on a droplet reader to count positive and negative droplets.
Data Analysis: Use the manufacturer's software to calculate the absolute concentration (copies/μL) of the target in the original sample based on Poisson statistics.
Protocol: NGS Library Preparation from Plasma cfDNA
Successful NGS requires a high-quality library that accurately represents the original cfDNA population.
Library Preparation:
- Assess Input cfDNA: Use fluorometry (e.g., Qubit) and fragment analysis (e.g., Agilent TapeStation) to quantify cfDNA and confirm the typical ~167 bp peak.
- End Repair & A-Tailing: Perform standard enzymatic steps to blunt the ends of cfDNA fragments and add an 'A' base for adapter ligation.
- Adapter Ligation: Ligate platform-specific sequencing adapters to the cfDNA fragments. Use uniquely barcoded adapters for sample multiplexing.
- Library Clean-Up and Size Selection: Use magnetic beads (e.g., SPRIselect) to remove adapter dimers and select for the desired fragment size range. This step is critical for removing short artifacts that can dominate sequencing runs.
- Library Amplification: Perform a limited-cycle PCR to enrich for adapter-ligated fragments.
Quality Control:
- Quantification: Use qPCR for accurate quantification of amplifiable library fragments.
- Fragment Analysis: Re-run on TapeStation or Bioanalyzer to confirm library size profile and absence of primer dimers.
Sequencing and Data QC:
- Sequence on the chosen NGS platform (e.g., Illumina MiSeq).
- Analyze raw FASTQ data with tools like FastQC to assess quality metrics (Q scores, GC content, adapter contamination) [90].
- Perform adapter trimming and quality filtering with tools like CutAdapt or Trimmomatic before alignment and variant calling [90].
The Scientist's Toolkit: Research Reagent Solutions
Table 3: Essential Reagents and Kits for cfDNA Analysis Workflows
| Item | Function | Example Products / Assays |
|---|---|---|
| cfDNA Extraction Kits | Isolation of cfDNA from plasma/urine with high efficiency and minimal contamination. | QIAamp Circulating Nucleic Acid Kit [18], QIAsymphony DSP Circulating DNA Kit [18] |
| Exogenous Spike-in Controls | Monitoring and normalizing for extraction efficiency. | CEREBIS construct [33], synthetic miR-39 [88] |
| Droplet Digital PCR (ddPCR) Systems | Absolute quantification of target DNA sequences with high precision and sensitivity. | Bio-Rad QX200 System [89] |
| NGS Library Prep Kits | Preparation of cfDNA for high-throughput sequencing, often with low input requirements. | ScisGo Chimerism Multi-Donor Assay [91], various commercial cfDNA-specific kits |
| Blood Collection Tubes with Preservatives | Stabilize nucleated blood cells to prevent lysis and gDNA release during sample transport. | Streck Cell-Free DNA BCT [19], PAXgene Blood ccfDNA Tubes [19] |
| Nucleic Acid QC Instruments | Assess concentration, purity, and size distribution of extracted cfDNA and final NGS libraries. | Agilent TapeStation [18], Fluorometers (Qubit) [88] |
Workflow Visualization
Workflow for cfDNA Analysis from Plasma This diagram outlines the complete pathway for correlating extraction efficiency with downstream assay success, highlighting critical checkpoints from sample collection to data interpretation.
The correlation between cfDNA extraction efficiency and the success of NGS and ddPCR assays is undeniable. To ensure reliable and interpretable results, the following practices are recommended:
- Standardize and Spike: Implement a standardized plasma processing protocol and routinely use a synthetic DNA spike-in to monitor and normalize for extraction efficiency, especially when comparing across different sample batches or extraction methods [33].
- Match the Method to the Goal: Select an extraction kit based on demonstrated high recovery rates for your target analyte (e.g., QIAamp for high plasma cfDNA yield) and ensure its size-selectivity profile is compatible with your biological question [18] [33].
- Control Pre-analytical Variables: Choose blood collection tubes based on your logistical constraints. Use preservative tubes (e.g., Streck) if plasma cannot be separated within a few hours to prevent genomic DNA contamination and ensure cfDNA integrity [19].
- Implement Rigorous QC: Apply stringent quality control at every stage—from nucleic acid quantification to post-sequencing data analysis—to identify and mitigate issues early in the workflow [90].
By systematically addressing pre-analytical variables and prioritizing extraction efficiency, researchers and clinicians can significantly enhance the sensitivity and accuracy of their cfDNA-based assays, thereby unlocking the full potential of liquid biopsy in clinical research and diagnostic development.
Conclusion
A standardized and optimized plasma processing workflow is the cornerstone of reliable cfDNA analysis. This synthesis underscores that success hinges on rigorous control of pre-analytical variables, selection of an efficient and reproducible extraction methodology—with a strong trend toward automated magnetic bead-based systems—and thorough analytical validation using appropriate reference materials. Future directions point toward the integration of artificial intelligence for data-driven diagnostics, the development of more sustainable and eco-friendly tube materials, and continued innovation in extraction chemistry to further improve sensitivity for low-abundance targets. These advancements will solidify the role of liquid biopsy in personalized medicine, enabling earlier disease detection and more dynamic therapeutic monitoring.
References
- 1. The comings and goings of cell-free DNA: Biological and ... [https://www.sciencedirect.com/science/article/pii/S2666634025003538]
- 2. Standardized Workflow and Analytical Validation of Cell ... [https://pmc.ncbi.nlm.nih.gov/articles/PMC12293894/]
- 3. Cell-Free DNA: Features and Attributes Shaping the ... - PubMed [https://pubmed.ncbi.nlm.nih.gov/40237938/]
- 4. A comparative study of four cell-free DNA assays for ... [https://pmc.ncbi.nlm.nih.gov/articles/PMC12217890/]
- 5. Cell-Free DNA, Tumor Molecular Concordance, and Clinical ... [https://pmc.ncbi.nlm.nih.gov/articles/PMC12489365/]
- 6. Extraction and purification of short DNA fragments from ... [https://www.sciencedirect.com/science/article/pii/S1383586625014819]
- 7. Analysis of cfDNA fragmentomics metrics and commercial ... [https://www.nature.com/articles/s41467-025-64153-z]
- 8. Cell-free DNA release following psychosocial and physical ... [https://www.nature.com/articles/s41398-025-03242-5]
- 9. Increased amounts of cell-free DNA released from a culture ... [https://www.frontiersin.org/journals/cell-and-developmental-biology/articles/10.3389/fcell.2025.1499936/full]
- 10. Qualitative and quantitative comparison of cell-free DNA ... [https://pmc.ncbi.nlm.nih.gov/articles/PMC7788686/]
- 11. Comparative Overview of cfDNA and ctDNA: Biology, Utility ... [https://www.cd-genomics.com/resource-cfdna-ctdna-key-differences-applications-extraction-considerations.html]
- 12. Isolation and Quantification of Plasma Cell-Free DNA ... [https://pmc.ncbi.nlm.nih.gov/articles/PMC9601152/]
- 13. Optimization of Preanalytical Variables for cfDNA ... [https://pmc.ncbi.nlm.nih.gov/articles/PMC8285169/]
- 14. 2.2. Plasma Separation, DNA Extraction, cfDNA ... [https://bio-protocol.org/exchange/minidetail?id=18157252&type=30]
- 15. cfDNA Isolation Methods and Protocols [https://www.qiagen.com/us/knowledge-and-support/knowledge-hub/bench-guide/cell-free-dna-guide/handling-cfdna/cfdna-isolation-methods-and-protocols]
- 16. A novel method for extracting circulating cell‐free DNA ... [https://pmc.ncbi.nlm.nih.gov/articles/PMC9541415/]
- 17. Exploring Cell free DNA extraction and testing | IDT [https://www.idtdna.com/page/support-and-education/decoded-plus/cfdna-extraction-here-s-what-you-need-to-know/]
- 18. Extraction of Cell-Free DNA: Evaluation of Efficiency, ... [https://www.sciencedirect.com/science/article/pii/S152515782400014X]
- 19. Evaluation of automatic cell free DNA extraction metrics ... [https://www.nature.com/articles/s41598-025-03508-4]
- 20. Interferences from blood collection tube components on ... [https://pmc.ncbi.nlm.nih.gov/articles/PMC3936985/]
- 21. Pre-Analytical Within-Laboratory Evacuated Blood ... [https://www.intechopen.com/chapters/63692]
- 22. Preanalytical Variables In Blood Tube Collection Methods [https://www.needle.tube/blog/preanalytical-variables-in-blood-tube-collection-methods]
- 23. Preanalytical Variables and Their Influence on the Quality ... [https://pmc.ncbi.nlm.nih.gov/articles/PMC6238383/]
- 24. Pre-analytical variables in coagulation testing: Why do they ... [https://myadlm.org/science-and-research/scientific-shorts/2023/pre-analytic-variables-in-coagulation-testing-why-do-they-matter]
- 25. Pre-analytical issues in the haemostasis laboratory [https://thrombosisjournal.biomedcentral.com/articles/10.1186/s12959-016-0123-z]
- 26. Preanalytical issues related to blood sample mixing [https://acutecaretesting.org/en/articles/preanalytical-issues-related-to-blood-sample-mixing]
- 27. Circulating-free DNA: A promising tool for early detection of ... [https://pmc.ncbi.nlm.nih.gov/articles/PMC12357262/]
- 28. Circulating-free DNA: A promising tool for early detection of ... [https://www.sciencedirect.com/science/article/pii/S2772487525001229]
- 29. Circulating Cell-Free DNA and RNA Analysis as Liquid ... [https://pmc.ncbi.nlm.nih.gov/articles/PMC6521186/]
- 30. Clinical Practice Guidelines for Pre-Analytical Procedures ... [https://pmc.ncbi.nlm.nih.gov/articles/PMC8548242/]
- 31. Effects of Collection and Processing Procedures on ... [https://www.sciencedirect.com/science/article/pii/S1525157817306256]
- 32. Plasma free DNA: Evaluation of temperature-associated ... [https://pmc.ncbi.nlm.nih.gov/articles/PMC6366949/]
- 33. Evaluation of variability in cell-free DNA extraction ... [https://www.nature.com/articles/s41598-025-06563-z]
- 34. Isolation of Circulating Cell-free DNA (cfDNA): A Silica ... [https://www.jove.com/t/30165/isolation-circulating-cell-free-dna-cfdna-silica-based-membrane]
- 35. Purification of Genomic DNA Using PureLink Silica Columns [https://www.thermofisher.com/us/en/home/references/protocols/nucleic-acid-purification-and-analysis/dna-extraction-protocols/purification-of-genomic-dna.html]
- 36. How to Extract cfDNA [https://www.cd-genomics.com/epigenetics/resource-cfdna-extract-materials-protocol-case.html]
- 37. 基于cfDNA的测序及数据分析的癌症相关生物标记及其在 ... [https://patents.google.com/patent/CN111254194A/zh]
- 38. 磁珠法核酸提取的原理、步骤及注意事项 [https://www.thermofisher.cn/cn/en/home/life-science/dna-rna-purification-analysis/viral-rna-dna-purification/magnetic-nucleic-acid-extraction-solution.html]
- 39. 一种基于磁珠法提取血浆样本游离dna的试剂盒及方法 [https://patents.google.com/patent/CN118480540A/zh]
- 40. 捕获血浆中cfDNA的磁珠 [https://www.nvigen.com/cfdna-extraction-from-plasma-and-serum-cn/]
- 41. 血液样本中DNA与RNA提取效率的研究 [https://xuebao.shsmu.edu.cn/article/2025/1674-8115/1674-8115-2025-45-4-476.shtml]
- 42. Tips on establishing a reliable cell free DNA (cfDNA) ... [https://www.revvity.com/blog/tips-establishing-reliable-cell-free-dna-cfdna-workflow-plasma-samples]
- 43. An Automated, Turn-Key cfDNA Extraction Workflow ... [https://omegabiotek.com/an-automated-turn-key-cfdna-extraction-workflow-showcasing-low-frequency-variant-detection/]
- 44. Circulating cell-free DNA [https://www.revvity.com/category/circulating-cell-free-dna]
- 45. Streamlined, fully automated cfDNA extraction from plasma [https://www.selectscience.net/resource/streamlined-fully-automated-cfdna-extraction-from-plasma]
- 46. Automating cfDNA Extraction for Aneuploidy Screening on ... [https://dynamicdevices.com/automating-cfdna-extraction-for-aneuploidy-screening-on-the-dynamic-devices-lynx-presenter-sarabeth-schommer-from-billion-to-one/]
- 47. Maxwell® RSC ccfDNA Plasma Kit | cfDNA Extraction Kit [https://www.promega.com/products/nucleic-acid-extraction/genomic-dna/maxwell-rsc-ccfdna-plasma-kit/]
- 48. Adapting Clinical Chemistry Plasma as a Source for Liquid ... [https://elifesciences.org/reviewed-preprints/108708]
- 49. Aqueous two-phase system (ATPS): from basic science to ... [https://pubs.rsc.org/en/content/articlehtml/2025/ra/d4ra08232j]
- 50. Aqueous two-phase system (ATPS): an overview and ... [https://biologicalproceduresonline.biomedcentral.com/articles/10.1186/s12575-016-0048-8]
- 51. Next Generation Aqueous Two‐Phase System for Gentle ... [https://pmc.ncbi.nlm.nih.gov/articles/PMC11923243/]
- 52. A novel method for liquid-phase extraction of cell-free DNA ... [https://www.nature.com/articles/s41598-021-98815-x]
- 53. Optimizing ctDNA: An Updated Review of a Promising ... [https://www.mdpi.com/2072-6694/16/17/3053]
- 54. Optimization of a Protocol for Isolating Cell-free DNA From ... [https://pmc.ncbi.nlm.nih.gov/articles/PMC10813833/]
- 55. Pre-analytical phase errors constitute the vast majority of ... [https://pubmed.ncbi.nlm.nih.gov/40311145/]
- 56. The impact of preanalytical variables on the analysis of cell ... [https://pmc.ncbi.nlm.nih.gov/articles/PMC11111958/]
- 57. PREDICT: a checklist for preventing preanalytical diagnostic errors in... [https://pubmed.ncbi.nlm.nih.gov/31758854/]
- 58. Impact of Preanalytical and Analytical Methods on Cell- ... [https://pmc.ncbi.nlm.nih.gov/articles/PMC8451956/]
- 59. How to preventing pre - analytical diagnostic errors in clinical trials [https://groenlandiatech.com/en/blog/checklist-to-prevent-pre-analyticial-diagnostic-errors-in-clinical-trials/]
- 60. Evaluation of specimen rejection rates in the preanalytical ... [https://pmc.ncbi.nlm.nih.gov/articles/PMC12210526/]
- 61. Quantitative PCR–Based Method to Assess Cell-Free DNA ... [https://www.sciencedirect.com/science/article/pii/S1525157822000745]
- 62. Evaluating the quantity, quality and size distribution of cell ... [https://www.nature.com/articles/s41598-020-69432-x]
- 63. Comparison of Circulating Cell-Free DNA Extraction ... [https://pmc.ncbi.nlm.nih.gov/articles/PMC7281769/]
- 64. An Optimized Chromatin Immunoprecipitation Protocol for ... [https://pmc.ncbi.nlm.nih.gov/articles/PMC7357673/]
- 65. Design, Development, and Clinical Validation of a Novel ... [https://pmc.ncbi.nlm.nih.gov/articles/PMC12346676/]
- 66. Quantification of Human Papillomavirus cell - free DNA ... [https://www.medrxiv.org/content/10.1101/2023.09.28.23296267v2.full]
- 67. Optimization of Sources of Circulating Cell-Free DNA ... [https://pmc.ncbi.nlm.nih.gov/articles/PMC8647427/]
- 68. Evaluation of pre-analytical factors affecting plasma DNA ... [https://www.nature.com/articles/s41598-018-25810-0]
- 69. Quantitative analysis of serum cell-free DNA as a predictive ... [https://pmc.ncbi.nlm.nih.gov/articles/PMC10324030/]
- 70. Evaluation of variability in cell-free DNA extraction efficiency from... [https://www.nature.com/articles/s41598-025-06563-z?error=cookies_not_supported&code=c553ab20-1de0-408b-803c-aa0c252f5eb2]
- 71. Cell-free DNA analysis in healthy individuals by next- ... [https://www.nature.com/articles/s41419-019-1770-3]
- 72. DNA quantification methods - INTEGRA Biosciences [https://www.integra-biosciences.com/united-states/en/blog/article/dna-quantification]
- 73. Quick-DNA/RNA™ Water Kit [https://www.zymoresearch.com/products/quick-dna-rna-water-kit?srsltid=AfmBOorlkUaUfr9nIoBQbxkcLs_pC_89s_AIfjefVljluuDHjraA46Na]
- 74. Analytical evaluation of circulating tumor DNA sequencing ... [https://www.nature.com/articles/s41598-024-54361-w]
- 75. Analytical validation of NeXT Personal ® , an ultra ... [https://www.oncotarget.com/article/28565/text/]
- 76. Assay Validation of Cell-Free DNA Shallow Whole ... [https://www.sciencedirect.com/science/article/pii/S1525157824000527]
- 77. Validating quantitative PCR assays for cfDNA detection ... [https://www.nature.com/articles/s41598-021-92826-4]
- 78. Design, Development, and Clinical Validation of a Novel ... [https://www.mdpi.com/2075-4418/15/15/1897]
- 79. Spike and Recovery and Linearity of Dilution Assessment [https://www.thermofisher.com/us/en/home/life-science/protein-biology/protein-biology-learning-center/protein-biology-resource-library/pierce-protein-methods/overview-elisa/spike-recovery-linearity-assessment.html]
- 80. Considerations and quality controls when analyzing cell ... [https://www.sciencedirect.com/science/article/pii/S2214753518300184]
- 81. Circulating tumor DNA to monitor treatment response in ... [https://www.nature.com/articles/s41698-025-00876-y]
- 82. Monitoring and Assessment of Circulating Tumor DNA in ... [https://pmc.ncbi.nlm.nih.gov/articles/PMC12550271/]
- 83. The Position of Circulating Tumor DNA in the Clinical ... [https://pmc.ncbi.nlm.nih.gov/articles/PMC9954551/]
- 84. Improvement of the sensitivity of circulating tumor DNA- ... [https://www.explorationpub.com/Journals/etat/Article/1002333]
- 85. Prospective assessment of circulating tumor DNA in ... [https://www.nature.com/articles/s41467-024-53145-0]
- 86. Evaluation of commercial kits for isolation and bisulfite ... [https://clinicalepigeneticsjournal.biomedcentral.com/articles/10.1186/s13148-023-01563-0]
- 87. Assessment of cfDNA extraction kits for nanopore ... [https://nanoporetech.com/document/requirements/cfDNA-extract-kits]
- 88. Plasma microrna quantification protocol - PMC [https://pmc.ncbi.nlm.nih.gov/articles/PMC10914336/]
- 89. Development and Validation of a High-Sensitivity Droplet ... [https://pubmed.ncbi.nlm.nih.gov/40087905/]
- 90. How-to: NGS Quality Control [https://frontlinegenomics.com/how-to-ngs-quality-control/]
- 91. A Practical Approach for Clinical Assay Validation [https://pmc.ncbi.nlm.nih.gov/articles/PMC11524324/]