Strategies for Reducing False Positives in Digital PCR: A Comprehensive Guide for Researchers
Digital PCR (dPCR) offers exceptional sensitivity for applications from oncology to infectious disease diagnostics, but its accuracy can be compromised by false positives.
Strategies for Reducing False Positives in Digital PCR: A Comprehensive Guide for Researchers
Abstract
Digital PCR (dPCR) offers exceptional sensitivity for applications from oncology to infectious disease diagnostics, but its accuracy can be compromised by false positives. This article provides a comprehensive guide for researchers and drug development professionals on identifying, troubleshooting, and preventing false positive results. Covering foundational causes like sample preparation artifacts and contamination, the article details methodological best practices for various platforms, advanced optimization techniques, and rigorous validation protocols that compare dPCR performance against other technologies. The goal is to empower scientists with the knowledge to achieve the highest data integrity in their dPCR experiments.
Understanding the Root Causes of False Positives in Digital PCR
In digital PCR (dPCR), a false positive is a partition that fluoresces, indicating the presence of a target nucleic acid sequence, when the target is actually absent. These errors distort absolute quantification, compromise detection limits for rare alleles, and can lead to incorrect scientific and clinical conclusions. In sensitive applications like liquid biopsy, rare mutation detection, and pathogen identification, mitigating false positives is paramount to ensuring data integrity. This technical support center provides targeted troubleshooting guides and FAQs to help researchers identify, troubleshoot, and prevent the causes of false positives in their dPCR experiments.
Statistical Context: The Impact of Disease Prevalence
The positive predictive value (PPV) of a test—the probability that a positive result is a true positive—is highly dependent on the prevalence of the target in the population being tested. The following table illustrates how the number of false positives can dramatically exceed true positives in low-prevalence screening scenarios, even when using a test with high specificity [1].
Table 1: Impact of Prevalence and Test Specificity on False Positives
| Scenario | Prevalence | Test Sensitivity | Test Specificity | True Positives (per 10,000) | False Positives (per 10,000) | Positive Predictive Value (PPV) |
|---|---|---|---|---|---|---|
| Diagnostic | 10% | 95% | 95% | 950 | 180 | 84.0% |
| Screening | 1% | 95% | 98% | 95 | 198 | 32.4% |
| Ultra-low Prevalence | 0.1% | 95% | 98% | 9.5 | ~200 | ~4.5% |
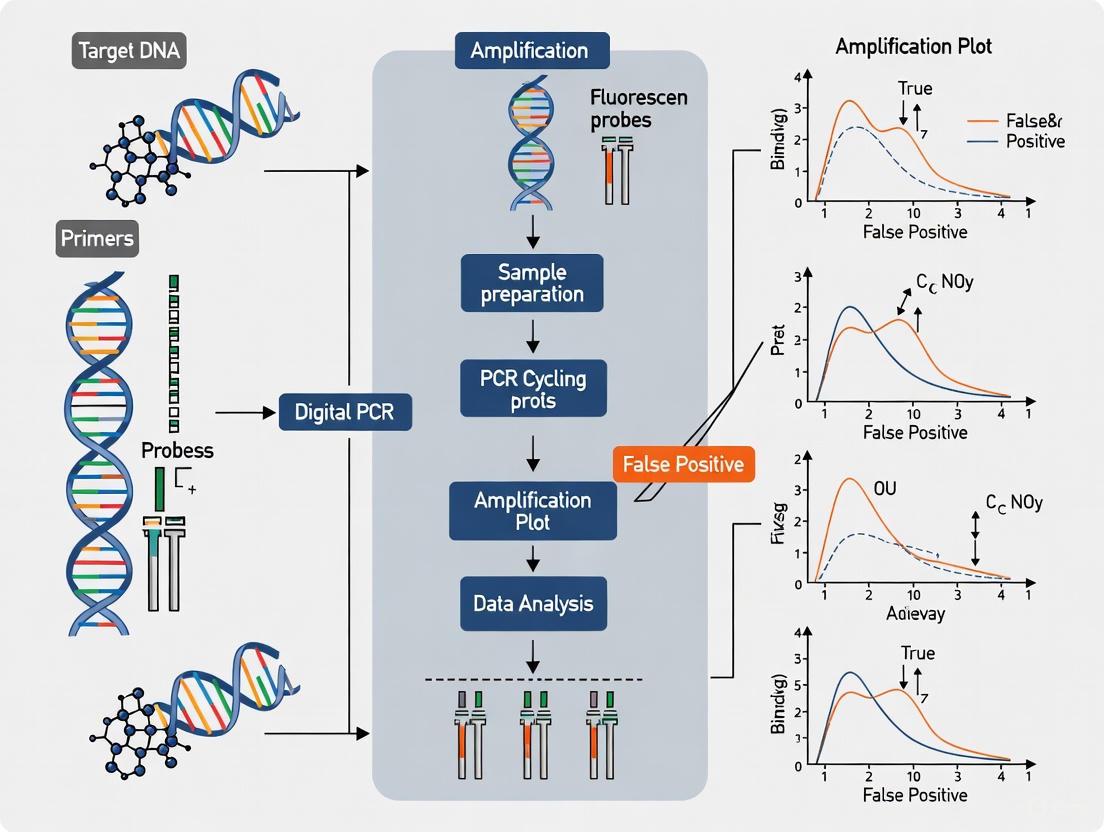
Experimental Workflow for Minimizing False Positives
The following workflow diagram outlines key procedural steps to minimize false positives at each stage of a dPCR experiment, from assay design to data analysis.
Frequently Asked Questions (FAQs) and Troubleshooting Guides
FAQ: Assay Design and Optimization
Q1: What are the best practices for assay design to minimize false positives?
A: The most common source of false positives is non-specific amplification due to suboptimal assay design [2] [3].
- In Silico Specificity Check: Always perform an in silico BLAST check of your primer and probe sequences to ensure they are specific only to your intended target and will not cross-react with related sequences in the sample [2].
- Prevent Primer-Dimers: Use oligonucleotide analysis software (e.g., IDT OligoAnalyzer, Primer3) to evaluate and minimize the probability of homo- and hetero-dimer formation between primers and probes, which can generate a fluorescent signal in the absence of the target [4].
- Validate Singleplex First: For multiplex assays, it is imperative to first run and optimize each primer/probe set in a singleplex format to verify its performance and specificity before combining them in a single reaction [4].
Q2: How can I optimize my assay in the lab to reduce non-specific amplification?
A: Wet-lab optimization is critical.
- Annealing Temperature Gradient: Use a gradient thermal cycler to determine the optimal annealing/elongation temperature that provides strong specific signal while eliminating non-specific amplification [4] [3].
- Optimize Reagent Concentrations: For multiplex assays, start with low primer concentrations (e.g., 0.25 µM) and increase gradually if needed. High concentrations can increase the chance of undesired interactions [4].
- Use Modified Bases: Incorporate locked nucleic acid (LNA) bases or a minor groove binder (MGB) into your probes. This increases the probe's melting temperature (Tm) and allows for the use of shorter, more specific probes, which is especially beneficial in multiplexing [4].
FAQ: Instrumentation and Wet-Lab Procedures
Q3: My negative control shows positive partitions. What could have caused this?
A: Contamination and partition quality are key suspects.
- Sample Contamination: This is a primary cause. Use dedicated pre- and post-PCR areas. Employ aerosol-resistant pipette tips and clean surfaces and equipment regularly [1] [5].
- Reagent Contamination: Ensure all reagents, including water, are molecular biology grade and free of nucleic acid contaminants.
- Poor Partitioning: Inconsistent partition size or poor sample emulsification can lead to random positive partitions. Ensure your dPCR platform generates monodisperse partitions and that you mix the reaction volume thoroughly before partitioning [2] [5]. Vortexing for 5-30 seconds or pipetting up and down at least 10 times is recommended [2].
- Carryover Contamination: Contamination from high-titer samples can occur on equipment. Implement proper cleaning protocols [1].
Q4: How do sample inhibitors affect my results, and how can I overcome them?
A: While dPCR is generally more tolerant of inhibitors than qPCR, strong inhibition can reduce PCR efficiency, leading to a loss of signal (false negatives) or, in some cases, anomalous data [2].
- Source High-Quality DNA/RNA: Use high-quality nucleic acid isolation kits to reduce the carryover of inhibitors like phenol, EDTA, heparin, or hematin [2] [3].
- Purify and Precipitate: Re-purify or ethanol-precipitate your sample to remove residual salts and inhibitors [3].
- Use Robust Master Mixes: Select dPCR master mixes that are specifically formulated to be resistant to a broad range of inhibitors [2].
FAQ: Data Analysis and Validation
Q5: How can I be confident in setting the threshold between positive and negative partitions?
A: High-quality dPCR data exhibits tight, consistent fluorescence amplitudes for both negative and positive populations, creating a clear valley for threshold placement [5].
- Set Threshold Above Noise: The threshold should be set above the uppermost limit of the negative population to minimize the probability of misclassifying negative partitions as positive [5].
- Investigate Poor Separation: If the separation between populations is poor, making threshold placement difficult, it indicates a problem with the assay (e.g., low specificity, inhibition) or partition quality, not the analysis step. The experiment should be re-optimized [5].
- Use Software Tools: Leverage the separability score and spillover compensation features in your dPCR analysis software (e.g., Crystal Miner) to improve population discrimination, especially in multiplex assays [4] [6].
Q6: What should I do if I get a single positive result in an otherwise negative sample, especially in a low-prevalence setting?
A: This is a classic "red flag" for a potential false positive [1].
- Retest: The first step is to re-test the original sample (if volume permits) or a new sample from the same source. A true positive should be reproducible.
- Investigate the Context: Be alert to a sudden acute rise in positive results from a specific collection site or batch of reagents, which can indicate contamination [1].
- Use an Alternate Method: Confirm the result using a different dPCR assay or an orthogonal method, such as a different nucleic acid amplification test or sequencing [1].
Research Reagent Solutions
The following table details key reagents and materials essential for minimizing false positives in dPCR experiments.
Table 2: Essential Reagents and Materials for Robust dPCR
| Item | Function & Importance | Key Considerations |
|---|---|---|
| Hot-Start DNA Polymerase | Reduces non-specific amplification and primer-dimer formation by remaining inactive until a high-temperature activation step [3]. | Essential for maintaining reaction specificity, especially during reaction setup. |
| dPCR-Specific Master Mix | Formulated for optimal performance in partitioned reactions, often with enhanced inhibitor resistance. | Use mixes specially designed for multiplexing when running multi-target assays [4]. |
| Fluorophore-Labeled Probes | Enable specific detection of the amplified target sequence within each partition. | For multiplexing, select fluorophores with minimal spectral overlap that are compatible with your instrument's channels [4] [6]. |
| High-Purity Nucleic Acid Kit | Isulates DNA/RNA with minimal carryover of PCR inhibitors (e.g., phenol, EDTA, proteins). | Critical for achieving high amplification efficiency and avoiding false negatives or anomalous positives [2] [3]. |
| Partitioning Oil/Stabilizer | Creates a stable water-in-oil emulsion to form the individual reaction partitions. | A stable emulsion is vital to prevent partition coalescence, which can lead to inaccurate counting [6]. |
This technical support center article provides troubleshooting guides and FAQs to help researchers identify and mitigate the risk of heat-induced DNA damage, a significant source of false positives in sensitive digital PCR applications.
FAQs and Troubleshooting Guides
What is heat-induced DNA damage and why is it a problem for digital PCR?
Heat-induced DNA damage refers to artifactual genetic alterations caused by exposure to high temperatures during sample preparation. This is a critical issue for digital PCR (dPCR) because the technique is highly sensitive and can amplify these artifacts, leading to false positive signals that confound results, especially in rare mutation detection [7].
The primary mechanism involves the deamination of cytosine to uracil when DNA is heated. During PCR amplification, uracil is read as thymine, resulting in a false C > T/G > A mutation in the sequenced read [8] [7]. One study quantified that C > A/G > T transversions, a signature of oxidative damage, can increase by 170-fold due to heat-induced artifacts [8].
During which specific sample preparation steps is my DNA most at risk?
Heating steps are common in many protocols. Key risk points include:
- DNA Fragmentation via Heat: Some droplet-based dPCR protocols use heat to fragment genomic DNA to ensure uniform droplet formation. One study directly linked this step to false positive mutation detection [7].
- DNA Extraction and Purification: Some methods involve heating steps, which can be a source of damage if not carefully controlled [8].
- General Laboratory Handling: Improper storage or exposure of DNA samples to elevated temperatures can lead to cumulative damage over time [9].
How can I troubleshoot suspected heat-induced false positives in my dPCR experiments?
The table below summarizes the quantitative impact of different sequencing methods on mutation frequency, illustrating how improved methods reduce false signals.
Table 1: Impact of Sequencing Method on Rare Mutation Frequency Detection
| Sequencing Method | Principle | Average Rare Mutation Frequency | Key Advantage |
|---|---|---|---|
| Conventional NGS | Sequences a single DNA strand | 7.00 × 10⁻⁴ | Standard, widely available method |
| SSCS (Tag-based Single Strand) | Creates consensus from single-stranded families | 1.30 × 10⁻⁴ | Reduces errors compared to conventional NGS |
| DCS (Duplex Sequencing) | Creates consensus from both complementary strands | 1.04 × 10⁻⁵ | Dramatically reduces errors by >67-fold vs. NGS [8] |
If you suspect heat damage, follow this diagnostic path to identify and resolve the issue.
What are the best practices to prevent heat-induced DNA damage?
- Avoid Heat Fragmentation: For droplet-based dPCR, replace heat fragmentation with enzymatic shearing (e.g., restriction enzymes) to avoid high-temperature exposure [7].
- Use a Chip-Based dPCR System: Platforms like the QuantStudio 3D Digital PCR System use a chip with fixed partition sizes and do not require DNA fragmentation, eliminating a major risk factor for heat artifacts [7].
- Optimize DNA Storage: Store DNA at -20°C in Tris-EDTA (TE) buffer to minimize base degradation like cytosine deamination over time [9].
- Implement Duplex Sequencing for Validation: For orthogonal confirmation of low-frequency variants, use Duplex Sequencing (DS). This method sequences both strands of DNA and can identify and correct artifactual mutations, providing a powerful tool to distinguish true mutations from heat-induced artifacts [8].
The Scientist's Toolkit
Table 2: Key Research Reagent Solutions
| Item | Function | Relevance to Preventing Heat-Induced Artifacts |
|---|---|---|
| Restriction Enzymes | Enzymatic DNA shearing/cleavage | Used as a substitute for heat fragmentation to prevent deamination during sample prep [7]. |
| Tris-EDTA (TE) Buffer | DNA storage buffer | Maintains stable pH and chelates metal ions, helping to preserve DNA integrity during storage at -20°C [9]. |
| QuantStudio Absolute Q MAP16 Plate Kit | Chip-based dPCR consumable | Enables dPCR without DNA fragmentation, removing a key heating step from the workflow [7] [10]. |
| Anti-γH2AX Antibody | Immunofluorescence marker | Detects DNA double-strand breaks (DSBs) via fluorescence microscopy or flow cytometry; can be used to quantify cellular DNA damage response, including from heat stress [11] [12]. |
| Nuclease-free Water | Molecular biology grade water | Ensures sterile, DNAse/RNAse-free conditions for reaction setup, preventing confounding degradation [10]. |
Experimental Protocol: Identifying Heat-Induced SSBs via Comet Assay
This protocol is adapted from research investigating heat stress as a direct DNA damaging agent [12]. The Comet Assay (Single-Cell Gel Electrophoresis) is a key method to visualize and quantify single-strand breaks (SSBs) induced by heat in eukaryotic cells.
Workflow Overview
Detailed Methodology
- Cell Culture and Heat Treatment: Grow cells (e.g., HeLa or other adherent lines) to ~80% confluence. Subject the experimental group to a hyperthermic water bath (e.g., 45°C for 2 hours). Maintain a control group at 37°C [12].
- Harvesting: Trypsinize and harvest cells. Wash with PBS and re-suspend in PBS at a density of ~1x10⁵ cells/mL.
- Slide Preparation: Mix cells with molten low-melting-point agarose (e.g., 1% in PBS) at a ratio of 1:10 (v/v). Quickly pipette the mixture onto a pre-coated comet assay slide and place a coverslip on top. Allow the agarose to solidify at 4°C for 10-15 minutes.
- Lysis: Carefully remove the coverslip and immerse the slides in a cold, freshly prepared lysis solution (e.g., containing 2.5 M NaCl, 100 mM EDTA, 10 mM Tris, 1% Triton X-100, pH 10) for at least 1 hour at 4°C in the dark.
- Denaturation and Electrophoresis: After lysis, gently place the slides in an electrophoresis tank filled with fresh alkaline electrophoresis solution (e.g., 300 mM NaOH, 1 mM EDTA, pH >13). Allow DNA to unwind for 20-40 minutes. Then, perform electrophoresis at a low voltage (e.g., 1 V/cm) for 20-30 minutes.
- Neutralization and Staining: Neutralize the slides by rinsing gently with a neutralization buffer (e.g., 0.4 M Tris, pH 7.5) three times for 5 minutes each. Stain with a fluorescent DNA-binding dye (e.g., SYBR Green, DAPI).
- Analysis: Visualize using a fluorescence microscope. For each cell, the intact DNA remains in the "head," while fragmented DNA migrates, forming a "tail." Analyze ~50-100 randomly selected cells per sample using image analysis software to determine metrics like % tail DNA or tail moment, which are directly proportional to the frequency of DNA strand breaks [11] [12].
Expected Results: Cells exposed to heat stress (45°C) will show significantly longer and brighter comet tails compared to controls, confirming the induction of SSBs. Research has shown this effect is primarily observed in S-phase cells and is linked to the inhibition of DNA topoisomerase I [12].
FAQs and Troubleshooting Guides
The most common sources can be divided into two main categories:
- Carryover Contamination: This is the most prevalent source, referring to the introduction of amplification products (amplicons) from previous PCR reactions into new setups. A single PCR can generate over 1 billion copies of the target sequence, and these can aerosolize into tiny droplets that contaminate laboratory reagents, equipment, and ventilation systems. [13]
- Cross-Contamination: This involves the transfer of target DNA or RNA between samples during handling. It can occur from plasmid clones analyzed previously or from high-titer target organisms in clinical specimens. [13]
Specific sources identified include:
- Aerosols present in the laboratory environment, particularly in areas where amplified products are handled. [14]
- Contaminated reagents, including master mixes and nuclease-free water. [14]
- Pipettes and other equipment that are not properly decontaminated or used with filter tips. [14]
- Transfer by personnel on hair, glasses, jewelry, clothing, or contaminated gloves and lab coats from post-amplification areas to pre-amplification areas. [13] [15]
Q2: How can I tell if my dPCR experiment is contaminated?
The most reliable method is to routinely include the correct controls and interpret their results:
- No-Template Control (NTC): This reaction contains all PCR components (master mix, primers, probes) but uses nuclease-free water instead of a sample template. [15]
- Interpretation: A valid NTC should show no amplification. The presence of positive partitions in the NTC indicates contamination. If the contamination is from a contaminated reagent, you may see consistent, low-level amplification across all NTC replicates. If the contamination is from random aerosols, you might see sporadic amplification with varying levels of positive partitions. [15]
- Negative Control: This can be a sample confirmed to be negative for the target you are detecting.
The table below summarizes how to interpret control results:
| Control Type | Expected Result | Indication of a Problem |
|---|---|---|
| No-Template Control (NTC) | No positive partitions | Positive partitions appear in the NTC |
| Negative Control | No positive partitions | Positive partitions appear in the negative control |
| Positive Control | Expected concentration/copy number | Failure to detect or significant deviation from expected value |
Q3: What are the best laboratory practices to physically prevent contamination?
Implementing a strict, unidirectional workflow is the cornerstone of contamination prevention. The following practices are critical:
- Physical Separation of Work Areas: Establish physically separated, dedicated rooms or spaces for different stages of the workflow. [13] [15]
- Reagent Preparation Area: A clean, dedicated space for preparing and aliquoting PCR master mixes and primers.
- Sample Preparation Area: A separate area for handling and processing samples, including nucleic acid extraction.
- Amplification Area: A dedicated space for setting up the dPCR reactions and loading partitions.
- Post-Amplification Analysis Area: A separate room for thermocycling and analyzing the dPCR results. Do not open reaction plates or chips in the pre-amplification areas. [15]
- Unidirectional Workflow: Personnel and materials should always move from the "clean" pre-amplification areas to the "dirty" post-amplification areas, and never in reverse. Lab coats, gloves, and equipment (pipettes, centrifuges) must be dedicated to each area. [13]
- Use of Filter Tips and Aerosol-Resistant Pipettes: Always use filtered pipette tips to prevent aerosol contamination of pipette shafts. [14] [16]
- Surface Decontamination: Regularly clean work surfaces, pipettes, and equipment with a 10% bleach (sodium hypochlorite) solution, followed by wiping with ethanol or water to remove the bleach residue. Bleach causes oxidative damage to DNA, rendering it unamplifiable. [13] [15] Note: Bleach is unstable, so fresh dilutions should be made weekly. [15]
- Reagent Aliquoting: Divide bulk reagents into single-use aliquots to prevent widespread contamination of entire stocks. [16]
The following diagram illustrates the recommended unidirectional workflow for a dPCR experiment to minimize contamination risk.
Q4: Are there biochemical methods to decontaminate my reactions?
Yes, the most widely used and effective biochemical method is the dUTP/Uracil-N-Glycosylase (UNG) system. [13] [14] [15]
- Principle: In this method, dTTP in the PCR master mix is partially or fully replaced with dUTP. During amplification, the resulting amplicons incorporate uracil instead of thymine, making them distinguishable from natural DNA. [13]
- Decontamination Mechanism: Before each new PCR run, the enzyme UNG is added to the reaction mix. During an incubation step at room temperature, UNG selectively cleaves the sugar-phosphate backbone at any uracil-containing contaminants carried over from previous reactions, rendering them unamplifiable. [13]
- Inactivation: At the high temperatures of the initial PCR denaturation step, the UNG enzyme is permanently inactivated, so it does not degrade the new, uracil-containing amplicons being generated in the current reaction. [13]
The following diagram details the mechanism of action for the UNG decontamination system.
Q5: For highly sensitive applications, what advanced strategies can be used?
For applications like detecting rare targets or using amplicon sequencing, advanced strategies can be combined with standard practices:
- Synthetic DNA Spike-Ins: This involves adding a non-natural, synthetic DNA sequence to the sample during preparation. [14]
- Function: The spike-in competes with any potential contamination for primers and reagents during amplification, reducing the amplification of contaminants. It also serves as an internal control to verify the success of the reaction and can be used for absolute quantification. [14]
- Post-Analysis Data Subtraction: In amplicon sequencing workflows, unique molecular identifiers (UMIs) or specific bioinformatic filters can be used to identify and remove sequencing reads that originate from known contaminant sequences (e.g., from the synthetic spike-ins or common laboratory contaminants) during data analysis. [14]
Research Reagent Solutions for Contamination Control
The following table details key reagents and materials essential for implementing an effective contamination control strategy.
| Reagent/Material | Function in Contamination Control | Key Considerations |
|---|---|---|
| UNG/dUTP System [13] [15] | Enzymatically degrades carryover contamination from previous PCRs. | Most effective for thymine-rich targets. Requires optimization of dUTP concentration. Inactivated by high temperature. |
| Synthetic DNA Spike-Ins [14] | Competes with contaminants for primers; acts as an internal positive control and quantification standard. | Must be designed with the same primer-binding region as the target but a different internal sequence. Concentration must be optimized. |
| Sodium Hypochlorite (Bleach) [13] [15] | Surface decontaminant that causes oxidative damage to nucleic acids. | Use at 10% concentration. Unstable; requires fresh dilution weekly. Must be removed with ethanol/water after use. |
| Aerosol-Resistant Filter Tips [14] [16] | Prevents aerosols from contaminating the pipette shaft, protecting reagents and samples. | Essential for all liquid handling steps. Should be used in all laboratory areas. |
| dPCR Master Mix with UNG | A ready-to-use formulation that includes the UNG enzyme and dUTP, simplifying workflow. | Check manufacturer's specifications for compatibility with your dPCR instrument and assay conditions. |
Detailed Experimental Protocol: Implementing the UNG/dUTP System
This protocol outlines the steps to integrate the UNG decontamination system into a standard droplet digital PCR (ddPCR) workflow. [13] [15]
Objective: To prevent false positives caused by carryover contamination from uracil-containing amplicons.
Materials:
- dPCR supermix containing UNG enzyme and dUTP (or separate UNG enzyme and dUTP nucleotide mix)
- Primers and probes
- Nuclease-free water
- Sample DNA/cDNA
- Pipettes and aerosol-resistant filter tips
- ddPCR droplet generator and reader
Procedure:
Reaction Mix Preparation: In a pre-PCR clean area, prepare the master mix on ice. A typical 20 µL reaction might contain:
- 10 µL of 2x UNG-containing dPCR supermix
- 1.8 µL of forward primer (10 µM)
- 1.8 µL of reverse primer (10 µM)
- 0.5 µL of probe (10 µM)
- 1.9 µL of nuclease-free water
- 4 µL of sample DNA/cDNA
- Total Volume: 20 µL
UNG Decontamination Incubation:
- After droplet generation, or immediately after assembling the reaction mix (depending on the system), incubate the reactions at 25°C for 10 minutes. [13]
- Purpose: This step allows the UNG enzyme to be active and selectively degrade any uracil-containing DNA contaminants present in the reaction mix.
UNG Inactivation and Amplification:
- Transfer the reactions to the thermocycler and run the standard PCR protocol. The initial denaturation step at 95°C for 5-10 minutes will permanently inactivate the UNG enzyme. [13]
- Purpose: Inactivation prevents the UNG from degrading the new, uracil-containing amplicons produced in the current PCR cycle.
Post-Amplification Analysis:
- Proceed with droplet reading and data analysis according to your standard ddPCR protocol.
- Note: Store amplified products at -20°C or 72°C if re-analysis is needed, as residual UNG activity upon thawing could degrade the products. [13]
Frequently Asked Questions
What is the core principle behind partitioning in digital PCR? Partitioning is the foundational step in digital PCR (dPCR) where a PCR reaction mixture is randomly divided into thousands to millions of separate compartments or partitions. Each partition acts as an individual micro-reaction. After end-point amplification, the ratio of positive (containing the target) to negative (not containing the target) partitions is counted, and the absolute concentration of the target nucleic acid is calculated using Poisson statistics. This method allows for sensitive and precise quantification without the need for a standard curve [17].
How do different partitioning methods create specific pitfalls? The two primary partitioning methods—droplet-based and chip/nanoplate-based—have distinct technical workflows that introduce specific challenges [17] [18]. Droplet-based dPCR (ddPCR) can be susceptible to false positives caused by certain sample preparation steps, such as heat-induced DNA fragmentation, which can lead to cytosine deamination and create erroneous mutation signals [7]. Chip-based systems, while avoiding the need for fragmentation, have a fixed number of partitions, which can limit dynamic range and throughput compared to some droplet systems [18].
Can the choice of restriction enzyme affect my dPCR results? Yes. The precision of copy number quantification, especially for targets that may be in tandem repeats or complex genomic regions, can be influenced by the restriction enzyme used to digest the genomic DNA. One study found that using the HaeIII enzyme instead of EcoRI significantly improved precision in a droplet-based system, reducing the coefficient of variation (CV%) to below 5% across various sample types [19].
Is dPCR more resistant to PCR inhibitors than qPCR? Yes, a key advantage of dPCR is its higher tolerance to common PCR inhibitors present in complex biological samples. Because the reaction is partitioned, inhibitors are diluted and are unlikely to be present in every partition. This means that amplification can still occur successfully in a large proportion of partitions, whereas the same inhibitor concentration could significantly reduce the efficiency of a bulk qPCR reaction [20] [21].
Which partitioning method is more suitable for a regulated QC environment? For Quality Control (QC) environments, such as cell and gene therapy manufacturing, integrated chip-based dPCR systems are often preferred. They offer a streamlined, automated "sample-in, results-out" workflow that minimizes manual handling, reduces the risk of contamination and human error, often has a faster turnaround time, frequently includes features that support regulatory compliance (e.g., 21 CFR Part 11) [18]. Droplet-based systems, while powerful for research and development, typically involve multiple instruments and manual steps, making the workflow more complex and time-consuming [18].
Troubleshooting Guides
Problem 1: False Positive Mutation Detection
Symptoms: Unexpected detection of rare mutant alleles, particularly in liquid biopsy samples or when detecting low-abundance variants against a high wild-type background.
Possible Causes and Solutions:
| Cause | Solution |
|---|---|
| Heat-induced DNA fragmentation during sample prep can cause cytosine deamination to uracil, creating false C>T (or G>A) mutations [7]. | Avoid heat fragmentation. Use restriction enzyme-based digestion for DNA shearing. Chip-based dPCR workflows that do not require DNA fragmentation are advantageous for this application [7]. |
| Poor partition integrity in droplet-based systems, leading to droplet coalescence and cross-contamination [17]. | Ensure proper use of surfactants in the oil phase to stabilize droplets during thermal cycling [17]. |
| Non-specific amplification or primer-dimer formation generating false positive signals [3]. | Optimize primer and probe design. Use hot-start DNA polymerases and consider optimizing annealing temperatures to enhance specificity [3] [22]. |
Experimental Protocol for Validation: To systematically investigate false positives, spike a known wild-type DNA sample into your dPCR workflow. Process one aliquot using your standard protocol (e.g., with heat fragmentation) and another using a gentle, enzyme-based fragmentation method. Compare the mutant allele frequencies reported by the dPCR platform. A significant reduction in reported mutants in the enzyme-digested sample indicates heat-induced artifacts [7].
Problem 2: Inaccurate Quantification and Poor Precision
Symptoms: High coefficient of variation (CV%) between replicate measurements, or copy number estimates that deviate from expected values.
Possible Causes and Solutions:
| Cause | Solution |
|---|---|
| Suboptimal choice of restriction enzyme, which can fail to properly separate tandemly repeated genes, leading to inaccessible targets and under-quantification [19]. | Screen different restriction enzymes (e.g., HaeIII vs. EcoRI) that do not cut within your amplicon. Select the enzyme that provides the lowest CV% and best agreement with expected values [19]. |
| Use of an inappropriate master mix that is not optimized for the specific dPCR platform [23]. | Use the master mix recommended by the instrument manufacturer. Validation studies show that accuracy over the entire working range can be dependent on the specific master mix used [23]. |
| Partition volume variability, particularly in droplet-based systems, where sample viscosity can affect droplet size and thus the accuracy of the Poisson calculation [7]. | For droplet-based systems, follow protocols that include DNA fragmentation (using enzymes, not heat) to ensure uniform sample viscosity and consistent droplet volume [7]. Chip-based systems have fixed partition volumes and do not require this step [7]. |
Experimental Protocol for Precision and Accuracy Assessment: To evaluate the precision and accuracy of your dPCR assay, run a dilution series of a well-characterized reference material (e.g., synthetic oligonucleotides or calibrated genomic DNA) across multiple replicates. Calculate the CV% for each dilution to assess precision. Compare the measured concentration to the expected concentration to assess accuracy (trueness). This data can be used to determine the Limit of Detection (LOD) and Limit of Quantification (LOQ) for your assay [19] [23].
Table 1: Comparative Performance of dPCR vs. qPCR Data sourced from a clinical study on periodontal pathobiont detection [20].
| Parameter | Digital PCR (dPCR) | Quantitative PCR (qPCR) |
|---|---|---|
| Linearity (R²) | > 0.99 | Not specified |
| Intra-assay Variability (Median CV%) | 4.5% | Higher than dPCR (p=0.020) |
| Sensitivity for Low Abundance Targets | Superior, detected lower bacterial loads | Inferior, resulted in false negatives at low concentrations |
| Quantification Method | Absolute, without a standard curve | Relative, requires a standard curve |
| Underestimation of A. actinomycetemcomitans Prevalence | No | 5-fold |
Table 2: Platform-Specific Comparison of dPCR Technologies Data synthesized from platform evaluations and application notes [19] [21] [18].
| Parameter | Chip/Nanoplate-based dPCR | Droplet-based dPCR (ddPCR) |
|---|---|---|
| Partitioning Mechanism | Fixed micro-wells / nanoplate | Water-in-oil emulsion droplets [18] |
| Typified By | QIAcuity (QIAGEN), Absolute Q (Thermo Fisher) | QX200/QX600 (Bio-Rad) [18] |
| Throughput & Workflow | Integrated, automated; faster run time (e.g., <90 mins) [18]. Ideal for QC. | Multiple steps and instruments; longer time (e.g., 6-8 hours) [18]. Ideal for R&D. |
| DNA Fragmentation Need | Not required, reducing risk of heat-induced false positives [7]. | Often required to ensure uniform droplet size and viscosity [7]. |
| Impact of Restriction Enzyme on Precision | Less affected [19]. | More significantly affected; choice of enzyme (e.g., HaeIII) critical for high precision [19]. |
The Scientist's Toolkit: Research Reagent Solutions
Table 3: Key Reagents for Optimizing dPCR Partitioning Chemistry
| Reagent | Function | Consideration |
|---|---|---|
| Restriction Enzymes | Digests genomic DNA to ensure access to the target sequence and, in ddPCR, to control sample viscosity for consistent partitioning [7] [19]. | Choice of enzyme (e.g., HaeIII vs. EcoRI) can drastically impact quantification precision, especially for targets in complex regions [19]. |
| Platform-Specific Master Mix | Provides optimized buffer, polymerase, and dNTPs for efficient amplification within partitions. | Critical for accuracy. Performance is highly variable between brands; use the manufacturer's recommended mix for reliable results [23]. |
| Surfactants | Stabilizes water-in-oil droplets in ddPCR to prevent coalescence during thermal cycling [17]. | Essential for maintaining partition integrity and preventing cross-contamination in droplet-based systems. |
| Hot-Start DNA Polymerase | Reduces non-specific amplification and primer-dimer formation by remaining inactive until a high-temperature activation step [3]. | Improves assay specificity and the clear separation between positive and negative partitions. |
Experimental Workflow & Pitfall Analysis
In digital PCR (dPCR), the exquisite sensitivity that allows for the detection and absolute quantification of rare targets can be compromised by non-specific signals, often referred to as "noise." This noise manifests as false-positive partitions, obscuring true signals and leading to inaccurate quantification. Two of the most prevalent sources of this noise are primer-dimer formation and off-target binding. Both phenomena result in the amplification of non-target sequences, generating fluorescent signals that can be misinterpreted as target DNA, thereby reducing the precision and reliability of your dPCR data. Understanding and mitigating these assay design flaws is critical for researchers and drug development professionals aiming to deploy robust dPCR assays, particularly in clinical and diagnostic applications where accuracy is paramount [24] [2].
Primer-Dimers
What they are: Primer-dimers are spurious amplification products formed when PCR primers hybridize to each other rather than to the target DNA template, typically via a few complementary base pairs at their 3' ends. This self-annealing creates a short, double-stranded DNA product that can be amplified efficiently over many PCR cycles.
How they contribute to noise: In probe-based dPCR assays, if the primer-dimer forms between a primer and a probe, or if the dimer's sequence is fortuitously similar to the probe-binding site, the probe may bind and be hydrolyzed, generating a fluorescent signal. When using intercalating dyes like EvaGreen, the dye binds to any double-stranded DNA, including primer-dimers, producing a fluorescent signal indistinguishable from that of a specific amplicon. These events create partitions that are falsely classified as positive, increasing the background noise and leading to overestimation of the target concentration [25] [26].
Off-Target Binding (Non-Specific Amplification)
What it is: Off-target binding occurs when primers anneal to sequences in the DNA sample that are partially complementary, but not identical, to the intended target. This can lead to the amplification of non-target genomic regions, homologous genes, or contaminating nucleic acids.
How it contributes to noise: The amplified off-target products, like primer-dimers, generate fluorescent signals in partitions. This is a significant challenge for assays designed to detect conserved sequences, such as those used in universal bacterial detection targeting the 16S rRNA gene. The pervasiveness of these sequences, even in laboratory reagents and consumables, can be a source of contamination and false positives. Furthermore, off-target amplification can appear as a separate cluster of signals or contribute to the "rain" phenomenon—partitions with intermediate fluorescence that are difficult to classify definitively as positive or negative [24] [26].
Frequently Asked Questions (FAQs)
Q1: How can I tell if my dPCR assay has a primer-dimer problem? In your dPCR results, primer-dimers often cause a distinct cluster of positive events with lower fluorescence amplitude than the specific target cluster. They can also appear as a smear or "rain" of droplets between the negative and positive populations. For assays using intercalating dyes, performing a high-resolution melt (HRM) analysis after amplification can reveal primer-dimers, as they will have a distinct melt curve profile with a lower melting temperature (Tm) compared to your specific, typically longer, amplicon [24].
Q2: My no-template control (NTC) is positive. What does this mean? A positive signal in your NTC is a clear indicator of contamination or a significant primer-dimer/problematic probe interaction. First, ensure your reagents, water, and labware are sterile and free of nucleic acid contamination. A positive NTC in assays targeting common sequences (like 16S rRNA) may indicate that the master mix, enzymes, or tubes themselves are contaminated with bacterial DNA. Degraded probes can also release free fluorophore, causing high background signal. It is crucial to aliquot all reagents and use separate, dedicated workspaces for PCR setup to mitigate this [26].
Q3: Are there specific sequence patterns in primers that promote dimer formation? Yes, primers with complementary sequences, particularly at the 3' ends, are highly prone to dimerize. Consecutive G or C nucleotides (GC clamps) at the 3' end can also promote mis-priming and dimer formation due to strong base pairing. During design, avoid primers with self-complementarity or inter-primer complementarity [3].
Q4: Why is dPCR particularly susceptible to noise from these artifacts? While qPCR is also affected, the endpoint nature of dPCR and its reliance on a simple binary (positive/negative) count for quantification makes any non-specific amplification directly impact the final copy number calculation. In qPCR, amplification efficiency is assessed over many cycles, and non-specific products often have a different amplification curve or Ct value. In dPCR, every partition containing a non-specific product is counted as a positive event, directly inflating the calculated target concentration [24] [2].
Troubleshooting Guide: Mitigating Noise
| Problem | Possible Cause | Recommended Solution |
|---|---|---|
| High background/False positives in NTC | Contaminated reagents or labware [26] | Use sterile, filtered tips; aliquot reagents; decontaminate workspaces with 10% bleach and UV light [26]. |
| Degraded probe [26] | Check probe integrity; store probes at the correct pH (e.g., pH 7.0 for Cy5-labeled probes) to prevent degradation [25]. | |
| Primer-dimer formation | Poor primer design with self-complementarity [3] | Redesign primers using in silico tools to avoid complementary 3' ends and secondary structures. |
| Low annealing temperature [3] | Optimize annealing temperature, increasing it stepwise by 1–2°C increments to enhance specificity [3]. | |
| Excess primer concentration [3] | Titrate primer concentrations (typically 0.1–1 µM); in dPCR, 0.5–0.9 µM is often optimal [25] [3]. | |
| Off-target amplification | Non-specific primer binding [3] | Perform BLAST search to ensure specificity; redesign primers if cross-reactivity is found [26]. |
| Complex sample (e.g., high background DNA) [2] | The partitioning in dPCR naturally dilutes background DNA, but ensure high sample purity and consider using hot-start DNA polymerases to improve specificity [3] [2]. | |
| "Rain" (indeterminate partitions) | Non-specific amplification or reduced PCR efficiency [24] | Improve assay specificity via redesign; optimize Mg2+ concentration; use hot-start polymerase [3]. Digital HRM analysis can help classify these partitions [24]. |
Experimental Protocols for Validation
Protocol: In Silico Assay Design and Validation
A robust dPCR assay begins with careful computational design [27].
- Sequence Selection: Identify a unique target sequence. For conserved targets, choose a hypervariable region to enhance specificity [26].
- Primer and Probe Design:
- In Silico Analysis:
- Use software to check for self-complementarity, hairpins, and inter-primer complementarity.
- Perform a BLAST search against the relevant genome database to confirm target specificity and check for cross-reactivity [26].
- For multiplex assays, check for potential interactions between all primers and probes in the reaction mix [28] [27].
Protocol: Wet-Lab Assay Optimization
Before running a full dPCR experiment, validate and optimize the assay in a stepwise manner [28] [27].
- Single-Plex Testing: Test each primer-probe set individually in a dPCR run using a control template. Expect a single, tight cluster of positive partitions. The workflow for a robust validation strategy is outlined below:
- Elongation Temperature Gradient: Determine the optimal elongation temperature that provides the best separation between positive and negative populations, especially for multiplex assays. Use the instrument's software metrics (e.g., a "separability score") to guide this optimization [28].
- Inhibition Test: Test a dilution series of your sample matrix to check for PCR inhibition, which can reduce fluorescence and cause false negatives or rain [2].
Research Reagent Solutions
The following table details key reagents and their critical functions in minimizing noise in dPCR assays.
| Reagent / Material | Function & Importance in Noise Reduction |
|---|---|
| Hot-Start DNA Polymerase | Remains inactive at room temperature, preventing non-specific priming and primer-dimer formation during reaction setup. Essential for assay specificity [3]. |
| Nuclease-Free TE Buffer (pH 8.0) | The recommended storage buffer for primers and probes. Maintains oligonucleotide stability and prevents degradation. Note: Probes with Cy5/Cy5.5 should be stored in TE buffer, pH 7.0 [25]. |
| Optimized dPCR Master Mix | Formulated for digital PCR, often with enhanced resistance to inhibitors. Specific multiplex master mixes are available to support the complex reaction environment [2] [28]. |
| Hydrolysis Probes (TaqMan) | Provide sequence-specific detection, reducing noise compared to intercalating dyes. Ensure the fluorophore and quencher pair is compatible with your instrument to avoid background signal [25]. |
| Restriction Enzymes | Used to digest long or complex DNA templates (e.g., genomic DNA, plasmids). This reduces viscosity, prevents uneven partitioning, and breaks up linked gene copies, leading to more accurate quantification [25]. |
Optimized dPCR Workflows and Platform Selection to Minimize Errors
This guide provides technical support for researchers selecting and optimizing digital PCR (dPCR) platforms, with a focus on methodologies that enhance precision and reduce false positives.
Core Technology Comparison: Chip-Based vs. Droplet-Based dPCR
The fundamental difference between chip-based (cdPCR) and droplet-based (ddPCR) digital PCR lies in their sample partitioning mechanisms. Chip-based dPCR distributes the sample across a plate containing thousands of fixed micro-wells or nanopores. Droplet-based dPCR employs a water-oil emulsion to create thousands to millions of nanoliter-sized droplets [18]. This core distinction influences multiple aspects of experimental workflow and performance.
Table 1: Key Platform Characteristics and Performance Metrics
| Parameter | Chip-Based dPCR (e.g., QIAcuity, Absolute Q) | Droplet-Based dPCR (e.g., Bio-Rad QX200/QX700) |
|---|---|---|
| Partitioning Mechanism | Fixed array or nanoplate [18] | Water-oil emulsion droplets [18] |
| Typical Workflow Time | < 90 minutes [18] | 6-8 hours (multiple steps) [18] |
| Multiplexing Capability | Available for 4-12 targets [18] | Limited, though newer models can detect up to 12 targets [18] |
| Ease of Use / Automation | Integrated automated system; "sample-in, results-out" [18] | Generally involves multiple steps and instruments [18] |
| Recommended Workflow Fit | Ideal for QC environments and routine testing [18] | Ideal for development labs [18] |
| Reported Precision (CV) with Restriction Enzyme HaeIII | 1.6% to 14.6% [19] | < 5% for all tests [19] |
Troubleshooting Common Experimental Issues
FAQ: How can I prevent false positive signals in my dPCR assay?
False positives can arise from several sources, and a systematic approach is needed to identify and eliminate them.
- Contamination Control: Contamination during sampling, nucleic acid extraction, or from PCR amplicons is a leading cause [1]. Decontaminate your workspace and labware thoroughly before starting. Use dedicated pre- and post-PCR areas, and include non-template controls (NTCs) to monitor for reagent contamination [25].
- Sample and Reagent Quality: Impurities in the sample, such as alcohols, salts, humic acids, or nucleases, can interfere with fluorescence detection and cause non-specific amplification [25]. Ensure high nucleic acid purity and use fresh, high-quality reagents.
- Assay Design and Optimization: Poorly designed primers and probes can lead to non-specific amplification or primer-dimer formation, generating false positive signals [25]. Verify the specificity of your assay design and optimize primer and probe concentrations. For probe-based assays, ensure there is no emission spectral overlap between the fluorophore and quencher [25].
- Image Analysis and Thresholding: In chip-based systems, technical issues like the need for image stitching in some older imaging systems could potentially introduce errors and false positives [29]. Modern systems with one-shot imaging mitigate this risk. Always verify that the software threshold between positive and negative partitions is set correctly [30].
FAQ: My dPCR results show low precision (high CV). What steps can I take to improve reproducibility?
Low precision often stems from issues with sample integrity, partitioning efficiency, or reaction conditions.
- Optimize Sample Integrity and Input: For long or complex DNA templates (e.g., high molecular weight genomic DNA, supercoiled plasmids), use restriction digestion prior to the dPCR assay. This reduces viscosity, prevents uneven partitioning, and physically separates linked gene copies, leading to more accurate and precise quantification [25]. A study showed that using the HaeIII restriction enzyme instead of EcoRI significantly improved precision, especially for the ddPCR system [19].
- Ensure Optimal Template Concentration: The average number of target copies per partition is critical. Ideally, it should be in the range of 0.5 to 3 to comply with Poisson statistics and avoid over-saturation, which reduces precision [25]. Calculate your input copy number carefully based on your genome size and dilution factors.
- Use Technical Replicates: Analyze samples in duplicate or triplicate to account for pipetting errors and increase the total number of measured events, which enhances the statistical power and precision of the assay [25].
- Verify Primer and Probe Integrity: Lyophilized primers and probes should be dissolved in TE buffer (not water), aliquoted, and stored at -20°C to avoid degradation and repeated freeze-thaw cycles, which can reduce reaction efficiency and consistency [25].
Essential Experimental Protocols
Protocol 1: Restriction Digestion to Improve Quantification Accuracy
This pre-treatment is crucial for accurate quantification of complex DNA samples and is a key strategy for reducing quantification errors.
- Application Scope: Use for highly viscous DNA solutions, linked or tandem gene copies, supercoiled plasmids, and large DNA molecules (>30 kb) [25].
- Procedure:
- Select Enzyme: Choose a restriction enzyme that does not cut within your target amplicon sequence [25].
- Digest: Incimate your DNA sample with the restriction enzyme and appropriate buffer according to the manufacturer's instructions.
- Enzyme Inactivation: Heat-inactivate the enzyme if required, or proceed directly to dPCR reaction setup if the restriction enzyme buffer is compatible.
- Validation: A 2025 study demonstrated that using HaeIII instead of EcoRI dramatically increased precision, reducing the coefficient of variation (CV) for ddPCR to below 5% across all tests [19].
Protocol 2: Determining Limit of Detection (LOD) and Limit of Quantification (LOQ)
Precise determination of LOD and LOQ is fundamental for validating assays, especially for detecting rare events.
- Procedure:
- Prepare Dilutions: Serially dilute your target nucleic acid to concentrations expected to be near the detection limit.
- Run dPCR Analysis: Analyze multiple replicates of each dilution level on your chosen platform.
- Calculate LOD: The LOD is the lowest concentration at which the target can be reliably detected. It is statistically determined from the dilution series where the signal is distinguishable from background noise [19]. One study calculated an LOD of approximately 0.39 copies/µL for a chip-based system and 0.17 copies/µL for a droplet-based system [19].
- Calculate LOQ: The LOQ is the lowest concentration at which the target can be reliably quantified with acceptable precision and accuracy. This is determined by finding the best model-fit for the measured vs. expected copies. The same study found an LOQ of 1.35 copies/µL for the chip-based system and 4.26 copies/µL for the droplet-based system [19].
Research Reagent Solutions
Table 2: Essential Materials for Robust dPCR Experiments
| Item | Function / Application | Key Consideration |
|---|---|---|
| Restriction Enzymes (e.g., HaeIII) | Fragments complex DNA templates to ensure even partitioning and accurate quantification [25] [19]. | Must not cut within the target amplicon sequence [25]. |
| High-Purity Nucleic Acid Kits | Isolate DNA/RNA with minimal contaminants (salts, alcohols, proteins) that inhibit polymerase activity [25]. | Purity is critical for optimal fluorescence detection and PCR efficiency [25]. |
| Hydrolysis Probes (TaqMan) | Provide sequence-specific detection, minimizing false positives from non-specific amplification compared to DNA-binding dyes [25]. | Avoid fluorophore-quencher emission overlap to reduce background noise [25]. |
| DNA-Binding Dyes (e.g., EvaGreen) | A cost-effective detection chemistry for multiple targets without needing labeled probes [25]. | Requires high PCR specificity to avoid signal from primer-dimers [25]. |
| Negative & Positive Controls | Monitor for contamination (NTC) and verify amplification efficiency under set conditions [25]. | Essential for diagnosing the source of false positives or failed runs. |
This guide provides detailed protocols and troubleshooting advice to help researchers minimize false positives in digital PCR (dPCR) by optimizing sample preparation, with a focus on avoiding heat-induced DNA damage.
▎Frequently Asked Questions (FAQs)
What is the primary risk of using heat fragmentation in dPCR sample prep?
Using high temperature to fragment genomic DNA prior to dPCR analysis can cause deamination of cytosine to uracil. These induced mutations are then detected as false positive results for some rare alleles [7]. This is a critical concern in applications like rare mutation detection in oncology research, where you are looking for a rare signal against a high background of wild-type targets [7].
When is enzymatic digestion absolutely necessary in dPCR workflows?
Enzymatic digestion with restriction enzymes is recommended in several key scenarios to ensure even distribution and accurate quantification [25]:
- High-Molecular-Weight DNA: For large DNA molecules (>30 kb), which can partition unevenly, leading to over-quantification.
- Linked or Tandem Gene Copies: If gene copies are linked, multiple copies in one partition would be counted as a single copy. Restriction digestion physically separates them.
- Supercoiled Plasmids: Digestion linearizes plasmid DNA, improving primer/probe binding efficiency and quantification accuracy.
- Highly Viscous Samples: Digestion reduces viscosity, allowing for higher DNA concentrations to be used accurately and preventing issues with partition volume in droplet-based systems [25] [7].
How does sample purity affect my dPCR results?
While dPCR is generally less prone to inhibition than qPCR, contaminants can significantly interfere with fluorescence detection and amplification efficiency [25]. Key inhibitors include:
- Proteins, salts, and EDTA can impair primer and probe annealing.
- Humic acids can quench the fluorescence of dsDNA-binding dyes.
- Urea and phenol can denature the DNA polymerase.
- Acidic polysaccharides can form dead-end complexes with the polymerase [25]. Using high-purity nucleic acid templates is essential for optimal performance.
▎Troubleshooting Guides
Problem: Unexplained False Positive Mutations in Rare Allele Detection
- Potential Cause 1: Heat-induced DNA damage. As outlined in the FAQ, heat fragmentation can cause cytosine deamination, creating false mutations [7].
- Solution: Replace heat fragmentation with enzymatic digestion. Use a restriction enzyme that does not cut within your amplicon of interest. Chip-based dPCR systems that do not require DNA fragmentation for partition uniformity can be advantageous for this application [7].
- Potential Cause 2: Contaminated reagents or workspace.
- Solution: Implement strict laboratory practices:
- Use separate, dedicated work areas for pre- and post-PCR steps.
- Decontaminate surfaces and pipettes regularly with 10% bleach and UV irradiation.
- Use sterile, filter pipette tips and aliquot all reagents to minimize freeze-thaw cycles and cross-contamination [31].
Problem: Inefficient or Failed Restriction Digestion
- Potential Cause: Suboptimal reaction conditions or inactive enzyme.
- Solution: Follow this checklist to resolve the issue [32]:
- Verify enzyme activity: Test the enzyme on a control DNA (e.g., lambda DNA) with a known banding pattern.
- Check storage conditions: Ensure the enzyme has been stored at -20°C and has not undergone multiple freeze-thaw cycles.
- Use recommended buffers: Always use the manufacturer's specified buffer and ensure the final glycerol concentration is <5%.
- Check DNA substrate: Ensure the DNA is free of contaminants like SDS, EDTA, or salts. A PCR clean-up kit can be used if needed.
- Ensure sufficient incubation: Increase incubation time if necessary; longer times can allow reactions to complete with fewer enzyme units.
Problem: Inaccurate Quantification or Low Precision
- Potential Cause 1: Incomplete dissociation of tandem gene copies or complex DNA structures. Without proper digestion, linked copies are quantified as one.
- Solution: Incorporate a restriction enzyme digestion step to physically separate the gene copies, ensuring they segregate independently into partitions [25].
- Potential Cause 2: DNA degradation or crosslinking from sample fixation. This is common with Formalin-Fixed, Paraffin-Embedded (FFPE) samples [33].
- Solution: Use a DNA extraction protocol specifically designed for FFPE samples that includes steps to reverse cross-links. Assess DNA quality using a dPCR assay that targets amplicons of different sizes [33].
▎Experimental Data and Protocols
Quantitative Impact of Restriction Enzyme Selection on Precision
A 2025 study compared the precision of two dPCR platforms and the impact of two restriction enzymes, EcoRI and HaeIII, on gene copy number quantification. The results below show that the choice of enzyme significantly affects the Coefficient of Variation (%CV), a measure of precision [19].
Table 1: Impact of Restriction Enzyme on Assay Precision (%CV) [19]
| Number of Cells | Platform A with EcoRI | Platform A with HaeIII | Platform B with EcoRI | Platform B with HaeIII |
|---|---|---|---|---|
| 10 Cells | 62.1% | 3.3% | 27.7% | 14.6% |
| 50 Cells | 10.4% | 2.5% | 2.9% | 2.0% |
| 100 Cells | 2.5% | 4.5% | 6.5% | 1.6% |
The data demonstrates that HaeIII generally provided higher and more consistent precision, especially at low target concentrations, underscoring the importance of enzyme selection during assay development [19].
Detailed Protocol: Restriction Digestion for dPCR Sample Prep
This protocol is adapted from a 2025 study that successfully used restriction digestion for the multiplex detection of periodontal pathobionts [20].
- Application: Preparing complex genomic DNA samples for dPCR to ensure unbiased partitioning.
- Reagents:
- Restriction Enzyme (e.g., PvuII)
- Compatible Restriction Buffer (10X)
- DNA Sample
- Nuclease-free Water
- Methodology:
- Prepare a 40 µL dPCR reaction mixture containing:
- 10 µL of sample DNA.
- 10 µL of 4× Probe PCR Master Mix.
- 0.4 µM of each specific primer.
- 0.2 µM of each specific probe.
- 0.025 U/µL of the restriction enzyme PvuII (or an enzyme that does not cut your amplicon).
- Nuclease-free water to volume.
- Gently mix the reaction.
- Proceed with the standard dPCR workflow: partitioning, thermocycling, and imaging [20].
- Prepare a 40 µL dPCR reaction mixture containing:
- Key Note: The restriction digestion occurs in situ within the dPCR reaction mix, simplifying the workflow.
Research Reagent Solutions
Table 2: Essential Reagents for Optimized dPCR Sample Preparation
| Item | Function in Preventing False Positives | Key Considerations |
|---|---|---|
| Restriction Enzymes | Fragments DNA without heat-induced damage; separates linked genes for accurate counting [20] [25]. | Choose an enzyme that does not cut within the amplicon. Verify compatibility with reaction buffer [25] [32]. |
| Column-Based DNA Clean-up Kits | Removes contaminants like salts, enzymes, and inhibitors that can cause false negatives or affect precision [25] [32]. | Essential after manual extraction (e.g., phenol-chloroform) or when processing challenging samples like FFPE tissue [33]. |
| High-Purity Water & Buffers | Serves as the foundation for reaction mixes, free of nucleases and contaminating DNA [31]. | Use molecular biology grade, nuclease-free water and TE buffer for dissolving oligonucleotides to ensure stability [25]. |
| dPCR-Specific Master Mix | Provides optimized conditions for partition-based amplification, often with higher tolerance to inhibitors than qPCR mixes. | Check manufacturer recommendations for compatibility with restriction enzymes and probe chemistry [20]. |
| Validated Positive & Negative Controls | Critical for monitoring assay performance and detecting contamination or reagent failure [25] [31]. | Include a non-template control (NTC) to detect contamination and a positive control to confirm enzyme activity [32]. |
Robust Assay Design for Rare Mutation Detection and Copy Number Variation
FAQs: Addressing Common Challenges in dPCR
Q1: What are the primary causes of false positives in rare mutation detection, and how can I avoid them?
False positives can arise from several sources. A key cause is the use of high temperatures to fragment genomic DNA, which can induce cytosine deamination, leading to false-positive mutation calls [7]. To avoid this, consider using a chip-based digital PCR system that does not require DNA fragmentation. Furthermore, contamination from aerosols or reagents is a common culprit. Always use sterile, filtered pipette tips, decontaminate workspaces with 10% bleach, and use separate, dedicated areas for reaction setup and post-PCR analysis [31].
Q2: How does sample integrity affect my dPCR results for copy number variation (CNV) analysis?
Sample integrity is crucial for accurate quantification. Strongly degraded DNA or RNA can cause a discrepancy between the optically measured DNA amount and the actual number of copies amplified. This is especially critical when working with formalin-fixed, paraffin-embedded (FFPE) DNA or circulating cell-free DNA (cfDNA). For such samples, it is advisable to keep amplicons as short as possible to ensure efficient amplification and achieve the desired sensitivity [25].
Q3: My dPCR results show unexpected signals or "rain." What could be the cause?
"Rain," or ambiguous partition classification, can account for a significant number of partitions in a dPCR run. This can be caused by factors that reduce PCR efficiency, such as sample impurities. Contaminants like salts, alcohols, or EDTA can impair primer and probe annealing, leading to reduced fluorescence amplitude and poor separation between positive and negative partitions [25]. Ensuring high nucleic acid purity and optimizing reaction conditions can help mitigate this issue. Incorporating high-resolution melt (HRM) analysis post-amplification can also help classify these ambiguous partitions [24].
Q4: When is restriction digestion of my DNA sample necessary before dPCR?
Restriction digestion is recommended in several specific scenarios [25]:
- High-Molecular-Weight DNA: To reduce sample viscosity and ensure uniform partitioning of large DNA molecules (>30 kb), which prevents over-quantification.
- Tandem Gene Copies: To physically separate linked gene copies so they segregate independently into partitions and are counted as multiple copies.
- Supercoiled Plasmids: To linearize plasmids, improving primer/probe binding efficiency and quantification accuracy. A critical note: the restriction enzyme must not cut within your amplicon sequence.
Q5: How can I improve the detection of allele-specific copy number alterations in complex samples like tumors?
For detecting a full spectrum of allele-specific CNAs, including copy-neutral loss of heterozygosity (LOH), methods that combine B-allele frequency (BAF) with read depth ratio (RDR) are powerful. Advanced computational tools like XClone strengthen these signals by performing sophisticated smoothing along genome coordinates and across cell neighborhoods in single-cell RNA-seq data. This allows for robust detection of different CNA types in challenging samples with complex clonal structures [34].
Troubleshooting Guides
Table 1: Troubleshooting False Positives and Low Sensitivity
| Symptom | Possible Cause | Recommended Solution |
|---|---|---|
| False positive signals in No Template Control (NTC) | Contamination in reagents, primers, or workspace [31] | Use fresh aliquots; decontaminate workspace and equipment with 10% bleach; use filter tips and dedicated PCR hoods [31]. |
| Heat-induced DNA fragmentation causing deamination [7] | Use a dPCR workflow that does not require heat fragmentation; use restriction enzymes for DNA fragmentation instead [7]. | |
| Off-target amplification or primer-dimer [25] [24] | Use hot-start DNA polymerases; optimize primer design and concentration; employ high-resolution melt (HRM) analysis to verify amplicon specificity [24]. | |
| Low sensitivity for rare mutations | Sample input amount is too low | Ensure the target is within the digital range (ideal average copy per partition is 0.5-3) [25]. Increase input material if possible. |
| Poor PCR efficiency due to inhibitors [25] | Re-purify the DNA sample to remove contaminants like salts, EDTA, or alcohols. Use DNA polymerases with high tolerance to inhibitors. | |
| Degraded template DNA (e.g., from FFPE) [25] | Use shorter amplicons; employ dedicated FFPE DNA recovery kits. |
Table 2: Troubleshooting Copy Number Variation (CNV) Analysis
| Symptom | Possible Cause | Recommended Solution |
|---|---|---|
| Inaccurate CNV quantification | Non-uniform partitioning of large DNA molecules [25] | Fragment large genomic DNA (>30 kb) using restriction digestion to ensure even distribution [25]. |
| Linked gene copies counted as a single event [25] | Use restriction digestion to physically separate tandemly repeated gene copies before partitioning [25]. | |
| High background noise in CNV profiling | Technical sparsity and allelic drop-out in single-cell data [34] | Use analysis tools that strengthen BAF and RDR signals through effective smoothing on cell neighborhood and gene coordinate graphs [34]. |
Experimental Protocols
Protocol 1: Optimized Sample Preparation for Rare Mutation dPCR
This protocol is designed to minimize false positives and ensure accurate quantification.
- Nucleic Acid Purification: Use dedicated kits suitable for your sample type (e.g., cfDNA, FFPE DNA, gDNA) to achieve high purity and remove PCR inhibitors like salts, proteins, and alcohols [25].
- DNA Fragmentation (if required): Avoid heat-based fragmentation methods. Instead, use restriction enzyme digestion to cleave DNA. Ensure the selected enzyme does not cut within your target amplicon [7] [25].
- Sample Input Calculation:
- Calculate the copy number input based on your genome size. For a single-copy gene in human gDNA (genome size ~3.3 x 10⁹ bp), 1 copy equals approximately 3.3 pg [25].
- Use the formula: Mass per copy (g) = Genome size (bp) x 1.096 x 10⁻²¹ g/bp.
- Dilute your sample to achieve an optimal concentration of 0.5 to 3 copies per partition for digital PCR [25].
- Reaction Setup:
- Prepare the dPCR master mix in a clean, dedicated hood to prevent contamination [31].
- Use higher primer (0.5–0.9 µM) and probe (0.25 µM) concentrations than in qPCR to increase fluorescence amplitude for better cluster separation [25].
- Include appropriate controls: Non-Template Control (NTC), positive control, and negative control [25] [31].
Protocol 2: A Workflow for Integrated Genetic and Epigenetic Analysis (MethylSaferSeqS)
This advanced protocol allows for simultaneous detection of mutations and methylation changes from the same DNA molecules, increasing the information yield from limited samples like cfDNA [35].
Title: MethylSaferSeqS Workflow for Combined Analysis
Detailed Steps:
- Copy Template Molecules: Perform 2-3 rounds of denaturation and copying using a single primer that is dual-biotinylated and contains a deoxyuridine (dU). This creates copied strands while preserving the original, covalently modified strands [35].
- Separate Strands: Bind the reaction to streptavidin beads. The copied strands remain bound via biotin. The original DNA strands, which retain their native methylation, are eluted via heat denaturation. The copied strands are then released from the beads by enzymatic cleavage at the dU sites [35].
- Parallel Library Construction:
- For Epigenetic Analysis (Original Strands): Treat the eluted original strands with bisulfite to convert unmethylated cytosines to uracils. Then, PCR amplify and sequence to assess methylation patterns [35].
- For Genetic Analysis (Copied Strands): PCR amplify the copied strands (which contain unmodified cytosines) and sequence to detect genetic mutations, including C-to-T transitions, without bisulfite-induced artifacts [35].
The Scientist's Toolkit: Essential Reagents & Materials
Table 3: Key Research Reagent Solutions
| Item | Function in Robust Assay Design |
|---|---|
| Chip-based dPCR System | A platform with fixed partition sizes that eliminates the need for DNA fragmentation, thereby avoiding heat-induced deamination and false positives [7]. |
| Hot-Start DNA Polymerase | Reduces non-specific amplification and primer-dimer formation by remaining inactive until a high-temperature activation step, improving assay specificity [3]. |
| Hydrolysis Probes (TaqMan) | Provide sequence-specific detection, reducing false positives from non-specific amplification compared to DNA-binding dyes. Ensure fluorophore and quencher pairs are compatible to avoid background noise [25]. |
| Restriction Enzymes | Used to fragment high-molecular-weight DNA, reduce viscosity, and separate tandem gene copies, ensuring accurate partitioning and quantification in dPCR [25]. |
| High-Resolution Melt (HRM) Analysis | A post-amplification technique used to distinguish true positive amplifications from false positives (e.g., off-target amplification) by analyzing the melt curve of the amplicon, adjudicating ambiguous "rain" [24]. |
| Dual-Biotin/dU Primers | Essential for advanced workflows like MethylSaferSeqS, enabling the physical separation of original DNA strands from copied strands for parallel genetic and epigenetic analysis [35]. |
Frequently Asked Questions (FAQs)
Q1: Why is a linear workflow with dedicated zones critical for digital PCR? A linear workflow that moves from pre-amplification to post-amplification areas is essential to prevent contamination of reagents, master mixes, and samples with amplification products (amplicons), which is a primary cause of false positive results [31]. Even a single copy of contaminating DNA can be amplified, leading to inaccurate quantification and compromised data [31].
Q2: What are the specific dedicated zones I should establish? You should establish at least three separate, dedicated areas [31]:
- Reaction Setup Zone: A clean area, preferably a PCR hood, for preparing the dPCR reaction mix. This includes pipetting master mixes, primers, probes, and nuclease-free water.
- Template Addition Zone: A separate area for adding the nucleic acid template to the prepared reaction mix.
- Post-Amplification Zone: An area, well away from the setup zones, for handling amplified PCR products, such as when retrieving the dPCR plate or chip after a run.
Q3: How does sample preparation in a dedicated zone help reduce false positives? Proper sample preparation in a clean, dedicated zone minimizes the introduction of contaminants that can cause false positives. Key parameters to control include [25]:
- Sample Purity: Contaminants like proteins, salts, and alcohols can interfere with fluorescence detection and reduce amplification efficiency, leading to ambiguous results [25].
- Sample Integrity: Using degraded DNA or RNA can lead to a discrepancy between the expected and actual number of copies detected, which may affect the sensitivity for rare mutation detection [25].
Q4: My Negative Template Control (NTC) shows amplification. What should I do? If your NTC shows amplification before approximately cycle 34-38, it indicates contamination or false positives [31]. You should:
- Replace all reagents: Discard all current aliquots of buffers, primers, probes, and master mixes [31].
- Thoroughly decontaminate: Clean all work surfaces and equipment (pipettes, racks) in the setup and template addition zones with a 10% bleach solution followed by UV irradiation [31].
- Check probe integrity: Degraded probes can cause high background signal; use fresh aliquots [31].
Troubleshooting Guide for False Positives
| Observation | Possible Cause | Recommended Solution |
|---|---|---|
| Amplification in No Template Control (NTC) | Contamination of reagents or labware with amplicons or target DNA [31] | Implement strict unidirectional workflow; use fresh reagent aliquots; decontaminate workspaces with 10% bleach and UV [31]. |
| High background or rain in scatter plots | Contamination from aerosols or degraded fluorescent probes [31] [36] | Use filter pipette tips; check probe integrity via fluorometric scan; ensure proper probe storage conditions in TE buffer, pH 7.0 for Cy5-labeled probes [25] [31]. |
| Unexpected mutation detection | Deamination of cytosine to uracil caused by high-temperature DNA fragmentation [7] | Use a chip-based dPCR system that does not require DNA fragmentation; for required fragmentation, use restriction enzyme digestion instead of heat [7]. |
| Inconsistent results between replicates | Cross-contamination during pipetting or uneven partitioning [25] [36] | Use a nanoplate-based system to minimize pipetting steps; ensure samples are thoroughly mixed before loading; run technical replicates [25] [36]. |
| False positives in bacterial 16S rRNA detection | Amplification of background DNA present in reagents or consumables [31] | Design assays targeting hypervariable regions; use blocking oligos; perform BLAST searches to check for cross-reactivity; test master mixes for bacterial DNA [31]. |
Workflow and Process Diagrams
Dedicated Laboratory Zones for dPCR Workflow
Decision Tree for Addressing False Positives
Research Reagent Solutions and Essential Materials
Table: Key Reagents for Preventing False Positives in dPCR
| Item | Function | Handling and Storage Guidelines |
|---|---|---|
| Nuclease-Free Water | Solvent for preparing reagents and master mixes, free of nucleases that could degrade oligonucleotides. | Aliquot to avoid repeated use; store at room temperature [31]. |
| Tris-EDTA (TE) Buffer | Preferred solution for resuspending and storing primers and probes; maintains stable pH. | Use pH 8.0 for most probes; for Cy5 and Cy5.5, use TE buffer, pH 7.0 to prevent degradation [25]. |
| dPCR Master Mix | Contains DNA polymerase, dNTPs, and buffers essential for amplification. | Aliquot and avoid freeze-thaw cycles; store at -20°C [31]. |
| Primers and Probes | Sequence-specific oligonucleotides for target detection. | Aliquot into single-experiment volumes; store at -20°C; avoid more than 6-9 freeze-thaw cycles [25]. |
| Restriction Enzymes | Used for DNA fragmentation as an alternative to heat, preventing deamination-induced false positives. | Select enzymes that do not cut within the amplicon sequence [7] [25]. |
| 10% Bleach Solution | Primary decontaminant for cleaning work surfaces and equipment to destroy contaminating DNA. | Prepare fresh regularly; use for decontaminating all work zones before and after use [31]. |
Utilizing Advanced Multiplexing and Probe-Based Chemistry for Specificity
Troubleshooting Guides and FAQs
Common Issues and Solutions for Reducing False Positives
| Problem Area | Specific Issue | Potential Cause | Recommended Solution | Key Reference |
|---|---|---|---|---|
| Sample Preparation | False positive mutation detection | DNA fragmentation via heat treatment causing cytosine deamination [7] | Use restriction enzymes instead of heat fragmentation; chip-based workflows not requiring fragmentation [7] | [7] |
| Uneven template distribution/over-quantification | High molecular weight DNA; tandem gene copies; supercoiled plasmids [25] | Perform restriction digestion (ensure enzyme does not cut within amplicon) [25] | [25] | |
| Assay Design & Optimization | High background/unspecific signal | Poor primer/probe specificity; degraded probes; suboptimal concentrations [25] | Redesign primers/probes; avoid repeated freeze-thaw cycles; use TE buffer (pH 7.0 for Cy5/Cy5.5); optimize concentrations [25] | [25] |
| Fluorescence cross-talk between channels | Emission spectra of quencher and fluorophore overlapping [25] | Use fluorophore/quencher combinations without overlapping emission spectra [25] | [25] | |
| Run Execution & Analysis | Poor cluster separation ("rain") | Non-optimal fluorescence threshold; PCR inhibitors; suboptimal amplification [37] | Manually adjust threshold in analysis software; ensure high template purity; optimize thermocycling conditions [30] [37] | [30] [37] |
| Inaccurate quantification | Template concentration too high (Poisson bias) [25] | Dilute sample to achieve ideal loading of 0.5-3 copies/partition (avg.) [25] | [25] |
Frequently Asked Questions (FAQs)
Q1: How do I calculate the required template concentration for my dPCR reaction to be in the "digital range"? A: The ideal average template concentration is 0.5 to 3 copies per partition. For genomic DNA, you can calculate the copy number in a given mass. For a human haploid genome (3.3x10^9 bp), the mass per copy is approximately 3.3 pg. Therefore, 10 ng of human gDNA contains about 3,000 copies of a single-copy gene. Adjust your input mass and dilution factor in the instrument software accordingly [25].
Q2: My multiplex assay shows a drop in fluorescence amplitude in double-positive partitions. What does this mean? A: A lower amplitude in one channel for double-positive partitions often indicates amplification bias, where one amplicon is preferentially amplified over the other due to differences in primer efficiency, melting temperature, or interference between primer sets. Re-optimizing primer concentrations and cycling conditions is recommended [38].
Q3: What is the best way to store hydrolysis probes for my multiplex assays to maintain performance? A: To prevent degradation and avoid false positives, dissolve lyophilized probes in a small volume of low-salt TE buffer (pH 7.0 for probes labeled with Cy5 or Cy5.5 due to their instability at higher pH). Store small aliquots at -20°C and avoid repeated freeze-thaw cycles. Fluorescently labeled probes are typically stable under these conditions for 6-9 months [25].
Q4: Can dPCR truly be more sensitive than qPCR for detecting low-abundance targets? A: Yes. Direct comparisons show that dPCR demonstrates superior sensitivity, detecting lower bacterial loads that qPCR misses, leading to a 5-fold underestimation of pathogen prevalence by qPCR in some cases. This is due to its partitioning nature, which minimizes the impact of background DNA and PCR inhibitors [20].
Experimental Protocols for Key Applications
Protocol 1: Multiplexed Detection of Periodontal Pathobionts
This protocol is adapted from a study comparing multiplex dPCR to qPCR [20].
1. Sample Collection and DNA Extraction:
- Collect subgingival plaque samples with absorbent paper points.
- Extract DNA using a dedicated kit (e.g., QIAamp DNA Mini Kit) following the manufacturer's instructions to ensure high purity and minimize inhibitors [20].
2. Multiplex dPCR Reaction Setup:
- Instrument: QIAcuity Four with 24-well 26k nanoplate [20].
- Reaction Volume: 40 µL [20].
- Reaction Mix:
- 10 µL of sample DNA.
- 10 µL of 4x Probe PCR Master Mix.
- Primers (each at 0.4 µM final concentration).
- Hydrolysis Probes (each at 0.2 µM final concentration).
- 0.025 U/µL of a restriction enzyme (e.g., Anza 52 PvuII) to address sample viscosity and complex structures [20].
- Nuclease-free water to volume.
- Thermocycling Conditions:
- Initial activation: 2 min at 95°C.
- 45 cycles of: 15 s at 95°C, 1 min at 58°C [20].
3. Data Analysis:
- Analyze plates using instrument software (e.g., QIAcuity Software Suite).
- Set thresholds manually for each channel to clearly distinguish positive and negative partitions. The concentration (copies/µL) is automatically calculated using Poisson statistics [20].
Protocol 2: High-Order Multiplexing with USE-PCR
This protocol outlines the novel Universal Signal Encoding PCR approach for highly multiplexed rare variant detection [39].
1. Primer and Probe Design (USE-PCR Principle):
- Design an Allele-Specific Primer (ASP) with a 3' end that binds the target and a 5' end containing a synthetic "color-coded tag."
- The color-coded tag consists of universal primer sites and specific binding sites for universal hydrolysis probes. This tag is responsible for generating a unique fluorescent signature [39].
- Combine the ASP with a standard Locus-Specific Primer (LSP).
- Use a pre-optimized, leveled universal probe mix. The combination of amplitude modulation and multispectral encoding allows a single probe mix to decode up to 32 targets [39].
2. Reaction Setup:
- The universal nature of USE-PCR makes it portable across dPCR platforms (e.g., Absolute Q, QIAcuity, QX600, Digital LightCycler), though the universal probe mix should be tailored to each instrument's optical properties [39].
- Combine the template DNA with the primer sets (ASP+LSP for each target) and the universal probe mix.
3. Data Analysis and Decoding:
- After amplification, the fluorescence in each partition is analyzed.
- Software algorithms decode the unique amplitude and spectral signature generated by each successful amplification event, assigning it to a specific target [39].
- This method has demonstrated a mean target identification accuracy of 97.6% ± 4.4% at low template copy numbers [39].
The Scientist's Toolkit: Research Reagent Solutions
| Item | Function in Reducing False Positives | Key Consideration |
|---|---|---|
| Restriction Enzymes | Fragments large DNA to ensure uniform partitioning; prevents over-quantification of linked copies; avoids heat-induced deamination [7] [25]. | Must not cut within the amplicon sequence of interest [25]. |
| High-Purity Nucleic Acid Kits | Removes PCR inhibitors (salts, alcohols, proteins, heparin) that can cause low fluorescence amplitude and poor cluster separation [25]. | Select kits specialized for sample type (e.g., FFPE, cfDNA). |
| Hydrolysis Probes (TaqMan) | Provides sequence-specific detection, crucial for discriminating between wild-type and variant sequences in a multiplexed rare mutation assay [38] [25]. | Avoid incompatible fluorophore/quencher pairs; store correctly in TE buffer [25]. |
| Universal Probe Systems (e.g., USE-PCR) | Decouples probe optimization from assay development, using a single, pre-optimized universal probe mix to detect many targets, reducing assay-specific artifacts [39]. | Enables high-order multiplexing (e.g., 12-plex) on suitable platforms [39] [40]. |
Signaling Pathways and Workflow Diagrams
Practical Troubleshooting and Contamination Control Strategies
In digital PCR (dPCR), the integrity of your negative controls is paramount. A No-Template Control (NTC) is a critical quality check that contains all reaction components—master mix, primers, probes, and water—except for the DNA template. Its purpose is to monitor your reagents and process for contamination. The occurrence of amplification in an NTC signals a false positive, which can compromise experimental results and lead to incorrect conclusions. This guide will help you diagnose the source of NTC contamination and provide actionable solutions to maintain the reliability of your dPCR research.
■ FAQ: Diagnosing NTC Contamination
1. What does it mean if my NTC shows amplification? Amplification in your NTC indicates contamination. The specific pattern of amplification (e.g., the consistency of Ct values across replicates or the melt curve profile) can help you identify the source of the contamination [41] [15].
2. How can I tell if my reagents are contaminated versus a random lab contaminant? The pattern of amplification in your NTC replicates is key:
- Reagent Contamination: If one or more reagents in your master mix are contaminated, you will typically see consistent amplification across all NTC replicates with similar Ct values because the same amount of contaminating DNA is present in each reaction [41].
- Random Environmental Contamination: If contamination occurs sporadically, for instance, from aerosolized DNA during plate loading, you will see amplification in only some NTC replicates, and the Ct values will vary [41].
3. My chemistry is SYBR Green. How do I check for primer-dimer? In dye-based chemistries, primer-dimer formation is a common cause of NTC amplification. It generates a higher background and can produce a Ct value, often beyond cycle 34 [26]. You can identify it by performing a melting curve analysis following the PCR run. Primer-dimers will appear as a distinct peak or broad smear at lower melting temperatures (Tm) compared to your specific amplicon peak [41] [42].
4. What is the most common source of contamination? Carryover contamination from amplified PCR products from previous experiments is a major and pervasive source. When you open a tube containing millions of copies of a past amplicon, it can easily aerosolize and contaminate new reactions and lab reagents [15].
The table below outlines the common amplification patterns observed in NTCs, their likely causes, and recommended solutions.
| Observation | Likely Cause | Recommended Solutions |
|---|---|---|
| Consistent amplification across all NTCs with similar Ct values [41] | Contaminated reagent(s) in master mix (e.g., water, primers, master mix) [41] | - Discard suspected reagents and prepare fresh aliquots [26] [42].- Use sterile, filtered tips and dedicated pre-PCR pipettes [42] [15]. |
| Amplification in only some NTC replicates with varying Ct values [41] | Random contamination during reaction setup (e.g., aerosol contamination, contaminated tubes/plates) [41] | - Implement rigorous lab practices: use separate pre- and post-PCR areas, wear dedicated lab coats and gloves, and decontaminate workspaces with 10% bleach followed by 70% ethanol [26] [15] [43].- Include NTCs in your experimental setup to monitor for contamination [44]. |
| Late amplification (Ct >34-38) with SYBR Green chemistry; low Tm peak in melt curve [41] [26] | Primer-dimer formation [41] | - Optimize primer concentrations [41].- Redesign primers to minimize self-complementarity [42].- Consider using probe-based chemistry (e.g., TaqMan) for higher specificity [25]. |
| Amplification with universal bacterial primers (e.g., 16S rRNA) [26] | Contamination from bacteria in reagents or consumables (common with Taq polymerase, non-sterile water) [26] | - Use high-quality, sterile reagents.- Choose a hypervariable region of the target gene to enhance specificity [26].- Perform a BLAST search to check primer/probe specificity [26]. |
■ Advanced Experimental Protocols for Mitigating Contamination
Protocol 1: Incorporating UNG to Prevent Carryover Contamination
Carryover contamination from previous PCR amplifications can be systematically eliminated using the Uracil-N-Glycosylase (UNG) system [41] [15].
- Reagent Preparation: Use a dNTP mix where dTTP is replaced with dUTP in your PCR amplification reactions. This results in all newly synthesized PCR products containing uracil instead of thymine [15].
- Subsequent Reaction Setup: In your next dPCR experiment, use a master mix that contains the UNG enzyme [41] [15].
- Incubation and Destruction: The UNG enzyme will be active during the reaction setup and initial incubation steps at room temperature. It will cleave any uracil-containing DNA (i.e., carryover contaminants) that may have made their way into your new reaction, rendering them non-amplifiable [15].
- Enzyme Inactivation: Once the thermocycling begins, the initial high-temperature denaturation step permanently inactivates the UNG enzyme. This protects your new, uracil-containing amplification products from being degraded [15].
Protocol 2: Thermal Profile Modification to Suppress Low-Level Contamination
For persistent, low-level contamination that is difficult to eradicate, modifying the thermal cycling profile can suppress the amplification signal from the contaminant without significantly affecting the true target amplification. This method is particularly useful in quantitative applications where extreme sensitivity is not the primary goal [45].
- Standard Protocol: Run your dPCR assay with a standard thermal cycle profile (e.g., denaturation: 20 s, annealing/extension: 20 s).
- Shortened Protocol: Run the same assay with a shortened profile where the denaturation, annealing, and extension steps are all significantly reduced (e.g., to 10 s each) [45].
- Compare Ct Shift: The shortened thermal profile will disproportionately affect the amplification of the contaminating DNA in the NTC, shifting its Ct value to a much later cycle (e.g., 7-10 cycles later) while leaving the Ct of your true positive sample largely unaffected [45].
- Application: This effectively creates a larger window between your true signal and the false positive, allowing you to confidently call positive results while disregarding the late-amplifying NTC signal [45].
■ Visual Workflow: Systematic Diagnosis of NTC Amplification
The following diagram outlines a logical pathway for diagnosing the cause of amplification in your No-Template Control.
■ The Scientist's Toolkit: Essential Research Reagent Solutions
| Item | Function | Key Considerations |
|---|---|---|
| Aerosol-Resistant Filter Tips | Prevents pipette contamination from aerosols, safeguarding reagents and samples. | Essential for all pre-PCR setup steps; use separate boxes for pre- and post-PCR work [42] [43]. |
| UNG-Containing Master Mix | Enzymatically degrades carryover contamination from previous uracil-containing PCR products. | Most effective for thymine-rich amplicons; requires the use of dUTP in previous amplifications [41] [15]. |
| Sterile, Nuclease-Free Water | Serves as the solvent for master mixes and controls; must be free of nucleic acids and nucleases. | Use autoclaved, filtered (0.45 µm) water dedicated for pre-PCR use only [42]. |
| TE Buffer (pH 8.0) | Preferred solution for resuspending and storing lyophilized primers and probes. | Enhances oligonucleotide stability and solubility compared to water. Avoids degradation, especially for probes labeled with Cy5/Cy5.5 (use pH 7.0) [25]. |
| Bleach Solution (10-15%) | A potent chemical decontaminant for destroying DNA on work surfaces and equipment. | Must be made fresh regularly. Allow to contact surfaces for 10-15 minutes before wiping with deionized water [26] [15]. |
| Positive Control Template | A known sample containing the target sequence, used to verify that the assay is functioning correctly. | Can be a plasmid, gBlock, or cDNA. Helps distinguish between contamination and assay failure [44]. |
Troubleshooting Guides
Guide 1: Troubleshooting Bleach-Based Decontamination
Problem: Suspected PCR contamination after bleach cleaning. Bleach (sodium hypochlorite) is highly effective but requires specific conditions to work reliably.
| Problem & Symptoms | Possible Causes | Recommended Solutions |
|---|---|---|
| Persistent contamination after surface cleaning [46] | • Old or degraded bleach solution• Insufficient hypochlorite concentration• Inadequate contact time | • Use freshly diluted household bleach (1-10% concentration) [13] [46]• Ensure hypochlorite concentration is 0.3-0.6% [46]• Increase contact time before wiping |
| Corrosion of laboratory equipment (e.g., metal parts) [46] | • Prolonged exposure to corrosive hypochlorite | • Clean surfaces with 70% ethanol or water after bleach decontamination to remove residues [46] |
| Inhibition of PCR from cleaned surfaces | • Bleach residue transferring to reaction tubes | • Ensure all surfaces are thoroughly dry before use• Implement a final wipe with ethanol or nuclease-free water |
Guide 2: Troubleshooting UV Irradiation Decontamination
Problem: Ineffective DNA destruction with UV light. UV irradiation induces thymidine dimers to block DNA amplification, but its efficacy is variable [13].
| Problem & Symptoms | Possible Causes | Recommended Solutions |
|---|---|---|
| Short amplicons (<300 bp) are not effectively destroyed [13] | • Short, G+C-rich templates are more resistant to UV damage | • Combine UV with other methods (e.g., UNG enzymatic cleavage) [13]• Increase exposure time |
| Reduced PCR efficiency after UV exposure of reagents | • UV damages Taq polymerase and oligonucleotide primers [13] | • Never expose reaction mixtures containing enzymes or primers to UV• Use UV only on empty equipment and surfaces |
| Inconsistent decontamination across work surface | • Uneven UV intensity across the cabinet• Shadow effects from objects | • Ensure all items are placed directly under the light source• Regularly check and replace UV bulbs |
Frequently Asked Questions (FAQs)
FAQ 1: What is the most effective concentration of bleach for destroying DNA contaminants? Freshly diluted household bleach at a concentration of 1% to 10% is highly effective. The key active component, hypochlorite, should be present at 0.3% to 0.6% to reliably remove all amplifiable DNA from laboratory surfaces [46].
FAQ 2: Why is UV irradiation sometimes insufficient for complete decontamination? The efficacy of UV light depends on several factors, including the length and base composition of the DNA. Short amplification products (less than 300 nucleotides) and those rich in guanine and cytosine (G+C) are more resistant to UV damage. Furthermore, nucleotides present in a PCR master mix can shield contaminating amplicons from UV irradiation [13].
FAQ 3: What are the best practices for physically arranging my lab to prevent contamination? Implement strict unidirectional workflow. The laboratory should have physically separated areas for:
- Reagent Preparation: Where master mixes are assembled.
- Sample Preparation: Where template DNA is added.
- Amplification: Where the thermal cycler is located.
- Product Analysis: Where amplified DNA is handled. Traffic must flow from the cleanest area (reagent prep) to the most contaminated (product analysis), with no backtracking [13].
FAQ 4: Besides bleach and UV, what is another robust method to prevent carryover contamination? The Uracil-N-Glycosylase (UNG) system is a highly effective enzymatic method. It involves substituting dUTP for dTTP in PCR mixes. Any contaminating amplicons from previous reactions (which contain uracil) can be selectively degraded by adding UNG to the new PCR mix before amplification. The UNG is then inactivated during the first high-temperature step, allowing the new reaction to proceed [13].
FAQ 5: How do I know if my negative control result is a true false positive? Amplification in a No Template Control (NTC) before approximately cycle 34 (for dye-based assays) or cycle 38 (for probe-based assays) is a strong indicator of contamination. Late amplification (after cycle 34-38) may instead be due to primer-dimer formation [31].
Experimental Protocols for Decontamination
Protocol 1: Validating Surface Decontamination with Bleach
This protocol is adapted from a study testing cleaning efficiency in forensic laboratories [46].
Methodology:
- Contaminate Surface: Pipette 10 µL of a DNA solution (e.g., 0.5 ng/µL) onto a clean, hard surface marked with a 2 cm² square.
- Dry: Allow the droplet to air-dry for 45 minutes.
- Clean: Soak an absorbent wipe with your chosen cleaning reagent (e.g., 1-10% fresh bleach). Rub the marked surface thoroughly.
- Sample Residual DNA: After the surface dries (approx. 30 min), use a sterile cotton swab moistened with 20 µL molecular grade water to swab the entire square.
- Extract and Quantify: Extract DNA from the swab using a commercial kit (e.g., QIAamp DNA Blood Mini Kit). Quantify the recovered DNA using a sensitive method like real-time PCR.
Expected Outcome: Surfaces cleaned with freshly made 1% bleach or Virkon should show no detectable amplifiable DNA, while those cleaned with ethanol or isopropanol may still have recoverable DNA [46].
Protocol 2: Implementing a UNG Decontamination System in dPCR
This pre-amplification method destroys contaminating amplicons from previous reactions [13].
Procedure:
- Reaction Setup: Incorporate the enzyme Uracil-N-Glycosylase (UNG) and use dUTP instead of dTTP in the dPCR master mix.
- Incubation: After assembling the reaction mix and adding your sample template, incubate the entire mixture at room temperature for 10 minutes. During this step, UNG will hydrolyze any contaminating uracil-containing DNA.
- Enzyme Inactivation: Place the reaction plate or cartridge in the thermocycler and initiate the protocol with a prolonged 95°C step. This heat treatment inactivates the UNG enzyme.
- Amplification: Proceed with the standard dPCR thermal cycling profile. The new amplification products will be generated with dUTP incorporated, making them susceptible to UNG degradation in future runs.
Workflow Visualization
Integrated Decontamination Workflow for dPCR
Research Reagent Solutions
| Reagent/Chemical | Function in Decontamination | Key Considerations |
|---|---|---|
| Sodium Hypochlorite (Bleach) [13] [46] | Oxidizes and fragments nucleic acids, rendering them unamplifiable. | Must be freshly diluted; corrosive to metals; inactivate with ethanol/water after use. |
| Uracil-N-Glycosylase (UNG) [13] | Enzymatically cleaves uracil-containing DNA from previous amplifications. | Requires use of dUTP instead of dTTP in PCR mixes; inactive at high temperatures. |
| Virkon [46] | Oxidizing agent effective at removing amplifiable DNA from surfaces. | Less corrosive than bleach; can generate halogen gasses if mixed with halide compounds. |
| Ethanol / Isopropanol [46] | Common disinfectants. | Ineffective at removing DNA from surfaces; should not be relied upon for nucleic acid decontamination. |
FAQs and Troubleshooting Guides
FAQ: Core Practices for Contamination Control
Q1: Why is aliquoting reagents considered a fundamental practice in dPCR? Aliquoting involves dividing reagents into single-use volumes to safeguard your stock solutions. This minimizes the number of freeze-thaw cycles, which can degrade oligonucleotide quality, and crucially, prevents the contamination of an entire reagent stock. If contamination occurs, you can simply discard the single-used aliquot and continue your work with a fresh, uncontaminated one [26] [16] [47].
Q2: How do filter tips prevent false positives compared to standard pipette tips? Filter tips contain a barrier that prevents aerosols from entering the shaft of the pipette. During pipetting, aerosols from samples or amplicons can be created and, if drawn into the pipette, can contaminate subsequent reactions. Filter tips act as a physical block against this, making them essential for handling master mixes and templates. Positive displacement pipettes, which have no air interface, are also effective for this purpose [26] [16] [47].
Q3: Is it really necessary to have pipettes dedicated solely to pre-PCR setup? Yes, this is a critical control measure. Post-PCR samples and amplified products are a potent source of contamination. Having dedicated pipettes that never leave the clean pre-PCR area virtually eliminates the risk of introducing amplicons into your reaction setup. These pipettes should be used exclusively with filter tips in a designated clean room or hood [16] [47].
Troubleshooting Guide: Addressing Common Problems
Problem: Consistent false-positive signals in my No Template Control (NTC).
- Potential Cause 1: Contaminated reagent stocks.
- Solution: Discard all existing reagents and buffers. Prepare fresh aliquots from new stocks for your experiment. Always include an NTC to monitor for this issue [26] [16] [47].
- Potential Cause 2: Carryover contamination from amplified PCR products or cross-contamination between samples.
- Solution: Implement a strict unidirectional workflow. physically separate your pre-and post-amplification workspaces. Decontaminate your pipettes and work surfaces with a 10% bleach solution, which degrades DNA, or use a commercial nucleic acid degrading solution [26] [16] [48].
Problem: High background or unexpected amplification in samples.
- Potential Cause 1: Aerosol contamination during pipetting.
- Solution: Immediately switch to using filter tips for all liquid handling steps. Ensure you are using dedicated pipettes for master mix preparation [26] [16].
- Potential Cause 2: Degraded probe.
- Solution: Check probe integrity using methods like a fluorometric scan or mass spectrometry. Signal from a degraded free dye can cause high background. Prepare new aliquots of probes and avoid repeated freeze-thaw cycles [26].
Experimental Protocols for Contamination Control
Protocol 1: Decontaminating Pipettes and Work Surfaces
Objective: To effectively remove contaminating DNA from laboratory equipment to prevent false positives.
Materials:
- Commercial nucleic acid degrading solution (e.g., DNAZap) OR freshly prepared 10% bleach solution [26] [48]
- Nuclease-free water
- Clean cloths or wipes
Method:
- For Pipettes: Wipe down the external surfaces of the pipette with the chosen decontamination solution. For internal decontamination, aspirate and dispense the solution through a clean tip several times, followed by several cycles with nuclease-free water. Allow to air dry [26] [47].
- For Work Surfaces: Apply the decontamination solution to the bench surface and let it sit for several minutes to ensure complete DNA degradation. Wipe clean. Decontaminate your workspace before and after each experiment [16].
- UV Irradiation: For additional decontamination, expose equipment like pipettes, racks, and tubes to UV light in a crosslinker or PCR hood [26] [47].
Protocol 2: Establishing a Unidirectional Workflow for dPCR Setup
Objective: To create a physical separation of PCR activities to prevent amplicon carryover.
Method:
- Designate Separate Areas: Establish three distinct physical areas in your lab:
- Reagent Preparation Area (Clean Area): A dedicated hood or clean room for preparing master mixes and aliquoting reagents. This area must be template-free [16] [47].
- Sample Preparation Area: A separate area for extracting and handling template DNA.
- Amplification and Analysis Area: An area located away from the first two, for running the dPCR instrument and analyzing amplified products [26] [16].
- Linear Workflow: Always move from the cleanest area (reagent prep) to the dirtiest (post-amplification). Never return to the clean area after handling amplified products without proper decontamination [16] [47].
- Dedicated Equipment: Equip each area with its own set of lab coats, gloves, pipettes, tip boxes, and consumables. Clearly label all equipment for its designated zone [16].
The following workflow diagram illustrates this process:
Research Reagent Solutions for dPCR
The following table details essential materials and their functions in managing reagents and equipment to mitigate false positives.
| Item | Function in Contamination Control | Key Considerations |
|---|---|---|
| Filter Tips | Creates a barrier against aerosol contamination of pipette shafts. | Use for all pre-PCR liquid handling. Essential for master mixes and primers [26] [16]. |
| Positive Displacement Pipettes | Alternative to filter tips; eliminates air interface to prevent aerosol transfer. | Ideal for handling viscous or volatile samples [47]. |
| Dedicated Pipettes | Physically separates pre-and post-PCR workflows to prevent amplicon carryover. | Assign unique, color-coded pipettes to clean vs. post-PCR areas [16]. |
| Nuclease-Free Water | Ensures a sterile, DNA/RNA-free solvent for preparing reagents. | Used for resuspending primers and making master mixes [26]. |
| Low-Salt TE Buffer | Stable medium for resuspending and storing oligonucleotides. | Preferred over water for higher stability of primers and probes. Avoid for Cy5/Cy5.5 probes, use TE pH 7.0 instead [25]. |
| Bleach Solution (5-10%) | Effective chemical decontaminant that degrades DNA on surfaces. | Use to regularly clean pipettes, benches, and equipment. Requires fresh preparation [26] [16]. |
| Commercial DNA Degrading Solution | Formulated to rapidly and completely degrade nucleic acids on contact. | Useful for decontaminating tubes, instruments, and sensitive equipment [48]. |
| Single-Use Aliquot Tubes | Prevents multiple freeze-thaw cycles and cross-contamination of stock reagents. | Create aliquots for single experiments for enzymes, primers, probes, and master mix components [26] [47]. |
## Frequently Asked Questions
What are the most common causes of false positives in digital PCR analysis? False positives can arise from several sources, including sample contamination during preparation, nonspecific amplification (like primer-dimers), and issues with probe chemistry. A common but often overlooked cause is DNA fragmentation by heat, which can cause cytosine deamination, leading to sequence errors detected as false mutations [7]. Contamination from reagents, labware, or aerosols can also lead to amplification in no-template controls (NTCs) [31].
How can I optimally set thresholds to distinguish positive from negative partitions? Optimal threshold setting depends on clear separation between the clusters of negative and positive partitions. While instrument software often provides automatic thresholding, manual adjustment may be needed. For singleplex experiments, a threshold is set in one fluorescence dimension. For multiplex experiments, it is better to use clustering methods that consider all fluorescence channels simultaneously, as dimension-by-dimension thresholding can be unreliable [49]. The goal is to minimize misclassification of partitions that fall in the "rain" (a phenomenon where partitions do not cluster tightly).
What is 'rain' and how can I address it in my data? "Rain" refers to partitions that do not fall neatly into clear positive or negative clusters, appearing as a scatter of points between the main clusters. It can account for up to 10% of partitions in hydrolysis probe dPCR and 3% in intercalating dye dPCR [24]. Rain can be caused by suboptimal amplification efficiency, fluorescent probe issues, or imperfect partition generation. Using digital high-resolution melt (dHRM) analysis can help reclassify these ambiguous partitions by verifying the specificity of the amplified product [24].
When should I use a clustering algorithm instead of manual gating? Manual gating is susceptible to user bias and becomes impractical for high-throughput analysis or when cluster separation is poor. Automated clustering methods are recommended for duplex or higher-plex experiments, for large datasets, and to ensure objectivity and reproducibility [49]. They are essential when the fluorescence signal does not produce well-resolved, distinct clusters.
## Troubleshooting Guide: Resolving Classification Ambiguity
A systematic approach to troubleshooting can significantly improve data quality and reliability. The workflow below outlines a logical path for addressing common partition classification issues.
### Step 1: Control-Based Diagnosis
Begin by analyzing your experimental controls to diagnose the root cause.
- Negative Template Control (NTC) Analysis: Amplification in the NTC before cycle 34 (for SYBR Green dye) or cycle 38 (for probe-based assays) indicates contamination or false positives [31].
- Action: Decontaminate your workspace and labware with 10% bleach and UV irradiation. Replace all reagents and use fresh aliquots of primers and probes. Ensure you are using sterile, filter tips and dedicated pipettes for PCR setup [31].
- Positive Control Analysis: A weak or absent signal in the positive control indicates general reaction inhibition or failure.
- Action: Check for PCR inhibitors in your sample and ensure reagent integrity.
### Step 2: Assay Condition Optimization
If controls appear normal but sample data shows poor cluster separation, optimize your assay conditions.
- Primer and Probe Concentration: In dPCR, higher primer and probe concentrations can increase fluorescence amplitude, improving cluster separation. Optimal results are often achieved with a final primer concentration of 0.5–0.9 µM and a probe concentration of 0.25 µM per reaction [25].
- Chemistry Selection: Hydrolysis probes (TaqMan) offer high specificity but require careful design to avoid background from dye-quencher interactions. DNA-binding dyes (like EvaGreen) are flexible but require high PCR specificity to prevent signal from nonspecific products and primer-dimers [25].
- Template Quality: For complex templates (e.g., high-molecular-weight DNA, plasmids), perform restriction digestion to reduce viscosity and ensure even partitioning, which leads to more accurate quantification [25].
### Step 3: Advanced Classification Techniques
When basic optimizations are insufficient, employ advanced data analysis methods.
Clustering Algorithms: For multiplex assays, use automated clustering algorithms instead of manual thresholding. The table below summarizes methods evaluated in a 2024 benchmarking study [49].
Digital High-Resolution Melt (dHRM): This technique can be integrated post-amplification to check the specificity of the product in each partition. dHRM can reclassify ambiguous "rain" partitions and distinguish true positives from false positives, changing the calculated DNA concentration by up to 52% in some cases [24].
### Comparison of Partition Clustering Methods
| Method | Category | Key Feature | Best For |
|---|---|---|---|
| k-means [49] | Partitioning | Requires pre-specifying number of clusters (k) | Datasets with well-defined, spherical clusters |
| DBSCAN [49] | Density-based | Does not require k; finds clusters of arbitrary shape | Identifying clusters and ignoring noise/rain |
| flowClust [49] | Model-based | Uses t-mixture models, robust to outliers | Data with non-normal cluster shapes |
| flowPeaks [49] | Density & Model | Uses k-means then merges clusters; no need for k | Automatic clustering without specifying k |
| dpcp [49] | Density & Partitioning | Two-step: DBSCAN then c-means | Clean samples where all clusters are present |
## Experimental Protocol: Implementing dHRM for False Positive/Negative Mitigation
This protocol is adapted from a study demonstrating how digital High-Resolution Melt (dHRM) analysis improves quantification accuracy [24].
### Objective
To reduce false positives and false negatives in digital PCR assays by integrating an internal control and using melt curve analysis to verify amplicon identity.
### Materials and Reagents
### Research Reagent Solutions
| Reagent/Material | Function in the Protocol |
|---|---|
| PrimeTime Gene Expression Master Mix (IDT) [24] | Provides optimized buffer, dNTPs, and polymerase for probe-based qPCR/dPCR. |
| EvaGreen dye (Biotium) [24] | Intercalating dye for dsDNA used for dHRM analysis. |
| Hydrolysis Probe (e.g., Cy5-labeled) [24] | Sequence-specific probe for target detection during amplification. |
| ROX Dye (Bio-Rad) [24] | Passive reference dye for normalization in some instruments. |
| QuantStudio 3D Digital PCR 20K Chip [24] | Microfluidic chip for partitioning samples into nanoscale reactions. |
### Procedure
Reaction Mix Preparation: Prepare a 15 µl reaction mixture containing:
- 1x PrimeTime Gene Expression Master Mix
- 0.5 µM of each forward and reverse primer
- 0.25 µM hydrolysis probe (if using)
- 2.5x EvaGreen dye
- 2x ROX dye
- 3 µl of template DNA
- Ultrapure water to volume [24].
Partitioning and Amplification:
- Load the PCR mixture onto a digital PCR chip according to the manufacturer's instructions (e.g., using a QuantStudio 3D Digital PCR Loader).
- Seal the chip and perform PCR amplification using standard thermal cycling conditions for your target [24].
Endpoint Fluorescence Reading: After amplification, place the chip in the reader and perform an endpoint fluorescence read in the channels corresponding to your probe and dye to initially classify partitions as positive or negative.
Digital HRM Analysis:
- Following the endpoint read, run a high-resolution melt protocol on the instrument.
- Slowly heat the chip from a low temperature (e.g., 60°C) to a high temperature (e.g., 95°C) while continuously monitoring the fluorescence of the intercalating dye.
- The resulting melt curves for each partition provide a sequence-specific signature [24].
Data Reclassification:
- Partitions initially classified as positive based on the endpoint read are now checked against the expected melt curve for the specific target.
- Partitions with off-target melt curves are reclassified as negative, reducing false positives.
- The melt curve of an exogenous internal control can also be used to identify and exclude false-negative partitions that failed to amplify due to inhibition [24].
## Key Quantitative Reference Table
For accurate quantification in dPCR, the target concentration must be within an optimal range to ensure efficient partitioning and avoid saturation effects [25].
### dPCR Sample Input Guidelines
| Parameter | Optimal Range | Notes |
|---|---|---|
| Copy Number per Partition (Lambda, λ) | 0.5 to 3 | This is the average number of target copies per partition. A λ of 1 is often ideal for rare event detection [25]. |
| Maximum Copies per Reaction | Up to 217,000 (for 26k nanoplates) | The upper limit depends on the specific dPCR technology and the number of partitions available [25]. |
| Gene Copies in 10 ng gDNA | Homo sapiens: ~3,000 [25]E. coli: ~2,000,000 [25] |
In digital PCR (dPCR) research, the exquisite sensitivity that enables rare allele detection also makes experiments vulnerable to false positives from reagent-derived contamination. Even minute quantities of contaminating DNA present in master mixes and oligonucleotides can be amplified, compromising data integrity. This is particularly problematic when targeting highly conserved or multicopy genes, such as bacterial 16S rRNA, where contaminating sequences may be present in the enzymes and reagents themselves [50] [31]. This guide provides actionable strategies to identify, test for, and eliminate these contamination sources, which is a critical component of a robust framework for reducing false positives in digital PCR research.
FAQs on Reagent Contamination
Q1: How can I determine if my master mix or oligonucleotides are contaminated? The primary method is through rigorous use of controls. No Template Controls (NTCs) are essential; these wells contain all reaction components—including the master mix and oligonucleotides being tested—except for the sample DNA template [15]. Amplification in an NTC indicates contamination. If the contamination is from a reagent like the master mix, you will typically see consistent amplification across all NTC wells at similar threshold cycle (Ct) or fluorescence intensity values [15]. If the contamination is sporadic (e.g., from aerosols), you will see amplification in only some NTC wells with varying signals [15].
Q2: Why are experiments targeting the 16S rRNA gene particularly susceptible to reagent contamination? The 16S rRNA gene is present in multiple copies in the genomes of virtually all eubacteria, making it a highly sensitive target [50]. This same characteristic makes it a common contaminant. Bacterial genomic DNA, including ribosomal DNA sequences, can be co-purified during the production of enzymes like Taq DNA polymerase, which is often expressed in E. coli [50] [31]. The high conservation of this gene means that "universal" primers may amplify these reagent-derived contaminants alongside your target sequence.
Q3: What are the first steps I should take if I confirm reagent contamination?
- Discard Contaminated Reagents: Immediately dispose of all master mixes, primers, probes, and water batches suspected of contamination [16] [31].
- Thoroughly Decontaminate: Clean your PCR work area and all equipment (pipettes, centrifuges, vortexers) with a fresh 10% bleach solution, followed by deionized water or ethanol to prevent corrosion [15] [13].
- Use New Aliquots: Open new, guaranteed low-DNA or DNA-free reagent stocks, and aliquot them upon first use to prevent future bulk contamination [15] [16] [31].
Q4: Can enzymatic treatments clean up contaminated reagents? While enzymatic treatments can be applied to reaction mixes, they often come with a significant trade-off in sensitivity and are not equally effective against all contaminants.
- Uracil-N-Glycosylase (UNG): This is the most common and effective method for preventing carryover contamination from previous PCR reactions. It requires incorporating dUTP in place of dTTP in your amplification reactions. UNG then enzymatically degrades any uracil-containing amplicons from prior runs before the new thermal cycling begins [15] [13]. However, UNG is ineffective against natural, thymine-containing DNA contaminants present in reagents [13].
- DNase Treatment: Treating the master mix (without the DNA template and primers) with DNase can degrade double-stranded DNA contaminants. However, this requires a subsequent heat-inactivation step which can be challenging to perform without affecting other reagent components [50].
- UV Irradiation: Exposing the master mix (without primers, probes, or dNTPs) to UV light can induce thymidine dimers in contaminating DNA, rendering it unamplifiable. It should be noted that this method is less effective for short amplicons and can also damage enzymes and oligonucleotides if not carefully controlled [50] [13].
Table 1: Methods for Decontaminating PCR Reagents
| Method | Mechanism | Effectiveness | Key Limitations |
|---|---|---|---|
| UNG (Uracil-N-Glycosylase) | Degrades uracil-containing DNA from prior amplifications [15] [13]. | High for carryover amplicons. | Ineffective against natural DNA; requires use of dUTP in all reactions [13]. |
| DNase Treatment | Enzymatically degrades double-stranded DNA [50]. | Moderate (1-2 log reduction) [50]. | Requires precise heat-inactivation; risk of incomplete inactivation or enzyme damage. |
| UV Irradiation | Creates thymidine dimers, blocking polymerase [50] [13]. | Low to Moderate (4-log reduction in sensitivity) [50]. | Ineffective on short amplicons; can damage Taq polymerase and primers [50] [13]. |
| 8-MOP/Psoralen & UV | Intercalates and crosslinks DNA upon UV exposure [50]. | High (5-7 log reduction) [50]. | Complex workflow; requires optimization; can reduce overall sensitivity. |
Experimental Protocols for Testing Reagents
Protocol 1: Systematic Screening of Reagent Batches
This protocol is designed to pinpoint the exact source of contamination within your dPCR setup.
1. Principle: By preparing NTCs that sequentially omit different reagent components, you can isolate which specific reagent is introducing contaminating DNA.
2. Reagents and Materials:
- Suspect master mix
- Suspect forward and reverse primers, and probes
- Nuclease-free water (from a guaranteed DNA-free source)
- dPCR instrument and consumables (chips or cartridges)
- Filtered pipette tips
3. Procedure:
- Step 1: In a pre-PCR, clean area, prepare the following four reactions in duplicate. Use meticulous aseptic technique.
- Step 2: Load the reactions onto your dPCR chip or cartridge according to the manufacturer's instructions.
- Step 3: Run the dPCR protocol with your standard thermocycling conditions.
- Step 4: Analyze the results. A significant number of positive partitions in a specific reaction tube identifies the contaminated component.
Table 2: Reagent Screening Test Setup
| Reaction Tube | Master Mix | Primers/Probe | Nuclease-free Water | Expected Result (No Contamination) |
|---|---|---|---|---|
| Complete NTC | Yes | Yes | Yes | No positive partitions |
| Master Mix Only | Yes | No | Yes | No positive partitions |
| Primers/Probe Only | No | Yes | Yes | No positive partitions |
| Water Only | No | No | Yes | No positive partitions |
1. Principle: Different sources and production methods for Taq DNA polymerase result in varying levels of bacterial DNA contamination [50]. This protocol tests multiple enzymes under identical conditions.
2. Procedure:
- Step 1: Select several Taq polymerase options, including ones marketed as "low-DNA" or "ultrapure" [50].
- Step 2: Prepare separate master mixes for each polymerase to be tested, using the same lot of uncontaminated primers, probe, and water.
- Step 3: Set up NTCs for each master mix and run them on the dPCR system.
- Step 4: The polymerase that yields the lowest (or zero) count of positive partitions in the NTC is the cleanest option for your application.
Prevention Strategies: A Proactive Workflow
Preventing contamination is vastly more efficient than eliminating it. The following diagram illustrates a integrated workflow that combines physical, chemical, and enzymatic strategies to safeguard your dPCR experiments.
The Scientist's Toolkit: Key Reagent Solutions
Table 3: Essential Reagents and Materials for Contamination Control
| Item | Function & Importance in Contamination Control |
|---|---|
| Low-DNA/DNase-free Taq Polymerase | Recombinant enzymes specifically purified to remove residual bacterial genomic DNA are critical for 16S rRNA and other universal bacterial targets [50]. |
| Uracil-N-Glycosylase (UNG) | An essential enzyme for degrading PCR carryover contamination from previous experiments when used with a dUTP-containing master mix [15] [13]. |
| Molecular Biology Grade Water | Guaranteed to be nuclease-free and free of contaminating DNA. This should be used for making all reagent stocks and dilutions [50]. |
| Aerosol-Resistant Filter Tips | Prevent aerosols from cross-contaminating reagent stocks and samples during pipetting [15] [16]. |
| dUTP Mix | Used in place of dTTP to generate amplicons that are susceptible to degradation by UNG in subsequent reactions, breaking the cycle of carryover contamination [13]. |
| Bleach (Sodium Hypochlorite) | A potent oxidizing agent that chemically destroys DNA on work surfaces and equipment. Fresh 10% solutions are recommended for decontamination [15] [13]. |
Vigilance against reagent-derived contamination is non-negotiable for generating robust and reliable dPCR data, especially in sensitive applications like rare mutation detection or microbial identification. By implementing the systematic testing protocols, adopting proactive prevention workflows, and selecting appropriate decontamination strategies outlined in this guide, researchers can significantly reduce false positives and uphold the highest standards of data integrity in their research.
Validating dPCR Assays and Comparative Performance Analysis
Frequently Asked Questions (FAQs)
FAQ 1: What are the key validation parameters I need to establish for a new digital PCR (dPCR) assay? The three core validation parameters are Specificity, Sensitivity, and Dynamic Range. Establishing these ensures your assay is accurate, can detect low-level targets, and provides reliable quantification across expected target concentrations. Robust validation is fundamental for reducing false positives and generating reliable data [51] [23].
FAQ 2: How can I improve the sensitivity of my dPCR assay, especially for low-abundance targets? Sensitivity is maximized by increasing the number of partitions and the amount of DNA input. For droplet-based systems, using a dual-input approach (e.g., 20 ng and 500 ng reactions) with combined analysis can push the limit of detection to levels as low as 0.001% (1x10⁻⁵). Ensuring high DNA purity and optimizing primer-probe concentrations are also critical [52] [25].
FAQ 3: My assay is showing a high rate of false positives. What are the common causes? Common causes of false positives include:
- Contamination: From reagents, samples, or the lab environment.
- Non-specific amplification: Due to poorly designed primers/probes or suboptimal thermal cycling conditions.
- Sample preparation artifacts: Using high temperatures to fragment genomic DNA can cause cytosine deamination, leading to false mutation calls. Using restriction enzymes instead is recommended.
- Partition misclassification: During fluorescence analysis, which can be mitigated by optimizing probe chemistry and signal thresholds [25] [7] [53].
FAQ 4: What is the difference between Limit of Blank (LoB), Limit of Detection (LoD), and Limit of Quantification (LoQ)? These parameters define different aspects of your assay's sensitivity:
- Limit of Blank (LoB): The highest apparent concentration found in replicates of a blank sample containing no template. It is determined by testing multiple blank replicates.
- Limit of Detection (LoD): The lowest target concentration that can be detected with 95% confidence. It is typically established using probit regression analysis on low-concentration dilution series.
- Limit of Quantification (LoQ): The lowest target concentration that can be reliably quantified with acceptable precision, often defined as a coefficient of variation (CV) below 25% [51].
FAQ 5: How does the choice of restriction enzyme impact my dPCR results? The choice of restriction enzyme can significantly affect precision and accuracy, particularly for targets in tandem repeats or high-molecular-weight DNA. Enzymes like HaeIII have been shown to yield higher precision (lower CV%) compared to others like EcoRI in some systems. The enzyme must not cut within your amplicon sequence [25] [19].
Troubleshooting Guides
Issue 1: Low Sensitivity or High Limit of Detection
Problem: Your assay cannot detect targets at the desired low concentration.
| Possible Cause | Solution |
|---|---|
| Insufficient DNA input | Increase the amount of DNA template per reaction. For ultra-sensitive detection, use a high-input protocol (e.g., 500 ng) if your platform allows. [52] |
| Suboptimal partitioning | Ensure your droplet generator or chip is functioning correctly to maximize the number of partitions. A higher number of partitions improves sensitivity. [52] |
| PCR inhibition | Check DNA purity. Re-purify the sample if contaminants like salts, alcohols, or heparin are suspected. dPCR is relatively tolerant, but high levels of inhibitors still have an effect. [25] [51] |
| Poor amplification efficiency | Re-optimize primer and probe concentrations. In dPCR, higher primer (0.5–0.9 µM) and probe (0.25 µM) concentrations are often used to increase fluorescence amplitude. [25] |
Issue 2: Poor Precision and High Variation Between Replicates
Problem: Your quantitative results are inconsistent across technical replicates.
| Possible Cause | Solution |
|---|---|
| Pipetting errors | Use calibrated pipettes and master mixes to minimize volumetric errors. Analyze samples in at least duplicate or triplicate. [25] [53] |
| Uneven partition size | (For droplet systems) Ensure consistent droplet generation. Use appropriate surfactants in the oil to stabilize droplets during thermal cycling. [53] [23] |
| Incorrect target concentration | The average number of target copies per partition (λ) should ideally be between 0.5 and 3 to ensure optimal Poisson distribution and precise quantification. Dilute or concentrate your sample accordingly. [25] |
| DNA structure issues | For complex, high-molecular-weight, or linked DNA templates (e.g., tandem repeats), use restriction enzyme digestion to ensure random and even distribution of targets across partitions. [25] [19] |
Issue 3: Non-Specific Amplification or False Positives
Problem: You observe positive signals in negative controls or unexpected clusters in the amplitude plot.
| Possible Cause | Solution |
|---|---|
| Contamination | Decontaminate workspaces and equipment. Use dedicated pre- and post-PCR areas. Include non-template controls (NTCs) in every run. [25] |
| Primer-dimer formation | Re-design primers to avoid self- and inter-complementarity. Use hydrolysis probes (TaqMan) instead of DNA-binding dyes (EvaGreen) to enhance specificity. [25] |
| Heat-induced DNA damage | Avoid using high-temperature fragmentation. For applications requiring DNA fragmentation, use restriction enzymes instead to prevent cytosine deamination, a known source of false mutations. [7] |
| Probe degradation | Re-constitute lyophilized probes in TE buffer (pH 7.0 for Cy5-labeled probes) instead of water, aliquot, and avoid repeated freeze-thaw cycles. Store at -20°C. [25] |
Experimental Protocols for Core Validation Parameters
Protocol 1: Determining Limit of Detection (LoD) and Limit of Quantification (LoQ)
This protocol outlines the steps to establish the sensitivity of your dPCR assay [51].
- Prepare Dilution Series: Create a serial dilution of the target DNA, spanning from a concentration expected to be well above the LoD to one well below.
- Run Replicates: For each dilution level, run a sufficient number of technical replicates (e.g., 20 measurements across five dilutions).
- Establish LoB: Perform 60 measurements on three blank samples (no template DNA) at different times. The LoB is defined as the highest apparent concentration observed in these blanks.
- Calculate LoD: Using the data from the low-concentration dilution series, perform probit regression analysis to determine the concentration at which the target is detected with 95% confidence.
- Calculate LoQ: Determine the lowest concentration that can be quantified with acceptable precision, typically defined as a coefficient of variation (CV) of less than 25%.
Protocol 2: Assessing Dynamic Range
This protocol verifies the range over your assay provides accurate and linear quantification [51] [19].
- Sample Preparation: Prepare a standard curve using a reference material (e.g., synthetic oligonucleotides or calibrated plasmids) across a wide concentration range, ideally 4-6 orders of magnitude.
- dPCR Run: Analyze all samples in multiple replicates.
- Data Analysis: Plot the measured concentration against the expected concentration and perform linear regression analysis. A robust assay will show a strong linear correlation (e.g., R² > 0.98-0.99) across the intended dynamic range.
Data Presentation: Quantitative Performance of dPCR Platforms
Table 1: Comparison of Sensitivity Metrics from Published dPCR Assays
| Application / Target | Platform | Limit of Detection (LoD) | Limit of Quantification (LoQ) | Key Findings | Citation |
|---|---|---|---|---|---|
| CAR T-cell construct monitoring | Bio-Rad QX200 ddPCR | 0.001% (1x10⁻⁵) | N/S | Used a dual-input (20ng & 500ng) strategy to achieve ultra-high sensitivity for rare target detection. | [52] |
| Phytophthora nicotianae pathogen | Bio-Rad QX200 ddPCR | 95% CI via probit regression | CV < 25% | Demonstrated superior sensitivity and inhibitor tolerance compared to qPCR in complex soil samples. | [51] |
| Synthetic oligonucleotides | QIAGEN QIAcuity One ndPCR | 0.39 copies/µL input | 54 copies/reaction | Showed high precision (CV 7-11%) for concentrations above the LOQ. | [19] |
| Synthetic oligonucleotides | Bio-Rad QX200 ddPCR | 0.17 copies/µL input | 85.2 copies/reaction | Achieved high precision (CV 6-13%) for concentrations above the LOQ. | [19] |
Table 2: Impact of Experimental Factors on dPCR Precision (Based on [19])
| Experimental Factor | Impact on Precision (CV%) | Recommendation |
|---|---|---|
| Restriction Enzyme (EcoRI) | Higher CVs, up to 62.1% for ddPCR with complex DNA | Avoid; can lead to inconsistent digestion and uneven target distribution. |
| Restriction Enzyme (HaeIII) | Lower CVs, below 5% for ddPCR with complex DNA | Recommended; improves precision for quantifying targets in complex genomic DNA. |
| DNA Input (Within Dynamic Range) | Minimal impact when λ is between 0.5-3 | Optimize template concentration to fall within the ideal range for Poisson statistics. |
| Platform (ddPCR vs ndPCR) | Varies by application; ndPCR showed less variability with different enzymes in one study | Cross-validate on your preferred platform with your specific sample type. |
The Scientist's Toolkit: Essential Research Reagent Solutions
Table 3: Key Reagents for dPCR Assay Development and Validation
| Reagent / Material | Function | Critical Considerations |
|---|---|---|
| High-Purity DNA Template | The target for absolute quantification. | Purity is critical. Contaminants like salts, alcohols, or EDTA can inhibit polymerase activity and quench fluorescence. [25] |
| Restriction Enzymes (e.g., HaeIII) | Fragments genomic DNA to ensure random partitioning. | Essential for high-molecular-weight DNA, tandem repeats, or supercoiled plasmids. Must not cut within the amplicon. [25] [19] |
| dPCR Supermix | Provides optimized buffer, nucleotides, and polymerase for amplification. | The choice of master mix is a critical factor for accuracy. Validate different mixes for your specific application. [23] |
| Sequence-Specific Hydrolysis Probes (TaqMan) | Provides target-specific fluorescence detection. | Reduces false positives from primer-dimers vs. intercalating dyes. Store in TE buffer, pH 7.0 for Cy5 dyes, to prevent degradation. [25] [51] |
| Validated Primers/Probes | Defines the specificity of the amplification. | Design follows qPCR principles but uses higher concentrations (0.5-0.9 µM primers, 0.25 µM probe) for stronger signals. [25] |
Workflow and Relationship Diagrams
Copy number variations (CNVs) are genomic alterations where the number of copies of a specific DNA sequence differs from a reference standard, often arising from insertions, deletions, or structural rearrangements [54]. These variations are crucial biomarkers linked to disease susceptibility, resistance, and progression, particularly in oncology and neurological disorders [54]. Accurate CNV detection presents a significant measurement challenge in molecular diagnostics, especially when analyzing complex samples like cell-free DNA (cfDNA) where tumor-derived material is diluted in a background of normal DNA [55]. This technical support center provides detailed guidance on selecting and optimizing the appropriate PCR methodology to reduce false positives and enhance data reliability in CNV research.
Technical Comparison: dPCR versus qPCR for CNV Analysis
Fundamental Technology Differences
Quantitative PCR (qPCR) operates as a bulk reaction that monitors PCR amplification in real-time during the exponential phase. It relies on standard curves or reference samples for relative quantification, measuring the cycle threshold (Ct) at which fluorescence surpasses background levels [56] [57]. This method is inherently comparative, requiring known standards to quantify unknown samples.
Digital PCR (dPCR) takes a fundamentally different approach by partitioning a single PCR reaction into thousands of nanoreactions. After endpoint amplification, it directly counts the positive and negative partitions, applying Poisson statistics for absolute quantification without requiring standard curves [56] [58]. This partitioning provides dPCR with enhanced tolerance to PCR inhibitors and reduced susceptibility to amplification efficiency variations [58] [21].
Performance Metrics for CNV Detection
The table below summarizes the critical performance characteristics of each technology specifically for CNV analysis:
Table 1: Key Performance Metrics for CNV Analysis
| Parameter | Digital PCR (dPCR) | Quantitative PCR (qPCR) |
|---|---|---|
| Quantification Method | Absolute, without standards [58] | Relative, requires standard curves or reference genes [56] [57] |
| Precision for Small Fold Changes | Can detect differences as low as 10% (1.1-fold) [54] [21]; reported detection of 1.25-fold differences [55] | Typically detects ≥1.5-fold changes [55] |
| Sensitivity for Rare Variants | Mutation detection rate ≥0.1% [58] | Mutation detection rate >1% [58] |
| Dynamic Range | ~4 orders of magnitude [21] | 6-8 orders of magnitude [21] |
| Effect of PCR Inhibitors | More tolerant due to partitioning [56] [58] [21] | More susceptible; inhibitors affect reaction efficiency and apparent copy numbers [21] |
| Throughput | 16-96 reaction formats [21] | 384-well formats possible [21] |
| Template Concentration Considerations | Precision directly dependent on template concentration and partition count; requires optimal loading (0.5-3 copies/partition) [25] | Broad dynamic range accommodates varying concentrations [21] |
Decision Framework for Platform Selection
The following workflow diagram illustrates the decision-making process for selecting the appropriate PCR platform based on research requirements:
Platform Selection Guidance: Choose dPCR when your research requires absolute quantification without standards, detection of small fold changes (<1.5-fold), analysis of samples with potential PCR inhibitors, or work with limited/precious samples [54] [58] [21]. Opt for qPCR when your priority is high-throughput screening of large sample numbers, you have a broad dynamic range requirement, or budget constraints are a primary consideration [21].
Troubleshooting Guide: Optimizing dPCR for CNV Analysis
Pre-Analytical Sample Preparation
Problem: Inaccurate CNV quantification due to suboptimal sample quality or preparation
Issue: Sample Purity Contamination - Contaminants including alcohols, salts, humic acids, nucleases, urea, phenol, or acidic polysaccharides can impair amplification efficiency and fluorescence detection [25].
- Solution: Use high-purity nucleic acid extraction kits specifically validated for dPCR. Assess sample quality via spectrophotometry and avoid common contaminants during extraction [25].
Issue: Incomplete Restriction Digestion - Large DNA templates (>20 kb), tandemly linked gene copies, or supercoiled plasmids can partition unevenly, leading to over-quantification [25].
- Solution: Implement restriction enzyme digestion for 10 minutes at room temperature using enzymes that do not cut within the target amplicon. Use final enzyme concentrations up to 0.25U/µL directly in dPCR reactions. Exception: FFPE samples typically don't require digestion due to inherent fragmentation [25] [59].
Issue: Suboptimal Template Input - Loading too much or too little template DNA reduces quantification accuracy and precision [25].
- Solution: Calculate appropriate input using genome size formulas. For human gDNA (3.3 pg/diploid genome), 10 ng contains approximately 3000 gene copies. Maintain template concentration between 0.5-3 copies per partition for optimal Poisson statistics [25]. For 8.5K nanoplates, use 60-250 ng per reaction; for 26K nanoplates, use 75-300 ng per reaction [59].
Assay Design and Optimization
Problem: Poor cluster separation or unexpected amplification patterns
Issue: Ineffective Primer/Probe Design - Poorly designed assays yield non-specific amplification, primer dimers, or weak fluorescence signals, complicating data interpretation [25].
- Solution: Follow rigorous qPCR design principles: target-specific matching, optimal GC content, appropriate melting temperature, and absence of secondary structures. For dPCR, use higher primer (0.5-0.9 µM) and probe (0.25 µM) concentrations than typical qPCR to enhance fluorescence amplitude and improve cluster separation [25].
Issue: Inappropriate Detection Chemistry Selection - Choosing suboptimal fluorescent reporter/quencher combinations creates background noise that obscures true positive signals [25].
- Solution: Select probe chemistry with non-overlapping emission spectra between fluorophore and quencher. For DNA-binding dyes like EvaGreen, ensure high PCR specificity to prevent non-specific product detection. Store fluorescently labeled probes in TE buffer (pH 8.0, except Cy5/Cy5.5 probes which require pH 7.0) at -20°C in aliquots to minimize freeze-thaw degradation [25].
Issue: Insufficient Reference Assays - Using only a single reference gene for normalization increases variability in copy number estimation [59].
- Solution: Implement two or more reference assays with known copy numbers to improve normalization accuracy. Select reference targets with expected copy numbers similar to your target genes when prior information is available [59].
Frequently Asked Questions: CNV Analysis by dPCR
Q1: How does dPCR achieve superior precision for small fold-change detection in CNV analysis compared to qPCR?
dPCR's precision stems from its partitioning approach and binary endpoint detection. By dividing the reaction into thousands of compartments and counting each as positive or negative for the target, dPCR uses binomial statistics for absolute quantification [56] [58]. This eliminates variability associated with amplification efficiency differences and standard curve construction in qPCR, enabling detection of smaller CNV differences (as low as 1.1-1.25 fold) that would be indistinguishable by qPCR [54] [55]. This is particularly valuable when analyzing cfDNA where tumor-associated CNVs are highly diluted [55].
Q2: What are the key considerations for designing a robust dPCR CNV experiment?
Three critical factors require attention:
- Template Concentration: Ensure optimal loading (0.5-3 copies/partition) following Poisson distribution principles [25].
- Reference Assays: Utilize multiple reference targets (ideally ≥2) with known copy numbers for accurate normalization [59].
- Partition Number: Select appropriate nanoplate formats based on required resolution; 8.5K partitions suffice for most applications, while 26K plates accommodate lower DNA concentrations with higher input volumes [59].
Q3: When should restriction digestion be incorporated into dPCR CNV workflow?
Restriction digestion is recommended for:
- Large DNA molecules (>20 kb) to ensure even partitioning
- Linked or tandem gene copies to prevent multiple copies segregating into single partitions
- Supercoiled plasmids to improve primer/probe accessibility
- Highly viscous solutions that impede accurate partitioning [25] Exception: FFPE samples typically don't require digestion due to inherent fragmentation [59].
Q4: Can dPCR completely replace NGS for CNV analysis?
dPCR excels at quantitatively assessing known CNVs with high precision and sensitivity, potentially replacing NGS for validated targets in clinical settings [59]. However, NGS remains essential for discovery applications identifying novel CNVs across the entire genome. The technologies are complementary: NGS for discovery and dPCR for high-precision validation and routine detection of known variants [59].
Q5: What strategies minimize false positives in dPCR CNV analysis?
Key approaches include:
- Implementing rigorous negative controls (NTCs) to monitor contamination
- Using optimized probe chemistry with minimal background fluorescence
- Applying proper threshold settings based on control samples
- Ensuring high template purity to prevent spurious amplification
- Including replicate reactions to identify technical artifacts [25] [30]
Essential Research Reagent Solutions
The following table outlines critical reagents and materials required for robust dPCR-based CNV analysis:
Table 2: Essential Research Reagents for dPCR CNV Analysis
| Reagent/Material | Function | Optimization Guidelines |
|---|---|---|
| Restriction Enzymes | Fragments large DNA templates for even partitioning; separates tandem gene copies [25] | Select enzymes that don't cut within amplicon; use at 0.25U/µL final concentration; 10 min RT digestion [25] [59] |
| Hydrolysis Probes (TaqMan) | Sequence-specific detection with fluorophore-quencher system [25] | Use at 0.25 µM final concentration; avoid reporter-quencher spectral overlap; store in TE buffer at -20°C [25] |
| dPCR Master Mix | Specialized formulation for partitioning and amplification [59] | Use manufacturer-recommended mixes containing essential reference dyes; not interchangeable with standard qPCR mixes [59] |
| Reference Assays | Normalization controls for copy number determination [59] | Implement ≥2 reference targets with known copy numbers; select targets with expected copy numbers similar to test genes [59] |
| Positive/Negate Controls | Monitor assay performance and contamination [25] | Include non-template controls (NTCs), positive template controls, and calibration controls in each run [25] |
The selection between dPCR and qPCR for CNV analysis fundamentally depends on the specific research objectives and analytical requirements. While qPCR remains a robust, high-throughput option for detecting larger CNV changes, dPCR provides unequivocal advantages for applications demanding absolute quantification, superior precision for small fold changes, and analysis of complex samples. By implementing the optimized protocols, troubleshooting guidelines, and reagent solutions outlined in this technical support center, researchers can significantly reduce false positives and enhance the reliability of their CNV data, ultimately supporting more accurate molecular diagnostics and therapeutic development.
Technical Support Center
Troubleshooting Guides and FAQs
This technical support center is designed to assist researchers in optimizing digital PCR (dPCR) experiments for pathogen detection in blood, with a specific focus on methodologies that reduce false positives and ensure result reliability.
Frequently Asked Questions
Q1: Our dPCR results show positive signals, but blood cultures are negative. Are these false positives? Not necessarily. dPCR has demonstrated significantly higher sensitivity than blood culture. A 2025 retrospective study of 149 patients with suspected bloodstream infections found that dPCR identified 42 positive specimens, while blood culture identified only 6. This resulted in the detection of 63 pathogenic strains via dPCR compared to 6 strains via culture [60] [61]. Potential reasons for this discrepancy include:
- Prior Antibiotic Use: Antimicrobial therapy can sterilize the culture but not remove pathogen DNA, which dPCR can still detect [62].
- Detection of Non-Viable Organisms: dPCR detects nucleic acids from both live and dead organisms, whereas culture requires viable, growing pathogens [62].
- Higher Analytical Sensitivity: dPCR is capable of detecting pathogens present at very low concentrations, down to 25.5 copies/mL in the cited study, which is below the limit of detection for blood culture [60].
- Polymicrobial Infections: The same study showed dPCR's capacity to identify 14 cases of polymicrobial infections that were missed by culture [60].
Q2: What are the primary causes of false positives in dPCR, and how can we prevent them? False positives in dPCR primarily arise from contamination or assay-related issues. The following table outlines common causes and mitigation strategies [25].
| Cause of False Positive | Troubleshooting and Prevention Strategy |
|---|---|
| Contamination | Decontaminate workspaces and labware. Use dedicated pre- and post-PCR areas. Include non-template controls (NTCs) in every run to monitor for reagent contamination [25]. |
| Nonspecific Amplification | Use hydrolysis probes (TaqMan) instead of DNA-binding dyes for higher specificity. Ensure careful primer and probe design to avoid cross-reactivity and self-annealing [25] [63]. |
| Probe Degradation | Fluorescently labeled probes are stable for 6-9 months at -20°C. Avoid repeated freeze-thaw cycles. Reconstitute lyophilized probes in TE buffer, not water, for better stability [25]. |
| Inappropriate Fluorescence Threshold | Ensure correct threshold setting during data analysis to distinguish true positive partitions from background noise. Use positive controls to establish expected signal amplitude [25] [37]. |
Q3: How can we optimize sample preparation to ensure accurate dPCR quantification? Sample purity and integrity are critical for optimal PCR efficiency and accurate quantification [25].
- Sample Purity: Impurities like proteins, salts, heparin, and hemoglobin can inhibit polymerase activity. Use high-quality nucleic acid purification kits to remove these contaminants [25] [62].
- Sample Integrity: For complex DNA structures, use restriction digestion to achieve uniform template distribution. This is recommended for:
- Highly viscous solutions.
- Linked or tandem gene copies (to prevent counting multiple copies as one).
- Supercoiled plasmids (linearizes them for better probe binding).
- Large DNA molecules over 30 kb (reduces uneven partitioning) [25].
- Sample Input: The optimal number of target copies per reaction should be between 0.5 and 3, with an upper limit of 5 copies per partition on average to avoid saturation [25].
Q4: What are the key differences in turnaround time between dPCR and blood culture? dPCR offers a dramatically faster time-to-result. The same 2025 study reported that the average detection time for dPCR was 4.8 ± 1.3 hours, compared to 94.7 ± 23.5 hours (approximately 4 days) for blood culture [60]. This >90% reduction in turnaround time can significantly accelerate the initiation of targeted anti-infective therapy.
Experimental Protocols and Data Presentation
Methodology: Comparative Analysis of dPCR and Blood Culture
The following protocol is based on a study comparing dPCR and blood culture for pathogen detection [60] [61].
1. Sample Collection
- Collect venous blood from patients with suspected infection (e.g., presenting with fever ≥38.0°C, elevated CRP/PCT).
- Collect two sets of blood culture samples (aerobic and anaerobic) using sterile procedure, with 10 mL of blood per set.
- For dPCR, collect blood into an EDTA tube and immediately centrifuge at 1,600 × g for 10 min to separate plasma [60] [61].
2. Blood Culture Protocol
- Incubate blood culture bottles in an automated system (e.g., BacT/ALERT 3D) at 37°C.
- Perform Gram staining and subculture on Columbia blood agar plates for any positive samples.
- Identify pathogens using an automated system (e.g., Vitek 2 Compact) [60] [61].
3. dPCR Protocol
- DNA Extraction: Extract plasma DNA using a commercial nucleic acid purification kit and an automated extraction system.
- dPCR Reaction Setup:
- Use a commercial dPCR system (e.g., Pilot Gene droplet digital PCR system).
- Add 15 µL of extracted DNA to a master mix containing fluorescent probes and primers.
- Partition the reaction mixture into thousands of nanoliter-sized droplets.
- PCR Amplification: Run the PCR according to the manufacturer's cycling instructions.
- Data Analysis: After amplification, analyze each droplet. Count the positive droplets and use Poisson statistics to calculate the absolute concentration of the target pathogen in copies/mL [60] [61] [63].
Summary of Comparative Performance Data
The table below quantifies the performance differences observed in a clinical study [60] [61].
Table 1: Comparative performance of dPCR vs. blood culture in 149 patients
| Parameter | Digital PCR (dPCR) | Blood Culture (BC) |
|---|---|---|
| Positive Specimens | 42 | 6 |
| Total Pathogen Strains Detected | 63 | 6 |
| Detection Time (Average) | 4.8 ± 1.3 hours | 94.7 ± 23.5 hours |
| Pathogen Concentration Range | 25.5 to 439,900 copies/mL | N/A (qualitative growth) |
| Key Advantage | Higher sensitivity, faster result, quantification | Gold standard, provides viable isolate for AST |
Table 2: Pathogens identified by dPCR in the study (a subset of 63 strains) [60]
| Pathogen Type | Species (Examples) | Notes |
|---|---|---|
| Bacteria | Acinetobacter baumannii (11), Streptococcus spp. (10), Klebsiella pneumoniae, Pseudomonas aeruginosa, Staphylococcus aureus | dPCR detected a wider range of bacteria. |
| Fungi | Not specified in excerpt | Included two fungal species. |
| Viruses | Cytomegalovirus (up to 439,900 copies/mL) | Outside the scope of blood culture. |
| Limitation | Could not detect Salmonella enterica or Streptococcus sanguinis (not in kit's panel) | Highlights that panel design is critical [60]. |
The Scientist's Toolkit: Essential Research Reagents and Materials
The following reagents are critical for setting up a robust and sensitive dPCR assay for pathogen detection [25] [63].
Table 3: Key research reagent solutions for dPCR assays
| Item | Function and Key Considerations |
|---|---|
| High-Purity Nucleic Acid Kit | Removes PCR inhibitors like hemoglobin, immunoglobulins, and salts from blood samples. Essential for achieving high PCR efficiency [25] [62]. |
| Hydrolysis Probes (TaqMan) | Sequence-specific probes that provide superior specificity over DNA-binding dyes, reducing false positives from nonspecific amplification [25] [63]. |
| dPCR Master Mix | Contains a DNA polymerase with 5'→3' exonuclease activity to cleave the probes. Primer concentrations are often higher (0.5–0.9 µM) than in qPCR to increase fluorescence amplitude [25]. |
| Positive & Negative Controls | Validates assay performance and monitors for contamination. Non-template controls (NTCs) are mandatory for false-positive surveillance [25]. |
| Restriction Enzymes | Used to digest complex DNA (e.g., high molecular weight gDNA, plasmids) for even partitioning and accurate quantification [25]. |
dPCR Workflow for Blood Pathogen Detection
The following diagram illustrates the key steps in the dPCR workflow for detecting pathogens directly from blood, highlighting steps critical for minimizing false positives.
Platform Comparison and Performance Data
Digital PCR (dPCR) technology enables absolute quantification of nucleic acids without a standard curve by partitioning samples into thousands of individual reactions [17]. This technical support document focuses on the Bio-Rad QX200 (droplet-based) and Qiagen QIAcuity (nanoplate-based) platforms, providing a structured comparison of their performance and troubleshooting guidance to help reduce false positives in experiments.
The table below summarizes key performance parameters from cross-platform validation studies, which are critical for experimental design and ensuring data reliability.
| Performance Parameter | Bio-Rad QX200 (ddPCR) | Qiagen QIAcuity (ndPCR) | Experimental Context & Implications |
|---|---|---|---|
| Limit of Detection (LOD) | ~0.17 copies/µL input [19] | ~0.39 copies/µL input [19] | Determined using synthetic oligonucleotides; indicates high sensitivity for both platforms. |
| Limit of Quantification (LOQ) | ~4.26 copies/µL input [19] | ~1.35 copies/µL input [19] | QIAcuity showed a lower LOQ in one study, potentially beneficial for low-target quantification. |
| Dynamic Range | Up to ~3000 copies/µL input (interpretable results) [19] | Up to ~3000 copies/µL input (interpretable results) [19] | Both platforms showed a similar dynamic range in a comparative study. |
| Precision (Coefficient of Variation) | 6% to 13% (using synthetic oligos) [19] | 7% to 11% (using synthetic oligos) [19] | Both platforms demonstrate high precision. Precision can be affected by restriction enzyme choice [19]. |
| Typical Partitions per Reaction | ~20,000 droplets (water-in-oil emulsion) [18] | 8,500 (8.5K plate) or 26,000 (26K plate) (nanoplates) [25] [64] | A higher number of partitions can improve quantification precision and dynamic range. |
| Multiplexing Capability | Limited in older models [18] | Available for 4-12 targets [18] | QIAcuity offers higher multiplexing, beneficial for complex assays and conserving sample. |
| Workflow & Hands-on Time | Multiple steps and instruments; ~6-8 hours [18] | Integrated, automated system; < 90 minutes [18] | QIAcuity's streamlined workflow reduces hands-on time and potential for user error. |
Experimental Protocols for Cross-Platform Validation
Protocol: In-House Validation of Duplex dPCR Assays
This methodology, adapted from a study on GMO quantification, provides a robust framework for validating assays on both platforms [65].
Step 1: DNA Extraction and Sample Preparation
- Extract genomic DNA from certified reference materials (CRMs) or your sample matrix using a dedicated kit (e.g., RSC PureFood GMO kit) or a CTAB-based method [65].
- Assess DNA purity. Contaminants like salts, alcohols, or proteins can impair amplification and fluorescence detection, leading to inaccurate quantification [25].
- Quantify DNA concentration using dPCR by targeting a single-copy reference gene (e.g., Lectin for soybean) to determine the exact copy number [65].
- Prepare samples at various target concentrations (e.g., 0.1%, 0.5%, 1%, 10% GM) by mixing positive and negative DNA materials based on the absolute copy number [65].
Step 2: Reaction Setup and Partitioning
- Use identical primer-probe sets for both platforms to enable direct comparison.
- For the QX200: Prepare a 20µL reaction mix and transfer it to a DG8 cartridge for droplet generation. The generator creates ~20,000 nanoliter-sized droplets [65] [18].
- For the QIAcuity: Prepare a 40µL reaction mix and load it directly into a QIAcuity Nanoplate (e.g., 26k). The instrument performs integrated partitioning into nanoscale chambers [65] [64].
Step 3: PCR Amplification
- For the QX200: Transfer the emulsion droplets to a 96-well plate and perform endpoint PCR on a thermal cycler [65].
- For the QIAcuity: Place the sealed nanoplate directly into the QIAcuity instrument, which integrates partitioning, thermocycling, and imaging [65].
- Cycling Condition Tip: Well-established qPCR assays often transfer directly to the QIAcuity without temperature adjustments. Avoid excessively long initial denaturation steps (e.g., 10 minutes at 95°C) as they can be detrimental to the polymerase in QIAcuity mixes [64].
Step 4: Data Analysis
- QX200: Read the droplets using a QX200 Droplet Reader. Analyze the data with QX Manager software, which calculates the target concentration in copies/µL via Poisson statistics [65].
- QIAcuity: The instrument automatically performs imaging and analysis using the QIAcuity Software Suite [65].
- Threshold Setting: To minimize false positives, set the fluorescence threshold high enough above the negative population defined by your No Template Control (NTC) reactions [64].
Protocol: Evaluating the Impact of Restriction Enzymes
This protocol tests a key strategy to reduce partitioning bias and improve accuracy, especially for complex templates [25] [19].
- Rationale: High-molecular-weight DNA, linked gene copies (e.g., tandem repeats), or supercoiled plasmids can partition unevenly, leading to over-quantification. Restriction digestion linearizes and fragments the DNA, ensuring more random distribution and accurate copy number estimation [25].
- Procedure:
- Prior to setting up the dPCR reaction, incubate your DNA sample with a restriction enzyme that does not cut within your amplicon sequence.
- Compare the precision (e.g., Coefficient of Variation) and quantified copy number of digested vs. non-digested samples.
- Test different enzymes (e.g., EcoRI vs. HaeIII), as the choice of enzyme can significantly impact results for some targets [19].
- Expected Outcome: A study on protist DNA found that using HaeIII instead of EcoRI drastically improved precision for the QX200, reducing CV from over 60% to below 5% in some samples [19].
Troubleshooting Guides and FAQs
Top 5 FAQs on Optimization and False Positives
Why do I see positive partitions in my No Template Control (NTC)? Is this contamination?
- Answer: Not necessarily. To diagnose, compare the fluorescence amplitude (RFU) of the positive partitions in the NTC to your true samples. If the NTC positives have the same fluorescence as true samples, it is likely contamination. If they are of much lower amplitude, random, or diffused, it is likely an assay artifact (e.g., primer-dimer) [64]. Always include NTCs to monitor for both issues.
How can I improve the separation between positive and negative partitions?
- Answer: Ensure high PCR efficiency and specificity. Use high-purity DNA templates to avoid fluorescent inhibitors [25]. For probe-based assays, check that the quencher and fluorophore are a compatible pair, as overlap can create background noise [25]. Optimize primer and probe concentrations; in dPCR, they are often higher (e.g., 0.5–0.9 µM for primers, 0.25 µM for probes) than in qPCR to increase fluorescence amplitude [25].
My quantified copy number is consistently lower than expected. What could be the cause?
- Answer: This suggests reduced amplification efficiency. For long or complex templates (e.g., high molecular weight genomic DNA, supercoiled plasmids), use restriction enzyme digestion to linearize the DNA and improve primer/probe accessibility [25]. Strongly degraded templates may also require more input DNA to achieve the desired sensitivity [25].
Do I need to re-optimize the annealing temperature when transferring a qPCR assay to dPCR?
- Answer: Usually not. Well-established qPCR assays often work on the QIAcuity without temperature adjustment [64]. However, if you observe intermediate clusters (rain) in your dPCR plot, running a fine temperature gradient (e.g., ±2.5°C around the original annealing temperature) can help resolve it [64].
Which detection chemistry (EvaGreen vs. Hydrolysis Probes) is better for reducing false positives?
- Answer: Hydrolysis probes (TaqMan) are generally more specific. They require binding to a specific sequence for a signal, making them less susceptible to false positives from non-specific amplification like primer-dimers. Use probes for multiplexing or discriminating highly homologous sequences [25] [64]. EvaGreen is a cost-effective option for simplex assays but requires high PCR specificity to avoid false signals from any amplified dsDNA [25] [64].
Advanced: Estimating Measurement Uncertainty
Accurate variance estimation is crucial for distinguishing true biological signals from technical noise, especially in applications like rare mutation detection [53].
- Challenge: Classical methods that assume a pure binomial distribution of partitions can underestimate variance because they don't account for real-world errors like pipetting variation, partition volume differences, or partition misclassification [53].
- Solution: For complex analyses (e.g., Copy Number Variation, fractional abundance), consider using more flexible statistical methods like NonPVar or BinomVar, which better handle these additional sources of error. An R Shiny app is available to facilitate the implementation of these methods [53].
The Scientist's Toolkit: Essential Reagent Solutions
The following reagents are critical for robust dPCR experiments. Proper selection and use help mitigate common issues and enhance data reliability.
| Reagent / Material | Function | Key Considerations for False Positive Reduction |
|---|---|---|
| Restriction Enzymes | Linearizes and fragments DNA templates for even partitioning [25]. | Essential for high-MW DNA, plasmids, and tandem repeats. Must not cut within the amplicon [25]. |
| High-Purity DNA Templates | The target for amplification and quantification. | Contaminants (salts, alcohols, organics) inhibit PCR and quench fluorescence, causing inaccurate reads [25]. |
| Hydrolysis Probes (TaqMan) | Sequence-specific detection chemistry. | Higher specificity than intercalating dyes; reduces false positives from non-specific amplification [25] [64]. |
| No Template Control (NTC) | Control for reagent contamination and assay artifacts. | Use to set a fluorescence threshold that excludes background noise and false positives [25] [64]. |
| Positive Control | Verifies assay performance under set conditions. | Should be in the same background matrix as samples to accurately assess inhibition and efficiency [64]. |
Implementing Uncertainty Estimation and Statistical Analysis for Robust Results
Frequently Asked Questions (FAQs)
Q1: Why are my digital PCR results inconsistent, showing high technical variation? Inconsistent results in dPCR often stem from factors that interfere with precise partitioning or amplification. Common causes include blocked microchannels in droplet-based systems, which reduce partition count, or the use of expired or contaminated reagents. Furthermore, if your template concentration is too high, it can lead to oversaturation of partitions, violating the Poisson distribution assumption. To resolve this, ensure your sample is in the "digital range" by sufficiently diluting it so that some partitions contain template and others do not. Regularly maintain your instrument to prevent blockages, and always use fresh, high-quality reagents. Incorporating a calibration control can also help identify run-to-run variability [30] [37].
Q2: How can I improve the precision of my copy number quantification, especially for targets with high copy numbers? Precision for high-copy-number targets, common in studies of microbial eukaryotes, can be significantly influenced by your choice of restriction enzyme. Research has shown that using a restriction enzyme like HaeIII, as opposed to EcoRI, can greatly improve precision. For example, in a study using the QX200 droplet digital PCR system, the coefficient of variation (CV) was reduced from over 60% with EcoRI to below 5% with HaeIII. This is particularly crucial when analyzing genes that may occur in tandem repeats, as the right enzyme improves accessibility. When planning your experiment, consider testing different restriction enzymes during assay optimization to achieve the highest possible precision [19].
Q3: My dPCR software shows a high number of false positives or negatives in my data. What could be the cause? False results in dPCR can arise from several sources. False positives are frequently caused by contamination from previous PCR products or samples. False negatives can occur due to the presence of PCR inhibitors in your sample or from poor assay optimization. To mitigate this, implement strict laboratory practices for contamination control, including using separate work areas for pre- and post-PCR steps and using UV irradiation when appropriate. If using droplet-based systems, ensure droplets are not damaged or lost. To address inhibitors, consider purifying your DNA sample further. Finally, verify that the fluorescence threshold in your analysis software is set appropriately to distinguish positive and negative partitions correctly; this may sometimes require manual adjustment [37].
Q4: What are the best methods for calculating uncertainty (like standard error) for complex dPCR applications like copy number variation? Classical methods that rely solely on the binomial distribution can sometimes inaccurately estimate standard error for dPCR data. To address this, two flexible methods, NonPVar and BinomVar, have been developed. These generic approaches are designed to provide more accurate variance calculations for dPCR, and they are particularly well-suited for complex functions of partition counts, such as copy number variation (CNV), fractional abundance, and DNA integrity. You can implement these methods using a freely available R Shiny app, which provides a graphical interface for robust uncertainty estimation [66].
The tables below summarize key performance metrics from recent dPCR studies, providing a basis for comparing platforms and methodologies.
Table 1: Comparison of dPCR Platform Sensitivity and Precision with Synthetic Oligonucleotides
| Platform | Partitioning Method | Limit of Detection (LOD) (copies/µL input) | Limit of Quantification (LOQ) (copies/µL input) | Precision (CV Range) |
|---|---|---|---|---|
| QIAcuity One (ndPCR) | Nanoplate-based | 0.39 | 1.35 | 7% - 11% |
| QX200 (ddPCR) | Droplet-based | 0.17 | 4.26 | 6% - 13% |
Data adapted from a platform comparison study [19].
Table 2: Impact of Restriction Enzyme on Precision for a High-Copy-Number Target (Paramecium tetraurelia)
| Cell Numbers | ddPCR Precision with EcoRI (CV) | ddPCR Precision with HaeIII (CV) | ndPCR Precision with EcoRI (CV) | ndPCR Precision with HaeIII (CV) |
|---|---|---|---|---|
| 50 cells | 2.5% - 62.1% | < 5% | 0.6% - 27.7% | 1.6% - 14.6% |
| 100 cells | ~5% | < 5% | ~3% | ~3% |
| 1000 cells | ~4% | < 5% | ~2% | ~2% |
Data shows that enzyme choice significantly impacts precision, especially for droplet-based systems. CV = Coefficient of Variation [19].
Experimental Protocols
Protocol 1: Evaluating Restriction Enzymes for Precision in Gene Copy Number Analysis
This protocol is designed to optimize precision when quantifying targets with potentially high or variable gene copy numbers, such as in protists or for copy number variation studies.
1. Key Research Reagent Solutions
| Item | Function/Benefit |
|---|---|
| HaeIII Restriction Enzyme | Demonstrated to improve precision, especially in ddPCR, by enhancing accessibility to tandemly repeated genes [19]. |
| EcoRI Restriction Enzyme | Serves as a common comparator; may yield lower precision for some targets compared to HaeIII [19]. |
| QIAcuity Nanoplate dPCR Kit | Reagents optimized for use with the nanoplate-based QIAcuity system [19]. |
| QX200 ddPCR EvaGreen Supermix | Reagent mix for generating water-in-oil droplets in the Bio-Rad QX200 system [19]. |
| Validated Primer/Probe Mix | Commercially validated, target-specific assays to minimize cross-reactivity and ensure specificity [67]. |
2. Methodology
- Sample Preparation: Use DNA extracted from a known number of cells (e.g., Paramecium tetraurelia) or synthetic oligonucleotides. Prepare a dilution series covering the expected concentration dynamic range [19].
- Restriction Digestion: Split each DNA sample into two aliquots. Digest one aliquot with HaeIII and the other with EcoRI, following the manufacturer's recommended protocol [19].
- dPCR Setup: For each digested sample, prepare the dPCR reaction mix according to your platform's specifications (e.g., QIAcuity or QX200). Include the appropriate restriction enzyme in the reaction mix if required [19].
- Partitioning and Amplification: Load the samples onto the dPCR instrument. Perform partitioning and run the endpoint PCR protocol with cycling conditions optimized for your assay [67] [19].
- Data Analysis: Use the instrument's software (e.g., QIAcuity Suite) to calculate the absolute copy number and the coefficient of variation (CV) across replicates for each condition (HaeIII vs. EcoRI). Compare the CVs to determine which enzyme provides superior precision for your specific target [19].
Protocol 2: Implementing Flexible Uncertainty Estimation Methods
This protocol outlines how to apply the NonPVar and BinomVar methods for robust variance estimation in complex dPCR analyses.
1. Methodology
- Data Collection: Perform your dPCR experiment as usual, ensuring you record the raw partition counts (positive and negative) for all replicates and conditions [66].
- Method Selection: Choose between the two flexible methods. NonPVar and BinomVar are generic approaches designed to be more accurate than classical binomial-assumption methods for estimating standard error and confidence intervals, especially for derived quantities like CNV [66].
- Implementation via R Shiny App: Use the provided free R Shiny app to analyze your data.
- Input your raw partition data into the app.
- Select the desired analysis function (e.g., CNV, fractional abundance).
- The app will compute the target concentration, its variance, and confidence intervals using the selected robust method [66].
- Interpretation: Use the calculated standard errors and confidence intervals to report the uncertainty of your measurements. This provides a more transparent and reliable foundation for your biological conclusions [66].
Workflow Visualization
dPCR Uncertainty Analysis Workflow
Reducing False Positives and Negatives
Conclusion
Reducing false positives in digital PCR requires a holistic approach that spans from initial sample handling to final data analysis. By understanding foundational causes like sample preparation artifacts and contamination, implementing methodologically sound workflows, applying rigorous troubleshooting, and conducting thorough assay validation, researchers can fully leverage dPCR's unparalleled sensitivity and precision. The future of dPCR in biomedical and clinical research, particularly in liquid biopsy, minimal residual disease monitoring, and low-abundance pathogen detection, depends on this commitment to data quality. As the technology evolves with higher multiplexing capabilities and improved statistical tools, the strategies outlined here will form the bedrock of reliable, clinically-actionable results.
References
- 1. False Positive Results With SARS-CoV-2 RT-PCR Tests and How to Evaluate a RT-PCR-Positive Test for the Possibility of a False Positive Result - PMC [https://pmc.ncbi.nlm.nih.gov/articles/PMC7934325/]
- 2. More less-frequently asked questions on dPCR [https://www.qiagen.com/us/knowledge-and-support/knowledge-hub/science-matters/pcr-solutions/more-less-frequently-asked-questions-on-dpcr]
- 3. PCR Troubleshooting Guide | Thermo Fisher Scientific - US [https://www.thermofisher.com/us/en/home/life-science/cloning/cloning-learning-center/invitrogen-school-of-molecular-biology/pcr-education/pcr-reagents-enzymes/pcr-troubleshooting.html]
- 4. Guidelines for 6-color multiplex assay design for optimized ... [https://www.stillatechnologies.com/digital-pcr/naica-system-analysis/guidelines-for-6-color-multiplex-assay-design-for-optimized-performance-with-crystal-digital-pcr/]
- 5. What Does It Take to Trust Your Digital PCR Data? | Lab Manager [https://www.labmanager.com/what-does-it-take-to-trust-your-digital-pcr-data-29630]
- 6. Three-color crystal digital PCR - PMC [https://pmc.ncbi.nlm.nih.gov/articles/PMC5154636/]
- 7. Reducing False Positive Mutation Detection in Digital PCR ... [https://www.thermofisher.com/blog/behindthebench/reducing-false-positive-mutation-detection-in-digital-pcr-with-a-chip-based-workflow/]
- 8. Detection of Low-Frequency Mutations and Identification ... [https://pmc.ncbi.nlm.nih.gov/articles/PMC6337315/]
- 9. How Proper Digital PCR Techniques Helps DNA Preparation [https://www.stillatechnologies.com/digital-pcr/primer-design/digital-pcr-technique/]
- 10. Digital PCR Analysis for Mitochondrial DNA Integrity and ... [https://www.protocols.io/view/digital-pcr-analysis-for-mitochondrial-dna-integri-hdvvb2667.html]
- 11. Strategies for the evaluation of DNA damage and repair ... [https://pmc.ncbi.nlm.nih.gov/articles/PMC5452911/]
- 12. Heat Stress-Induced DNA Damage - PMC [https://pmc.ncbi.nlm.nih.gov/articles/PMC4947990/]
- 13. Preventing PCR Amplification Carryover Contamination in ... [https://www.annclinlabsci.org/content/34/4/389.long]
- 14. Carryover Contamination-Controlled Amplicon Sequencing ... [https://pmc.ncbi.nlm.nih.gov/articles/PMC10269707/]
- 15. Avoiding Contamination | Thermo Fisher Scientific - ES [https://www.thermofisher.com/us/en/home/life-science/pcr/real-time-pcr/real-time-pcr-learning-center/real-time-pcr-basics/good-laboratory-practice-avoid-contamination-qpcr-experiments.html]
- 16. How to prevent PCR contamination [https://www.minipcr.com/how-to-prevent-pcr-contamination/]
- 17. Digital PCR: from early developments to its future application ... [https://pubs.rsc.org/en/content/articlehtml/2025/lc/d5lc00055f]
- 18. dPCR vs. ddPCR: Why Precision Matters in Cell and Gene ... [https://www.roslinct.com/insights/dpcr-vs-ddpcr/]
- 19. Comparing the precision of two digital PCR applications for ... [https://www.nature.com/articles/s41598-025-13143-8]
- 20. Digital PCR outperforms quantitative real-time PCR for the ... [https://pmc.ncbi.nlm.nih.gov/articles/PMC12288185/]
- 21. When to Choose Quantitative PCR vs Digital PCR [https://kcasbio.com/blogs/quantitative-pcr-vs-digital-pcr-choosing-the-right-platform-for-bioanalysis/]
- 22. PCR Troubleshooting: Common Problems and Solutions [https://www.mybiosource.com/learn/pcr-troubleshooting-common-problems-and-solutions/]
- 23. In-house validation of a droplet digital PCR system using a ... [https://www.sciencedirect.com/science/article/pii/S0003267025005665]
- 24. Improving Quantitative Power in Digital PCR through ... [https://pmc.ncbi.nlm.nih.gov/articles/PMC7269394/]
- 25. dPCR assay development | Digital PCR troubleshooting [https://www.qiagen.com/us/applications/digital-pcr/beginners/dpcr-guide/setup-and-troubleshooting]
- 26. Avoiding false positives with PCR | IDT [https://www.idtdna.com/page/support-and-education/decoded-plus/how-to-avoid-false-positives-in-pcr-and-what-to-do-if-you-get-them/]
- 27. Design, validation, and implementation of multiplex digital ... [https://pubmed.ncbi.nlm.nih.gov/39701810]
- 28. Guidelines for 3-color multiplex assay design for optimized ... [https://www.stillatechnologies.com/digital-pcr/naica-system-analysis/guidelines-for-3-color-multiplex-assay-design-for-optimized-performance-with-crystal-digital-pcr/]
- 29. Chip-Based Digital PCR with Large-Field One-Shot ... [https://www.sciencedirect.com/science/article/abs/pii/S0956566325002556]
- 30. Digital PCR Support—Troubleshooting [https://www.thermofisher.com/us/en/home/technical-resources/technical-reference-library/real-time-digital-PCR-applications-support-center/digital-pcr-support/digital-pcr-support-troubleshooting.html]
- 31. Avoiding false positives with PCR | IDT [https://www.eu.idtdna.com/page/support-and-education/decoded-plus/how-to-avoid-false-positives-in-pcr-and-what-to-do-if-you-get-them/]
- 32. Troubleshooting Common Issues with Restriction Digestion ... [https://www.thermofisher.com/us/en/home/brands/thermo-scientific/molecular-biology/molecular-biology-learning-center/molecular-biology-resource-library/spotlight-articles/7-common-issues-with-restriction-digestion-reactions-and-how-to-avoid-them.html]
- 33. Using ddPCR to assess the DNA yield of FFPE samples [https://pmc.ncbi.nlm.nih.gov/articles/PMC6287546/]
- 34. Robust analysis of allele-specific copy number alterations ... [https://www.nature.com/articles/s41467-024-51026-0]
- 35. Detection of rare mutations, copy number alterations, and ... [https://pmc.ncbi.nlm.nih.gov/articles/PMC10104560/]
- 36. Comparison of digital PCR methods [https://www.qiagen.com/us/knowledge-and-support/knowledge-hub/bench-guide/pcr/digital-pcr/comparison-of-digital-pcr-methods]
- 37. Understand and Troubleshoot PCR with The BitesizeBio ... [https://bitesizebio.com/21840/understand-and-troubleshoot-pcr-with-the-bitesizebio-guide-to-pcr/]
- 38. Fundamentals of multiplexing with digital PCR - PMC [https://pmc.ncbi.nlm.nih.gov/articles/PMC5154634/]
- 39. Multiplexed, universal probe-based rare variant detection ... [https://www.nature.com/articles/s41598-025-08814-5]
- 40. Guide to multiplexing dPCR assays [https://www.qiagen.com/us/applications/digital-pcr/beginners/dpcr-multiplexing]
- 41. Amplification of the No Template Control (NTC) [https://www.thermofisher.com/us/en/home/life-science/pcr/real-time-pcr/real-time-pcr-learning-center/real-time-pcr-basics/real-time-pcr-troubleshooting-tool/gene-expression-quantitation-troubleshooting/amplification-no-template-control.html]
- 42. Tips for successful PCR and Troubleshooting PCR-qPCR [https://info.abmgood.com/polymerase-chain-reaction-pcr-qpcr-troubleshooting]
- 43. How to Avoid Contamination in Your qPCR Experiments [https://rheniumbio.co.il/how-to-avoid-contamination-in-your-qpcr-experiments/]
- 44. PCR controls [https://www.qiagen.com/us/knowledge-and-support/knowledge-hub/bench-guide/pcr/reference-genes-and-controls/pcr-controls]
- 45. A simple modification of PCR thermal profile applied to ... [https://pmc.ncbi.nlm.nih.gov/articles/PMC4963435/]
- 46. Cleaning protocols in forensic genetic laboratories [https://link.springer.com/article/10.1007/s00414-024-03232-0]
- 47. Could your PCR be affected by contamination? | IDT [https://www.idtdna.com/page/support-and-education/decoded-plus/could-your-pcr-be-affected-by-contamination/]
- 48. Minimize False Positives from PCR [https://www.thermofisher.com/us/en/home/references/ambion-tech-support/rtpcr-analysis/tech-notes/minimize-false-positives-from-pcr.html]
- 49. Benchmarking digital PCR partition classification methods ... [https://pmc.ncbi.nlm.nih.gov/articles/PMC10981767/]
- 50. Contamination and Sensitivity Issues with a Real-Time ... [https://pmc.ncbi.nlm.nih.gov/articles/PMC86577/]
- 51. Development and validation of a droplet digital PCR assay ... [https://www.frontiersin.org/journals/plant-science/articles/10.3389/fpls.2025.1573949/full]
- 52. Validation of a High-Sensitivity Assay for Detection of ... [https://pmc.ncbi.nlm.nih.gov/articles/PMC10488325/]
- 53. Flexible methods for uncertainty estimation of digital PCR data [https://pmc.ncbi.nlm.nih.gov/articles/PMC11914197/]
- 54. Digital PCR Applications: Copy Number Variation [https://www.thermofisher.com/us/en/home/life-science/pcr/digital-pcr/education/basic-research/copy-number-variation.html]
- 55. Full text of " Comparison of microfluidic digital PCR and conventional..." [https://archive.org/stream/pubmed-PMC3367212/PMC3367212-gks203_djvu.txt]
- 56. Real-Time vs Digital vs Traditional PCR [https://www.thermofisher.com/lc/en/home/life-science/pcr/real-time-pcr/qpcr-education/qpcr-vs-digital-pcr-vs-traditional-pcr.html]
- 57. Digital PCR Analysis Vs . Real-Time Quantiative PCR ( qPCR ) [https://www.nebiolab.com/digital-pcr-dpcr-vs-real-time-quantitative-pcr-for-multiplex-copy-number-analysis/]
- 58. dPCR vs qPCR [https://www.qiagen.com/us/applications/digital-pcr/beginners/dpcr-vs-qpcr]
- 59. Top questions from our CNV analysis by digital PCR webinar [https://www.qiagen.com/us/knowledge-and-support/knowledge-hub/science-matters/pcr-solutions/cnv-analysis-by-digital-pcr-webinar]
- 60. Comparative analysis between digital PCR and blood ... [https://www.frontiersin.org/journals/medicine/articles/10.3389/fmed.2025.1615409/full]
- 61. Comparative analysis between digital PCR and blood ... [https://pmc.ncbi.nlm.nih.gov/articles/PMC12515817/]
- 62. Direct-from-Blood Detection of Pathogens - PubMed Central [https://pmc.ncbi.nlm.nih.gov/articles/PMC10358183/]
- 63. Digital PCR - a simple guide, tips & tricks [https://www.lubio.ch/blog/dpcr-guide]
- 64. Top 10 FAQs on optimizing dPCR assays on the QIAcuity [https://www.qiagen.com/us/knowledge-and-support/knowledge-hub/science-matters/pcr-solutions/top-10-most-frequently-asked-questions-about-digital-pcr-assay-optimization-on-the-qiacuity]
- 65. Comparison of two digital PCR platforms for quantification ... [https://pmc.ncbi.nlm.nih.gov/articles/PMC12622311/]
- 66. Flexible methods for uncertainty estimation of digital PCR ... [https://www.sciencedirect.com/science/article/pii/S2589004225000318]
- 67. Comparative Performance of Digital PCR and Real-Time RT ... [https://pmc.ncbi.nlm.nih.gov/articles/PMC12474457/]